

Sensitivity of the 1002 Area to disturbance by seismic operations
Letting the data tell the story
In 2010 I was invited by the Fish and Wildlife Service to attend the 50th anniversary celebration of the Arctic National Wildlife Refuge at a retreat center on the east coast. It was a big enough hoo-hah that President Jimmy Carter showed up and gave a speech.
I didn’t know too much about Carter at the time or his direct experiences with ANWR, but it was the most memorable speech by a politician I’ve ever heard. He spoke humbly and authentically about his visits to the 1002 Area and how he looked at maps of Alaska more during his tenure than any other state. The enlargement of the Refuge and the creation of the Wilderness within it were labors of love for him, at a time Alaskans were burning him in effigy for Federal overreach and when the Iran hostage situation was keeping him awake at night.
The main thing I’ll never forget him saying though was in regards to the creation of the 1002 Area. His primary opponent in all things Alaska was our State’s Senator Ted Stevens. Carter explained that in order to get ANILCA and the Refuge expansion passed, he had to concede one thing to Stevens and that was Section 1002 of ANILCA – that the region outlined there could not be included within the new official Wilderness being created and had to be left open for oil and gas exploration. It was a lot for Carter to stomach. But then he realized that in order to actually open the area for this purpose both houses of Congress and the President had to agree to it. As Carter explained, “Based on my experiences, the likelihood of that was zero, so I gave Stevens what he wanted without feeling I had lost anything”.
Olaus and Mardy Murie, George Collins, Lowell Sumner, Celia Hunter, Jimmy Carter – these individuals and others fought for the protection of this place and did so successfully. Why? Who knows why people really do anything, but at some level each recognized and marveled at life on the edge of existence here. They saw this place not as the frozen wasteland that many describe it as but rather for the subtly of the ecological dynamics at work – all of the in-your-face ecological dynamics of Amazon rainforest were still occurring here, you just had to look for it.
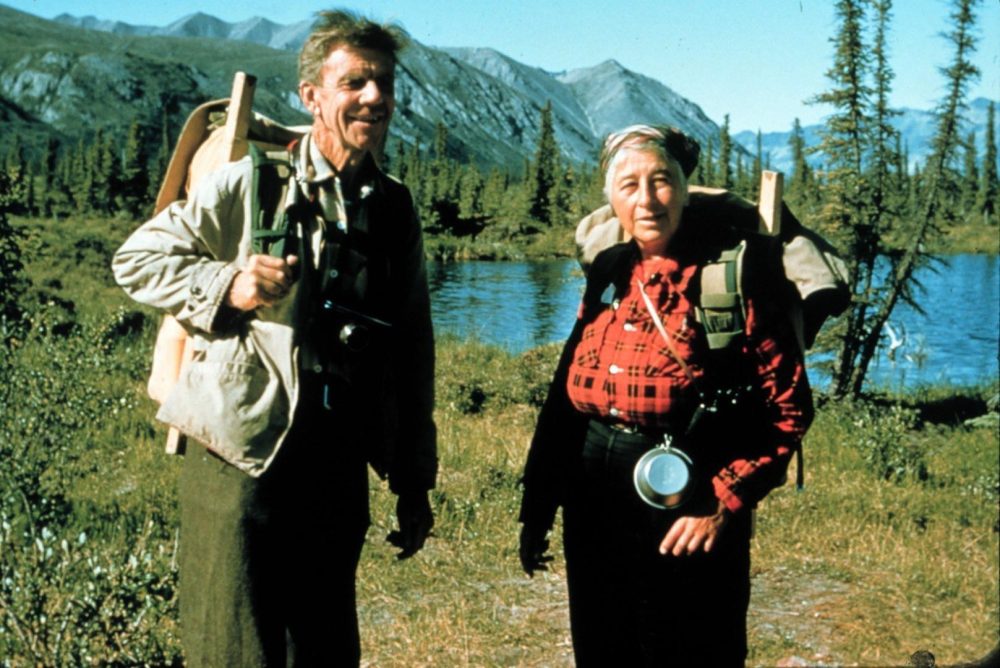
Olaus and Mardy Murie spent the months of consistent effort over the years it takes to understand the nuance of the dynamics of landscape, which once seen cannot be unseen.
I think this is why they were so successful in their goals – through experience, they learned to look for those subtle dynamics that escaped the casual observer, and it was this understanding that drove them to protect these lands so those dynamics could continue underdisturbed. They looked for the data to tell them the story. Ultimately they recognized that there was a fragile system at work here that involved climate, ice, plants, caribou and hundreds of other players all eking out an existence. Change one thing and it affects all the others.
I don’t pretend to know what all those things are and how each affects all the others, but I do know a lot about a few of those things and can readily imagine some of those relationships.
In this blog, I repeat the tales told to me by data collected over a four year period (2018-2022) on a landscape that has changed more in those four years than probably the four hundred before it.
I tell this tale because I want you to you to recognize and marvel at the subtle ecological dynamics of this landscape so that you can be more successful in protecting it. I would like your understanding to compel you towards finding your role in allowing these dynamics to continue undisturbed.
The take home message here is that we’ve missed our chance for conducting seismic measurements as business-as-usual – the protective measures that may have worked here 10 years now most certainly will not now because those subtle dynamics are leaving the subtle stage and entering the in-your-face Amazon stage. The ground here is thawing and subsiding, the surface is becoming connected by streams which did not exist a decade ago, and the plant ecology is rapidly changing because of it. Yes, you still have to look closely, but you don’t have to look for long.
As a scientist that has spent over 30 years studying the impacts of climate change on the physical landscape of Alaska, mostly here, what’s going on now in the 1002 Area is a dream come true. So much change! So easy to find if I just spend a moment to look! Far from being depressing, to witness geomorphology in action like this is exhilarating – I don’t have wait another 30 years to see if a prediction comes true, the changes are occurring so fast that I can make predictions today and test them tomorrow.
I want you to share in this excitement. I want you to understand how this landscape and its ecology are responding to climate warming here. I want to help you become an expert in permafrost dynamics so that you will understand what it is you are trying to protect. I want you to learn how to let the data speak to you. And I want you to understand how seismic operations here may accelerate the changes here beyond the rate at which all the others things, like caribou, can adapt.
Introduction
In 2018 I mapped the entire 1002 Area because I wanted to make a “before” map so that we could disentangle the impacts of seismic work that winter from the background changes due to climate. Seismic still hasn’t happened but others mapped much of this area again in 2022. This blog shares some of the results I’ve found by comparing those two maps, but the biggest result that I’ve learned is that we need yet another “before” map because the changes occurring here are that rapid!
The first blog in the series provides the contextual background for these changes, centering around a 2022 peer reviewed paper that described a 10 year field study (2008-2018) in the heart of the 1002 Area that documented that climate warming was thawing ice wedges at an unprecedented rate, which in turn was rapidly changing surface hydrology, which in turn was rapidly transforming plant ecology such that 8% of forage species that calving caribou prefer had already been lost permanently. That blog then abstracts these dynamics to describe why the 1002 Area has a fundamentally different sensitivity to disturbance by seismic vehicles than existing oil fields because it is the only coastal region in Arctic Alaska where that sensitivity is controlled by hillslope processes. That is, it is the slope of this hilly landscape that makes it more vulnerable to disturbance, whether driven by climate or oil exploration, because water-filled depression on flat ground are just localized puddles but water-filled depressions on sloping ground become streams and rivers that connect huge areas. Photographs, conceptual models, and cartoon illustrations describe the central player in these dynamics — ice wedges — and the mechanisms of their formation and melt as they relate to current terrain sensitivity. In short, imposing a 200 m x 200 m grid of depressions 10-40 cm deep on a sloping landscape that is already undergoing a rapid transformation in hydrology due to the formation of depressions only 10-60 cm deep on top of thawing ice wedges has the potential to create linear, efficient hydrologic pathways that not only reroute water within them but also draw water from the interior of the grids. And given that the interior of the grids would be equally affected, this means plant ecology of the entire 1002 Area would also be affected to point where the Porcupine Caribou Herd’s population and migration habits would also be affected, on a time-scale of only a few years after seismic operations are completed. It’s not necessary to read that blog first, but it will provide theory and context useful for understanding the changes I describe here.
In this second blog, I document that the changes found in that field study are occurring pervasively throughout the 1002 Area by comparing topographic maps at a resolution sufficient to track the thaw of individual ice wedges. These data tell the story of how rapidly the landscape changed from 2018-2022 which speaks directly to its sensitivity to disturbance by seismic vehicles — if climate warming alone is causing a massive reorganization of the surface hydrology because of the formation of depressions only 10-60 cm deep on top of thawing ice wedges then imposing a 200 m x 200 m grid of 10-40 cm deep tire ruts will certainly accelerate that hydrologic reorganization further.
So here I get down into the weeds, figuratively and scientifically. Using the figures and captions below, I try to give a flavor of how sensitive the lakes, rivers, streams, and coastlines are to disturbance by seismic operations by revealing how sensitive they are to recent climate warming. Here I am only pulling out a few examples for each theme — this blog was abstracted from a ~500 page report I submitted to BLM on these issues in which you can find many more examples and additional rigor describing them.
But you don’t need to understand any of that to understand the Conclusions because my conclusions are nothing more than common sense – the basics of what’s necessary for any development here to be considered responsible. In short, due to the terrain sensitivities I describe here, ecological protections for seismic operations must be taken as seriously by regulators as protections for infrastructure development, but they currently are not. For example, the regulations limit operators from draining more than 30% of a lake’s volume to build ice roads but say nothing about how the rut of a seismic vehicle could cause the complete drainage of that lake. Or, infrastructure is prohibited within a mile of the major rivers but it says nothing about driving heavy seismic vehicles up and down their banks. Or, tons of ecological studies on birds, caribou, and plants are required before a building permit can be approved, but no studies at all (including the ones I’ve described here and in the next blog) are required prior to seismic operations. Given that infrastructure is limited to only 1200 acres but seismic is planned over 1.5M acres, I advocate in these blogs that this is a major oversight with potentially devastating consequences to the ecology and caribou of the 1002 Area.
The third blog in this series asks: What does responsible development look like here and what can we do to prevent irresponsible development? The guiding legislation and regulations make no mention of the sensitivities of this terrain to disturbance by seismic vehicles and have not put science to work at all to develop sufficient protection protocols despite the fact that the scientific tools needed to do so have been available for a decade. So in that blog I describe the types of studies that need to be completed and give examples of my work along these lines to demonstrate how easily they can be done. I also give my recommendations to improve the regulations.
Airborne Data Background
Here I give a brief introduction to the data sets I used, how I used them, and how I visualized the results. A much more complete description can be found in this report and the references therein.
To assess changes in topography, I compared to two data sets: a fodar map that I acquired in 2018 and a lidar map acquired in 2022 by a combination of USGS, USFWS, and UAF. The fodar topographic map has a 25 cm posting and the USGS map has 50 cm; both have a precision in the 10-20 cm range. To assess change, I simply subtracted one topographic map from the other. However, both data sets in their current forms have some challenges that prevent simply subtracting one map from another entirely, so in this preliminary analysis I worked in small sections such that any co-registration issues could be resolved within that section independently of others along several transects. Further, non-topographic changes in year and seasonality (eg, plant growth) are on the level of 10-20 cm, as well as differences in snow cover that could be as much as 3 m in some places, so here I took care to focus on changes over 30 cm unrelated to snow cover to avoid mischaracterize spurious change. In a final analysis I believe changes of ~10 cm can reliably be found throughout the entire region.
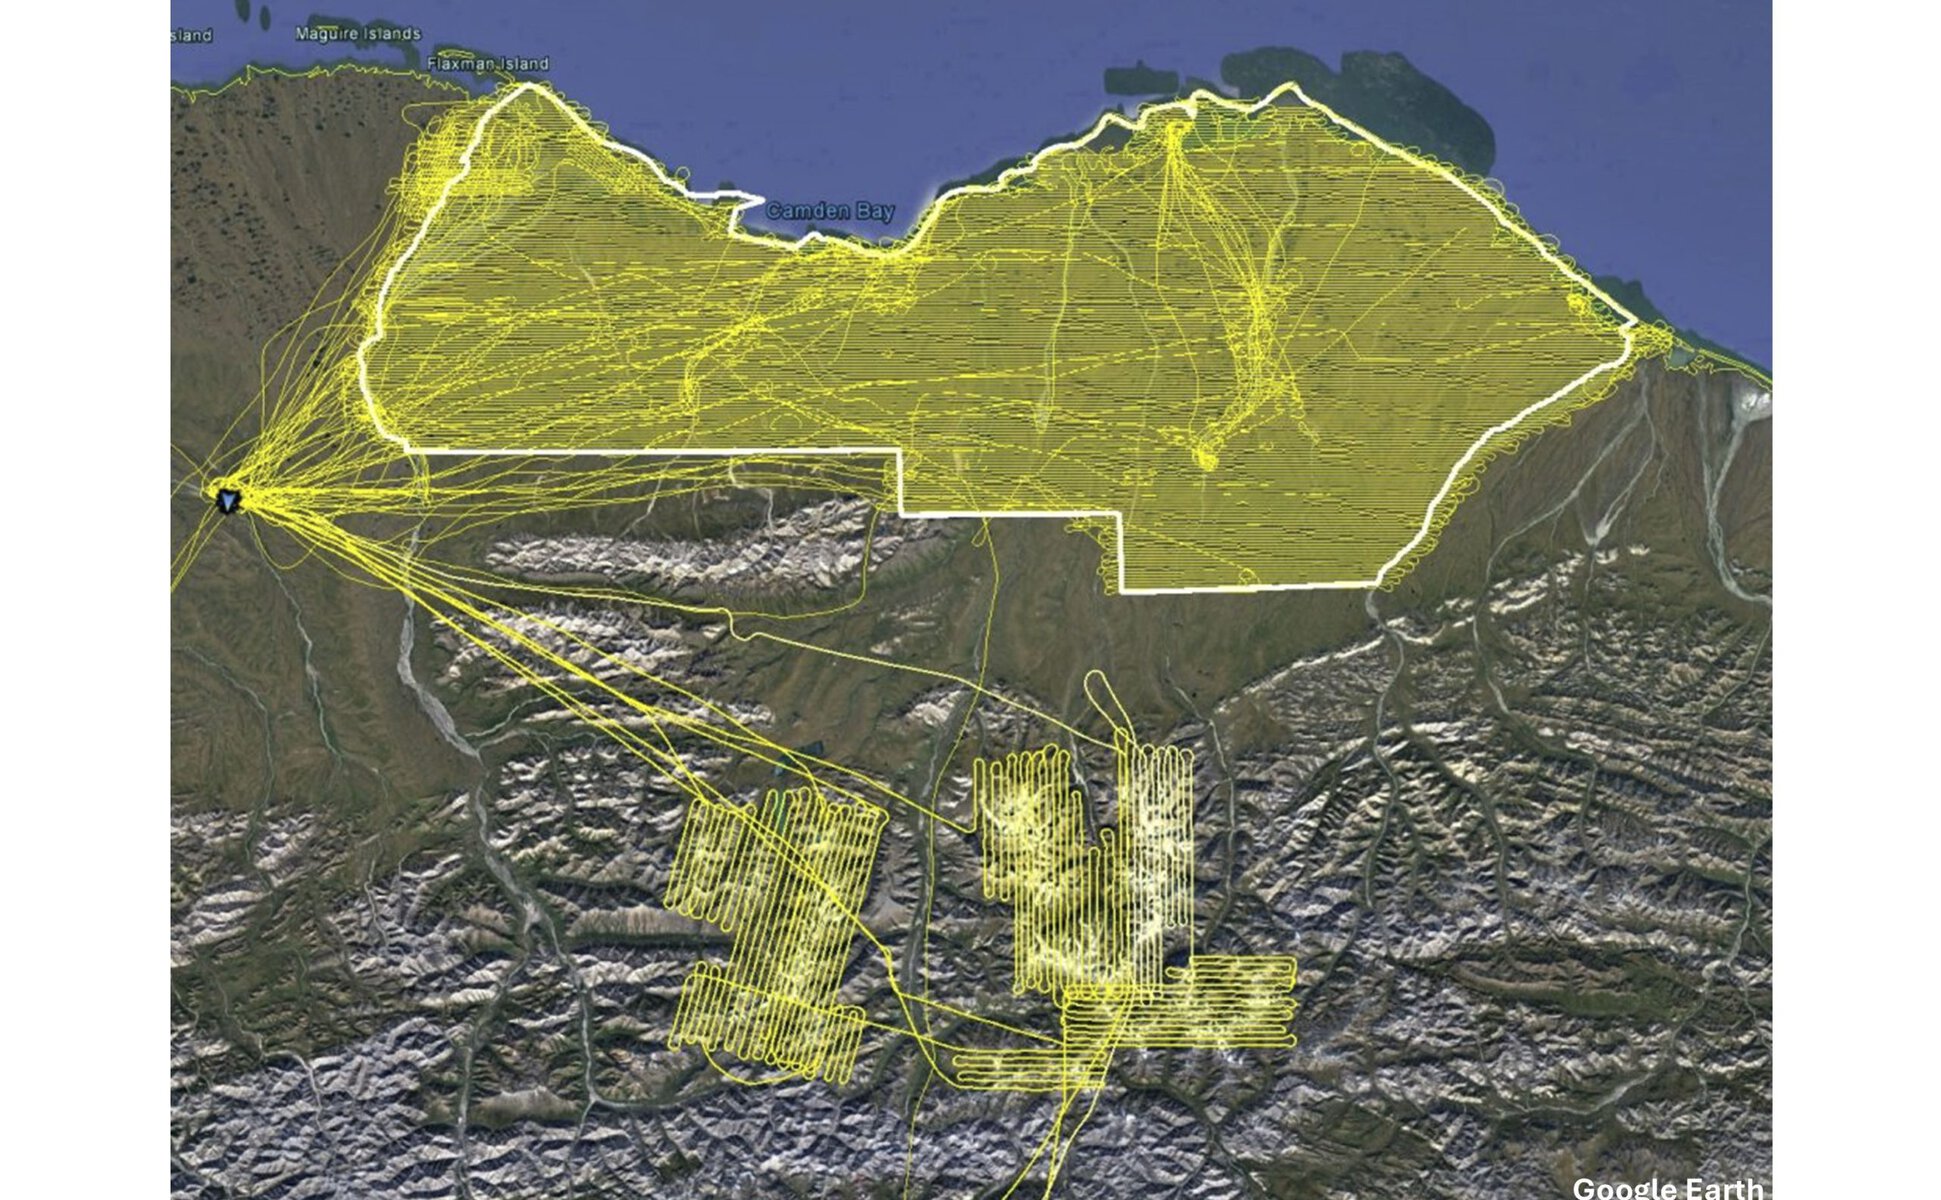
In 2018, I mapped the entire 1002 Area (white outline) of the Arctic National Wildlife Refuge. The yellow lines show my flight paths for the project, including mapping nearly all of the north-draining glaciers in the mountains to the south. You can learn more about these efforts and data here.
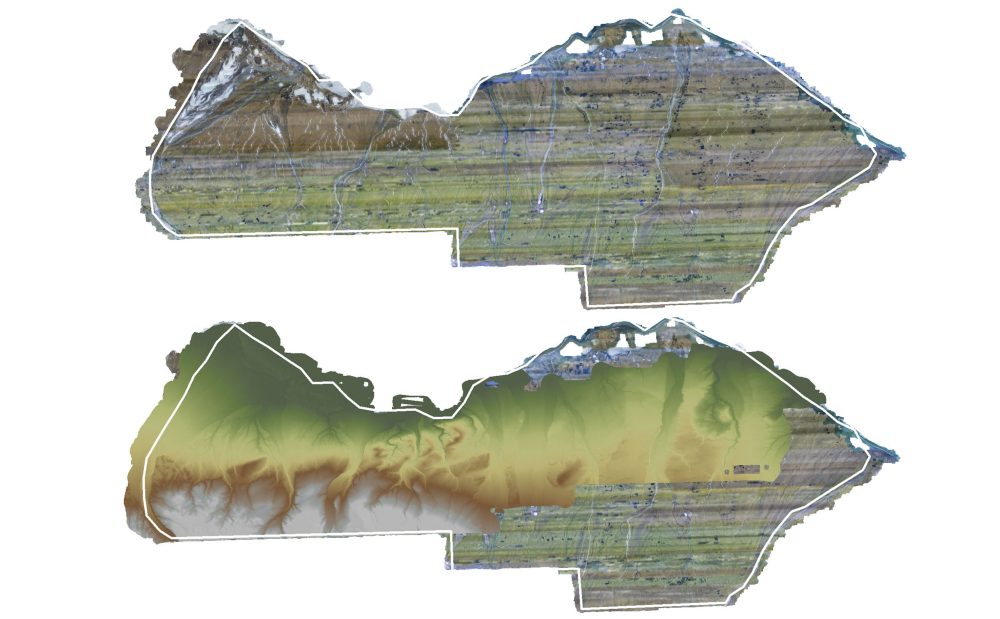
I compared my 2018 fodar data to lidar data acquired in 2022. As lidar does not acquire image data, here I have superimposed the lidar topography (colored by earth tones) on top of my fodar image.
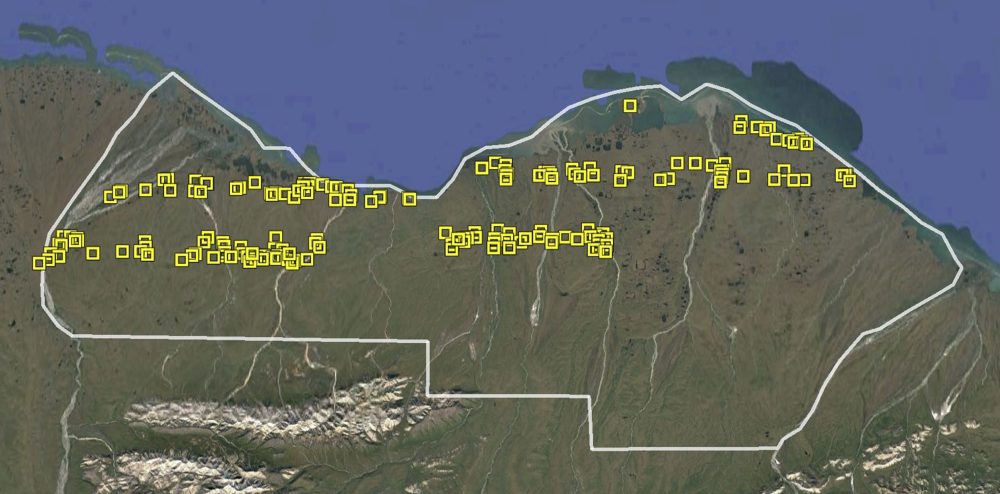
In this preliminary analysis, I selected several transects to study than spanned the width of the 1002 Area. I focussed on about 175 locations within these transects (yellow squares). Only some of them are presented in this blog, but they can all be found in the full report.
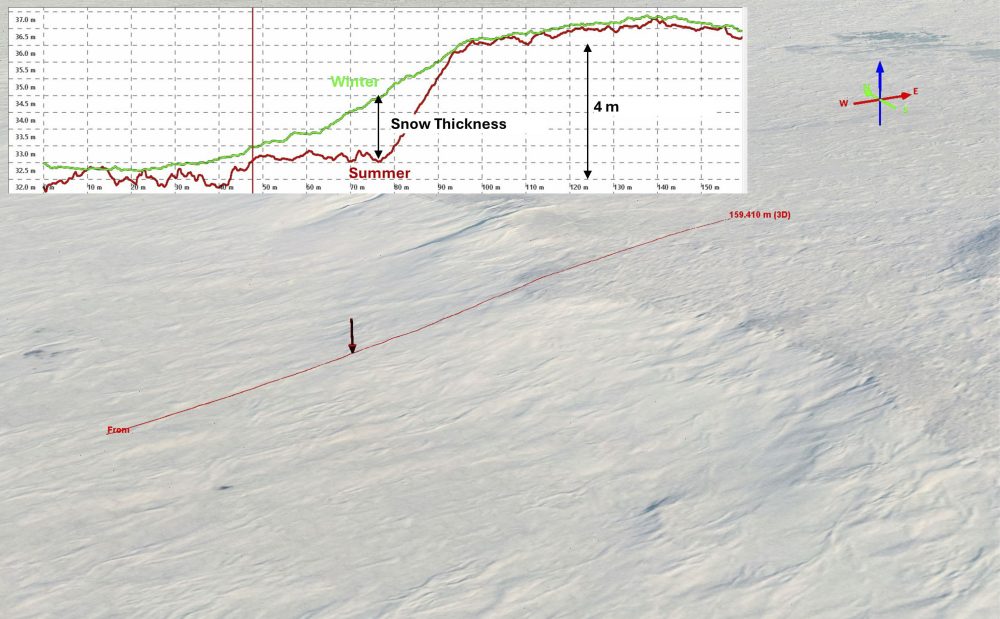
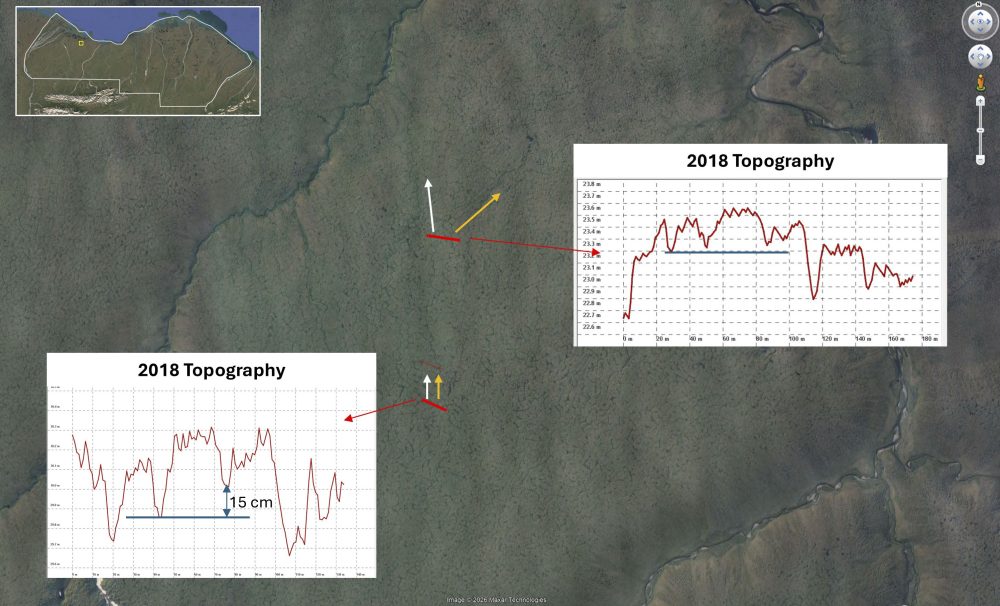
Here is an example of the type of topographic change detection I used here. In this example, to give a better visual sense I’m comparing two fodar maps here — summer and winter — because lidar does not produce an associated image. The perspective here is in 3D — fodar produces a digital topographic map and a perfectly co-registered orthoimage which can be manipulate in 3D like in Google Earth. The difference between the two topographic maps here is due to snow. The red line is a transect from which the plot of elevation are made — the difference between the two line is snow thickness, which is a couple of meters here. Fodar can be used to measure thin arctic snow packs over huge areas, as demonstrated in this project and as accurately as ground probing as demonstrated in this paper. This example demonstrates change detection of snow cover using a summer and winter map, but measuring ground subsidence using two summer maps works in exactly the same way, as seen in the dozens of examples in this blog.
[before-after label_one="2018 Fodar" label_two="Elevation Change"]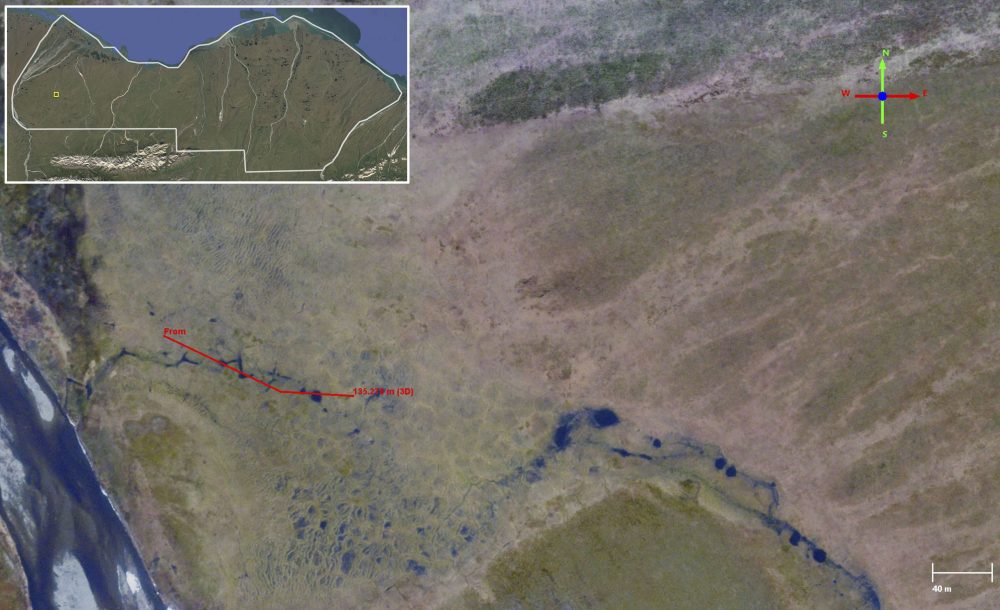
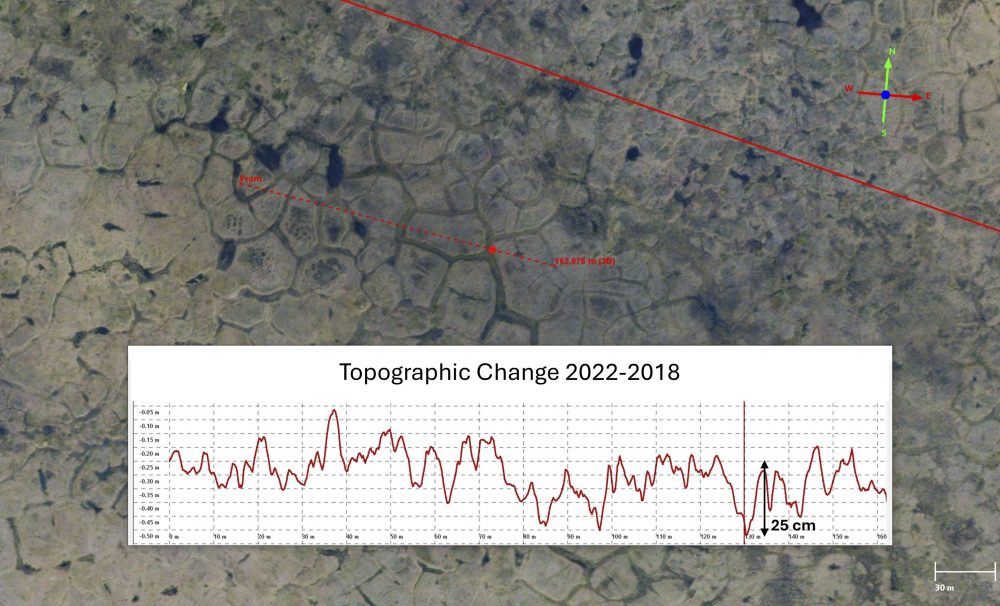
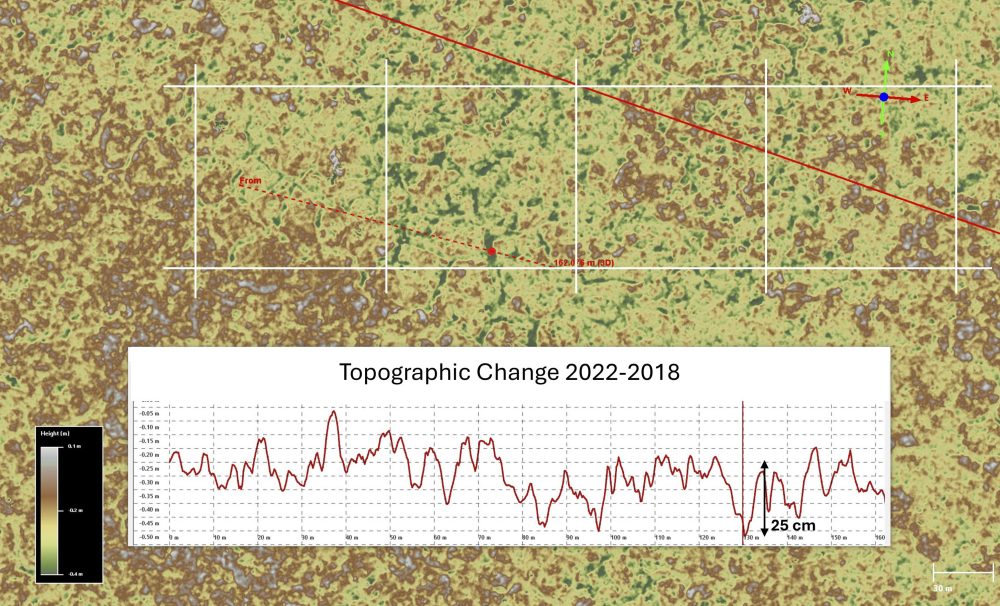
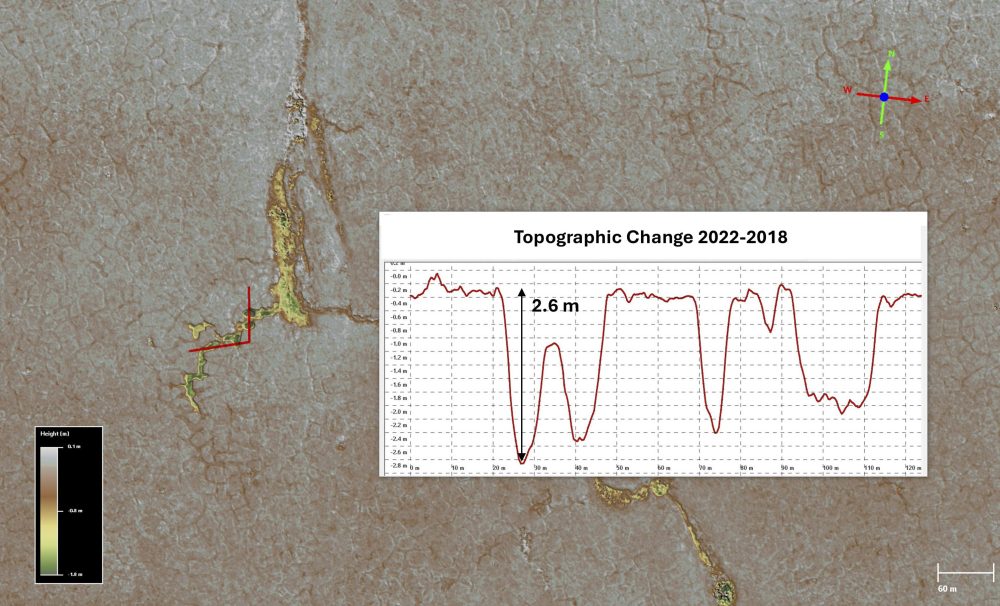
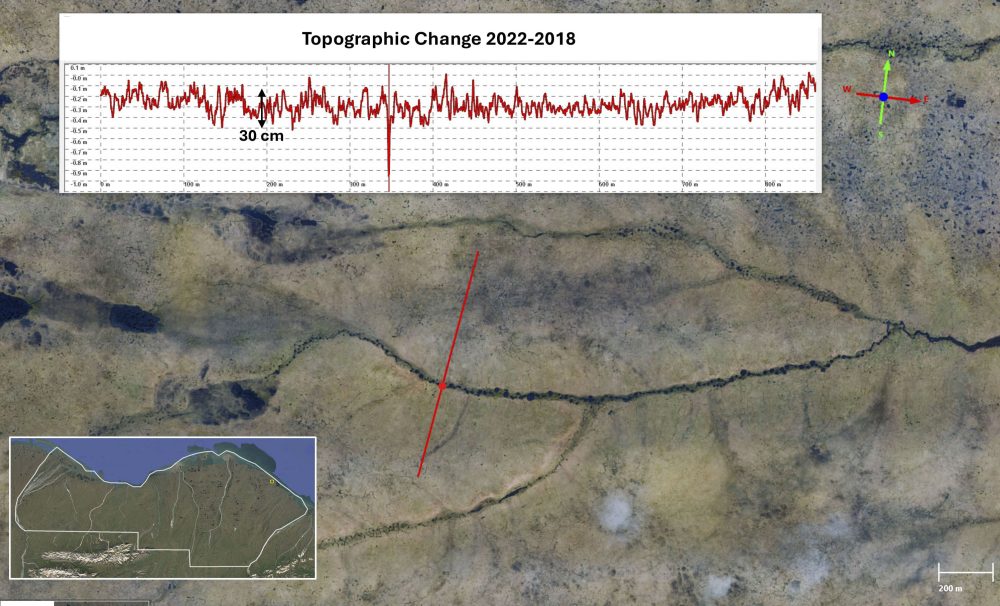
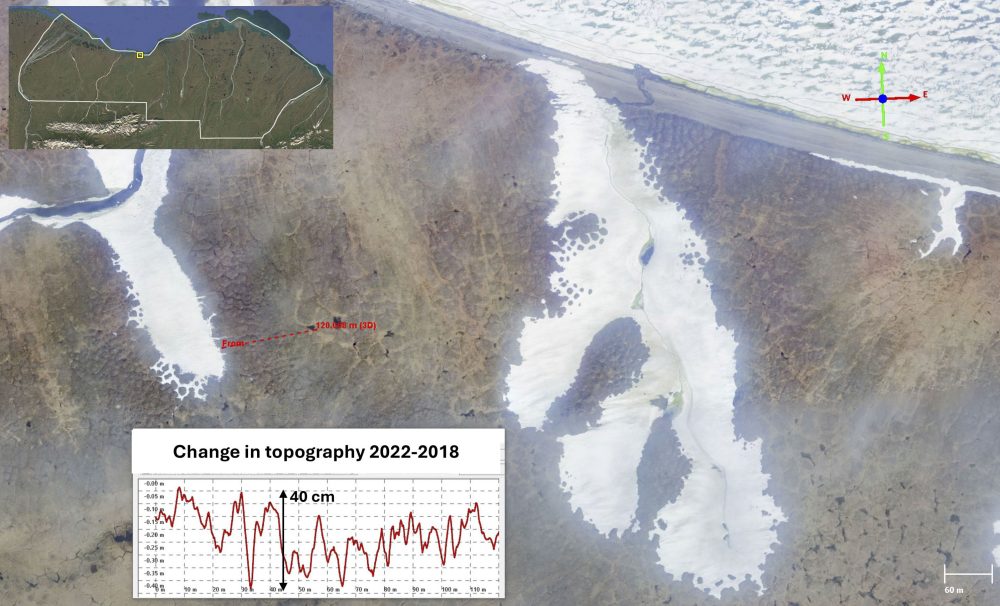
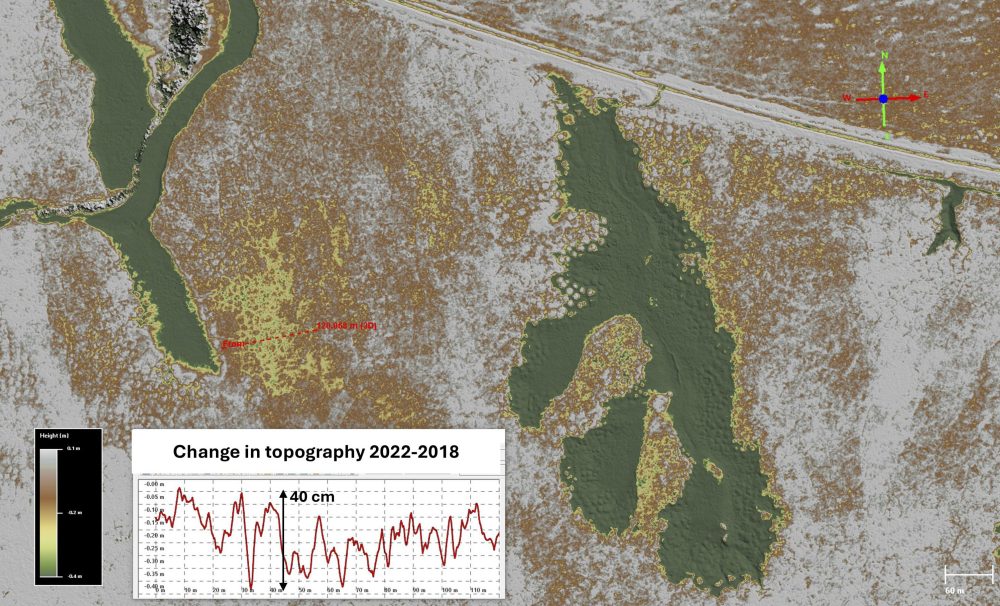
Here is an example of topographic change between 2018 and 2022 in the format typical for this blog. At left is the fodar image from 2018, seen with an inset location within the 1002 Area in upper left, a compass at upper right, and a scale bar at lower right. At right is the topographic difference map made by subtracting the 2018 fodar from the 2022 lidar, colorized with earth tones. The color bar is at lower left in that image, with yellow/browns showing the least change, yellows to greens showing elevation decrease, and whites showing increase. The colors are arbitrary and vary between examples below to highlight individual differences. As can be seen in the 2018 image, beneath the red transect line the depressions caused by melting ice wedges were filled with water (black puddles) in 2018. Because these small water bodies are on a slope, when enough of them link up the water begins to flow downhill, seen here as flowing the left into a river. The small stream that results causes thermal erosion of the remaining ice within the wedges that had started to melt, causing the trough to melt deeper and gather more water from its surroundings due to the increase in slope. This increase in flow feedbacks to cause both more thermal erosion of the ice and mechanical erosion of the polygons surrounding them. This positive feedback continues until the ice is melted completely or the stream runs out of new watershed area to make itself larger, or both. By 2022, this processed had made channels 50-80 cm deep and washed away entire polygons, as well as their associated vegetation; the inset elevation profile shows the extent of this erosion numerically. Comparing the difference map to the 2018 image, you can see that most of the new watershed area was captured uphill from the original stream that formed. This process is pervasive throughout the 1002 Area and the many examples seen later follow this general geomorphological pattern, shown in this visualization style.
Sensitivity of lakes to disturbance by seismic operations
Lakes in the 1002 Area are mostly perched on slopes underlain and surrounded by ice wedge polygons currently undergoing thaw, most lakes already show signs of water overflowing their banks, and the hydrology upstream and downstream of existing lakes, as well as the hydrology within partially-drained lake basins, is reorganizing rapidly due to ice wedge melt. Lake hydrology is therefore especially vulnerable to disturbance by overland traffic by seismic vehicles.
Vulnerability of tundra ponds to rapid drainage
Though lakes have been filling and draining here for eons, today they are in their most susceptible state to drainage in millenia due to recent, rapid warming. With pervasive ice wedge melt and the creation of new streams on slopes, some of these streams find their way up to these lakes, eventually draining them nearly completely and radically transforming the ecology of the lake basin. Given that seismic vehicles leave ruts about the same depth of ice wedge melt, these ruts have the ability to create new hydrologic linkages which could lead to sudden lake drainages.
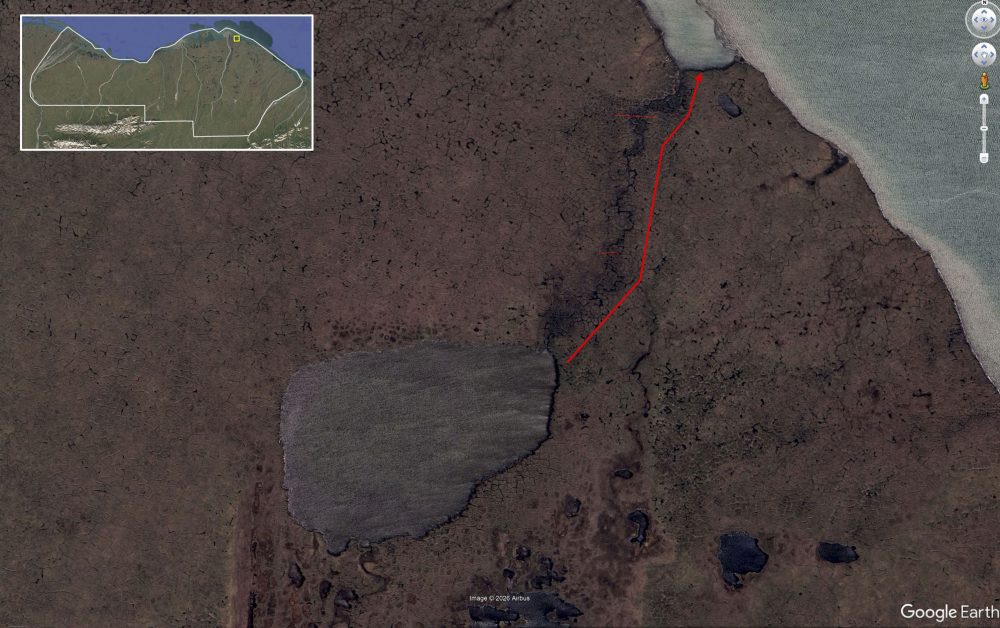
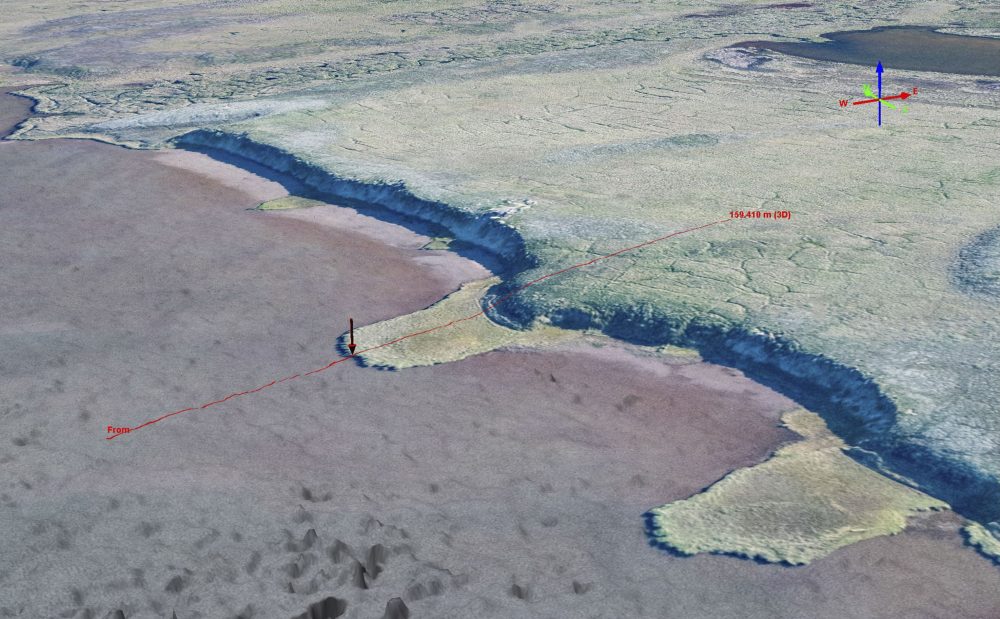
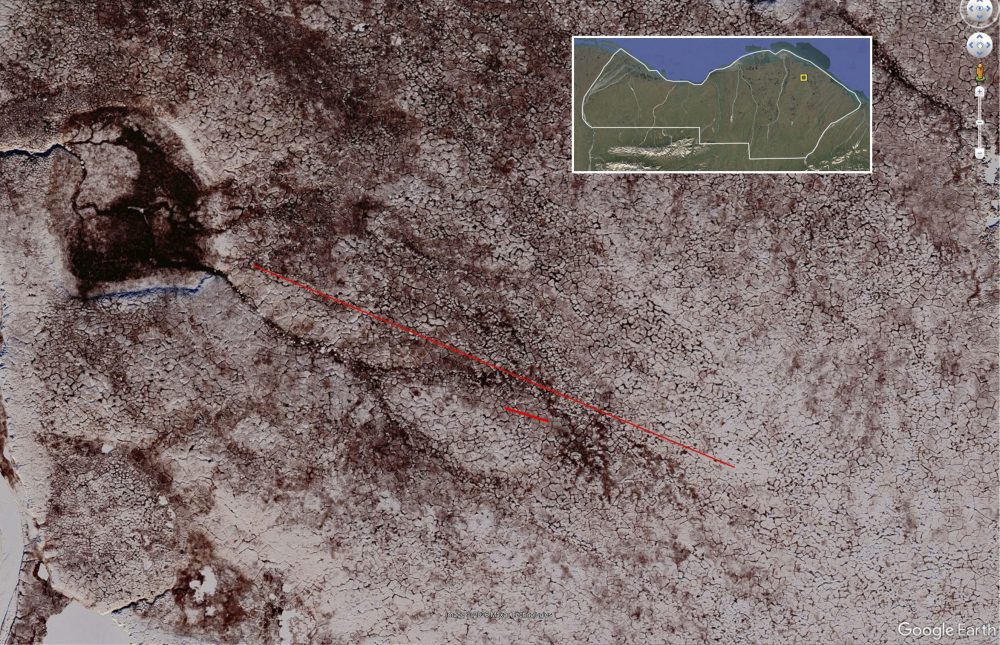
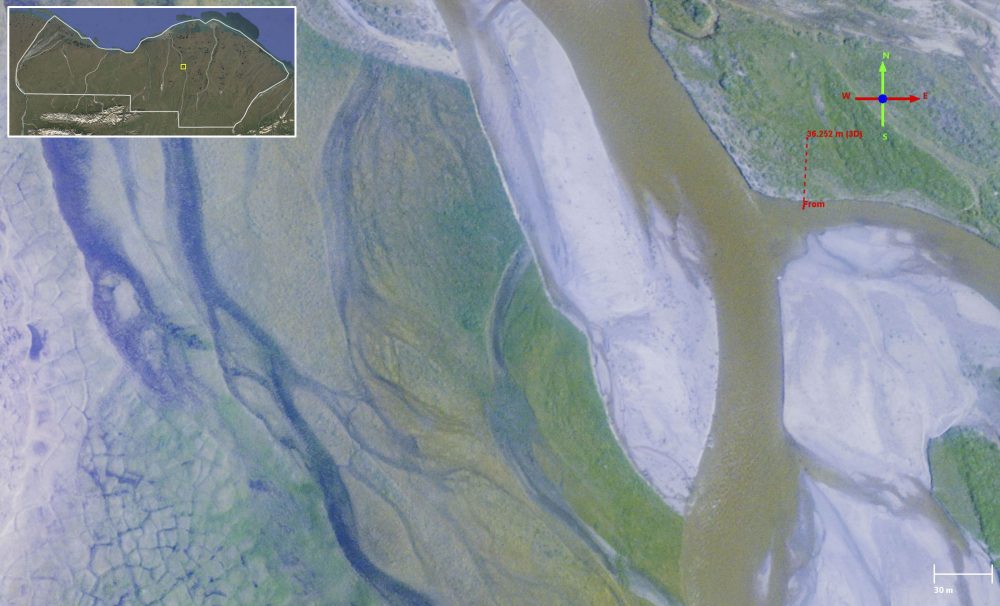
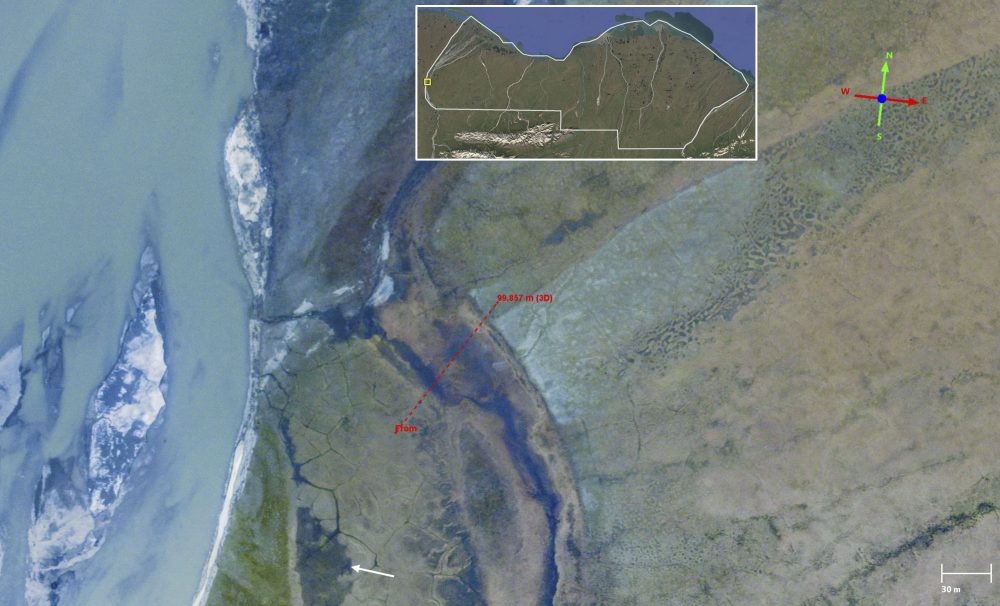
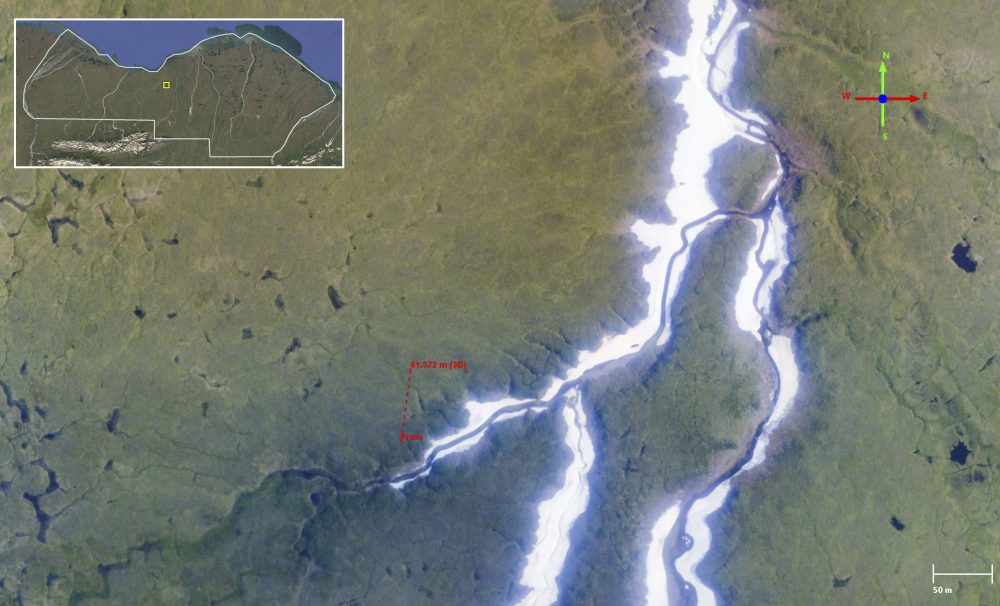
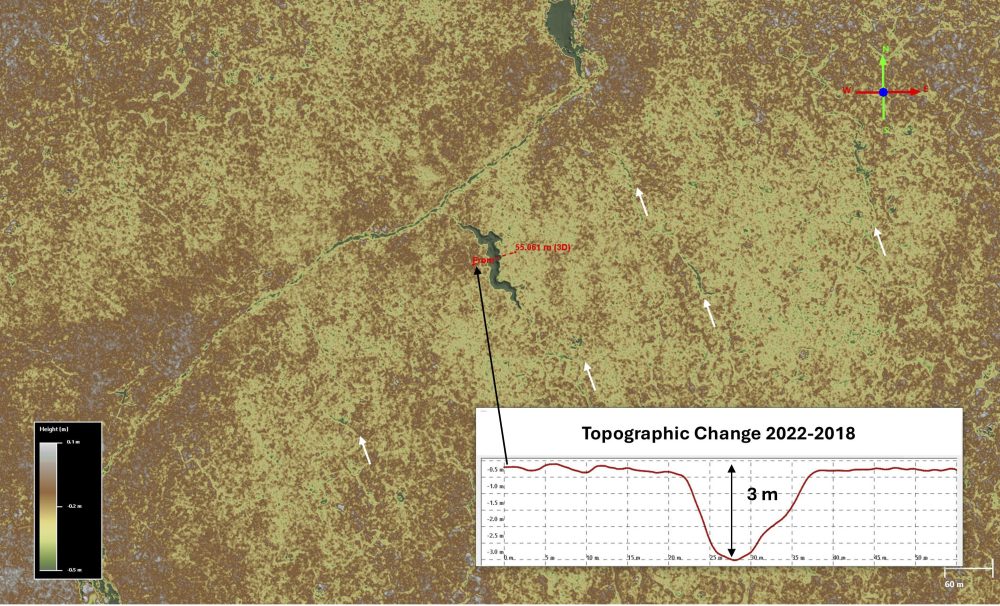
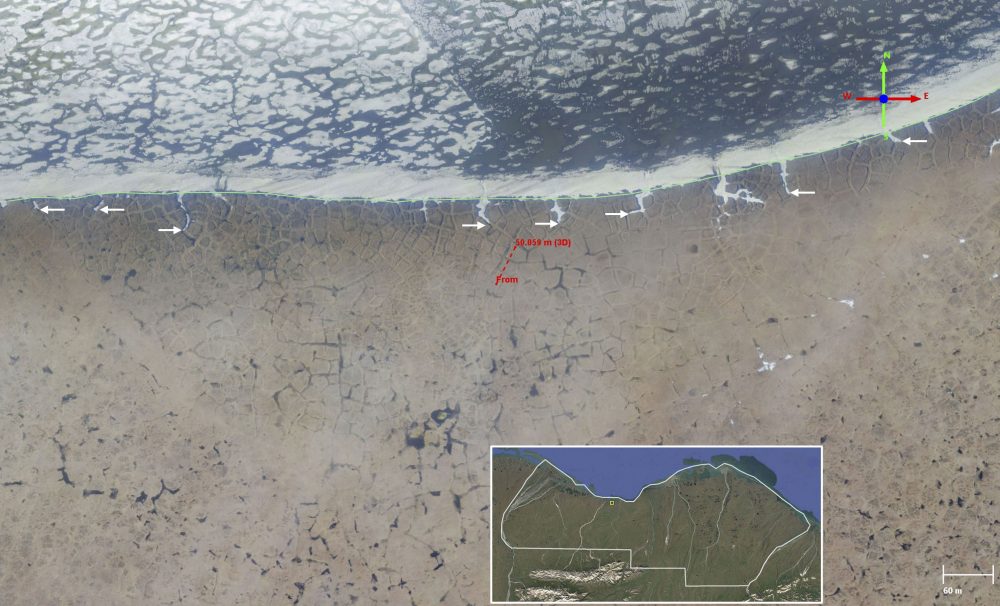
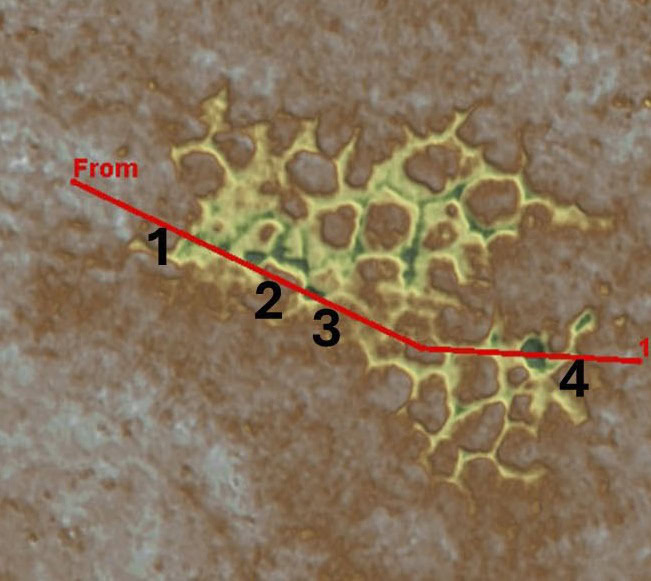
Vulnerability of tundra ponds to rapid drainage. Here is a lake near the coast that is beginning to drain due to climate warming. The red line indicates the location (to its left) of a stream connecting the lake to the coast. It formed when ice wedges thawed beneath the surface creating depressions which filled with water. As more of these puddles formed, they began to link together. Because there is a slope between the lake and the coast, these linked puddles formed into a stream that flows towards the coast. Note there are also two red cross-profiles (barely visible here) highlighted in the next examples.
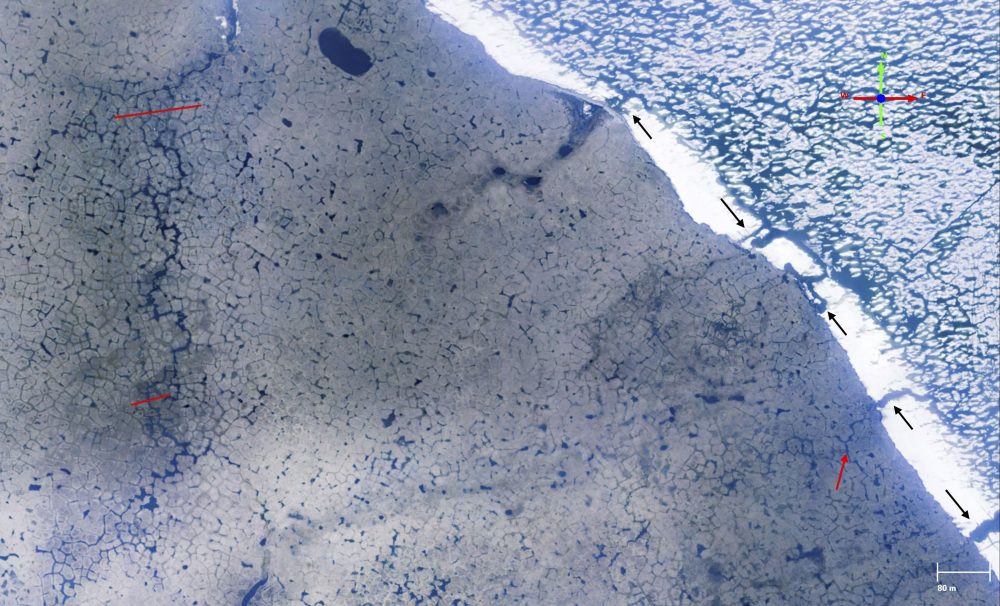
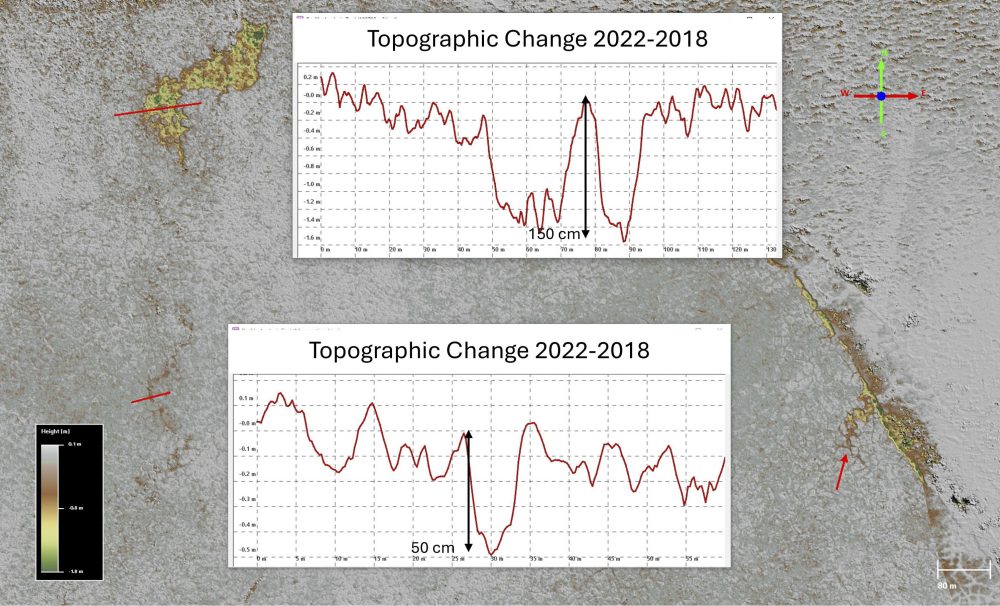
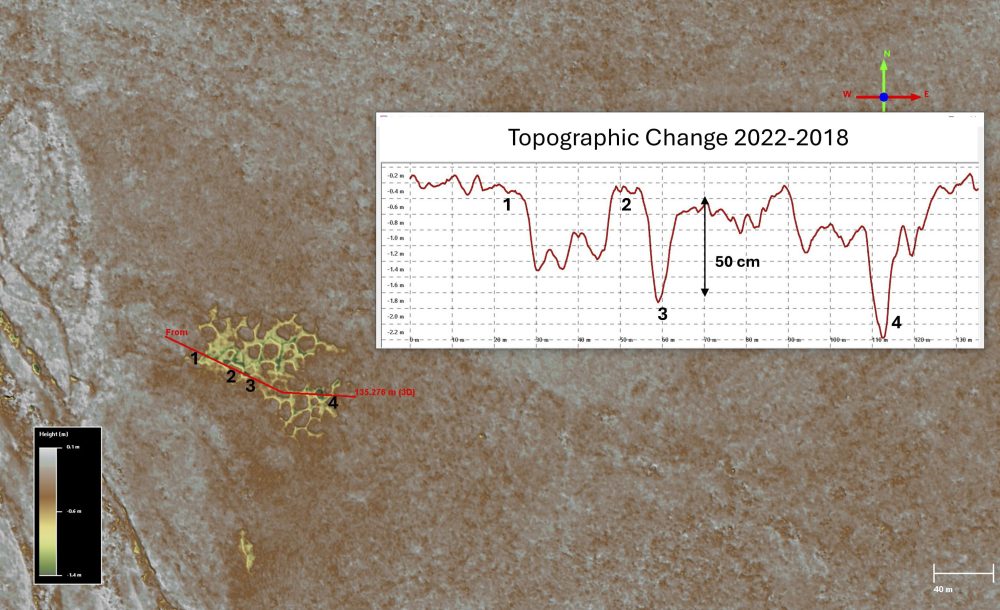
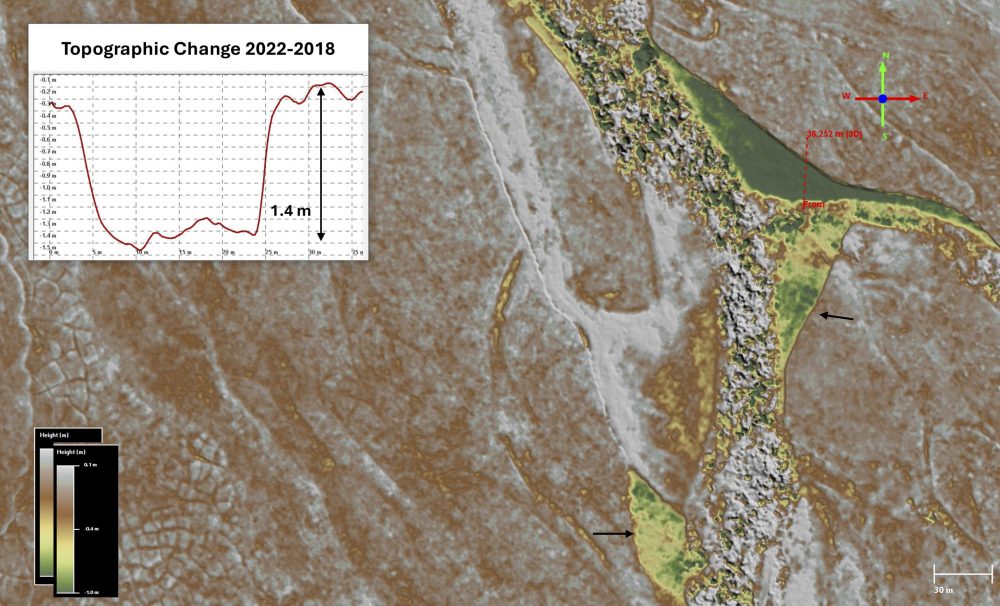
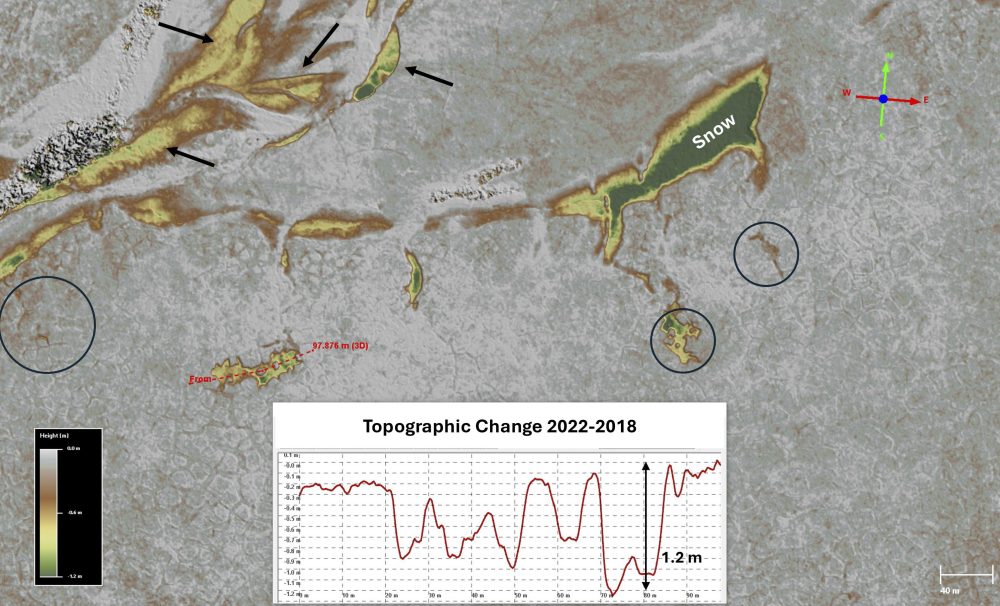
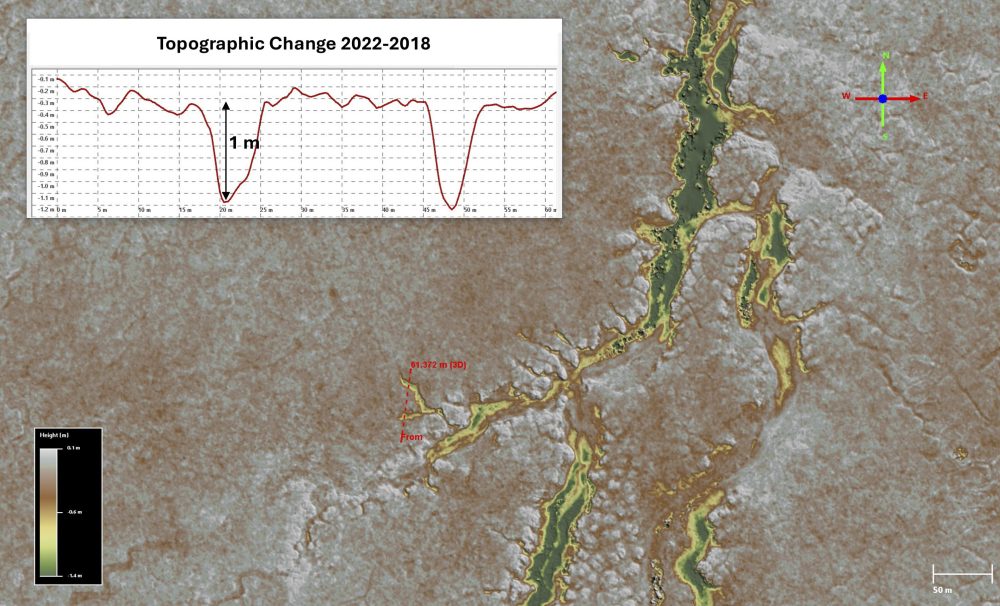
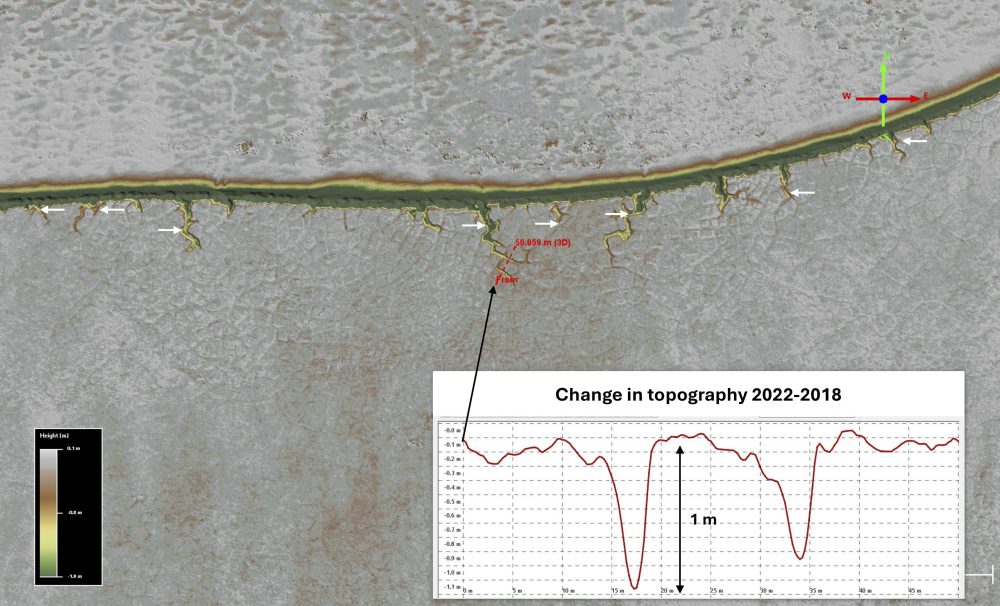
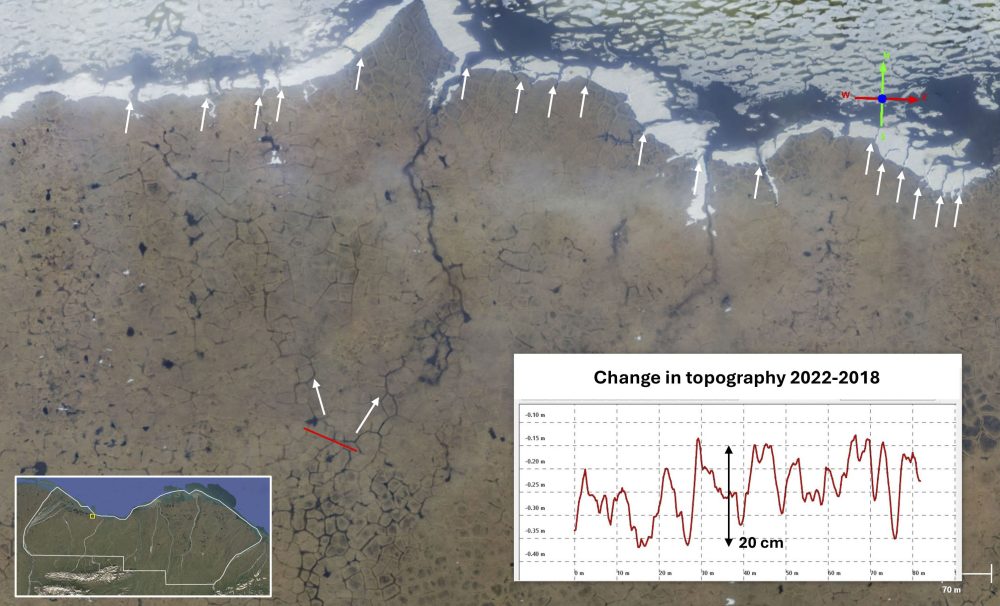
Vulnerability of tundra ponds to rapid drainage. Here is a closeup of the previous stream, seen in the 2018 fodar orthoimage (left) and the 2022-2018 elevation difference (right). Here you can clearly see the stream that has already formed. Note that the stream is chaotically shaped, with lots of zigs and zags, because it was not formed due to mechanical erosion but within the depressions left by ice wedge melt. The ice wedges surround polygons of ground, so the stream also follows the borders of those polygons. There are two red lines crossing this chaotic stream are elevation profiles shown in the plots. By 2022 (right), the flowing water has done two things: it has thermally eroded the ice wedges beneath it and it has mechanically washed away the polygons adjacent to it. Thermal erosion is different than thaw. Thaw of ice wedges occurs beneath the surface when the soil above it warms them above freezing, but the ice itself is still beneath the surface. Thermal erosion occurs when the soils protecting the ice wedges are washed away and the stream flow directly contacts the ice and melts it. Thaw is typically restricted to 10-60 cm, but thermal erosion cuts down 1-5 meters. Here, we see evidence of both thaw and thermal erosion, as seen in the inset elevation profiles. They have deepened the outlet channel and in places washed away complete polygons and stranded others with 1.5 m deep moats, as seen by green color in the colorized topographic change image. Melt is clearly an ongoing issue here, as ice wedge decay and hydrological connectivity is pervasive in the area (for example, red arrow indicating new stream formation into the ocean).
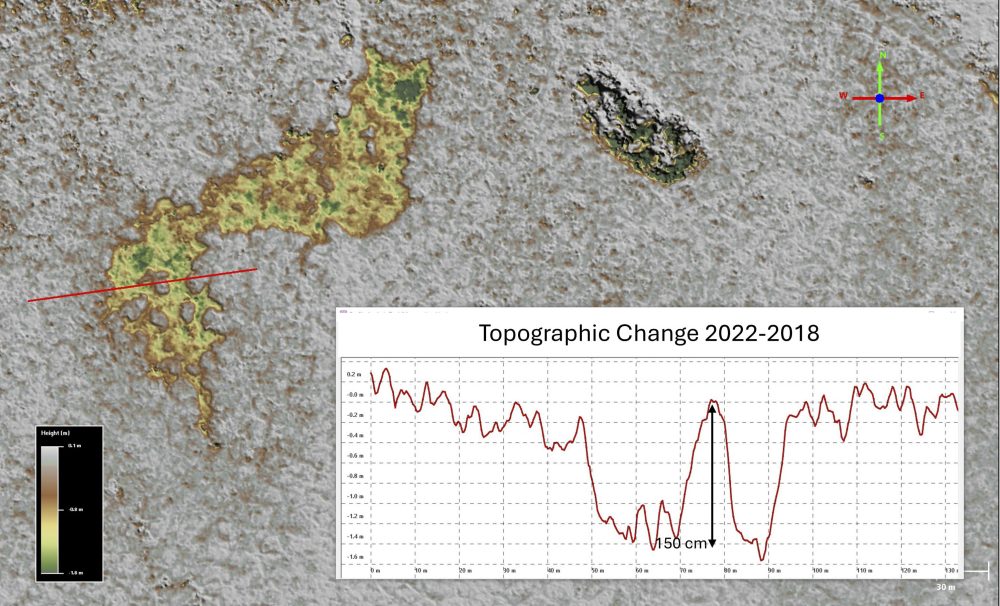
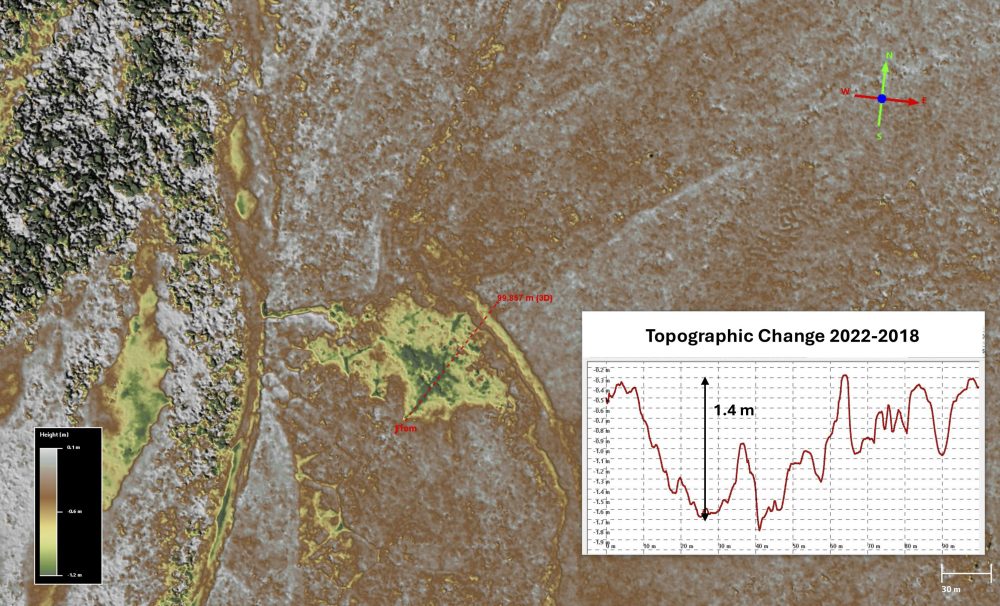
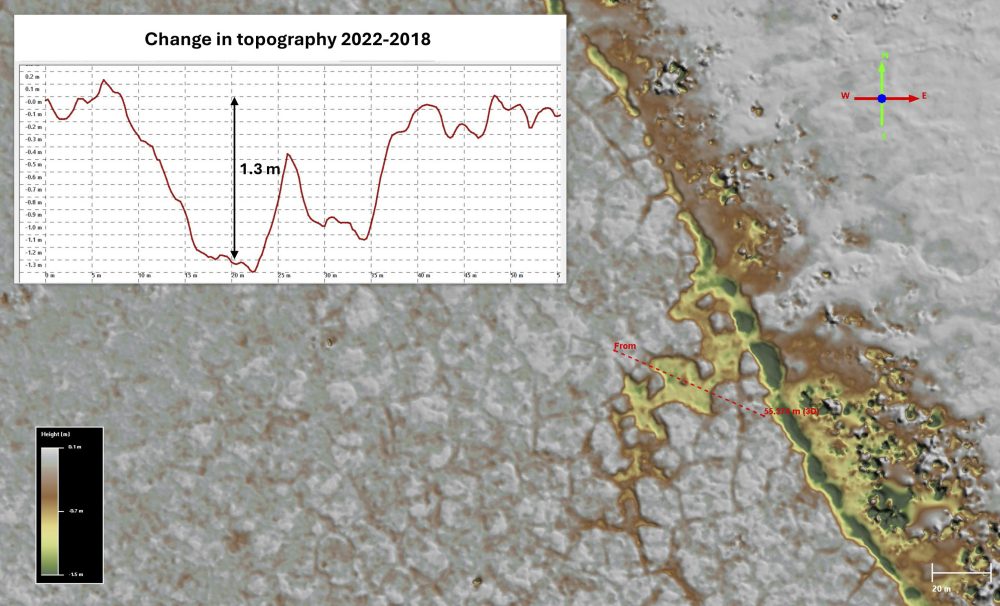
Vulnerability of tundra ponds to rapid drainage. Here is a closeup of the upper profile. Clearly evident is that many polygons have been completely washed away (yellow) with some polygons remaining as islands (gray). One of the island polygons is highlighted in the elevation profile — it sticks up 1.5 m above its surroundings. Note, however, the polygon has not been lifted, the ground around it has been washed away. Should thermal erosion like this (1-2 m) occur at the lake’s bank, the lake water will begin draining in earnest, creating a feedback loop that will increase the incision of the channel, which will increase the lake water’s discharge, which will further increase the incision of the channel, etc. Once this process kicks off, this lake could drain nearly completely in a matter of days. This process has been well documented and has been occurring for millenia, but recent climate warming is creating the conditions for an accelerated rate of drainage, as seen here (for example, here’s a report I wrote on this 20 years ago). That is, the vulnerability of the 1002 Area to disturbance by seismic vehicles is currently increasing.
The banks of most of the lakes are only a few decimeters high and the water only 1-2 meters deep yet they are underlain and surrounded by ice-wedges 2-4 meters deep and terrain several meters lower, making them vulnerable to rapid drainage through a positive feedback whereby once water begins flowing over an ice wedge, thermal erosion deepens it, causing increased water discharge that increases thermal erosion until the ice wedge is completely melted or the lake completely drained, all in the space of days. There are many dozens of lakes in the 1002 Area which could be drained completely by a vehicle rut only 30 cm deep in exactly the wrong place.
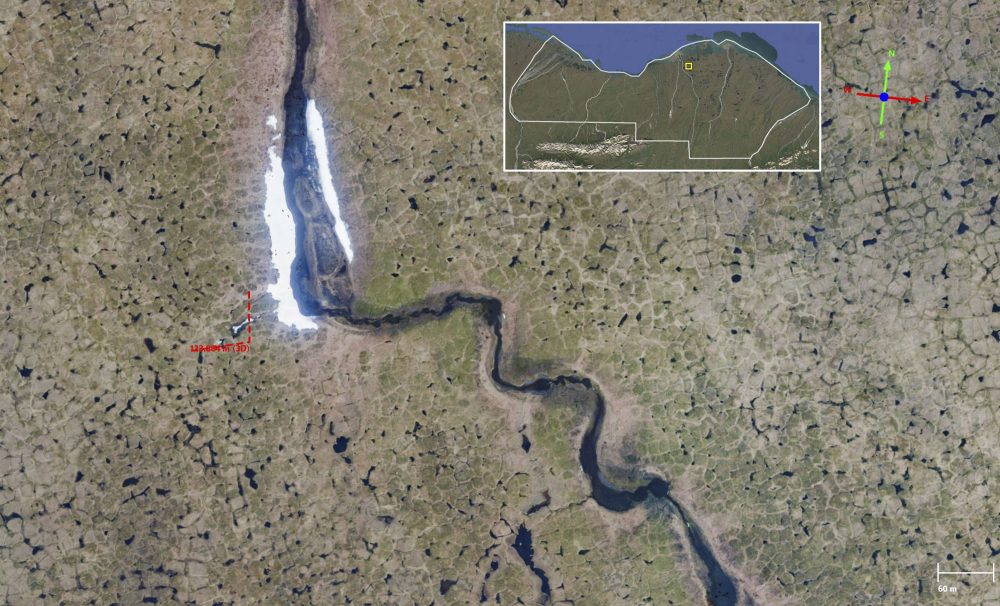
Vulnerability of tundra ponds to rapid drainage. Due to its pervasively sloping terrain, the 1002 Area does not have many lakes compared to the coastal plains to the west, but what lakes due exist are especially vulnerable to disturbance because they are perched on slopes. That is, there is a place for the water to go, should drainages like the previous example kick off. Here the red box explores in greater detail several of those lakes, along the Jago River near the coast.
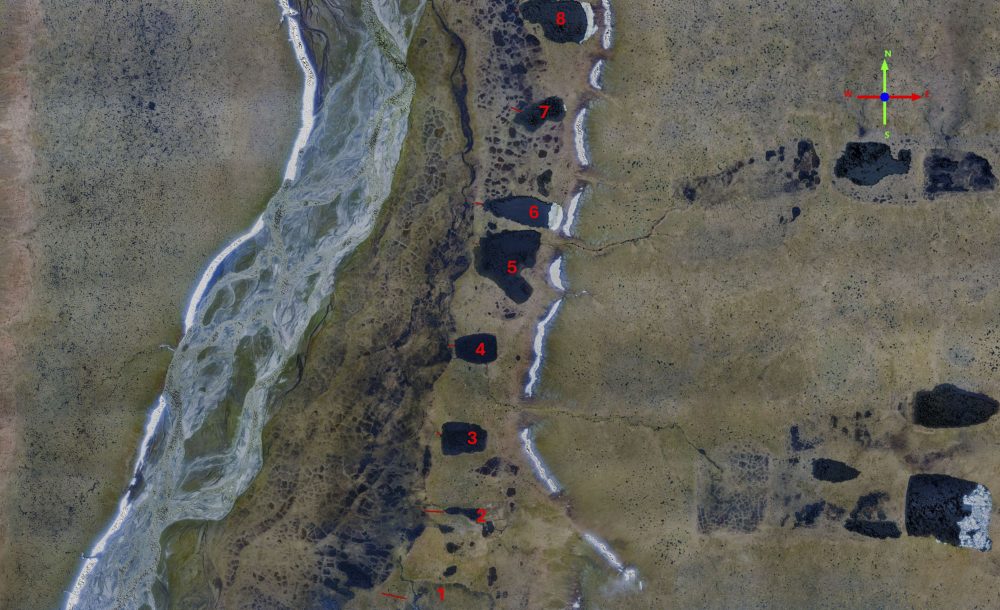
Vulnerability of tundra ponds to rapid drainage. There are 8 larger lakes within the inset, several of which have already drained (1 and 2). Each are perched on a terrace several meters above the current river floodplain, with only a few tens of meters between them. Each lake has a lip that is only a few tens of centimeters. Thus, these lakes are vulnerable to rapid drainage because only a small stream is required to connect them and the depth of incision required is well within range of thermal erosion of ice wedges (1-2 m).
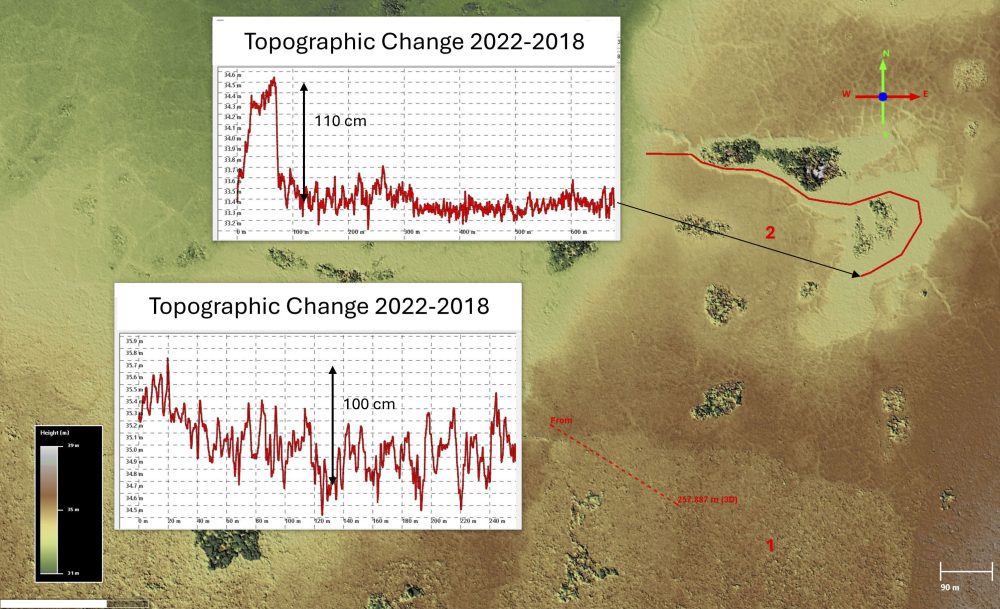
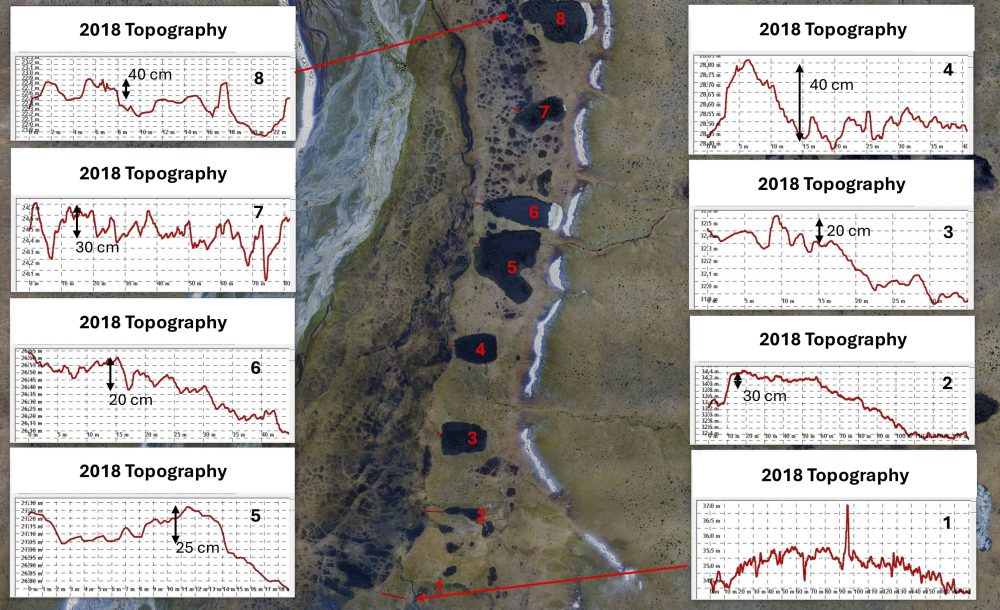
Vulnerability of tundra ponds to rapid drainage. Here are the two lakes (#1 and #2, at bottom of previous image) that have already drained. By examining their drained basins (red transects), we can see that these lakes were only about a meter deep. Thus, it only took ice wedge melt of 1-2 meters to drain these lakes. That these lakes have drained already and the have nearly identical characteristics to the adjacent ones indicates that all of these are also vulnerable to the drainages like these.
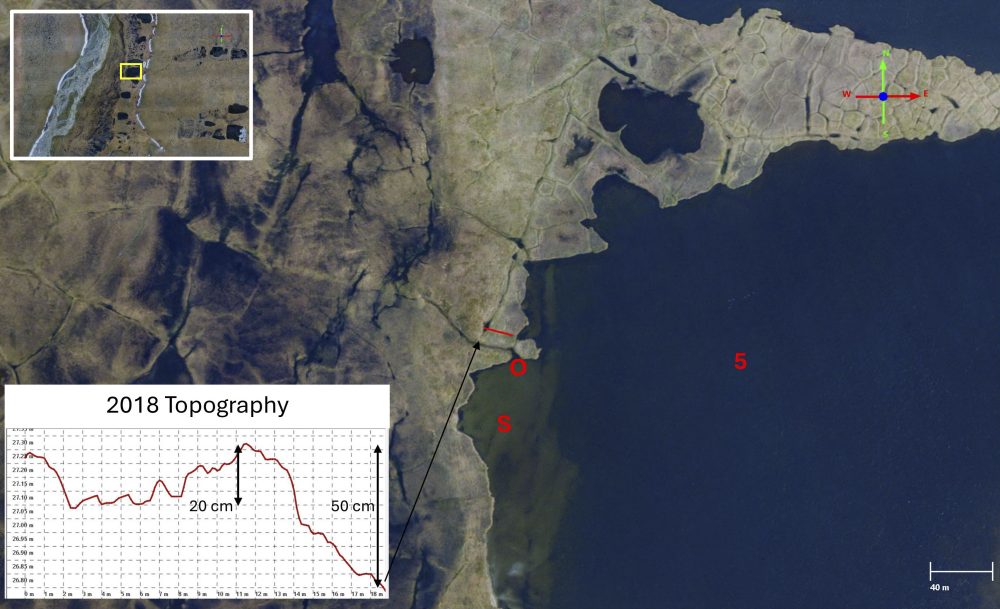
Vulnerability of tundra ponds to rapid drainage. Lake #5 has only a single polygon between it and the floodplain, and this potential outlet (O) is already filled with water. One reason it has not caused a rapid drainage of the lake is that the water is shallow here — beneath the water (S) we can see the submerged polygons and debris, such that only lake water higher than this will drain through the outlet. Heavy rains entering a full basin like this could kick off the rapid drainage feedback as more water flows over the ice wedge and thermally erodes it to connect with the deeper water in the lake.
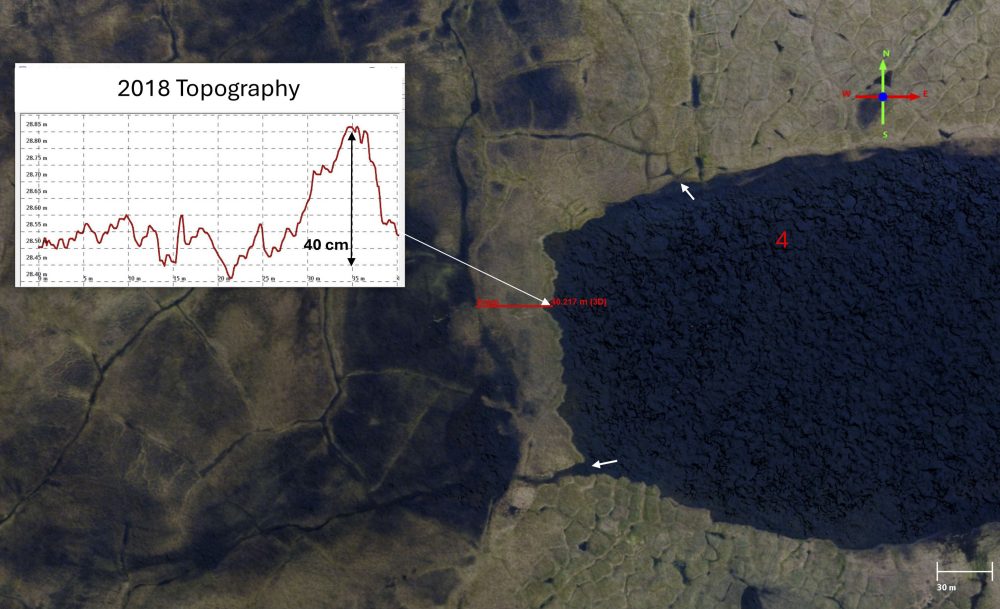
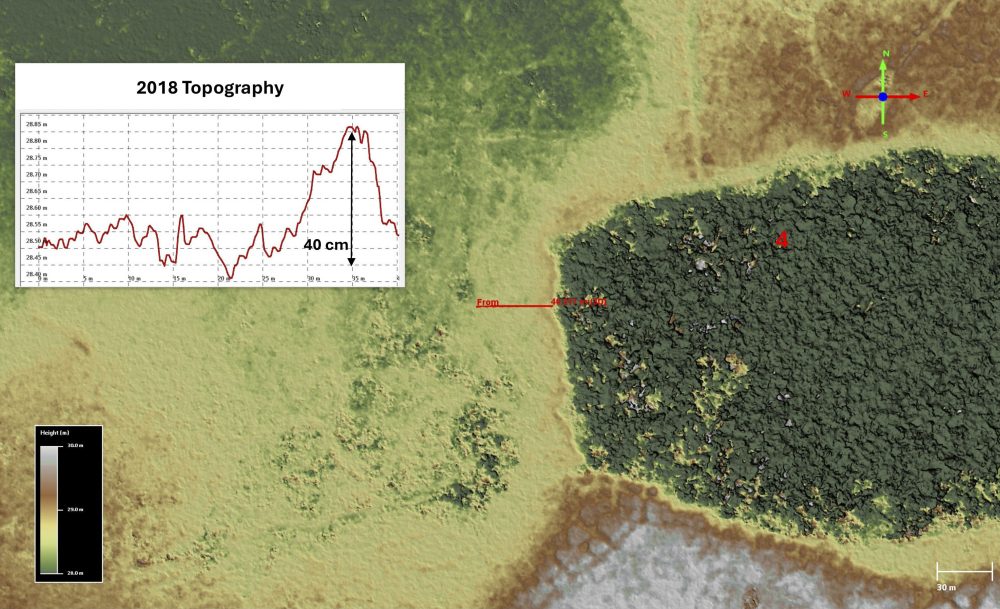
Vulnerability of tundra ponds to rapid drainage. Here is lake #4 which already has several outlets (white arrows, left image). Similar to lake #5, they may currently come in contact with shallow water (the lake appears as a textured green because this photogrammetry does not accurately measure water height). But they are both quite wide already. The elevation profile between them indicates that the banks are about 40 cm high here. This is well within the range of ice wedge thaw. Any mechanical disturbance here has the potential to accelerate the drainage process.
Reorganization of watersheds upstream from lakes
The watershed areas recharging these lakes are not static but evolving due to the rapid changes in topography caused by ice wedge melt, not just changing hydrological pathways but increasing the watershed areas significantly, every year. For example, a major fuel spill last year might only affect the immediate area, but the same spill in the same location next year could cause fuel to travel miles into a lake before mitigation could be implemented. Similarly, ruts from seismic vehicles could provide new or different connectively to already expanding watersheds, altering flow patterns permanently.
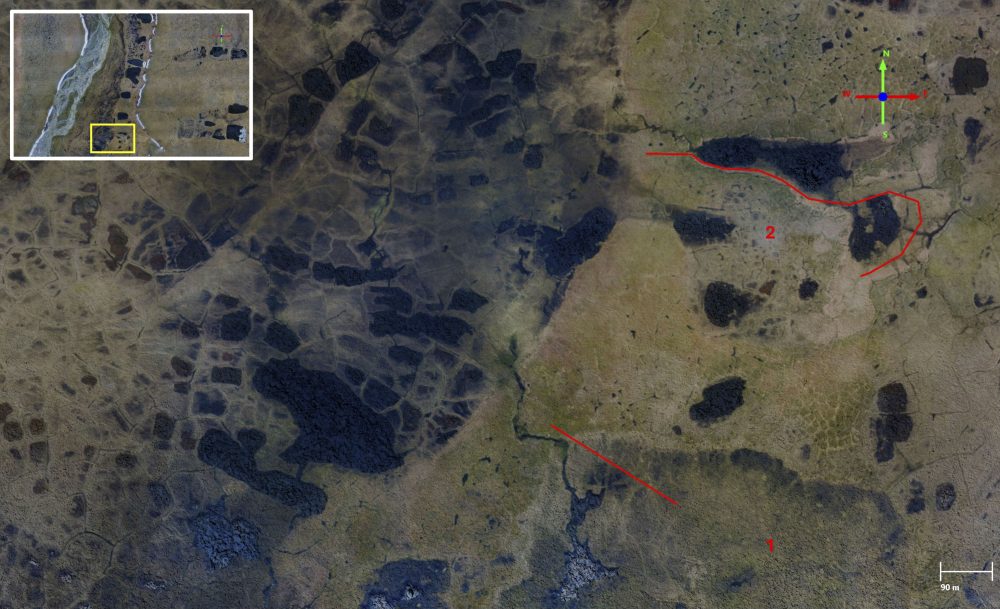
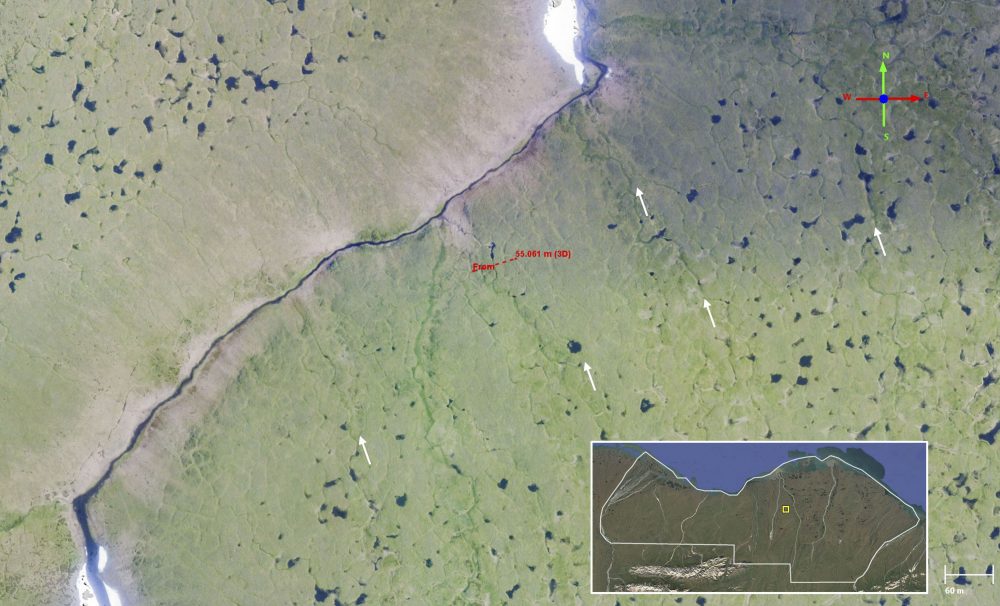
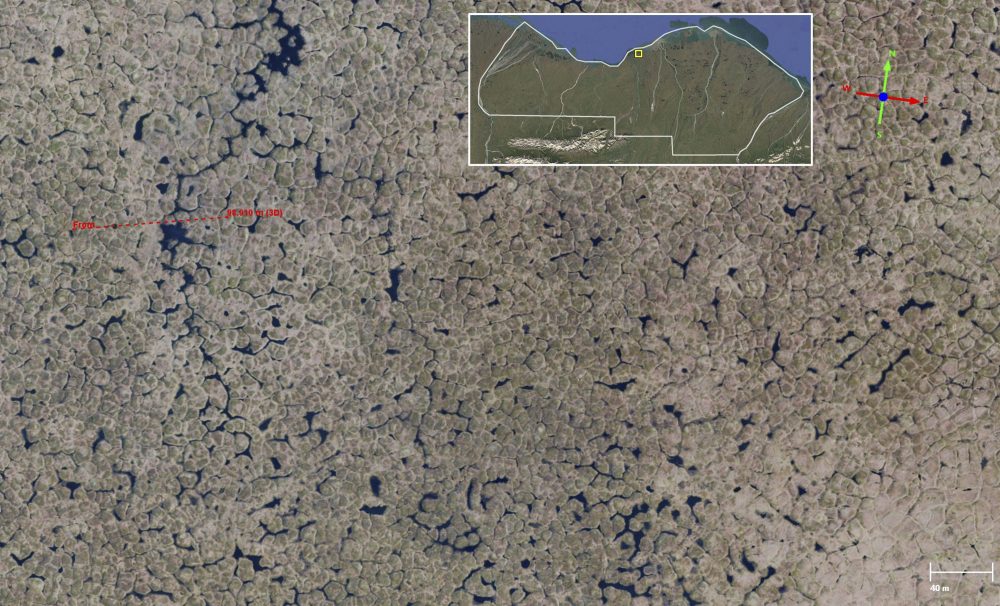
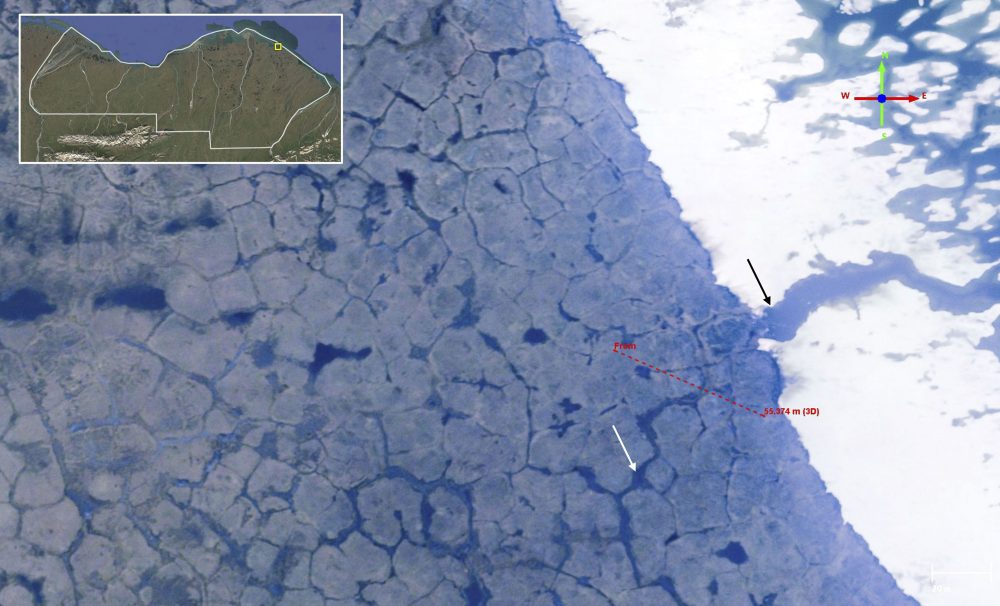
Reorganization of watersheds upstream from lakes. This October Google Earth image highlights the wet snow created by ice wedge streams feeding the nearly drained lake at left. Change is pervasive upstream of all lake watersheds in this study, as highlighted in by following figures in this example.
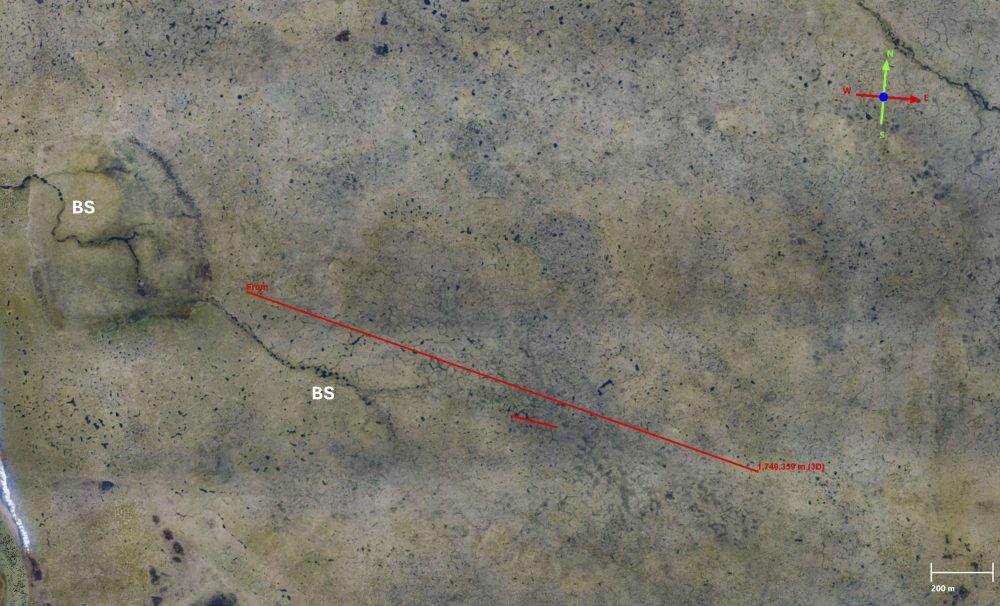
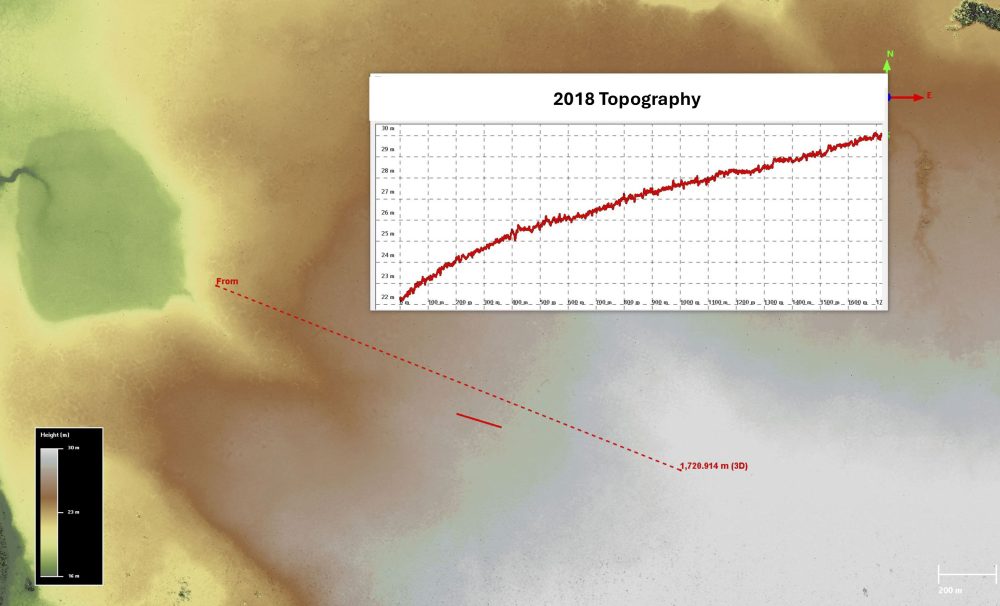
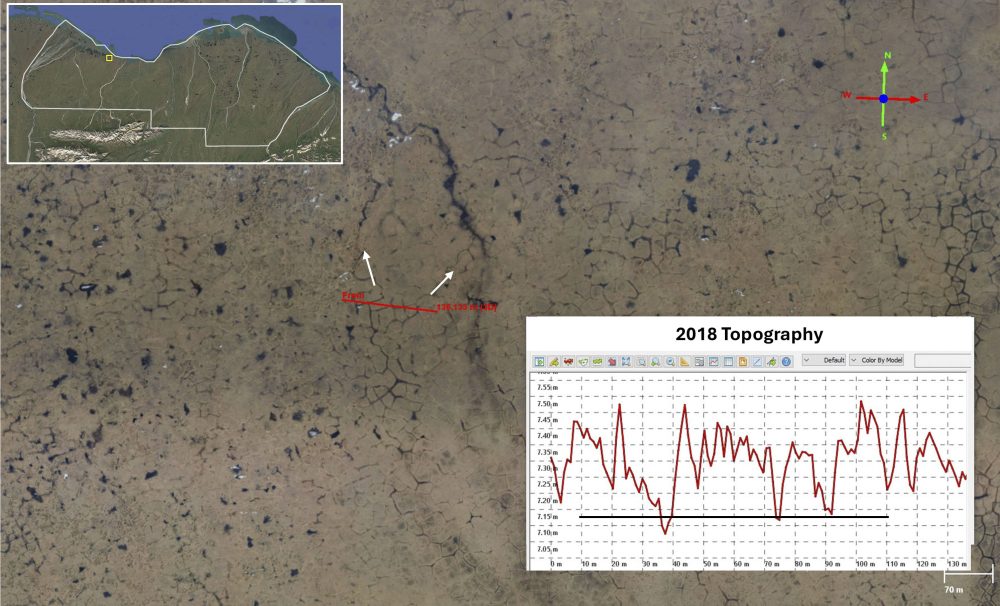
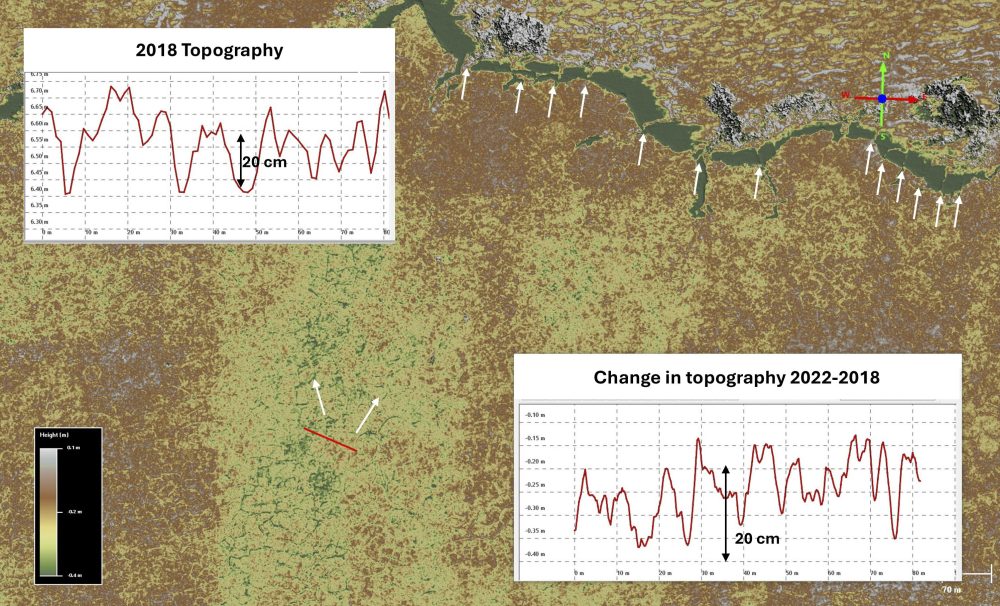
Reorganization of watersheds upstream from lakes. Here is that same upstream area as the previous slide, as seen in the July 2018 orthoimagery. A beaded stream (BS) is seen meandering into and through the drained lake at left, with signs of initial ice wedge decay seen throughout the upstream area indicated by puddles on top of ice wedges surrounding the red transect lines. Comparing to the 2018 topography (right), it can be seen that the location of the beaded stream and its fork are controlled by the gentle slopes of the large-scale topography, indicating why the stream formed here first.
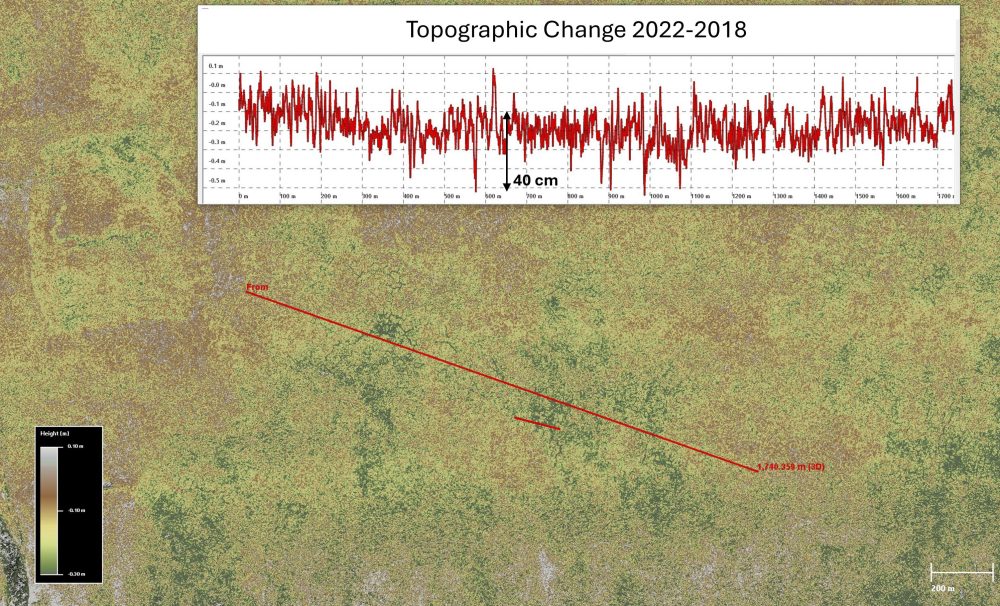
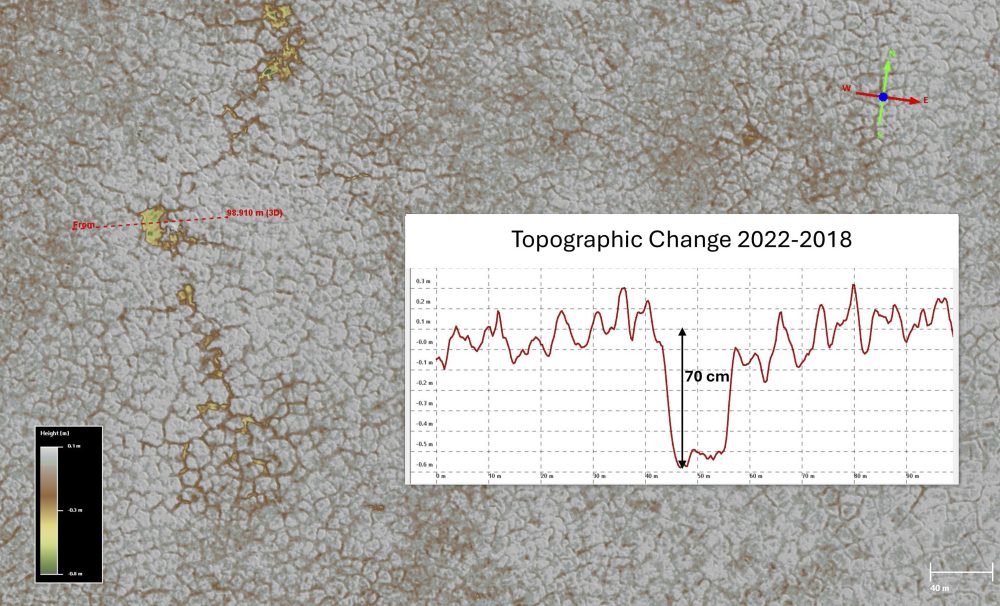
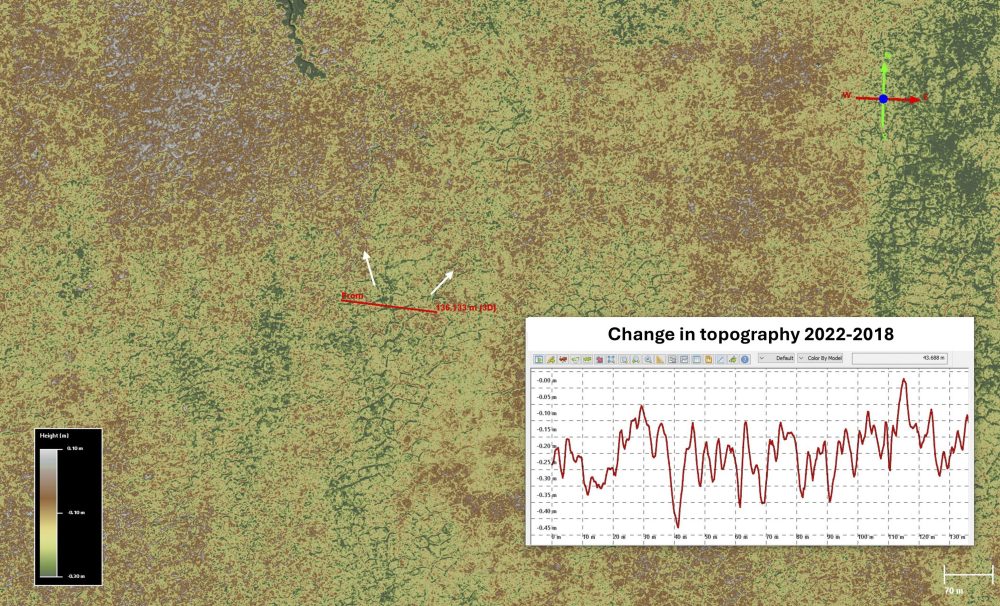
Reorganization of watersheds upstream from lakes. Comparison of the change in topography (2018 – 2022, right) here clearly indicates initial and advanced degradation of ice wedges (pervasive green colors on image and profile plot at top), with losses of 10-40 cm, in the gentle slopes above the existing beaded stream. The channels have linked in many places. Even without directly measuring the change in hydrological channel networks nor the increase in drained area (as in Jorgenson et al, 2022), we can clearly see that the channel routing has changed significantly and the watershed area draining into the beaded stream has increased significantly. Regions like this, which are pervasive here, are particularly susceptible to channel rerouting due to seismic vehicle ruts.
Reorganization of watersheds upstream from lakes. From the 2018 orthoimage (left) of a close up of the recharge area of the lake in the previous images, it appears that degradation and stabilization may have occurred in this section of the polygon field, as the wedges seem to have widened and filled with a greener, perhaps semi-aquatic, vegetation compared to many in the surroundings. The topographic change (right) over the next four years indicates that any stabilization has slowed down and that significant ice wedge melt (greens) has occurred, enlarging the watershed area and volume entering into the more established drainage network. A fuel spill here 5 years ago may require remediation only in the immediate area because this location was still perched hydrologically and not connected to a broader network — a spill here tomorrow may spread fuel for miles before remediation could start. A partial ~100 m grid (white) is superimposed to suggest the possible impacts seismic operations may have on this landscape – ruts of only 10-25 cm (that is, on the order of melt seen here) could linearize this drainage, drain the interiors of grid cells, and accelerate the rapid transformation of ecology here in directions nature would not have gone. I
Vulnerability of hydrology downstream from lakes
Evidence of rapid drainage and changing outlets of existing lakes in this region is pervasive, with chaotic ice wedge networks in some cases rerouting lake discharge by miles; poorly-placed seismic lines could cause similar effects. The large water volume of topographically-perched lakes give them enormous erosive potential and therefore require special consideration for disturbance.
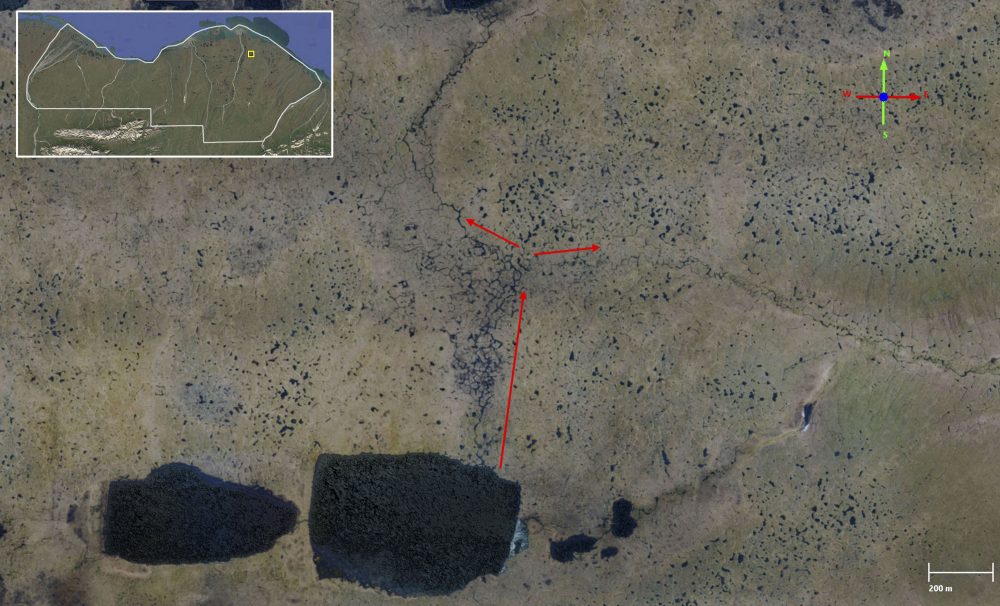
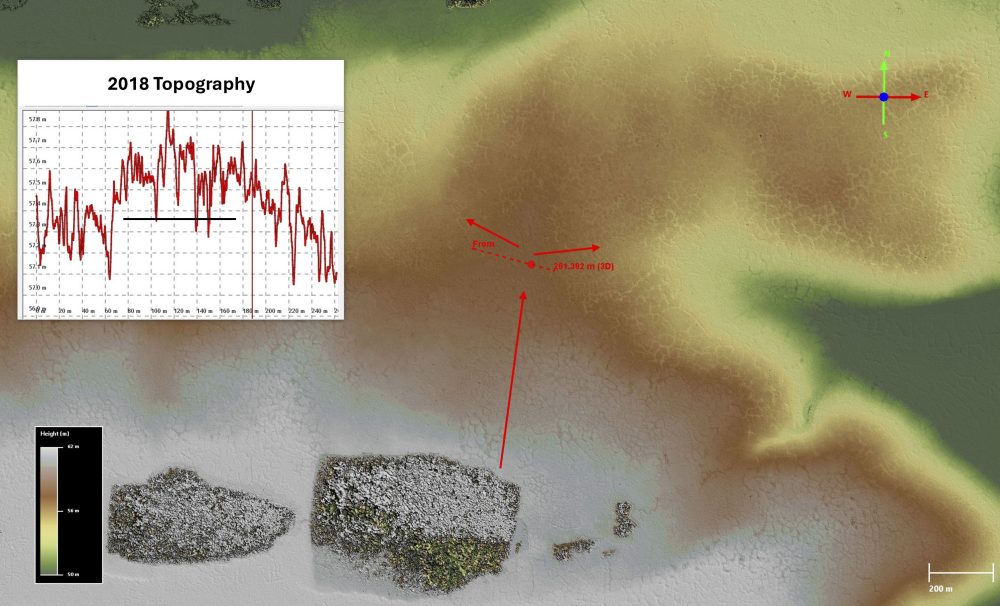
Vulnerability of hydrology downstream from lakes. Here a large lake can be seen draining north through a chaotic network of melting ice wedges and in a manner that suggests such flow is increasing (chaotic linkages are flooded but not yet thermally-eroded). The red arrows indicate current drainage direction. The left (western) branch is currently receiving most of this lake water. What would it take for this water to flow to the right? The 2018 topography (right) indicates that lake water is flowing towards a slight topographic divide. The transect spans into both branches at a place where it appear water can flow in either direction. The topographic saddle is only about 20 cm, but the ice wedge bottoms intersect each other down to 30-40 cm (black line in profile) and it is the bottoms that matter in terms of hydrologic connectivity. Climate is already transforming this landscape, so a few well placed seismic lines or a camp-move could not only re-route this lake’s outlet into a completely different watershed but could also trigger a rapid drainage event, radically transforming ecology over a huge area due a disturbance of only a few tens of meters.
Sensitivity of rivers to disturbance by seismic operations
Erosive power of rivers running through foothills
None of the rivers flowing through the 1002 Area are the meandering type typically found in coastal plains because they do not run over any coastal plains – they all drain foothills or mountains to create steep, braided channels that have significant erosive force in terms of channel and bank scour. Thus, more and different care needs to be taken in protecting these rivers from harm due to infrastructure development and seismic operations than the coastal plain rivers to the west.
All of the larger rivers have ancient deltas, indicative of their power, sometimes even inland where constrained between two foothills, with enough power to actively erode into these hillsides. There is at least one example of an imminent hydrologic reorganization of a major tributary to the Jago River switching to the Niguanak River, in a location where seismic operations could accelerate this change, perhaps strongly affecting the bird habitats of the Jago River delta.
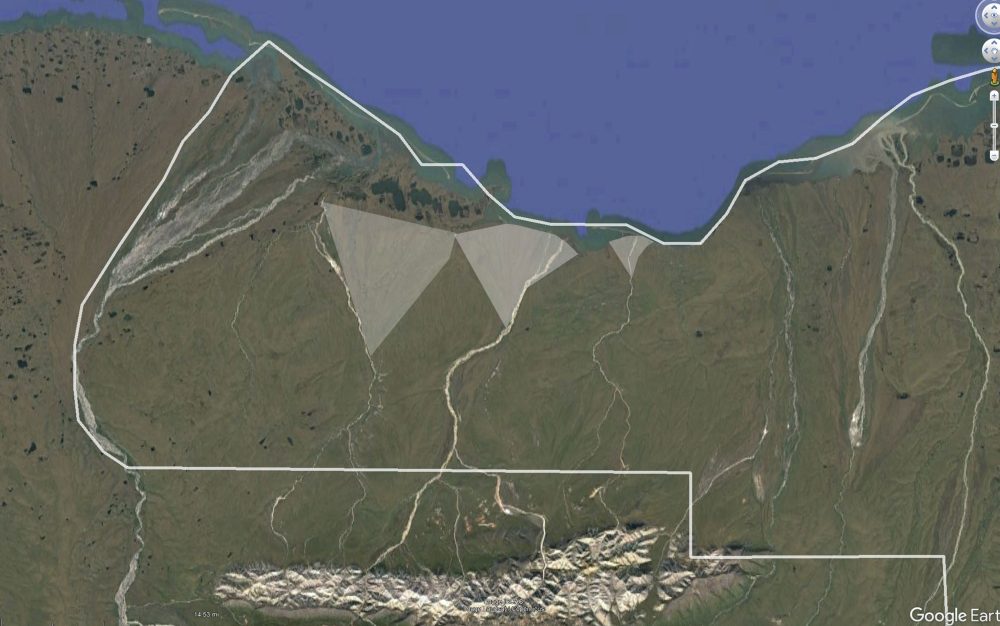
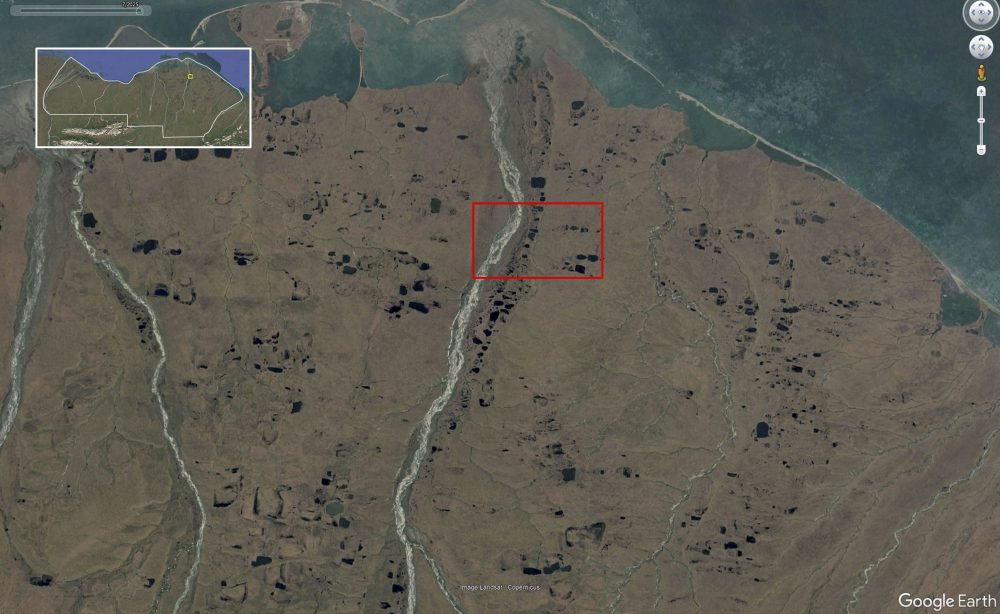
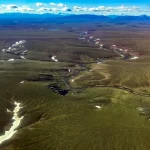
Erosive power of rivers running through foothills. Even at this large spatial scale, it can be clearly seen here that these rivers braided and carry enormous erosive power. They also have large, ancient deltas (shaded triangles), which requires there to be steep topographic gradient in addition to enough discharge to carry sediments long distances without falling out of suspension. That is, these are not coastal plain rivers and indicate that landscape sensitivity here is dominated by hillslope processes. And these are the small rivers in the 1002 Area (white outline), nearly all of the others drain from the mountains, many carrying glacier meltwater, so those have significantly more erosive power. Thus, the river dynamics here also cannot be considered those of a coastal plain for industrial planning purposes, including seismic operations.
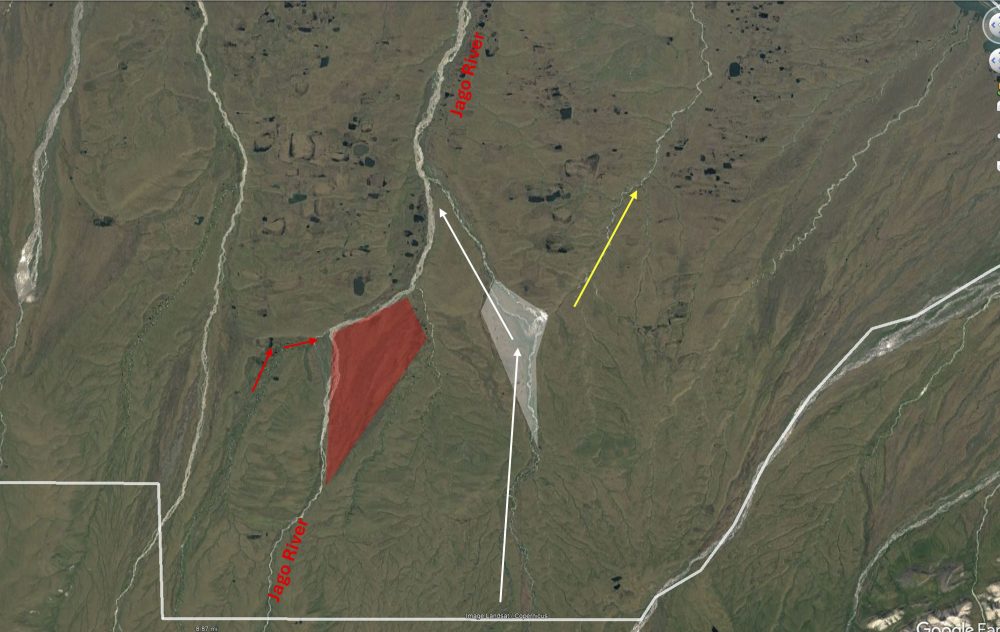
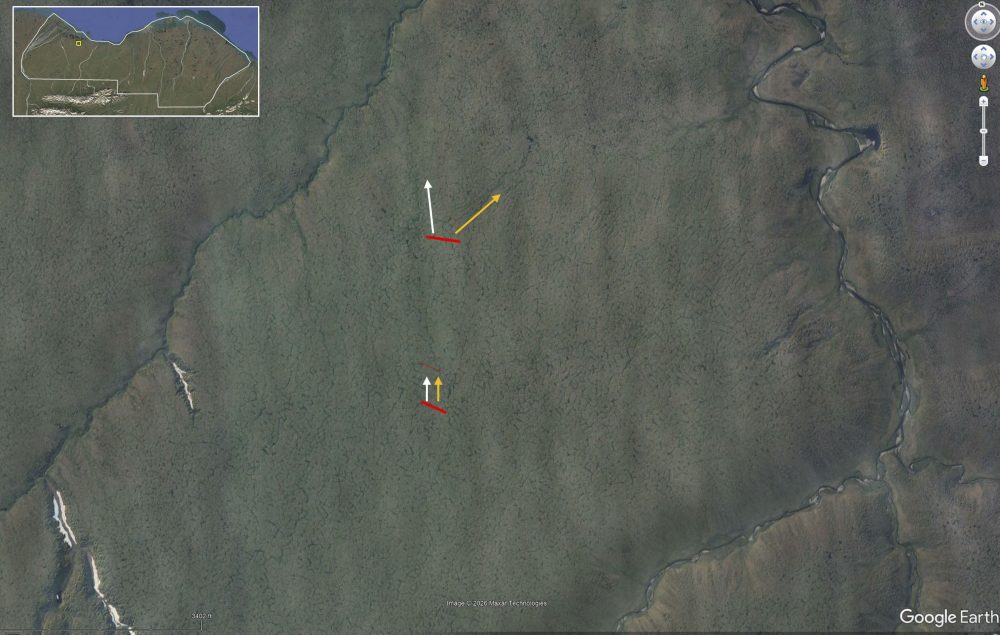
Erosive power of rivers running through foothills. A tributary (white arrows) to the Jago River (red) begins in the foothills near the bottom of this image, yet has enormous erosive force on the hillside in collides into, as seen in the following figures. The Niguanak River (yellow) begins to become channelized on the east side of this hill. The colored polygons show the deltaic movements of these erosive channels and the next slide details how the water has been recently pushing east within the white deltaic region, not only massively eroding hills here but perhaps forcing a connection into the Niguanak River. Another tributary (red arrows) shows similar dynamics to what is shown in the next few figures, but is not described further; visit Google Earth to study these and related dynamics, just as the following analysis does.
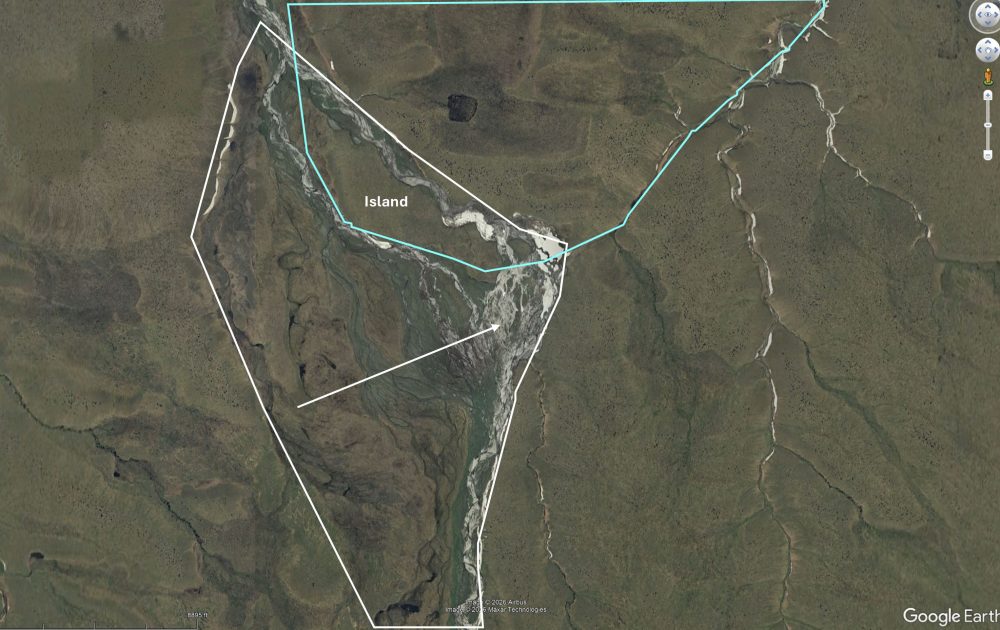
Erosive power of rivers running through foothills. Here is a close up of the white deltaic region from the previous figure. Here it can be seen that the river is actively pushing towards the east (white arrow) but is topographically confined by hills. The age of the older channels is partially revealed by their color, with more recently used ones being greener. One reason the river is pushing to the east is that it was able to exploit some weakness (perhaps massive ice or yedoma) of the original hillside (blue polygon) to bisect it creating islands, a process that is ongoing. The glacier fed rivers (Jago, Okpilak, and Hulahula) have even more erosive power, so we should expect this process to be occurring everywhere, further indicating that none of these foothills should be treated as coastal plain in terms of their vulnerability to disturbance to either climate warming or seismic operations.
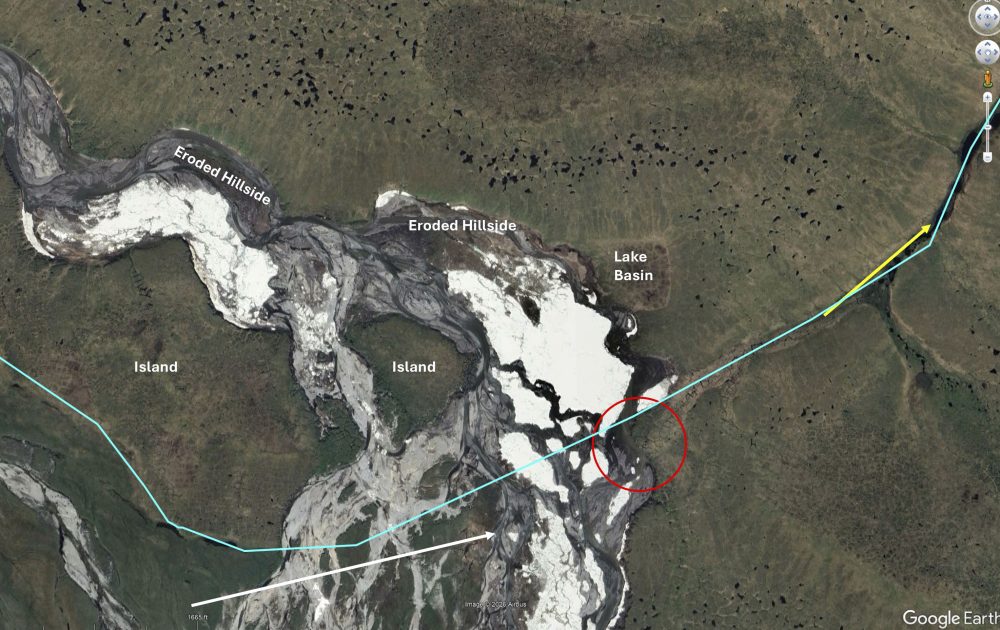
Erosive power of rivers running through foothills. Here is a close up of the white deltaic region from the previous figure. It is actively eroding over a kilometer of this toe of the new hillside it encountered after bisecting the old one (same blue line), as evidenced by the stranded islands that used to be part of that hillside, the lake basin being eroded into, and bluffs. If this amount of erosive power is applied further east at the red circle, as seems imminent, this river will drain into the Niguanak River (yellow arrow) basin rather than the Jago River, enormously impacting the discharge in each and altering the Jago River delta dynamics with its bird habitats there. This channel has clearly already been used as a spillway, as indicated by its discoloration. A huge steel-bladed tractor pulling a hotel for seismic workers taking this easy route could trigger the rerouting of a watershed many thousands of acres in size and transform the ecology on a massive scale. The aufeis itself and the spring feeding it may play a critical role in all of these dynamics too, here and at similar locations, so study is required prior to aufeis harvesting to keep from triggering these same dynamics.
Hydrological and ecological transformations at river banks
Ice wedge melt is also accelerated near river banks due to the insulating and warming properties of this snow and this accelerated melt can continue inland for hundreds of meters without any direct influence from river channel migration. This increased melt makes river banks easier to erode by channel migrations and by overland seismic travel.
River scour, deposition, and erosion. These are large rivers with huge erosive force and changes like these are ubiquitous throughout the 1002 Area’s rivers. Here a slight change in course has scoured 1.5 m deep of tundra almost 30 meters wide in places. In aggregate amongst all rivers, this is a huge loss of terrestrial plant habitat. Much of this habitat, however, is shrubbery. What I’ve noticed is that the glaciated rivers keep washing away the shrubs, whereas further west the river banks are overgrown with them. I believe this is caused by glacial meltwater– until recently these rivers were getting larger with glacial melt, but as the glaciers disappear they are getting smaller. A companion blog describes this in more detail.
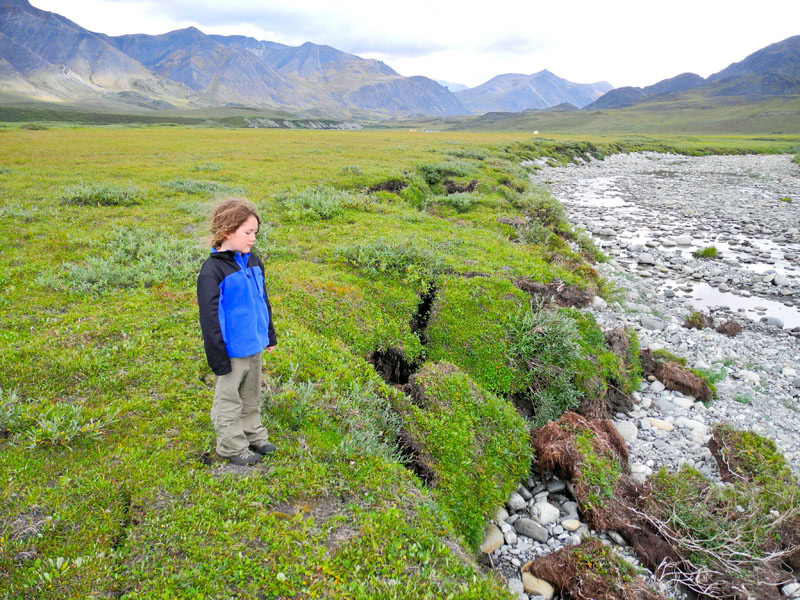
Here is that erosive process in action. River water scours the soils and ice beneath the tundra, which then collapses into the river bed. These tundra clods can be carried hundreds of meters or more in floods. Also washed away are the nutrients within this soil and tundra, which ends up in the nearshore lagoons on the coast for the benefit of the marine ecosystem. These rivers are glacier-fed and how the loss of glaciers affects the ecology here is described in the fourth blog in this series.
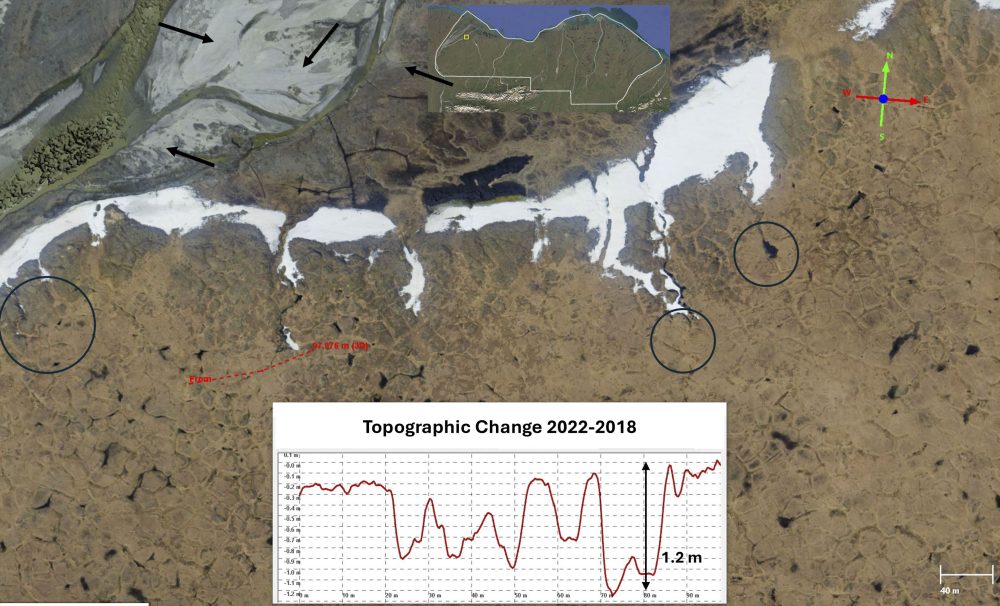
Hydrological and ecological transformations at river banks. River banks erode and transform even without the direct influence of river water. Here late June snow in gullies continues to insulate the ground beneath and warm it rapidly through latent heat released by snow melt/refreeze. The resulting lowering of the ground within these small gullies promotes drainage from further inland, which promotes increased melt there through moving water, which leads to new snow drifts, in a positive feedback loop that continues regardless of changes to the river channels (black arrows). However, when the river channel does move, it will find areas like this much easier to erode due to these gullies and their lack of binding ice. That is, the regions surrounding rivers now have an increased sensitivity to erosion due to climate warming. The red profile and black circles indicate areas where little to no snow or degradation appears in 2018 (left), but changed considerably by 2022 (right) with numerous new drainage networks formed well away from the river. Ice wedge melt of over a meter (green) is apparent here. Snow drifts from 2018 not present in 2022 also cause an apparent change in topography; without orthoimagery (left) it would be easy to confuse changes in snow with changes in the terrain, an issue lidar alone cannot solve because it has no associated orthoimagery.
Hydrological and ecological transformations at river banks. The red profile line crosses a small tributary stream at the base of the hill confining the Canning River in the 2018 image (left). Ice wedge degradation has already begun here in 2018, as seen in the polygons to the left of the red line and the flooding on top of them (white arrow, left image). Four years later (2018-2022), there was complete loss of several polygons to over 1.5 m depth (green) and ice wedges opening up further in the area. None of this was directly to do with Canning River water, though earlier erosive events into this bank may have precipitated these changes. Should the channels decide to push in this direction in the future, they will likely find this terrain much easier to erode than 4 years ago and this habitat, having changed from terrestrial to aquatic already, will disappear completely. The sensitivity of river banks to disturbance is obviously quite high without large trucks driving over it, such that if such activities leave ruts on these slopes further degradation is inevitable.
Sensitivity of streams to disturbance by seismic operations
Streams source water from within the tundra, but their drainage networks are immature and in the process of becoming incised as the ice underlaying them thaws, often with a feedback as snow infill keeps the ground warmer through insulation. Small changes in topography caused by seismic operations as well as compression of snow by seismic operations may both accelerate the hydrologic transformations we see ongoing now and any changes to hydrology, such as the drainage of previous undrained area, transform the ecology there.
Streams are actively enlarging throughout the 1002 Area, aided by snow
Existing streams are actively creating new dendritic branches through adjacent ice wedge degradation to reach out to these new watershed areas, enlarging through a positive feedback process in which snow drifts fill a degrading ice wedge cavity adjacent to a stream to insulate the ice from winter’s cold, snowmelt warms ice left in the cavities quickly in spring, the enhanced topographic gradient caused by the cavities attracts perched water bodies to flow over them and thermally erode the remaining ice to several meters depth, new and deeper wind traps are created to form bigger drifts that winter and thus continue the positive feedback process. I suspect an important process here is that ice wedge melt is occurring broadside to the wedge itself, not just from surface heat from above. Given the fragile state of the terrain surrounding streams, any disturbance due to vehicle traffic such as ruts in the tundra or compressed snow could accelerate this process.
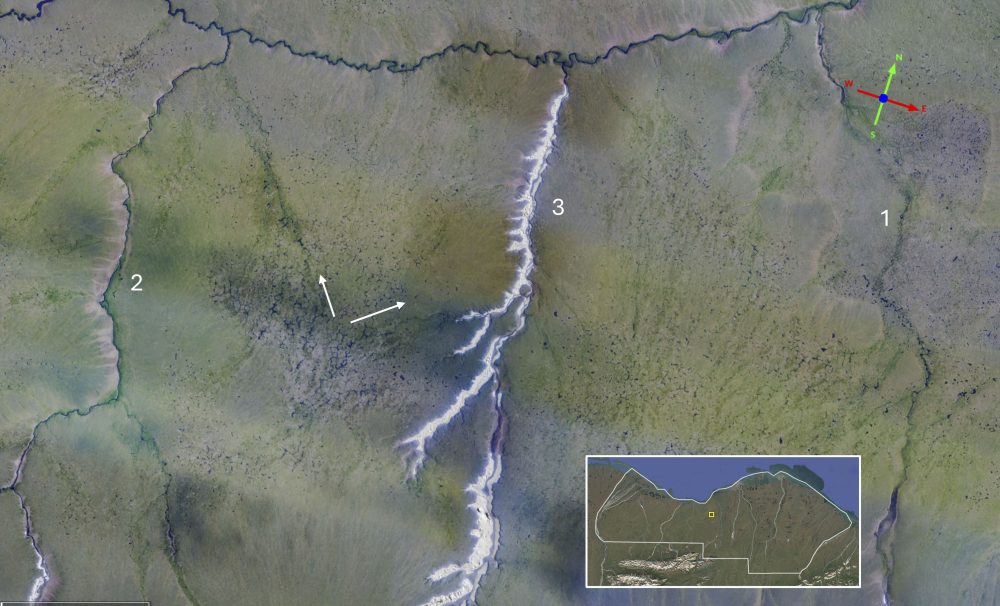
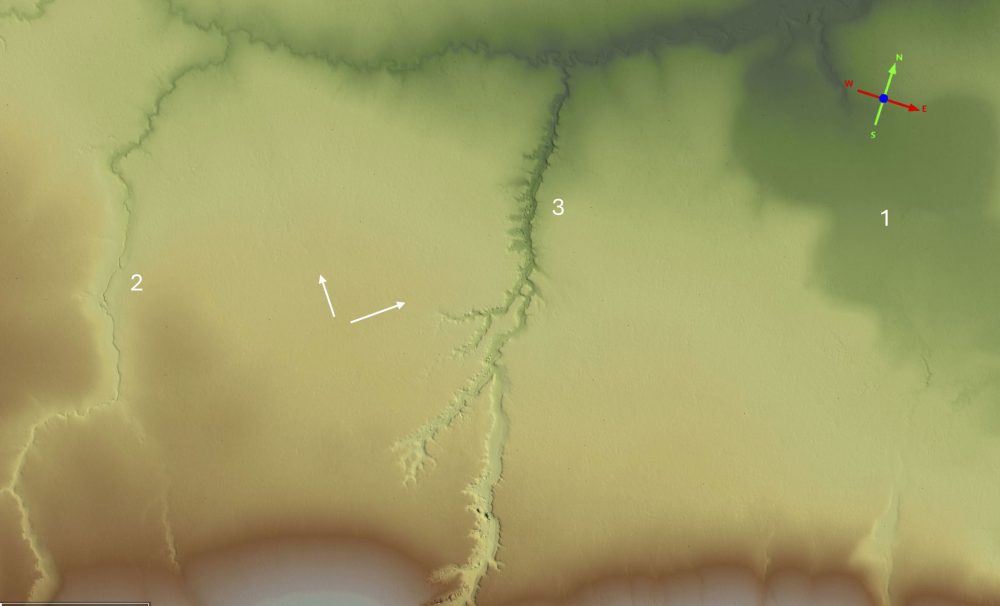
Streams are actively enlarging throughout the 1002 Area. Here we can see three streams draining northward in different stages of maturity in 2018 (left). The stream at right (1) is the least developed, winding its way through polygons with incised channels above and below it. The stream at left (2) largely follows existing topography, exerting a minor influence on it. The stream in the middle (3) is actively gaining new watershed area and beginning to compete with the smaller stream trending northwest (white arrows). Its reach is extending through use of snow which fills the incisions already created, weakening the ground by thawing it, helping erode it through snow melt after it is weakened, and creating a gradient to attract perched water bodies from its surroundings. The 2018 topography (right) makes the impact of this land grab clear – dendritic networks fueled by snow drifts and degrading terrain are actively re-organizing the hydrologic pathways here and thereby affecting ecology, in part by removing the land surface itself and in larger part by draining polygons and thereby transforming their vegetation. This is geomorphology occurring in real time on a scale of months and years – to properly understand the vulnerabilities of this landscape to disturbance by seismic vehicles, we must first understand that the ‘natural’ state here is one of constant reorganization which we must track on the time scale of months and years that it is changing at. That is, vehicle ruts triggering hydrologic incisions can further trigger drainage within the interior of the seismic grids with similar positive feedback dynamics as the dendritic branches seen here.
Streams are actively enlarging throughout the 1002 Area. Here snow drifts seen in 2018 (visually white at left, colored green as a change in topography at right) have weakened the terrain to help incise this stream deeper into its channel. This deepening tilts the gradient of the surrounding land towards it, promoting perched water bodies to flow towards it by creating newer channels. Four years later (right), well above the long-lasting snow drifts from winter seen in summer (left), ice wedges are melting out to over a meter’s depth, forming what will become new dendritic branches of this stream. A positive feedback exists here with ice wedges being exposed along their sides (rather than tops) along a slope and melting rapidly, snow filling the wedge cavities in winter insulating against the winter’s cold, snow melt warming the ground quickly in spring, an increased topographic gradient drawing new perched water bodies to flow thermally erode these wedges further, all creating a large snow trap for increased drifts next winter after which the process continues.
Ice wedge melt is pervasive and reorganizing stream hydrology
Large areas of previously undrained terrain are becoming linked hydrologically due to melting of the ice wedges, which underly nearly the entire 1002 Area, meaning that the entire 1002 Area is rapidly becoming fully covered by streams; these linkages are chaotic and inefficient rather than linear in shape as they are initially not drainage features but polygonal melt features. Any disturbance, such as linear ruts of 10-30 cm left by seismic vehicles, could create more efficient linear drainage channels or enhance the melt of already degrading ice wedges. As with lake watershed areas expanding, stream watersheds are now appearing where none did before. This means a fuel spill tomorrow will have a much bigger impact than it did yesterday because the landscape is now hydrologically connected in a way that it was not before. Similarly, any disturbance such as vehicle ruts can change the directionality and size of these new, still-forming watersheds.
Ice wedge melt is pervasive and reorganizing hydrology. Here a drainage network has formed and stabilized within a polygon field, as indicated by the greener color in the 2018 image (left) suggesting the depressions have filled with new vegetation and slow-moving water. Flow through these network is probably weak and low, as indicated by the lack of standing water, meaning the water must weep its way through semi-aquatic vegetation. Numerous perched water bodies appear to have no connections for drainage, in part confirmed by their existence as puddles. Four years later (right), a 3 m (dark green) channel has been eroded through several ice wedges, something likely only possible by thermal erosion of water flowing over them, meaning a large enough watershed has been captured to create a more efficient drainage network like this. Signs of this networking process expanding in the surrounding areas are pervasive in the 1002 Area.
Ice wedge melt is pervasive and reorganizing stream hydrology. Here is a polygon field near the coast which appears to have gone through at least one cycle of degradation and stabilization. However, there is ample standing water perched on a slope here, on ice wedge depressions that have already widened due to subsurface melt, indicating that this flooding is recent as of 2018 (left). By 2022 (right), many of these perched water bodies linked together and began flowing downhill (north) to the coast, taking several entire polygons with it, as indicated by the 10 m wide loss seen in the profile and difference image. The scour was not deep, only about 50 cm, perhaps due to previous stabilization which infilled deep cavities with dirt. Regardless, it is clear that prior stabilization is no guarantee of continued stabilization, so care needs to be taken to ensure that a 10-30 cm vehicle ruts will not trigger the same process as seen here.
Streams are actively enlarging throughout the 1002 Area
Streams are actively enlarging throughout the 1002 Area. This stream winds it way through degrading polygons, with those closest to it likely stabilizing as indicated by their greener color and absence of standing water in their troughs. Likely weakened by the snow drift, a small tributary beneath the profile line in this 2018 image (left) is about undergo a major transformation. The erosion that occurred by 2022 (right) is over 2.5 m deep in places, something which can only occur through thermal erosion of water flowing over it or melt of the wedge exposed broadside, meaning that this ice wedge channel has efficiently secured a large watershed full of perched water bodies that now freely drain through the cavity it has left behind. Over time, this channel may stabilize or more likely it will fill with snow and continue to expand its reach, as it likely had for the past 4 years, until there is no new watershed area above it.
Streams are competing for new watershed area
These chaotic stream channels can either find a new outlet downstream or a new connection upstream, both of which enhance flow and can cause the flowing water to thermally erode 2-3 m of depth in some of wedges that make up that network, essentially creating new watershed areas with lasting drainage into existing streams or rivers. Linear ruts of 10-30 cm left by seismic vehicles could accelerate this process of linking new watershed areas to new inlets or outlets, rapidly transforming the ecology of the newly drained and flooded landscapes.
Streams are competing for new watershed area. This transect crosses a degrading polygon field where the water is clearly flowing in two directions to meet a more established stream. The ice wedge topography of that transect is essentially level to within about 5 cm (black line in plot on left image). That is, it is the topography of the melted-out cavities that matter for hydrological routing, not the surface topography. The changes in topography (right) are as large as the topographic variations themselves — the ice wedge melt is on the same order of magnitude as the topographic slope. That is, ice wedge melt in this area and upstream of it is on the order of 10-40 cm, meaning that it is essentially unpredictable to determine through which outlet this field of perched water bodies would drain. Someone driving a metal-tracked D9 pulling a hotel for seismic workers over terrain with this sensitivity will likely alter the directionality of hundreds or thousands of acres of drainage.
Streams are competing for new watershed area. A low hill near the coast is filled with degrading ice wedges (black dots) which are increasing in connectivity and available watershed for surrounding streams. Surface topography of the hills and the streams guide the locations of the outlets, but which outlets will gain the largest share of this watershed is unpredictable. Arrows trace the location of current drainage paths for two adjacent streams. The topography of the bottom of the wedge depressions of the adjacent networks is within 0-15 cm for much of its length, yet ice wedge melt is only in its initial stages as indicated by the depression depths of only 10-30 cm. With thermal erosion caused by the sudden linkage to perched water bodies that have already linked, ice wedge melt of 1-2 m is possible, but the location unpredictable, meaning that much of this landscape could drain into any of several different outlets. A grid of 10-30 cm deep ruts from seismic operations could lead to rapid drainage of this hill top in directions nature never would have utilized, causing an ecological response that is more rapid than natural processes would, potentially creating ecological trajectories nature never would have.
Streams are competing for new watershed area. As in the prior examples, the ice wedges on the hillsides of this stream are degrading, creating new watershed area with enhanced connectivity to the stream. Where these new connections will form to the existing stream are unpredictable, unless someone drives a heavy vehicle leaving ruts to guide the water.
Watertracks are degrading too
The larger, steeper foothills of the western 1002 Area are often characterized by curvilinear watertracks rather than chaotic polygonal drainage channels, but the ice wedges beneath these tracks are also melting and subsiding. Given their linear nature, they are especially prone to linear disturbances from seismic vehicles, such as mechanical scuffing, removal of vegetation, or compaction of snow.

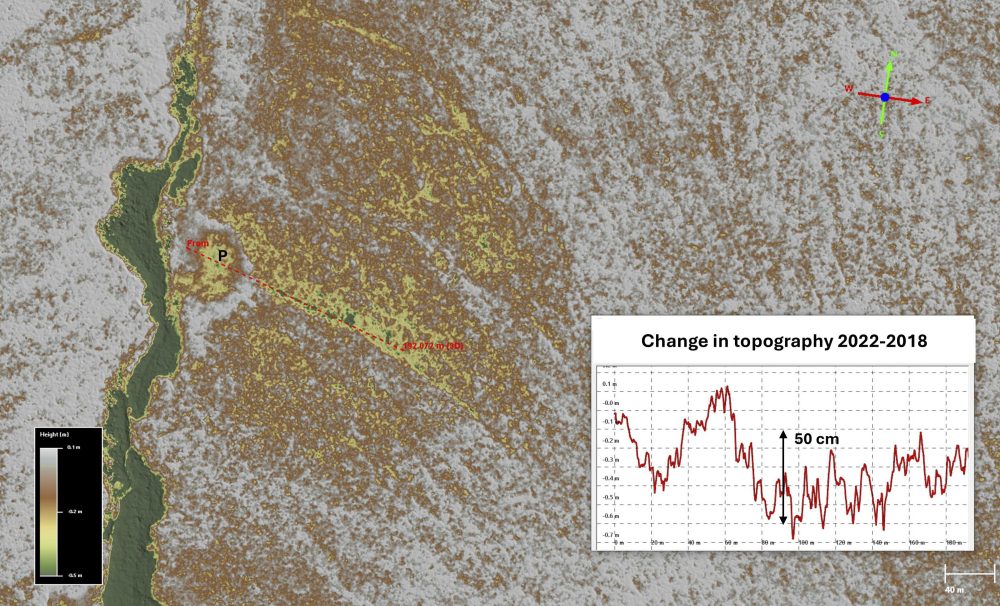
Watertracks are degrading too. The larger and steeper foothills in the western side of the 1002 Area are often covered by watertracks, curvilinear drainage features that are parallel to one another following the slope’s gradient. They are a more efficient and mature drainage pathway than the chaotic polygon networks forming elsewhere, but they are still immature and do not incise or become dendritic like non-permafrost terrain does, largely because the ground is frozen during snow melt and there is not enough rain water to cause erosion. All of these watertracks are underlain by ice, whether polygonised ice wedges or massive yedoma. Regardless of type, these watertracks show signs of degradation from 2018-2022, here 30-70 cm in depth. These natural drainage features are susceptible to accelerated degradation caused by seismic vehicles travelling parallel to or on top of them with insufficient protective snow cover. In this case, enhanced drainage through the degrading watertrack is causing ponding (P) below within the snow drifts left from winter.
Sensitivity of coastlines to disturbance by seismic operations
As we tend towards an ice-free Arctic Ocean, storm and wave intensity has been increasing on the coast, causing some of the fastest rates of coastal erosion in Alaska here, losing considerable habitat and threatening paleontological sites. Coastal erosion here is among the largest in the country. Perhaps more insidiously, the coastlines are now receiving more drainage than they have in centuries due to new watersheds forming above melting ice wedges. The interactions between coastal erosion and ice wedge melt inland are rapidly transforming the hydrology here, making these coastal zones especially vulnerable to disturbance by seismic vehicles.
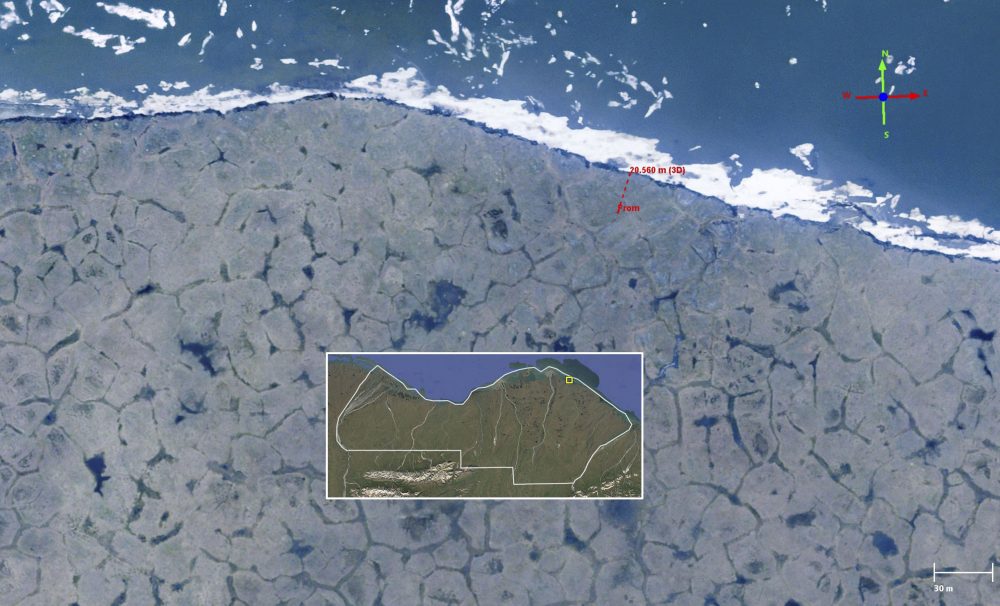
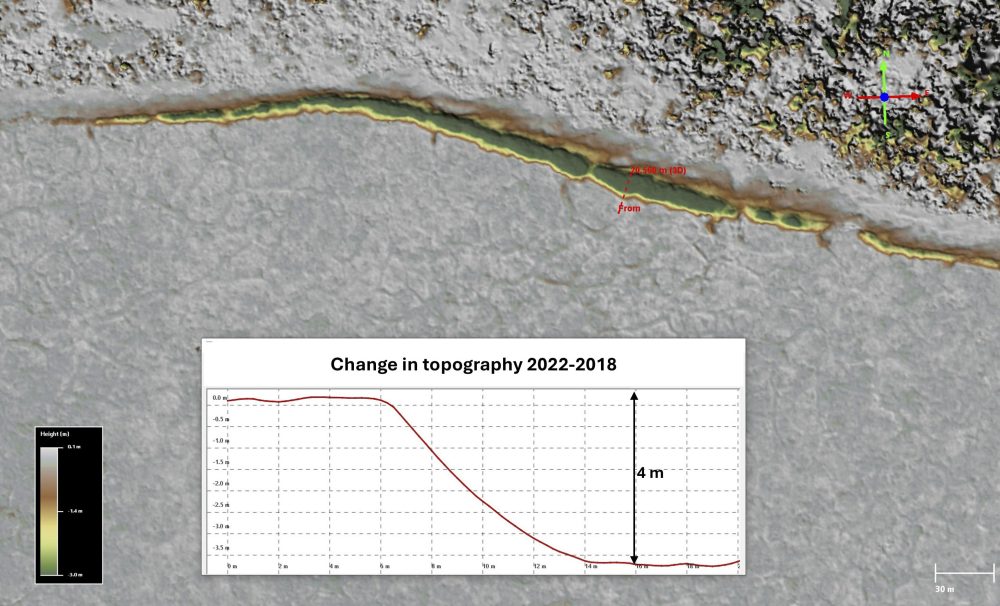
Coastal erosion is pervasive. A major intensifying factor for the increasing coastal erosion is the reduction in sea ice cover over the past decades. Sea ice limits open water fetch and therefore wave intensity, so the longer the open season the more storms with strong waves we can expect. At left, landfast ice had disappeared by 2 July 2018. By July 2022 (right), over 300 m of coast had eroded back as much as 6 meters wide the 4 m deep. Once this ice-rich land is eroded, the underlying ice is exposed broadside to the sun, weakening it and thereby making it is easier to erode by the next storm.
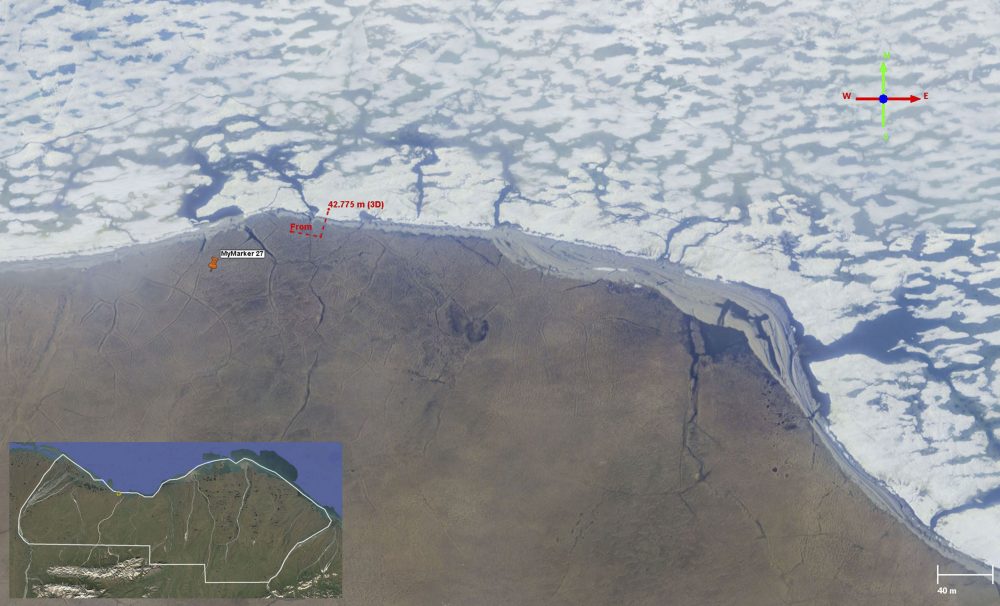
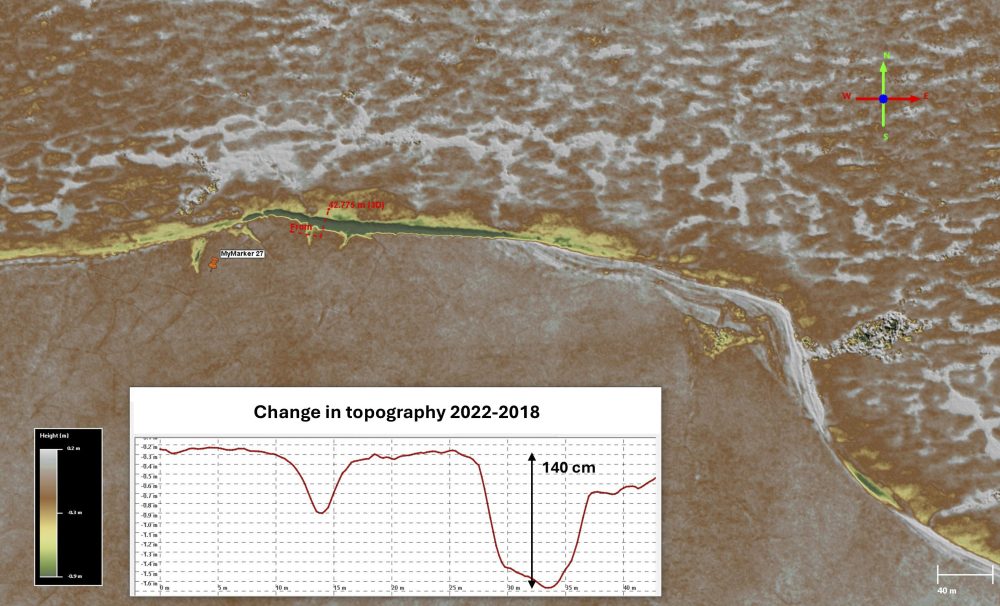
Coastal erosion is pervasive. Coastal erosion is large, increasing, and pervasive, especially in the eastern side of the 1002 Area though here near Camden Bay as well, seen here in 2018 (left). Here about 200 m of coastline has eroded back up to 5 m to about 1.5 m depth between 2018-2022 (right). Some aggradation has occurred in east side of this image (colored white).
Coastal erosion leads to hydrologic reorganization inland
Coastal erosion exposes ice wedges and massive ice broadside to the sun throughout their depth, causing complete melt. The cavities left behind trigger the formation of new stream channels by creating new topographic gradients for perched water bodies inland to flow into, creating a positive feedback in which streams continue to grow inland. Massive ice from ancient glaciers and yedoma exists near the coast and exposure of this ice can (and has) caused many meters of erosion in single storms. As these coastal streams continue to grow they compete for new watershed areas inland. Many of near-shore areas did not drain previously because there was not a sufficient topographic gradient to drive flow, so the intrusion of the streams from the coast drains into these regions and creates new watersheds – areas that were not previously draining are now, transforming the ecology here. Linear ruts left by seismic vehicles could accelerate this process considerably as linear drainage paths are more efficient than the chaotic drainage paths around polygons.
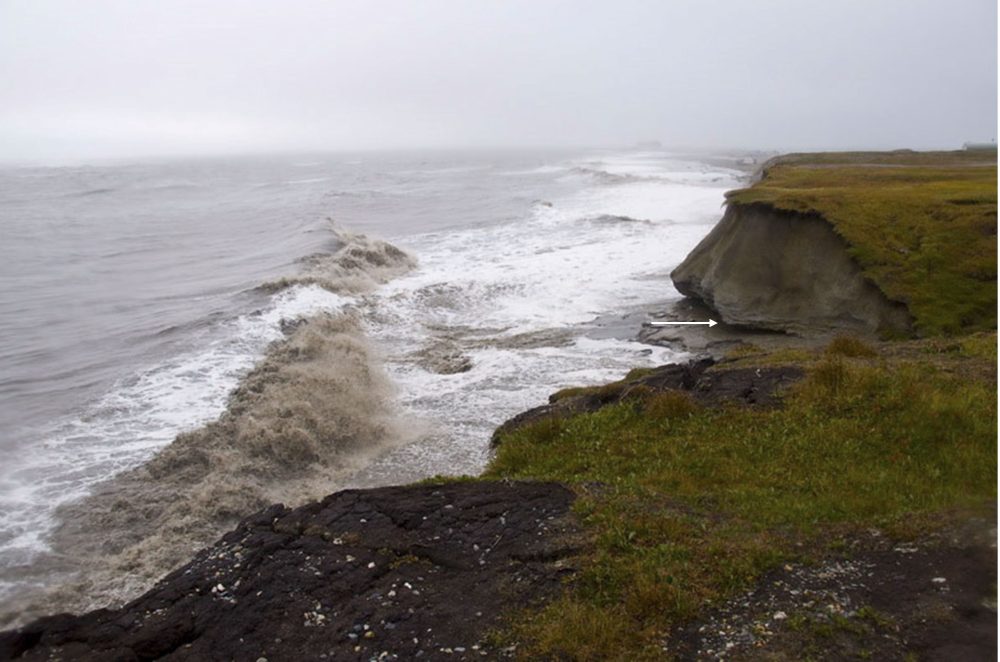
Coastal erosion leads to hydrologic reorganization inland. In this July 2008 storm, the ice-rich bluffs of Barter Island are being undercut by wave action (white arrow). This leads these cantilevered blocks to rotate and break off from the mainland due to overhanging weight, creating meters of coastline retreat in an instant.
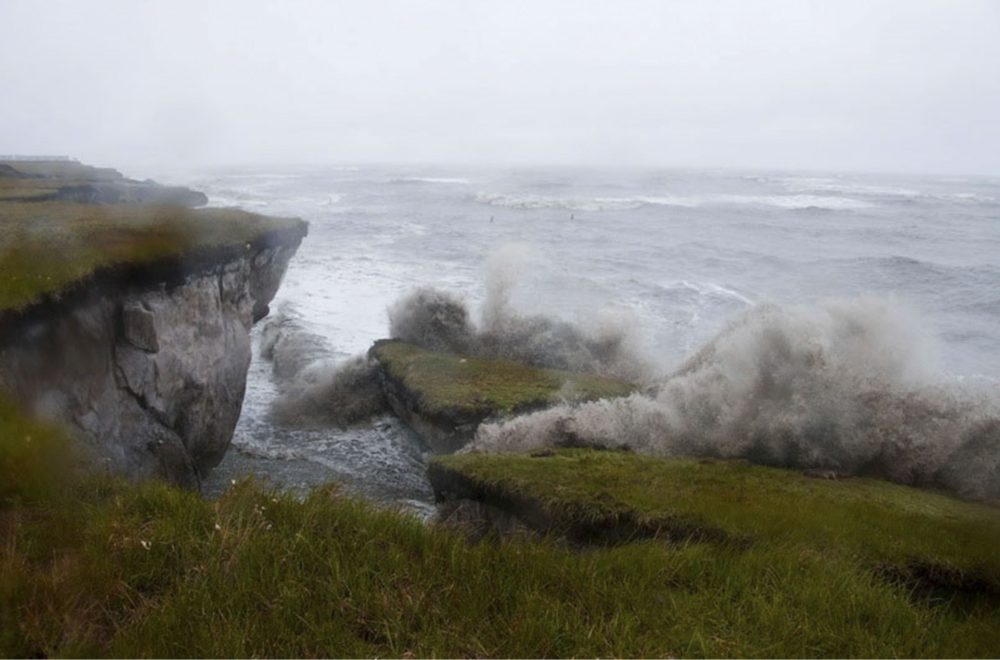
Coastal erosion leads to hydrologic reorganization inland. Once the blocks fall, they are rapidly destroyed by wave action as many of them are mostly ice. Looking down the coast here, many blocks have been lost this way and massive ice is exposed beneath the nearest cliff.
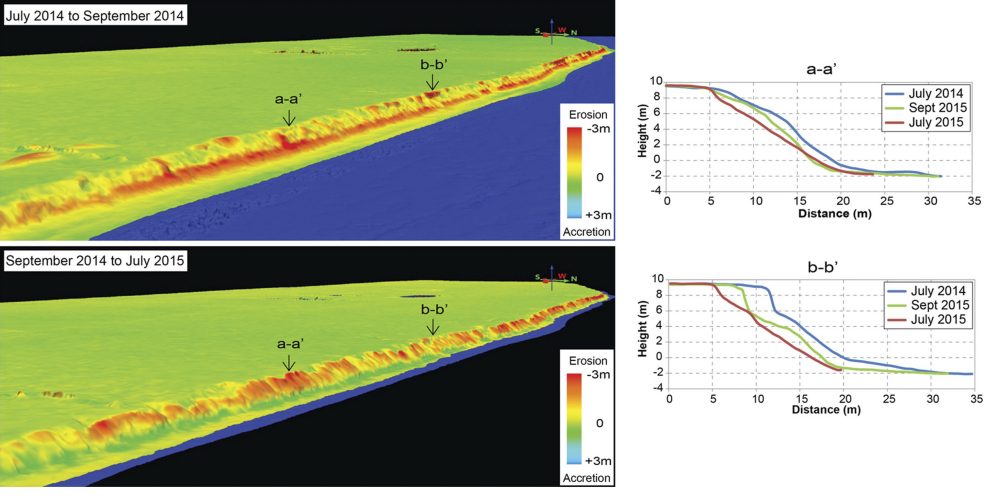
Coastal erosion leads to hydrologic reorganization inland.I’ve been mapping and measuring coastal erosion on Barter Island since 2014. Here you can see 5-10 m of retreat occurring over nearly the entire north side of the island. You can read more about this here.
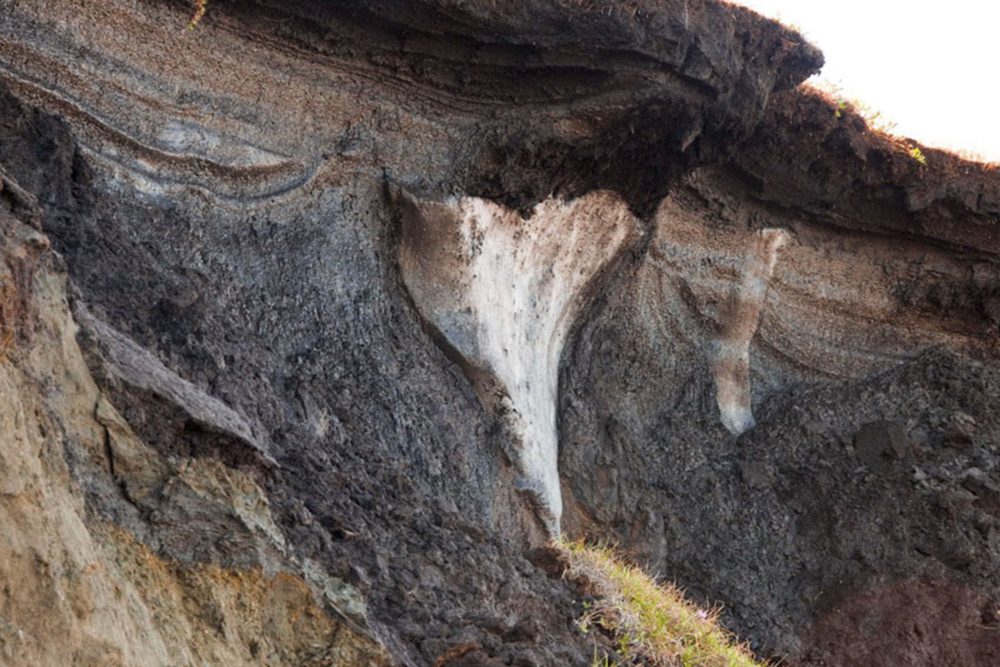
Coastal erosion leads to hydrologic reorganization inland. Ice wedge polygons reach the coast through the entire 1002 Area. Here one is nicely exposed by block rotation during a storm. Note the soils above it. The ice wedge melt causing the rapid reorganization of hydrology inland is also largely occurring beneath soils and vegetation as well, and often the water we see at the surface is perched over soils like this. These wedges therefore have some natural protection against melting completely because this coverage helps to stabilize them, until they link into stream channels which can thermally erode them further beneath the soils. On the coast, however, the broadside exposure of this wedge will cause it to melt completely in the sun. This process occurs pervasively along the coast – as these ice wedges are exposed to the sun, they melt and create new drainage channels which create a positive feedback for attracting new watershed area. These ice wedges must be protected from being exposed in this way directly by seismic operations or in a manner triggered by them, whether on the coast or inland.
Coastal erosion leads to hydrologic reorganization inland. In the 2018 image (left), snow drifts can be seen filling cavities of ice wedges that were exposed broadside by coastal erosion (as in the previous photo of the ice wedge). These snow drifts insulate the summer-warmed ground in winter, promoting further thaw the following summer and facilitating further coastal erosion. White arrows mark the limit of the snow drifts to distinguish snow melt from ice wedge melt in the change detection map (right). By 2022, new stream channel formation is extending inland, stimulated by coastal erosion that exposed ice wedges, to depths exceeding a 1 m. Now that the depressions have created a gradient (a place for perched water bodies to flow into), these channels will likely continue to expand, creating new watersheds by draining areas that previously were not draining.
Coastal erosion leads to hydrologic reorganization inland. In 2018 (left), an inland area is already being drained through ice wedge cavities that have already melted out by this process and linked together, as indicated by the water flowing over the snow at right (black arrow, left image) and the liquid water visible between the polygons (white arrow, left image). By 2022 (right), the thermal erosion caused by the moving water has not only melted out these wedges another 1-1.5 m but has completely washed away several polygons as indicated by the profile and change in topography. Substantial coastal erosion has also occurred, as can be seen by flickering with the previous figure. All of these losses of terrestrial landcover have an ecological impact both locally and in aggregate given the pervasiveness of such changes. Seismic ruts along this coastal area would only serve to accelerate the permafrost degradation and ecological changes here.
Coastal erosion leads to hydrologic reorganization inland. Here are some the deepest melt depressions along the coast formed by this process, at the bottom of Camden Bay in 2018 (left). They now are large enough to collect snow drifts large enough to persist through much of summer. But they are still actively enlarging too as seen in the difference image (right).The snow drifts filling in these newly-incised channels are over 3 m deep (dark green). This depression gives surrounding water bodies, previously perched, a place to go and a gradient to get there. As can be seen surrounding these deep channels (eg, red transect), ice wedge melt is pervasive and will continue to expand the size of these features as has clearly been occurring. At some point, a large storm may breach the beach, flood these, and expose them to erosion by wave action and thereby increase the vulnerability of all the land in view here to erosion from intensive storms which can undercut these bluffs and expose ice wedges broadside.
Coastal erosion leads to hydrologic reorganization inland. That these processes of stream formation are at work pervasively along the coast is indicated by the liquid water spilling onto the sea ice (white arrows, left image). Which outlets garner the most watershed depends on many factors, age and luck being among the most important likely. As these coastal streams work their way inland, they begin to compete for watershed area, as seen here by the red transect, hundreds of meters inland. In the region of the transect, ice wedge melt is pervasive at the 20-30 cm level (right plot). But the topographic variation is also on that level (left plot), meaning that it is essentially unpredictable which of the chaotic pathways water will choose to drain into. I would prefer that seismic vehicles not control the outcome.
Conclusions
While the Muries, Collins, Sumner, Hunter, Carter, and the many more that fought for politically protecting this landscape could not have predicted the exact changes I have documented here, they recognized that the ecology here was controlled by a landscape that was sensitive to the environment and operating at the margins of existence compared to temperate latitudes. In the Amazon rainforest, there are a huge amount of nutrients and life within each acre — in the Arctic this same amount is spread out over thousands of acres. That’s why they worked so hard to set aside such a huge area — it’s a density issue. Essentially, the web of life has a much looser weave here.
The 1002 Area is undergoing the largest change to its plant ecology in probably millennia, due to a massive reorganization of hydrology caused by the melt of ice wedges that underlie this entire area in response to climate warming. While this is worth understanding for its own sake to predict the impacts of the Porcupine Caribou Herd, it is especially important for predicting the impacts of seismic operations as they have the potential to accelerate this process and take it in new directions which nature would not have faster than the caribou can adapt to, tearing a hole in the loose weave of ecology here.
The regulatory guidance on seismic operations in the 1002 Area makes no mention of understanding this. It treats the tundra as a frozen wasteland in winter that seismic operations can work indiscriminately on without fear of damage. And thus without fear of meaningful oversight.
If we want to prevent this outcome, we need to do something before work begins this winter.
So what can you do?
Educate yourself. Read the previous blog and next blog in this series, the report I derived them from (and the references therein) to understand these dynamics: the connection between the landscape and the ecology. Then read the regulatory guidance and compare it to the recommendations I’ve made that would ensure that seismic operations would not alter the landscape, its hydrology, and its ecology and ask if these recommendations are anything more than common sense for taking responsibility for preventing irreparable harm.
Spread the word. Call or write your politicians, your favorite non-profit, and the regulatory agency and let know them know your opinions about what you consider important out here. Motivate them to educate themselves the way I have tried to motivate you.
Support my research. Yes, this is a shameless pitch for funding. It’s really expensive working out here and all of the fodar data I’ve shown you here was funded out of my pocket. So if you’ve found what I’ve done here useful, please consider paying it forward so that I can continue to do more of the same. This is a perilous time for science in general, with Federal funding for anything useful being almost entirely eliminated. But it’s especially severe in this corner of the Arctic and regarding this issue — the Federal government is not going to voluntarily fund anything that might get in the way of its goals, so who will if not you and I?
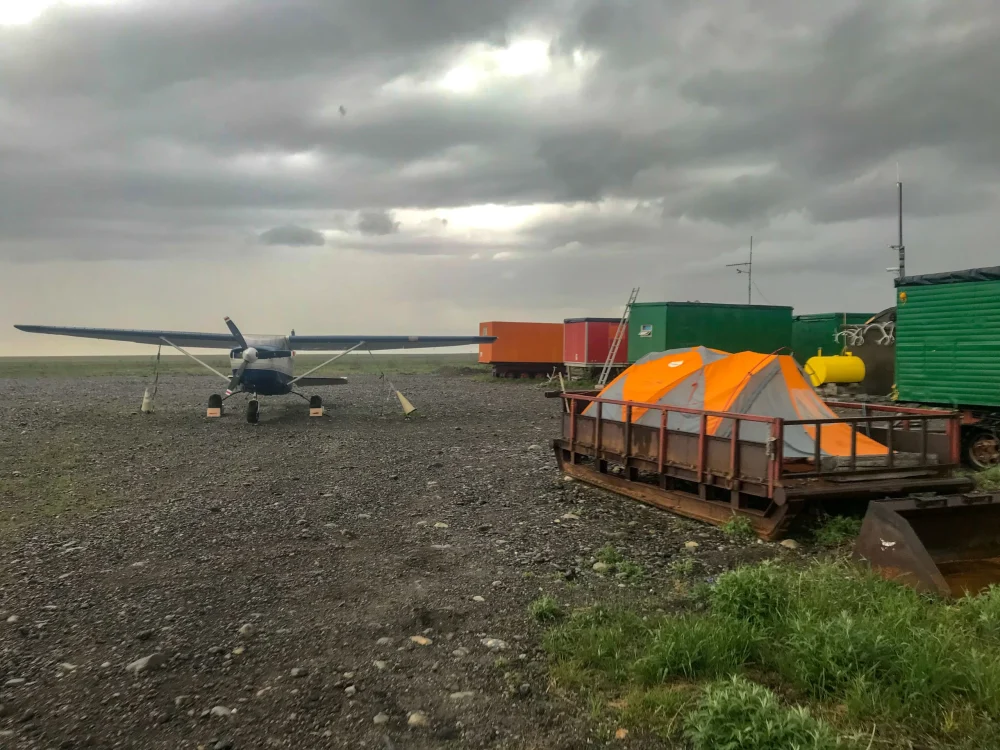
No one pinches scientific pennies harder in the Arctic than I do. For the month or so it took me to map the entire 1002 Area in 2018, that tent was my bedroom and office to cut my costs. For that matter I learned to fly and bought that plane because I couldn’t afford to do this mapping otherwise (and neither could anyone else…). For example, if I was chartering a plane for this work, sitting here this day not flying due to the stormy weather would have cost $3000 in standby time (just for that day!), but cost me nothing except a dry towel in a leaky tent. Similarly, hiring a name brand commercial mapping company to do this work would have cost $3M easy, but I bought a plane and did it myself for 10x less. Even so, it’s still really expensive to work out here.
You can find a GoFundMe account here that I’m trying to raise funding to complete a mapping project this summer which I believe is the only way we can stop seismic operations this winter, as described in the next blog.
You can also click here to donate $17/month to help support these and similar goals. If only 250 people did this, I’d have enough aviation fuel and support to cover the bulk of my field costs each year studying the permafrost, glaciers, ecology, and coastlines here from the air and ground. That’s less than a bottle of decent wine — are there 250 people out there that think protecting the Arctic Refuge is worth one less hangover each month? Everyone that subscribes also gets access to my monthly newsletter describing my research, which I guarantee wont leave a hangover…
