

Is there enough snow in the 1002 Area to keep seismic operations from harming the Porcupine Caribou Herd?
In late 2017 when the law passed to open the 1002 Area to oil development, the first thought that popped into my head was “If they don’t change their methods they are going to turf this place up permanently with seismic operations”.
By this point I had been leading a field program on the glaciers here for 15 years and had grown attached to the tundra that I once found an annoying inconvenience to have to fly over for an hour to get to my ice.
I kept coming back to wondering: How I would feel next year flying over this tundra if it was covered by a 200 m x 200 m grid of tire tracks? Annoyed, for sure, by them not putting science to full use to prevent that. But I realized the real question to me was: How would I feel about seeing that checkerboard knowing that I didn’t give it my all to try to stop it? Pissed off, at myself. I can ignore people I’m annoyed with, but I can’t escape myself and couldn’t shake the thought of seeing that checkerboard in my scientific backyard forever.
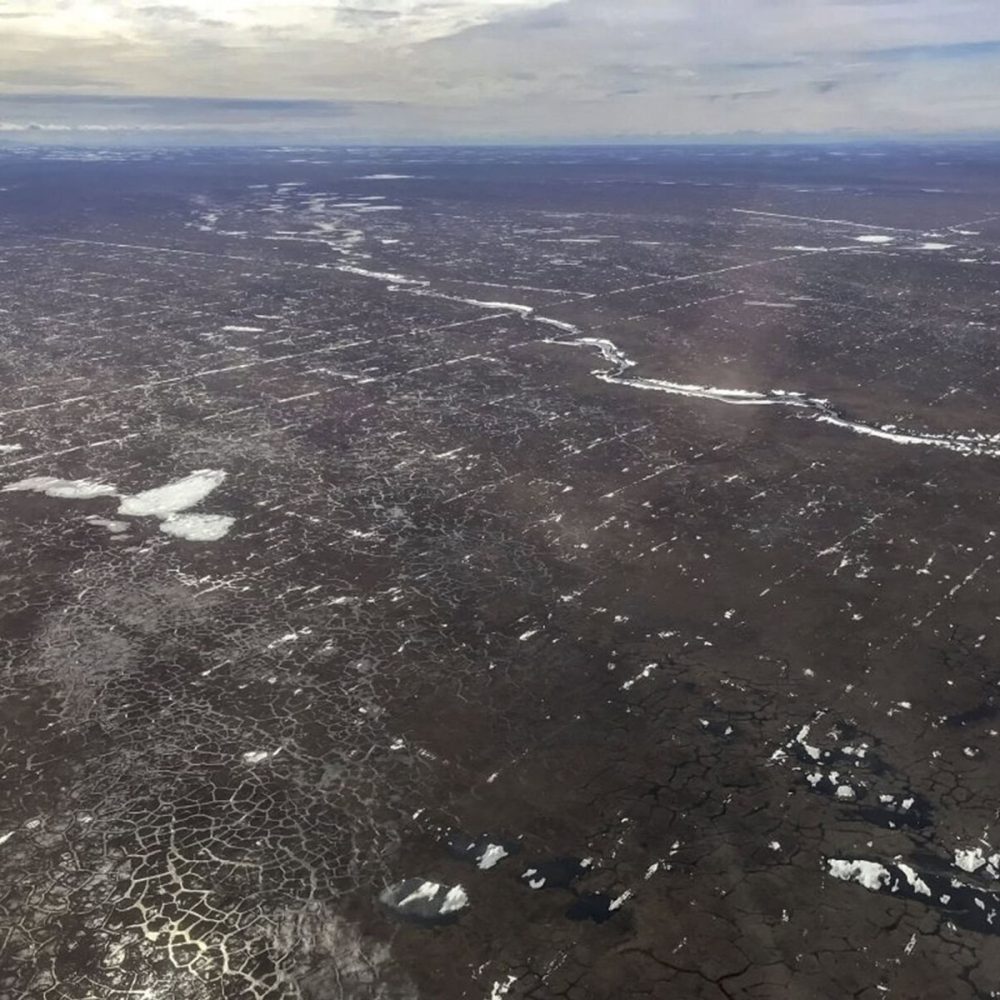
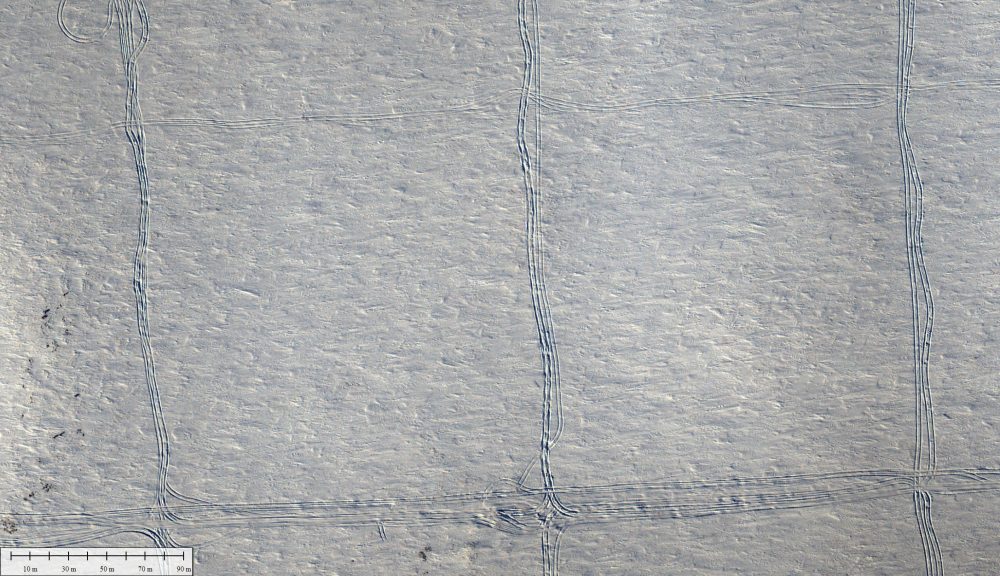
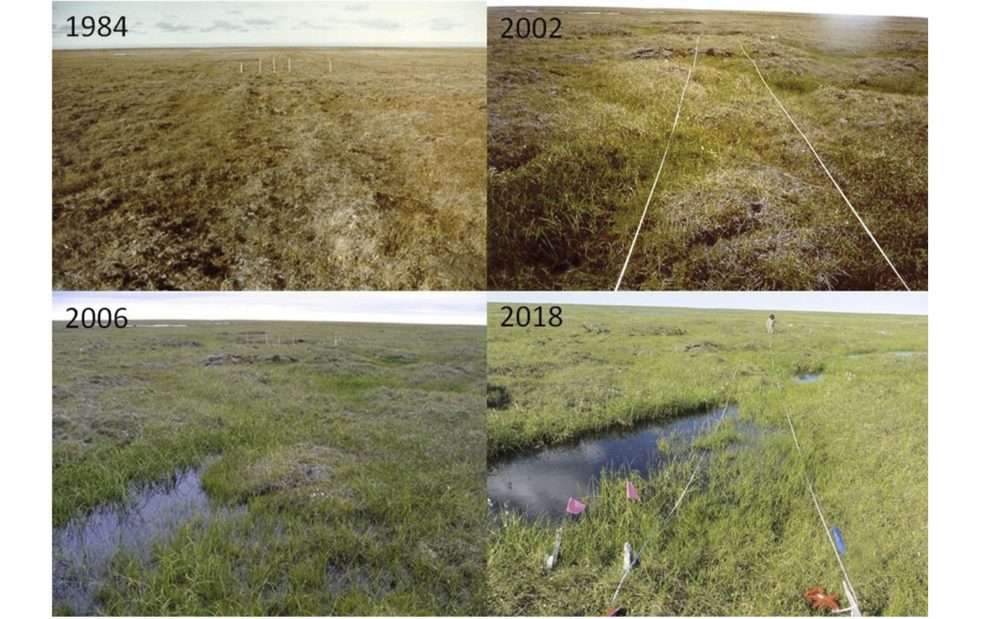
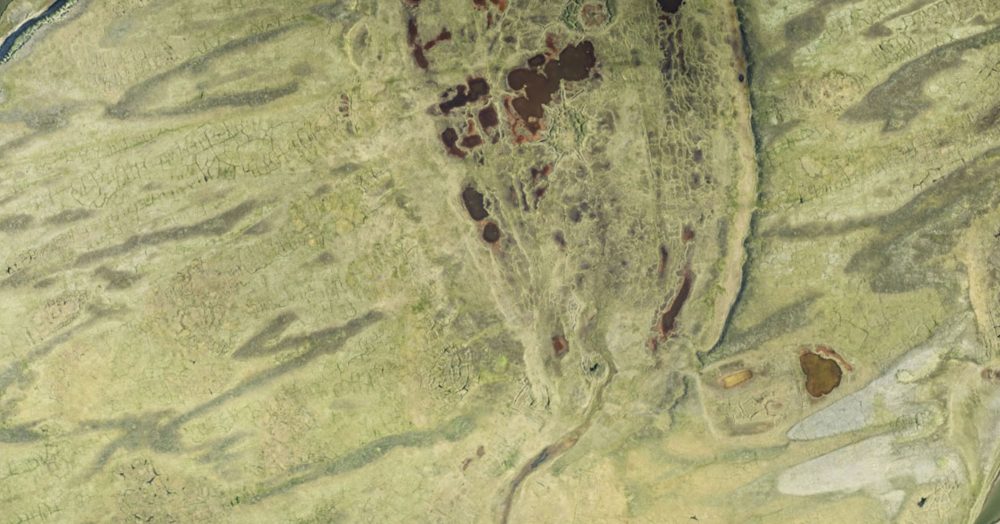
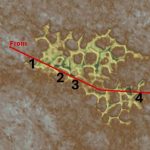
This is what I did not want to see in the 1002 Area. Studies of seismic operations in the 1002 area in 1984-85 showed that many vehicle these tracks like these remained visible for decades, though fortunately there were far fewer of them then.
That being said, I’m not opposed to seismic. My PhD was in seismic operations very similar to this. I’d love to see the subsurface in 3D and learn how it’s connected to what we see above ground. If I could get that information from my airplane, I’d totally do it.
What I’m opposed to is conducting seismic irresponsibly, which to me means leaving a checkerboard behind or impacting the ecology in any way, particularly caribou ecology.
Seismic data is just that: data. The fact that these data might be used to attract oil companies to drill here doesn’t change the fact that acquiring seismic data is no different than acquiring glacier data or plant data or caribou data – if we are opposed to collecting seismic data because it might lead to drilling, then we are opposed to Science itself. I don’t care whether you are doing it wearing a red hat or a blue hat, banning or preventing science we don’t think will work in our favor is a slippery slope none of us should go down because we know where that leads: Science doesn’t screw up the environment, using science irresponsibly screws up the environment.
So I went to all of the nonprofits working here to try to get one of them engaged in restoring sanity to this process but all I got were blank stares because all they were thinking about were gravel roads and oil wells that were to be built in 10 years, not what could go wrong with the 40,000 miles of overland travel that might happen this winter. Seismic operations simply were not on their radar.
Next I went to a senior colleague who is the leading expert in permafrost ecology to try to engage him so that he could use his clout to hopefully engage a broader scientific team that might be able to talk sense into the oversight Agency. He understood the ecological challenges much better than I, a glaciologist, but warned me against taking a stand: “They are going to do it anyway and you’ll just harm your career”. He told me the story of trying something similar 20 years earlier with the only result being our State’s main Senator at the time viciously coming after him personally.
Motivating others was never my strong suit — at this point I realized that I needed to do something more than try to get other people to do something…
I realized I needed to maximize my own strengths to target the weakest point in this clearly political process.
My greatest strengths at this point were that I was self-employed (having recently left my Professor job after 17 years) so I had as much time on my hands as I wanted, I had a couple of airplanes capable of making awesome topographic maps, and I had a chip on my shoulder against people using science irresponsibly to screw up my scientific backyard.
The greatest weakness of this political process as I saw it was arrogance and complacency. The 1002 Area is the most remote wilderness in the country, only a few thousand people visit there each year and it is so massive that anyone visiting only sees a tiny fraction of it. So, based on the level of oversight effort I was seeing and the ramrod push to start work immediately, I figured the powers-that-be thought ‘Out of sight, Out of mind’ and they could pretty much get away with whatever they liked.
Enter fodar.
I don’t think anyone in the power structure at the time was prepared for some yahoo from Fairbanks to spend the summer topographically-mapping the entire 1002 Area with sufficient resolution to see tire tracks. Until I developed fodar, such map-making tools cost a million dollars, literally, and a name brand commercial company mapping this entire area commercially at that resolution would likely charge 3-5 million dollars. But my direct cost was just fuel for the planes I already had – was the cost of fuel worth more to me than having to fly over that checkerboard for the rest of my life knowing I did nothing to stop it?
So I figured I might not be able to stop this madness by playing by the normal rules, but I could make sure that the world would see whatever happens out there in glorious 3D detail by making a before-and-after comparison.
That is, I could shine a spotlight where they were expecting darkness with the faith that people always behave better when they know their peers are watching.
With fodar, I could bear witness like no one else in the world could. That was my superpower targeted at their weakest point.
So I packed up the plane and headed north in late June 2018. When I arrived, I found seismic work had been conducted the past winter just over the Refuge’s boundary, with the grid pattern standing out like sore thumb because the smushed snow in their tracks had not yet melted.
What a bonus! At that time, I had never mapped tire tracks in the tundra before, so I wasn’t entirely sure whether I could – here was my chance! So I mapped a bunch of the area by eye, then circled for more than an hour to get an oblique photo with my phone right then, because I knew this might be my only chance. I wanted to capture the feeling of the invaders at the gates – if we don’t stand together now, the checkerboard will find its way across the river this winter!
After a few days of mapping the seismic and the 1002 Area, I returned home to Fairbanks to process the data – I had to know how well I could map these vehicle ruts. Turns out – perfectly! I was seeing ruts from single centimeters to 50 centimeters everywhere I mapped. Fully confident now that I would be able to map the 1002 Area with sufficient resolution to see every tire track and disturbed tussock, I wrote a blog to put Big Brother on notice before heading back into the field to continue mapping.
A few weeks later I got a call from someone at the New York Times asking me questions about my work and asking if they could use some photos from my blog.
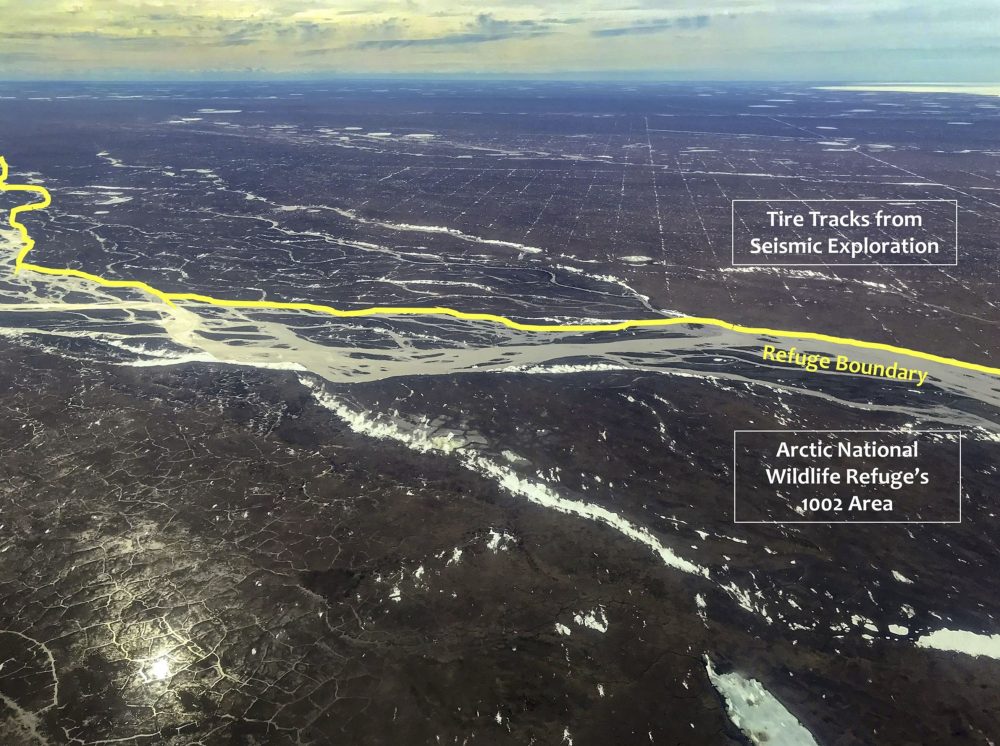
On my first day of mapping the 1002 Area in June 2018, I discovered that seismic work had been completed just a few months earlier, right up to the boundary of the Arctic Refuge. After topographically mapping some of those lines for science, I spiraled up to take this shot hoping to visualize for others what was about to happen in the 1002 Area if we did nothing to prevent it. A version of this photo appeared on the front page of the New York Times and the resulting spotlight on this topic could not be ignored, preventing seismic permits from being issued that year.
A few days later an article appeared on the front page highlighting my in-progess efforts.
Then things got really interesting. Seismic operations were now on everyone’s radar.
I got calls from colleagues in two different Federal Agencies saying that they had just been in meetings where they were told that not only were they not allowed to collaborate with me any more but they were not allowed to even use my name at work (they even called me from their home phones!). Given the two Agencies, this word could only have come down from the head of the Department of Interior, a Trump appointee. It turns out he was probing for the source of my funding and trying to shut it off, not realizing then that I was funding this myself.
I took all that to mean my foot squarely connected with his weakest spot – a direct hit!
Apparently having the impacts of seismic operations on everyone’s radar was exactly what they feared.
A senior academic colleague then called me “radioactive” and said he also had to distance himself from me. Apparently since my funding couldn’t be shut off, the funding of those orbiting nearby me was being threatened. That was an eye opening experience for me, to think that my pursuit of the truth was causing other scientists to shun me due to funding pressure. It had a lasting impact on me and behind the scenes I am still working on developing a system of funding science where no one will have to face that decision again.
The silver lining of this fallout for me came when the senior colleague I had originally asked for help called me to say that he was now all in and he was rounding up the cavalry. He didn’t say this directly, but I had the impression he saw me bringing a knife to a gun fight and felt sorry for me. Or maybe he wanted revenge for his incident 20 years earlier. In any case, the real experts on permafrost got involved and beefed up what I had been saying in my blogs with real rigor and we produced a white paper which we submitted to the public comments and turned into a peer-reviewed journal article a few months later.
The seismic permits were not issued that winter but it wasn’t until January though that I fully understood why. The top lawyer from the non-profit leading the legal challenges here called me and said “I have to eat my hat. When you first called us about the dangers of the upcoming seismic work we had no idea what you were talking about”. I told him I get that a lot and then asked him what kept the permit from being issued, assuming it was the polar bear issues. He said no, the polar bear permits were issued, “It was the spotlight you shone in the NYT article and the white paper that couldn’t be ignored, by us or the government. In my long career doing this work, I have never seen one person move the ball so far and so successfully”.
I was shocked and flattered in that moment, but the lasting impact was deeper.
I had just pulled something off that teams of paid lawyers couldn’t. How? By shining a spotlight that couldn’t be ignored. That is, the spotlight isn’t enough. The laws and rules are not enough. It has to be a spotlight that cannot be ignored. We see the opposite almost every day right now – corruption and bad behavior in the spotlight, but for now it is a spotlight that is, apparently, ignorable.
So that’s been my focus since – not just shining a spotlight, but shining a spotlight that can’t be ignored.
For me, that spotlight is Science. The Truth, as best I can determine and as best I can explain to others who can make that spotlight brighter.
But I can’t come in under the radar any more, the powers-that-be are on to me.
And that’s why I need your help – please don’t let the issues in this spotlight be ignored. Find your own way to use your own foot to kick them where they’d least expect it, like I did in 2018.
Introduction
In these blogs I’m shining the spotlight on these issues:
- Seismic operations here have the capability of causing significant harm to the Porcupine Caribou Herd unless new protocols are developed specifically to prevent this.
- To prevent such harm, we must know how much snow is necessary to protect the tundra, whether that much snow reliably exists in the 1002 Area, and whether the operators are following the regulations.
The first two blogs (theory and observations) in this series shone the spotlight on the first issue.
This blog shines the spotlight on how we can properly ask and answer the second issues using the current state of the art tools:
Section 1. How much snow is necessary to protect the tundra, ecology, and caribou?
Section 2: Are the current protective regulations actually working?
Section 3: Is there enough snow in the 1002 Area to keep seismic operations from harming the Porcupine Caribou Herd?
In short, the answers to all of these questions is that we don’t know because no one has ever asked these questions earnestly and tried to answer them with the state-of-the-art tools we now have at our disposal.
The text below describes both the need and possible solutions — there’s a lot of information there for those that want to dive in. If you just want suggestions on how to keep this spotlight from being ignored, then skip to the Conclusions.
1. How much snow is necessary to responsibly protect the tundra, ecology, and caribou in the 1002 Area?
The short answer is we do not know.
The general regulatory philosophy here is that by limiting overland seismic travel to winter over sufficiently thick snow, the tundra below will not be harmed. But what is “sufficiently thick”? As far as I or my colleagues can find, there have only been two studies that have tried to compare depth of snow at the time of operations to the severity of impacts. Both these studies are over 25 years old now and both were limited in their scope by the tools and funding they had available at the time. These studies indicated that 15-25 cm of snow often helped minimize the severity of impacts, but did not eliminate them. In the first blog in this series and later below, I show that regardless of whatever minimums are actually mandated they are either not working or are being ignored because significant, multi-year harm to the tundra is pervasive throughout the seismic operations I have mapped since 2018.
So what does responsible science look like?
The first step is to map snow thickness while seismic operations are ongoing so that we have complete knowledge of the depth of snow for every track made by every vehicle. I demonstrate the feasibility of this later in this section.
The second step is to map the severity of impacts in the following summers, including depth of vehicle ruts, impacts to vegetation health, and changes in hydrology. I describe this in Section 2.
The final step is to compare the snow depths to the severity of impacts to conclusively determine how much snow was required to prevent harm as a function of vehicle type and tundra type — that is, where did the work leave scars and where did it not and why?. I describe how to implement such information operationally in Section 3.
By implementing these steps with each new seismic project, we can improve our knowledge and increase our predictive skill in preventing further harm to the point, I believe, no harm at all occurs. We don’t yet have the data to combine steps 1 and 2 into something useful, but in the Conclusions I suggest a plan to do so that I would like your help with this summer — this help is time-critical because to stop seismic permits from being issued in the 1002 Area this winter using irresponsible regulations we need to complete this analysis this summer to ensure that if development occurs it is done responsibly by being based on science that will actually protect the landscape, not pretend just to.
That is, all of these steps are easily possible, affordable, and the technology available for a decade, but they are not part of the mandated protection protocols. So I’ve been trying to do them anyway and here I ask for you help in making it impossible to ignore this spotlight.
What’s the responsible way to measure snow depth?
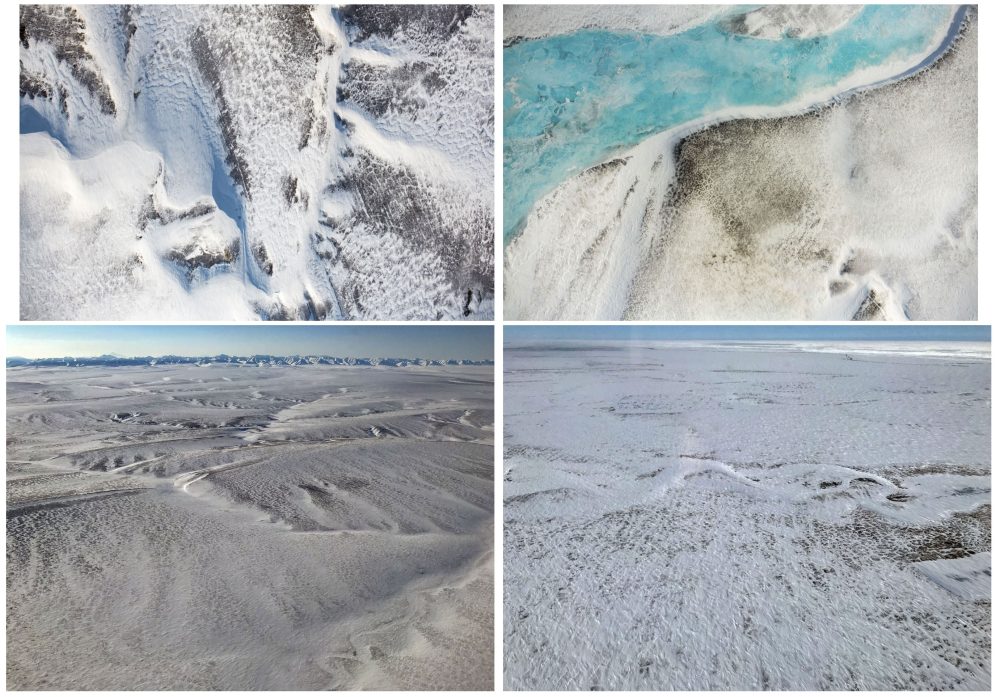
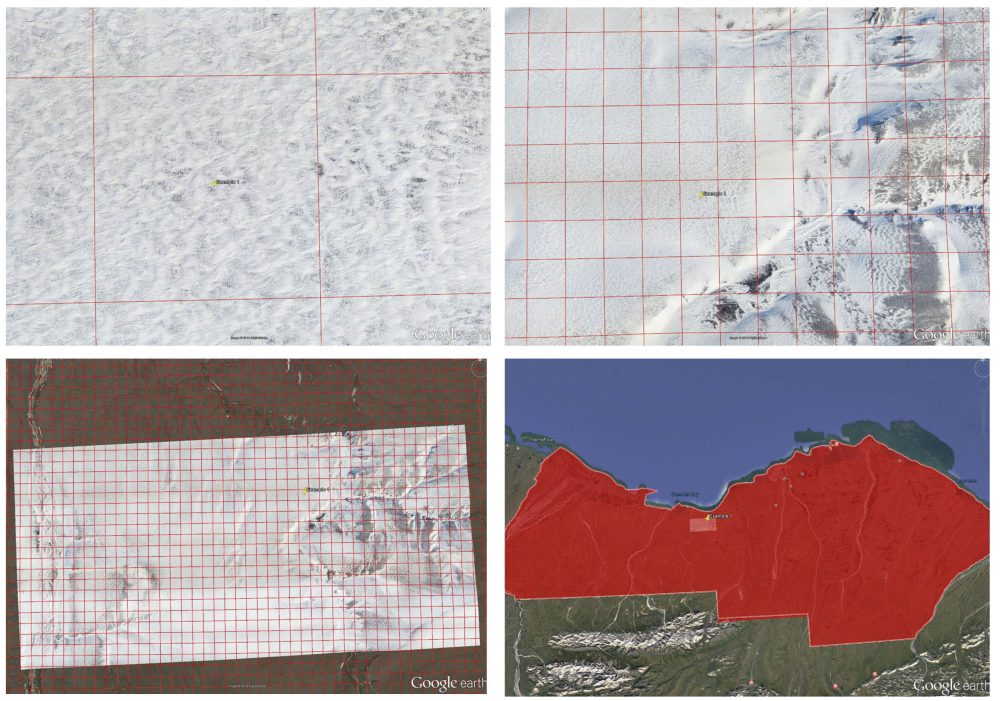
A fundamental flaw with the current regulatory approach is how snow depth is measured. Currently it’s done using several weather stations throughout a region — but how representative are these stations of that region? Section 2 describes these challenges in much more detail, but the photos below motivate the issue: snow depth is not uniform in the 1002 Area because the strong winds there scour and deposit what lands on the ground into persistent year-to-year locations of no snow or deep drifts. The only responsible solution in terms of permitting seismic operations here is to map snow depth prior to and during operations to avoid areas where the ground is bare or the snow too thin for protection.
Where do you want to put your weather station to measure snow depth remotely? Depends on the answer you’d like to get. That is, snow thickness in the 1002 Area is so variable that we have to map the entire region during seismic operations to figure out where it is sufficiently thick.
In the examples I show from NPR-A in the next section, I’m only measuring snow surface topography. Thus, I was only able to measure the depth of the ruts rather than the depth of the snow that existed before the ruts were made. To measure actual snow depth, I need to make a topographic map in snow-free conditions this summer which we can subtract from the snow-covered maps like the ones above. The following examples illustrate how measure snow depth like that works.
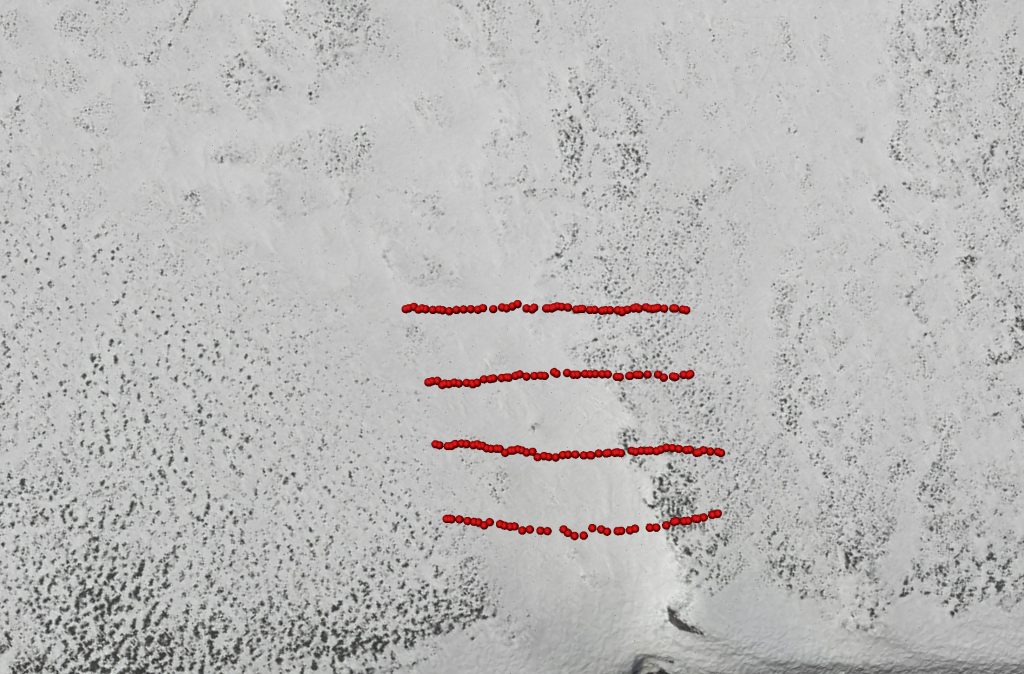
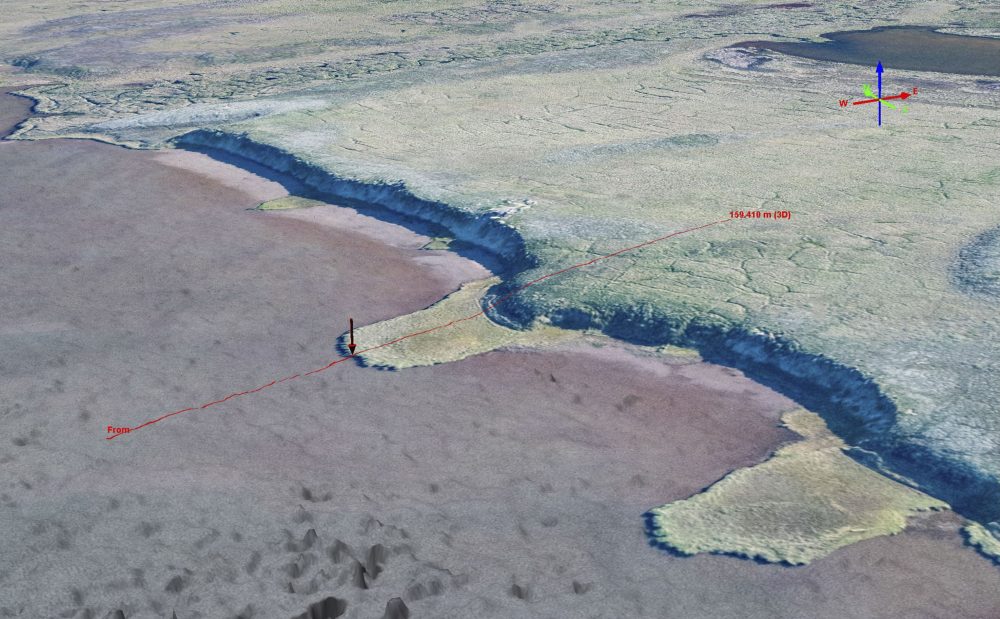
Towards responsible measurement of snow depth. This example comes from my first paper on using fodar to measure snow depth in 2015, along the banks of the Hulahula River in the Arctic Refuge (yes, I developed this technique here because this is where I wanted to use it even then). At left, the airborne imagery from summer shows a small gully along a hillside. At right, the same location winter, partially covered by snow. The red dots are probe measurements of snow depth that we made on the ground shortly before the airborne measurements to validate the technique.
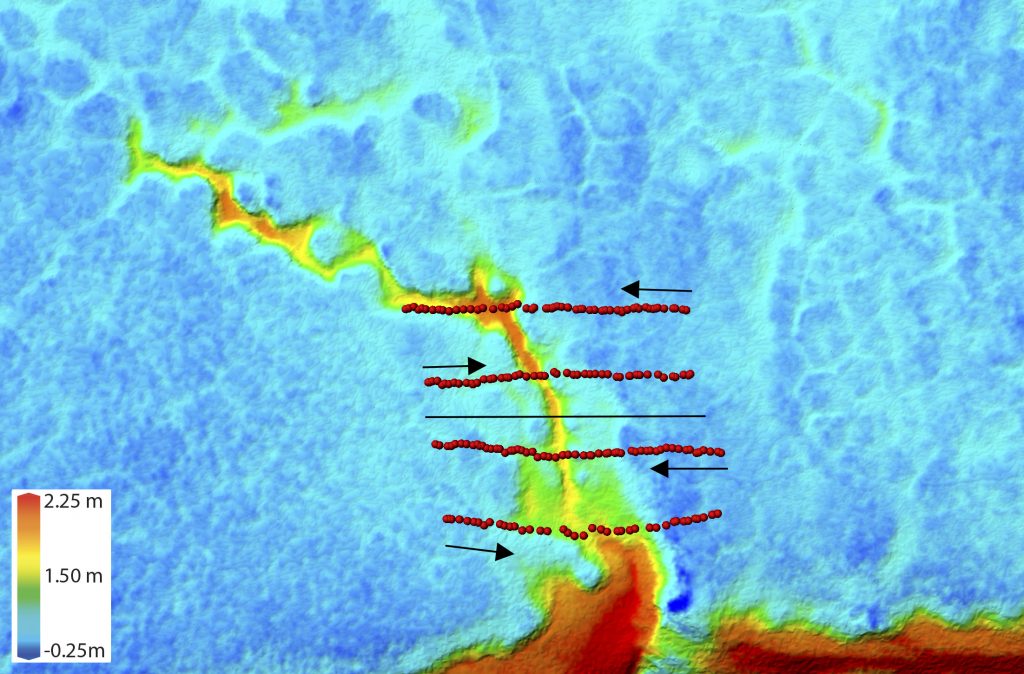
Towards responsible measurement of snow depth. Here on the left is the same winter image but on the right is the snow depth map made by subtracting the summer topography from the winter topography. Colors are arbitrary but used here to show snow thickness, with reds being thickest and blues being thinnest (see color bar at lower left of right image). Note how the thin snow (blues) relates to the image — bare ground can be seen there — and how the thickest snow (yellows and reds) fill the gully as expected. On this snow depth map is a black transect used in the elevation plot below and the arrows indicate how the probe meaurements were joined into a single transect line in the second plot below.
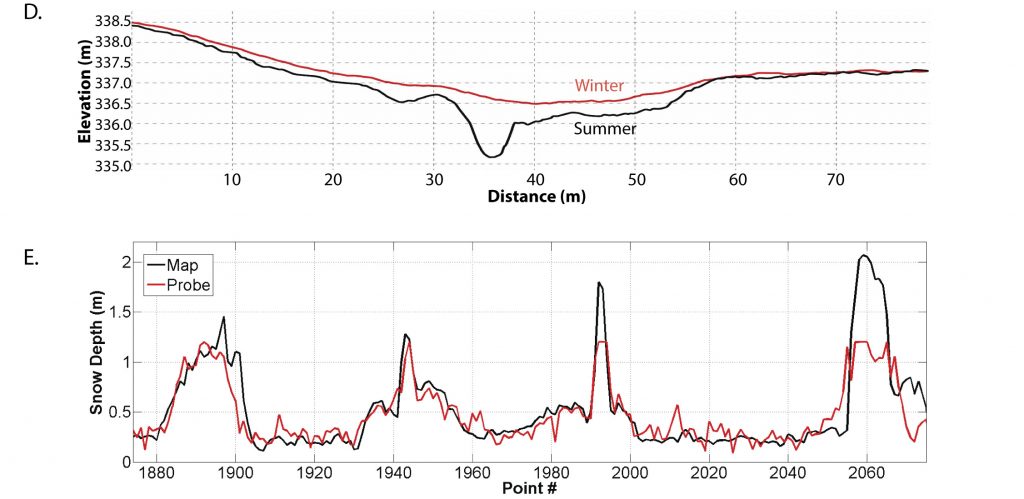
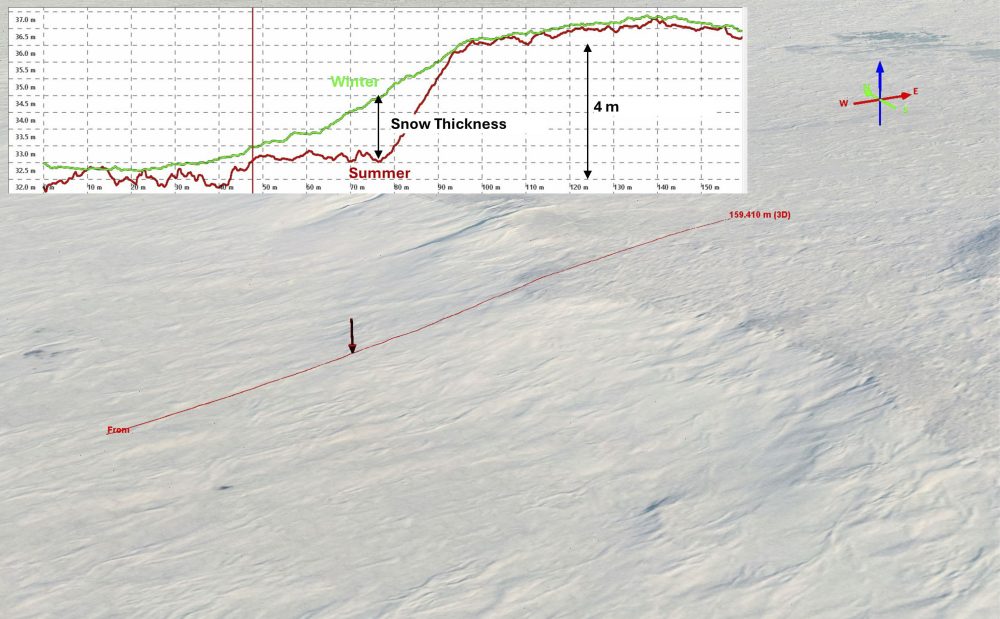
Towards responsible measurement of snow depth. The upper plot shows the topography of this gully in winter and summer — the difference between the red line (winter) and black line (summer) is snow depth. The lower plot shows the four ground transects (red dots) pieced together into a single line for plotting convenience indicating a nearly perfect correspondence between mapping snow from the air and from the ground– it’s actually better from the air because the probes could not reach the bottom of the gully! We can make measurements this accurate over any spatial scale.
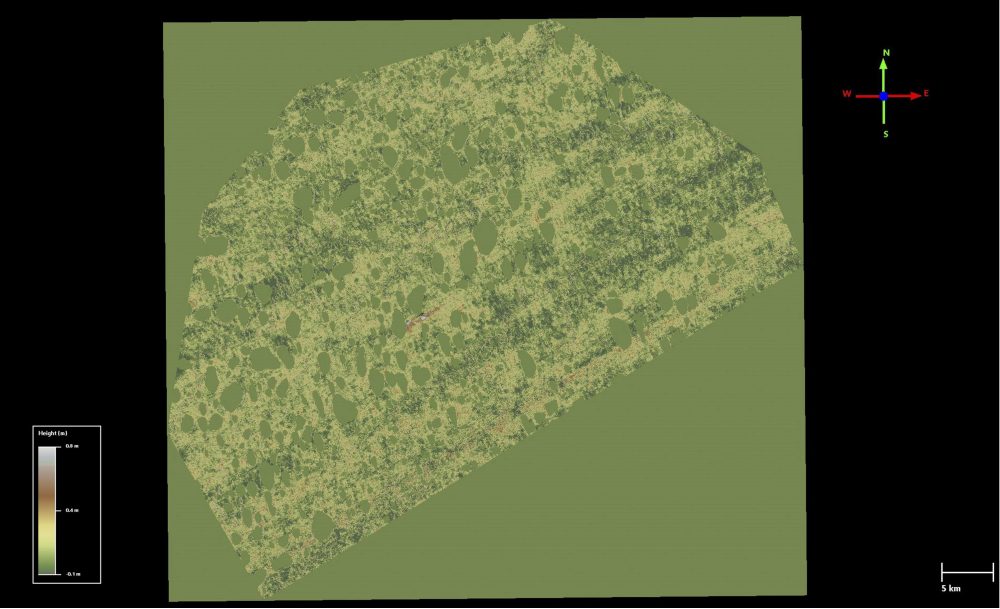
How fodar measures snow depth. In winter and summer of 2021, I mapped about 3000 km2 of NPR-A to measure snow depth. Here is the results of about 2000 km2 of that effort. The mean snow thickness over this area was only 15 cm in this year. This is a huge area mapped at 25 cm resolution — the biggest snow measurement campaign ever with over 50 billion measurements. Please see this blog to learn more about snow depth mapping in the Arctic and this project.
Towards responsible measurement of snow depth. Here is an example of the detail from the large project described in the last image. The difference between the summer and winter elevations is largely snow depth, as seen in the profile as the difference between the red and green lines. Here we can see the spatial variations in snow depth — at the top of the bluff, the snow is quite thin but in the cut banks deep drifts have formed. Without maps of snow depth like this, a seismic operator has no way of knowing whether the snow is 5 cm deep or 50 cm deep. There is an amazing amount detail in these data, which could keep 3-5 PhD students happy for years.
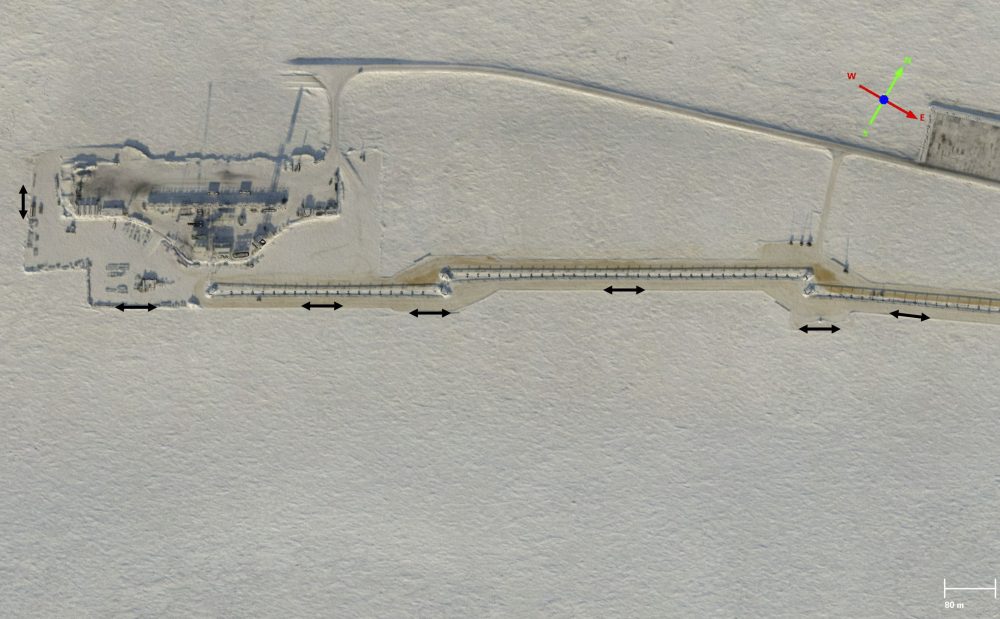
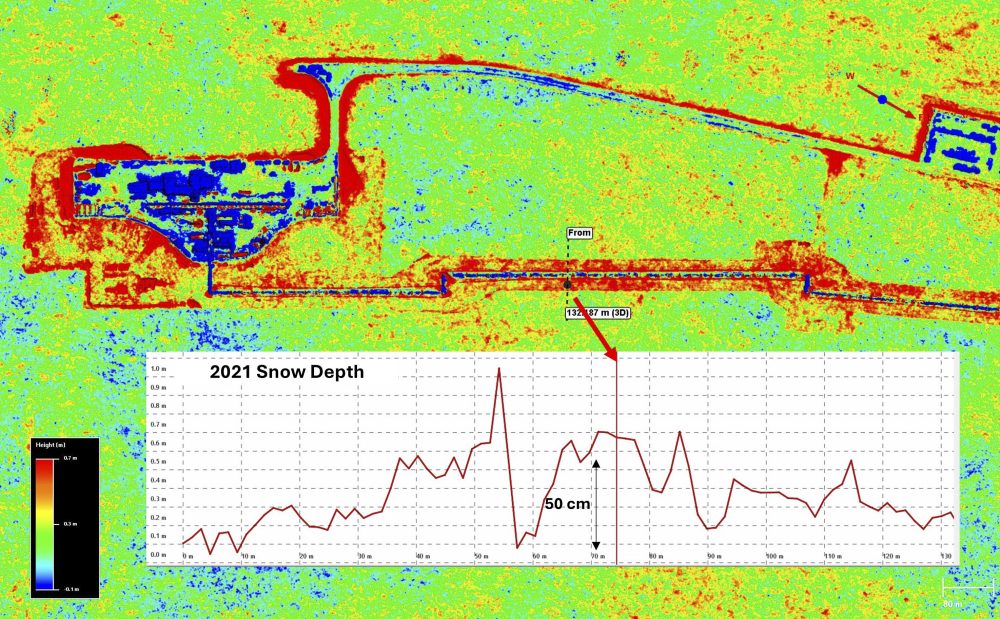
Towards responsible measurement of snow depth. Here is another example from that project, this time mapping snow around infrastructure in the same way — subtracting a summer map from a winter one. Here the red areas are thicker snow, such as used in the snow roads or in the berms created by plowing.
The important take-home message here is that these are methods that could be employed and have been around for more than a decade, but they are not being employed or mandated to protect the caribou here. Does that seem like responsible development to you?
What’s the responsible way to use snow depth data?
In April of this year, I mapped snow depths while seismic operations were in progress in NPR-A. These are the same vehicles and methods that will be used in the 1002 Area this winter, so I saw this as our last chance to get the data that we need to determine how much snow is enough to protect the tundra there before these operations are permitted. It’s important to note here that this is only half the job — I have to return in summer to map the topography when it’s free of snow, so that I can subtract it from this winter map to get snow thickness (the difference between winter and summer topography).
To my knowledge, seismic operations have never been mapped topographically in winter, so until now there has been no way to build a relationship between snow depth and severity of impacts.
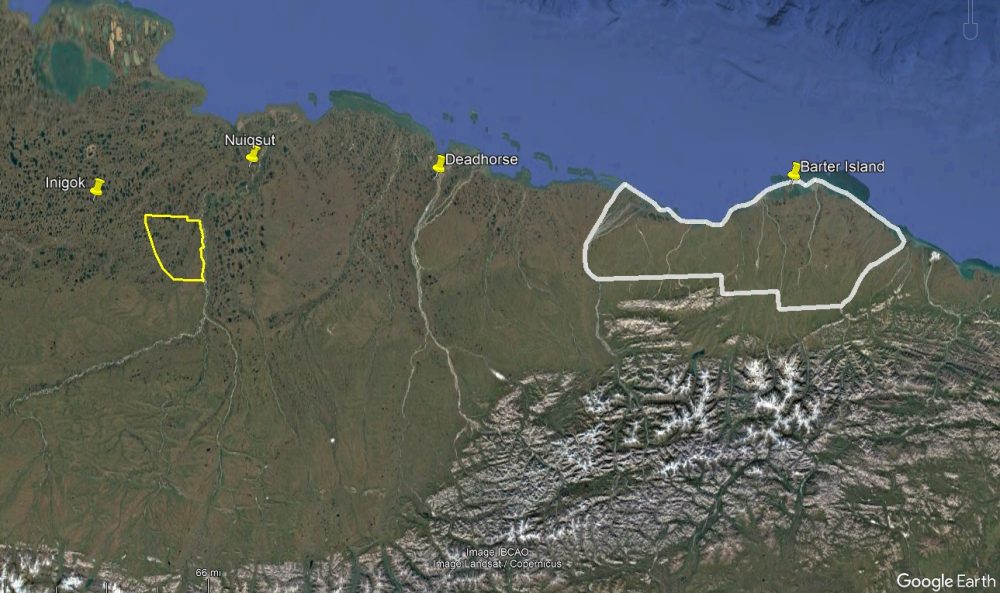
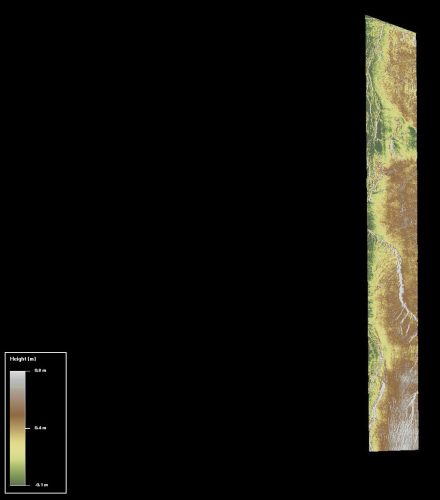
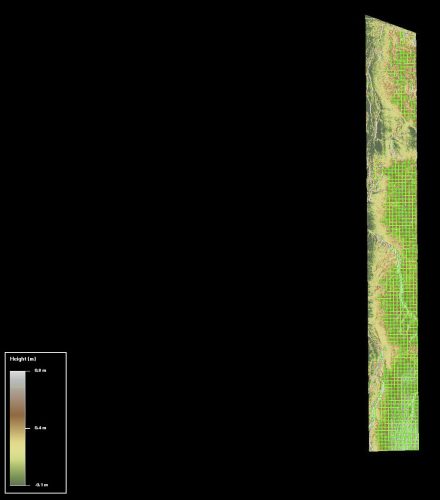
April 2026 seismic operations. The yellow outline at left within NPR-A is where I mapped snow thickness at the time of operations in April 2026. The white outline at right is the 1002 Area, where those same seismic operations are planned for this coming winter.
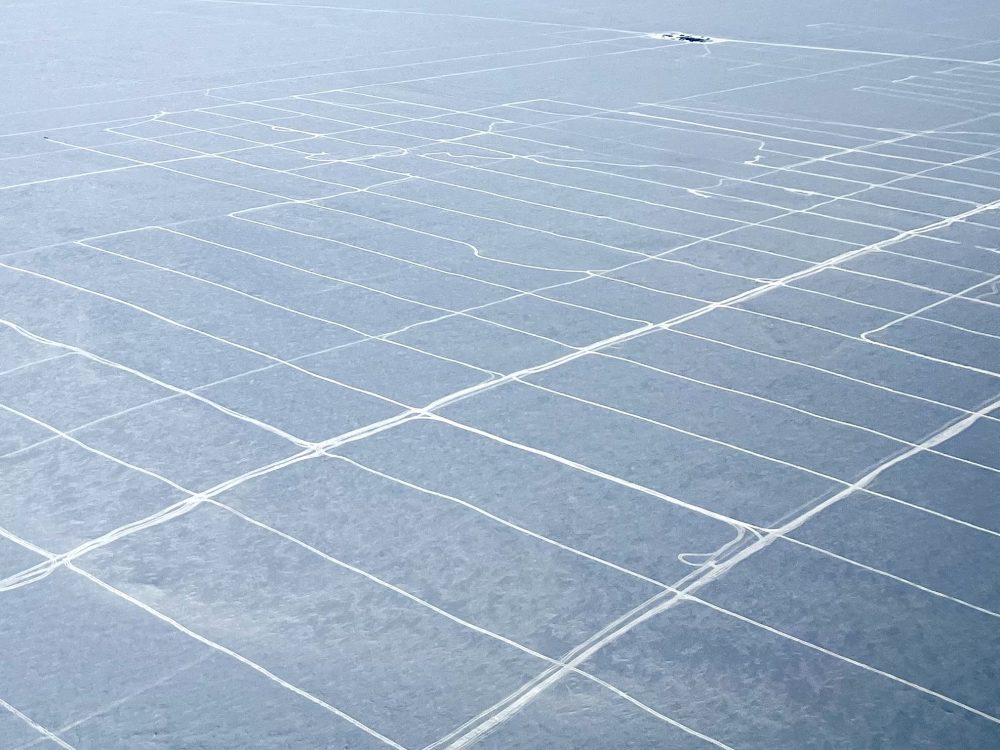
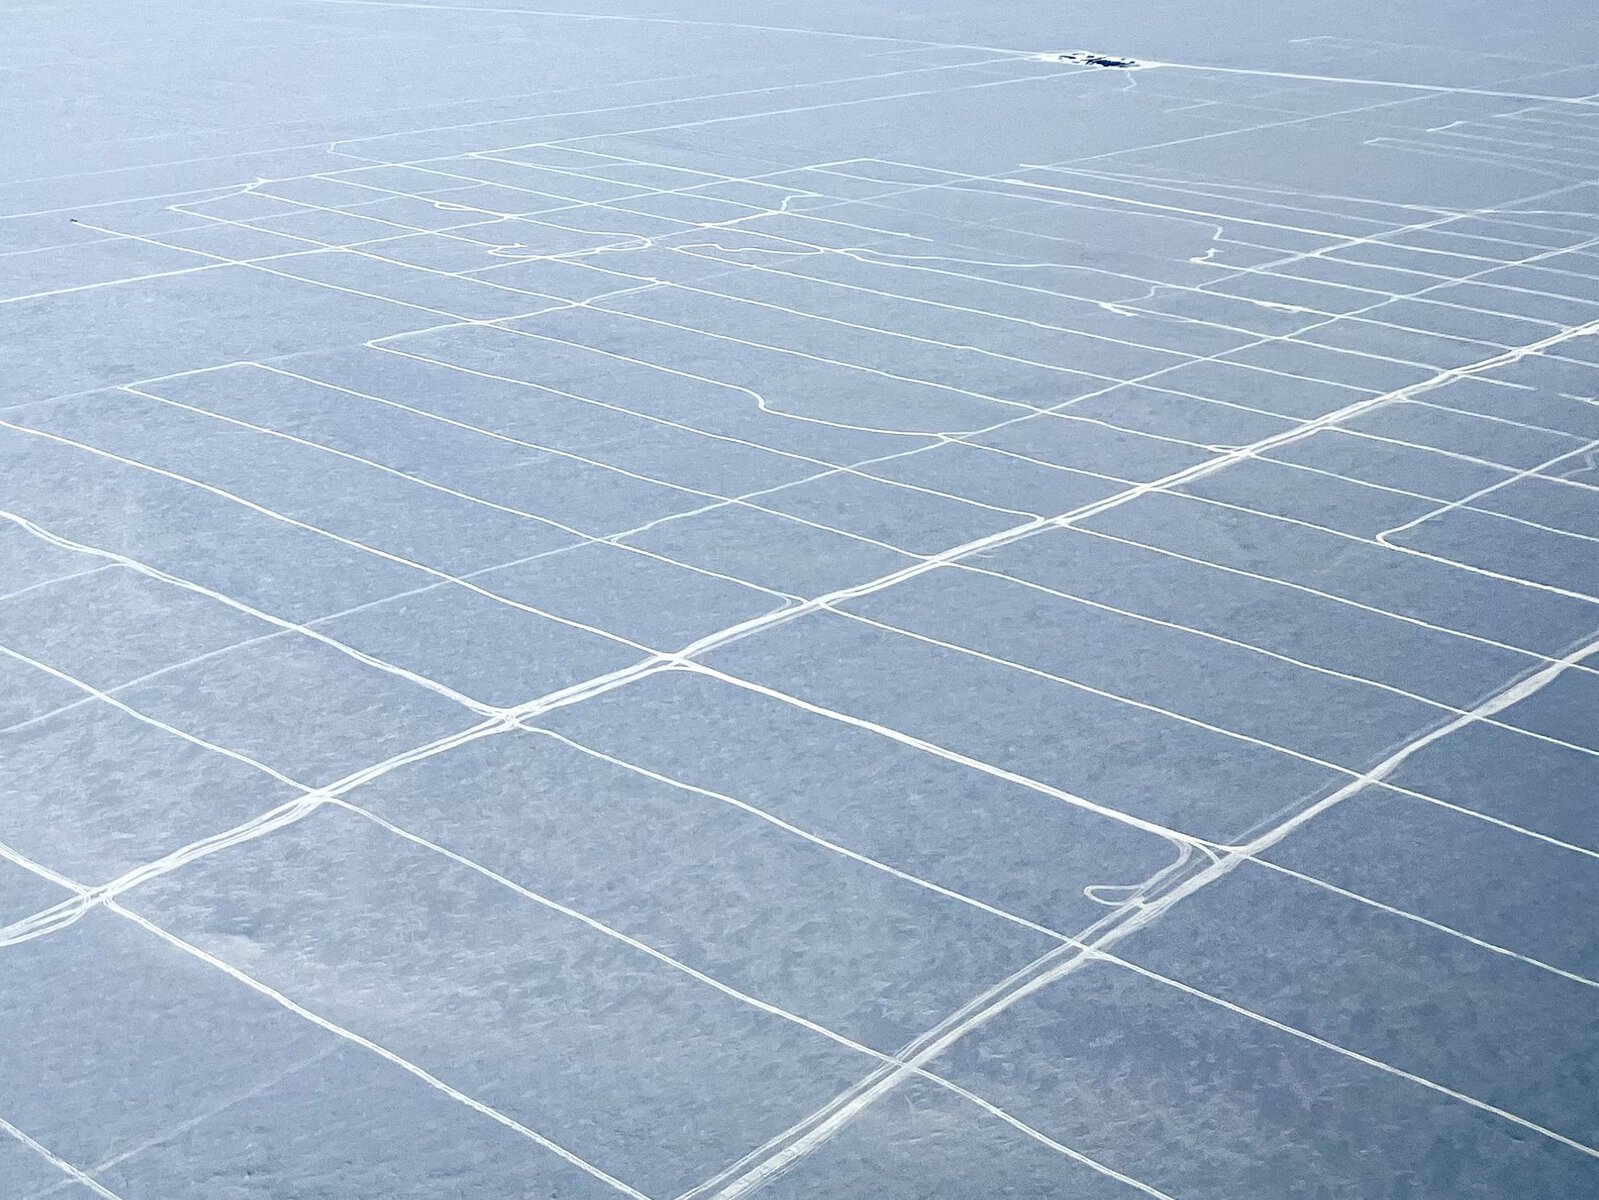
April 2026 seismic operations. These are fresh tracks in the snow. Below I’ll show the vehicles in progress of making this grid. The larger blocks are 200 m x 400 m — apparently they lay out the geophones on the larger blocks then come back with the vibroseis trucks to fill in the crossing lines to make 200 m x 200 m grids. The camp for the operators can be seen in the upper right corner. This is what’s about to happen in the 1002 Area.
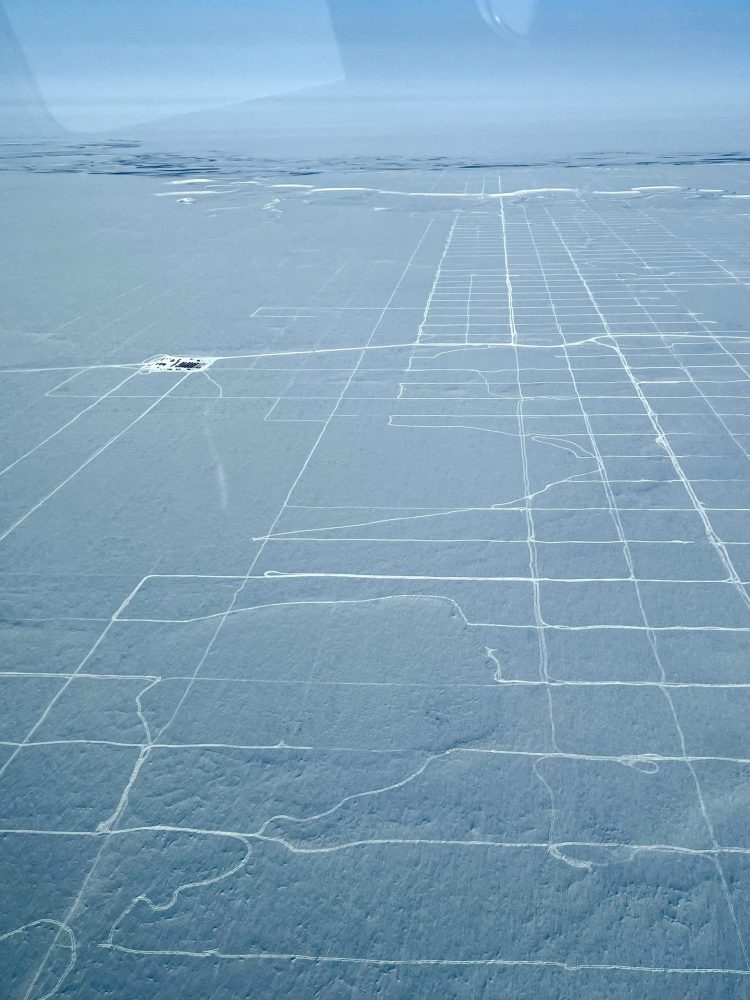
April 2026 seismic operations. The vehicles are all GPS enabled, but as I’ll show there is a surprising amount of wrong turns and U-turns. The camp seen here houses over a hundred people and is moved every few days. These camp moves are the most destructive part of the operations — every study on seismic impacts (and there are only a few) has shown this. The reason is that these trailers are all hauled by metal-tracked bulldozers that bite into the tundra to get enough purchase to move the cat trains. These methods have not changed since the 1950s.
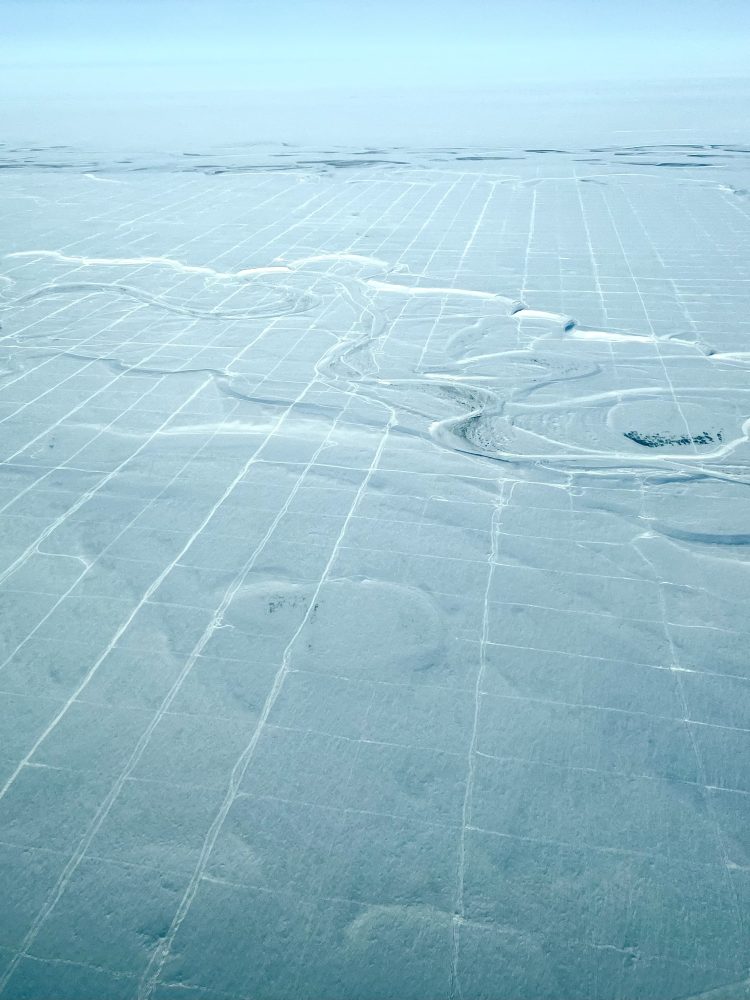
April 2026 seismic operations. Is this enough snow to prevent harm to the tundra and its ecology? We wont know until summer when I map it again. Actually we wont know for another 5-10 years, but we have to start somewhere…
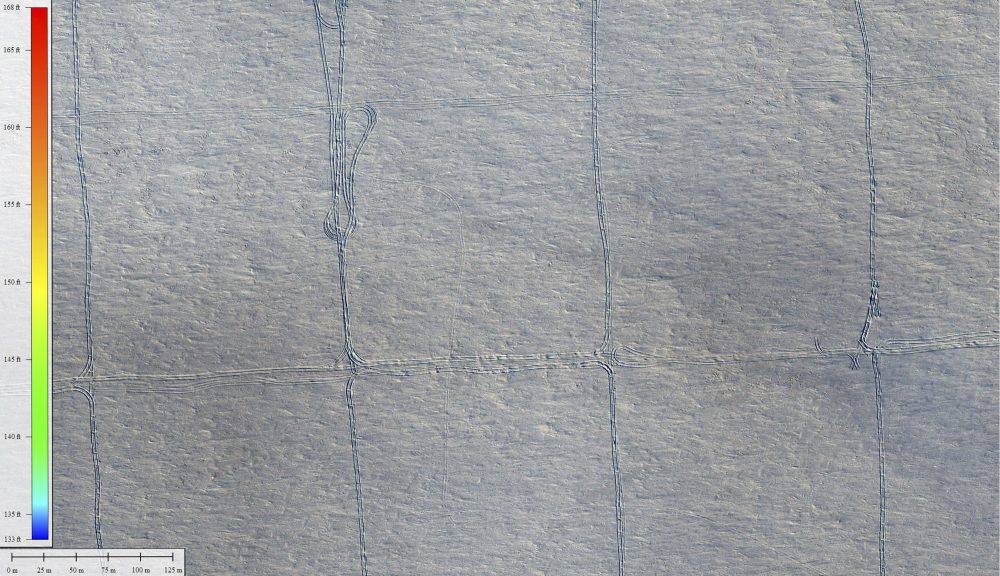
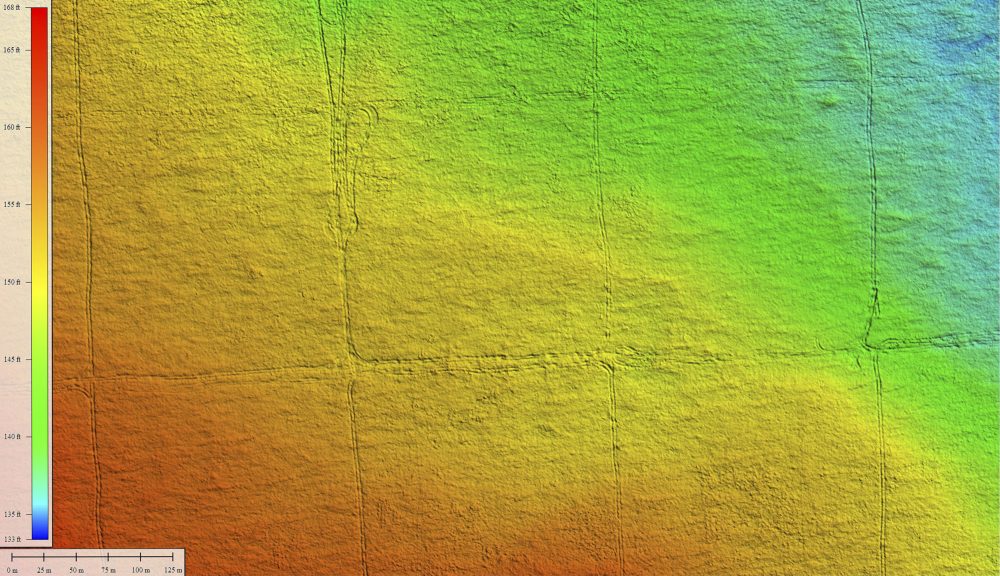
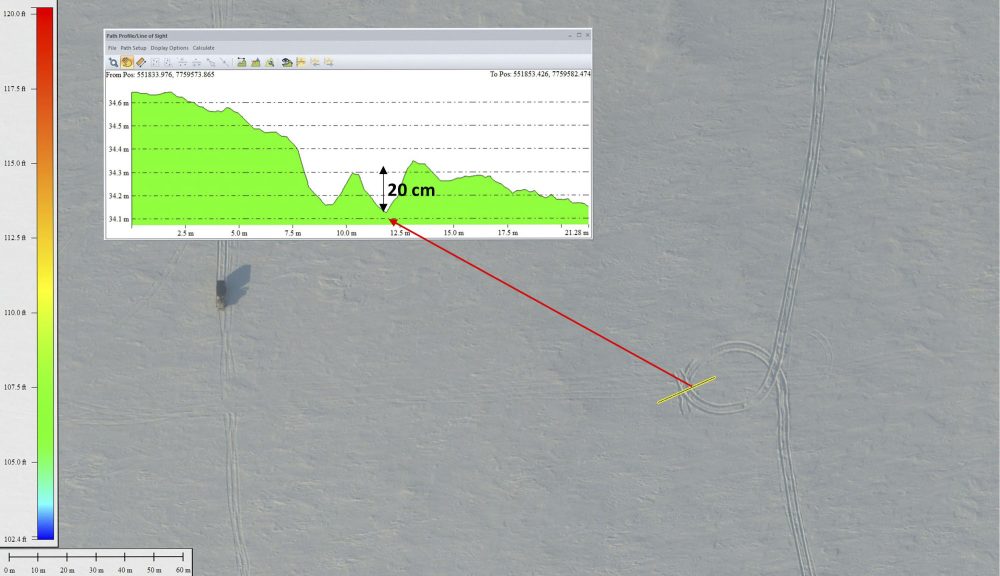
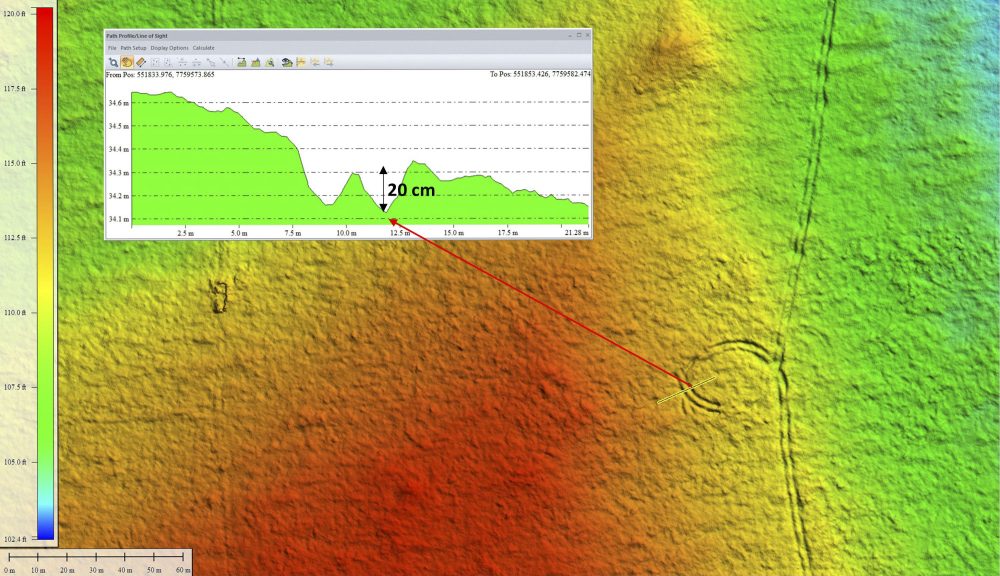
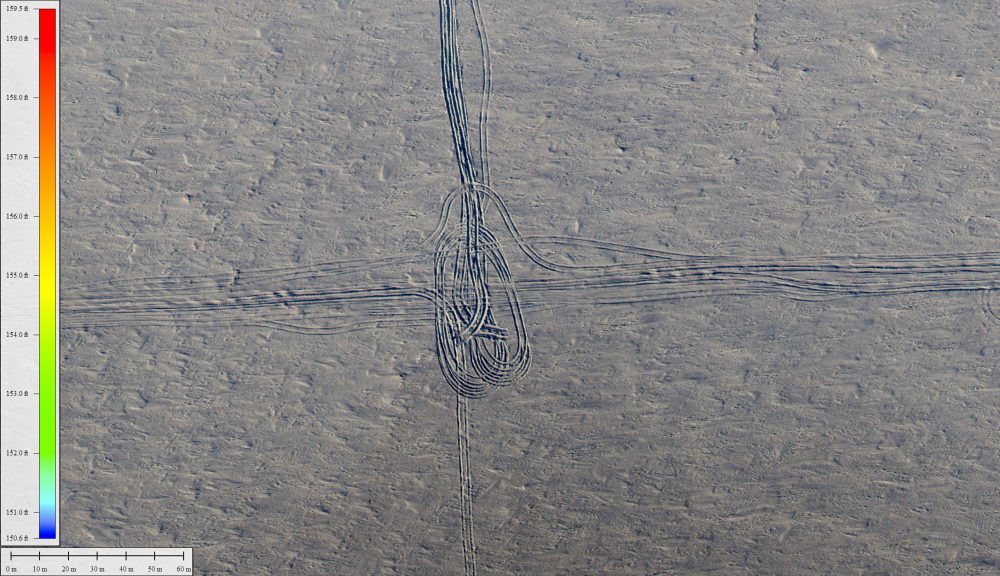
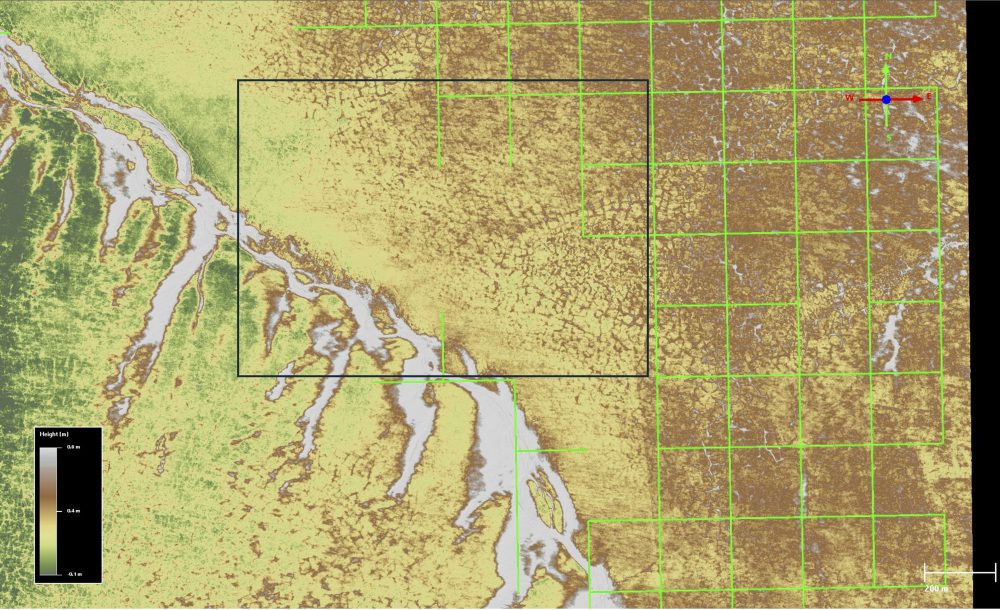
Towards responsible oversight of seismic operations in winter. Using the vertical photos taken from my plane during the April 2026 seismic campaign in NPR-A (see previous obliques), I created a topographic map of the snow surface (right) and an orthorectified image mosaic (left) perfectly coregistered with the topography. Here we can see a sample of the seismic checkboard in the process of being created.
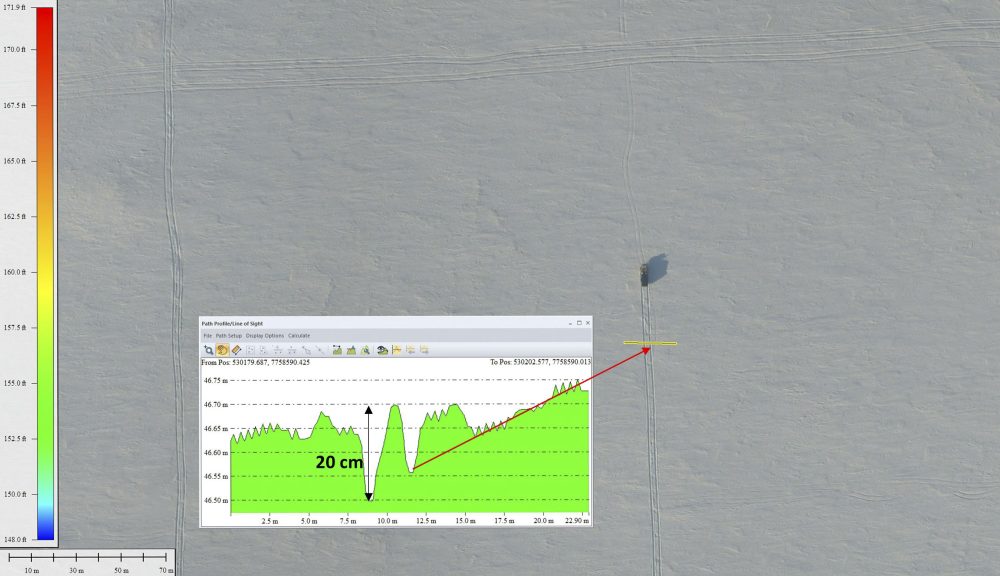
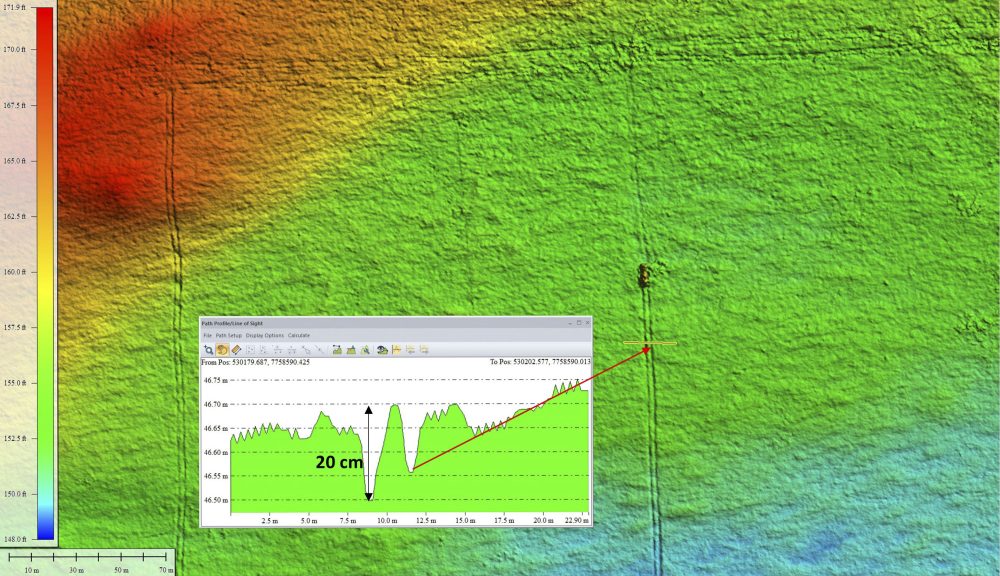
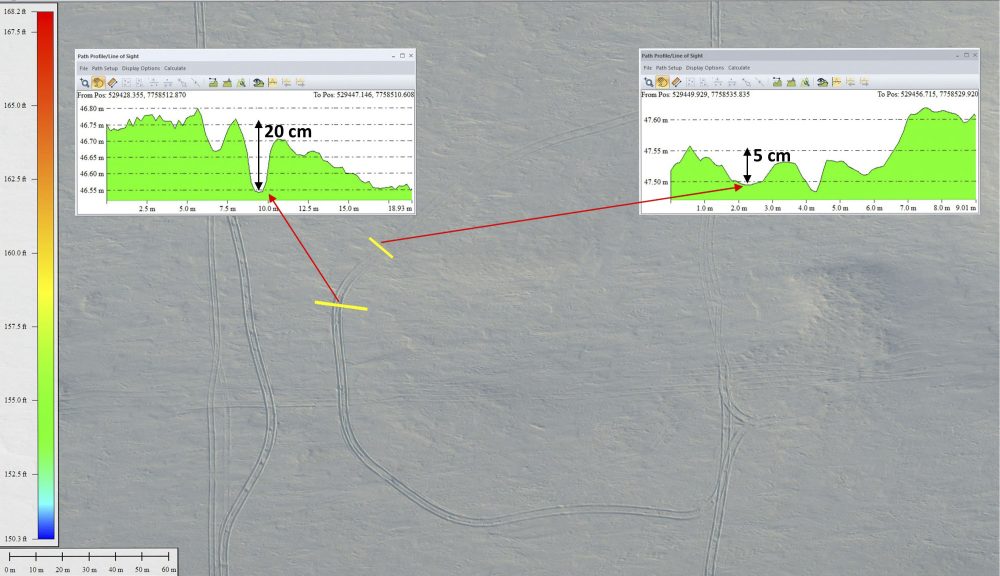
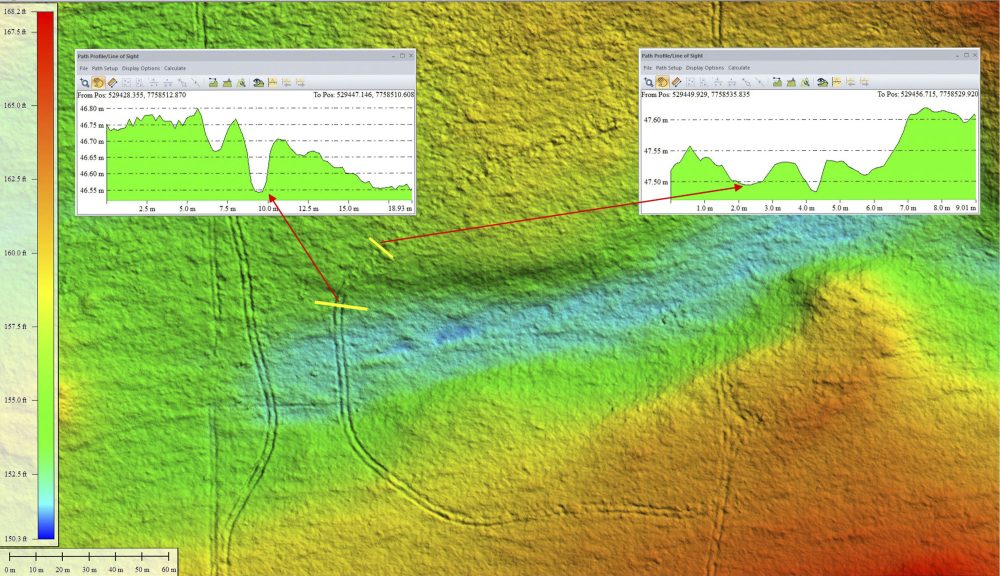
Towards responsible oversight of seismic operations in winter. I know that the lines were fresh because I could see the vibroseis trucks moving as I mapped them (see it’s shadow in the image on right). Here a truck is leaving ruts in the snow about 20 cm deep — the two valleys in the green plot are the individual tire tracks. Tracks in the range of 15-20 cm were typical. Likely, based on previous winter acquisitions near here, the average snow depth is only about 15-20 cm. Likely, based on previous summer acquisitions near here, these tracks are compressing the tundra itself by 5-15 cm. Summer mapping here will both allow us determine the actual snow depth and the severity of damage to the tundra.
Towards responsible oversight of seismic operations in winter. U-turns were common throughout the area. In general, turning caused deeper ruts than driving straight, but I did not analyze this thoroughly.
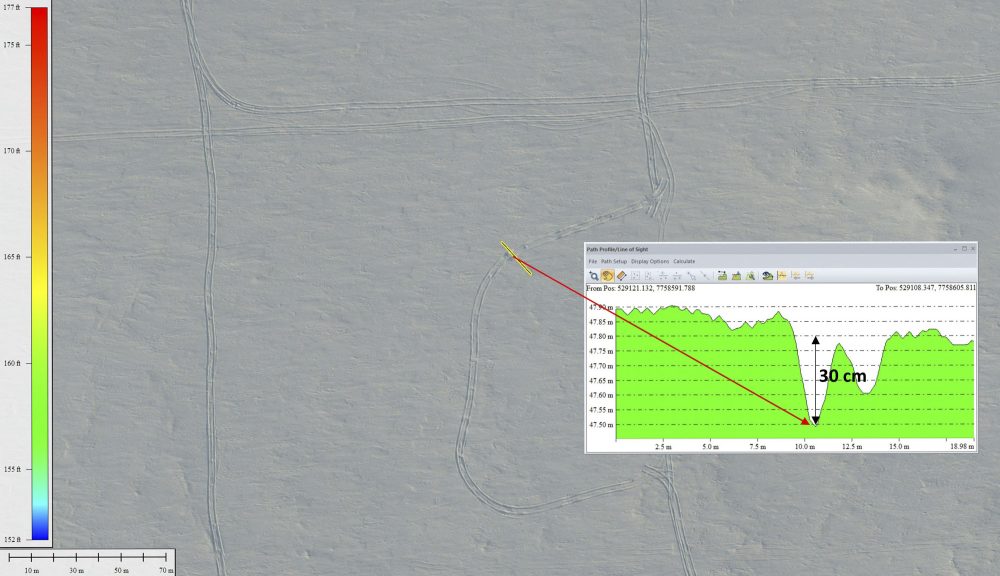
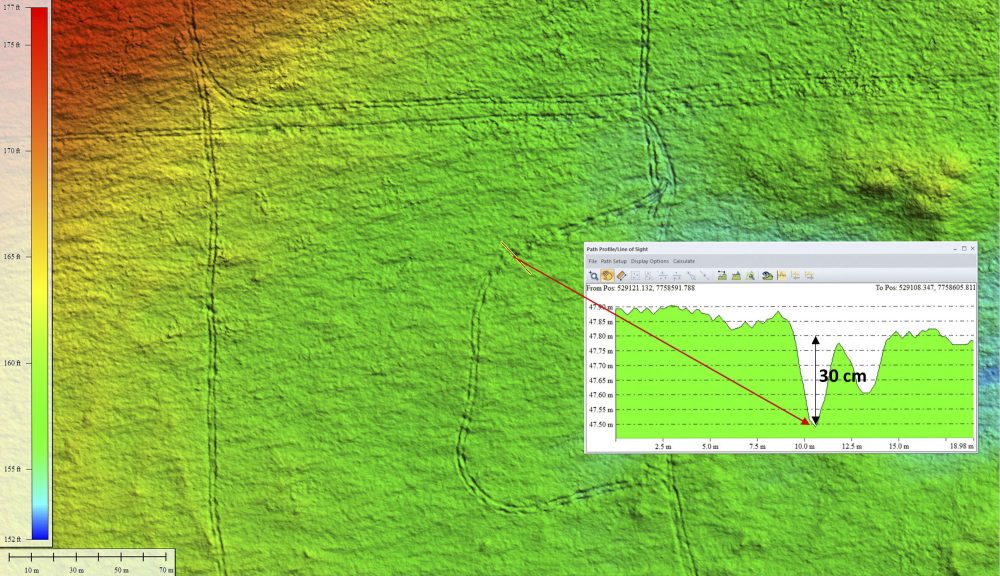
Towards responsible oversight of seismic operations in winter. Here the outside of the turn caused a deeper rut than the inside of the turn. How this affected the underlying tundra remains to be seen, but analysis of data like this can help guide turning radii and turning speeds should turns like this be a frequent source of harm. To measure actual snow depth after the tracks have been made, we would have to offset the measurements to either side and average them. So even though its better to make the measurements before the tracks are made, we can get the necessary data either way.
Towards responsible oversight of seismic operations in winter. Here is an example what we seek to learn from this work — the imagery shows that the same vehicle left ruts of substantially different depths along its route. We know it’s not just snow depth that protects the tundra, but snow hardness and density. However, hardness and density are closely related to thickness because the hardest snow forms in wind drifts and drifts are usually much thicker than undrifted snow here. But once we have the summer map of this area, we can measure the actual snow thickness and begin to correlate it with severity of impacts.
Towards responsible oversight of seismic operations in winter. Based on my previous work mapping the impacts of seismic operations in summer, I’d guess each of these tracks will likely leave a visible scar. Knowing the snow thickness adjacent to each track will allow us to correlate, for the first time, the snow thickness with severity of impact as a function of tundra type so that we can, for the first time, base snow depth minimums on science.
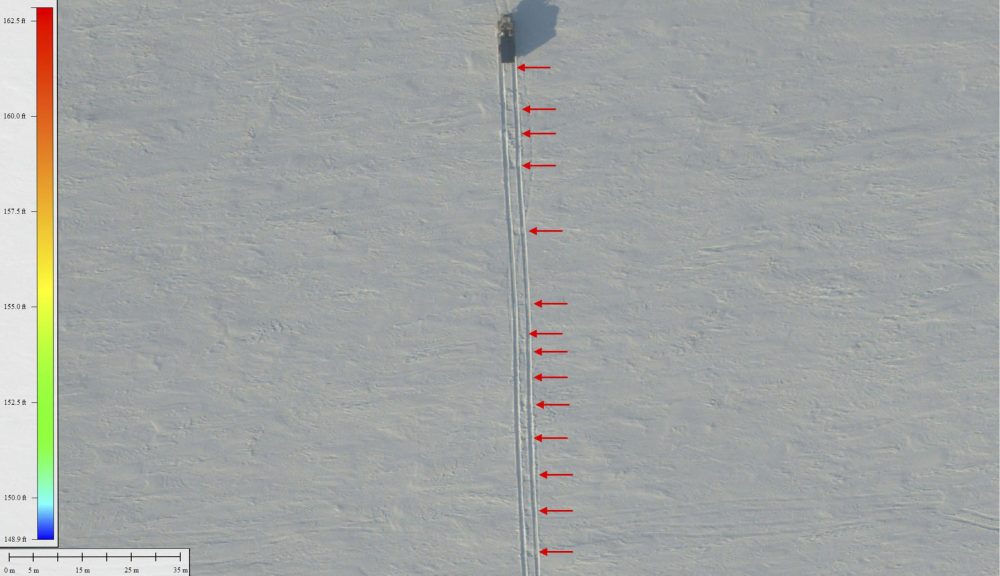
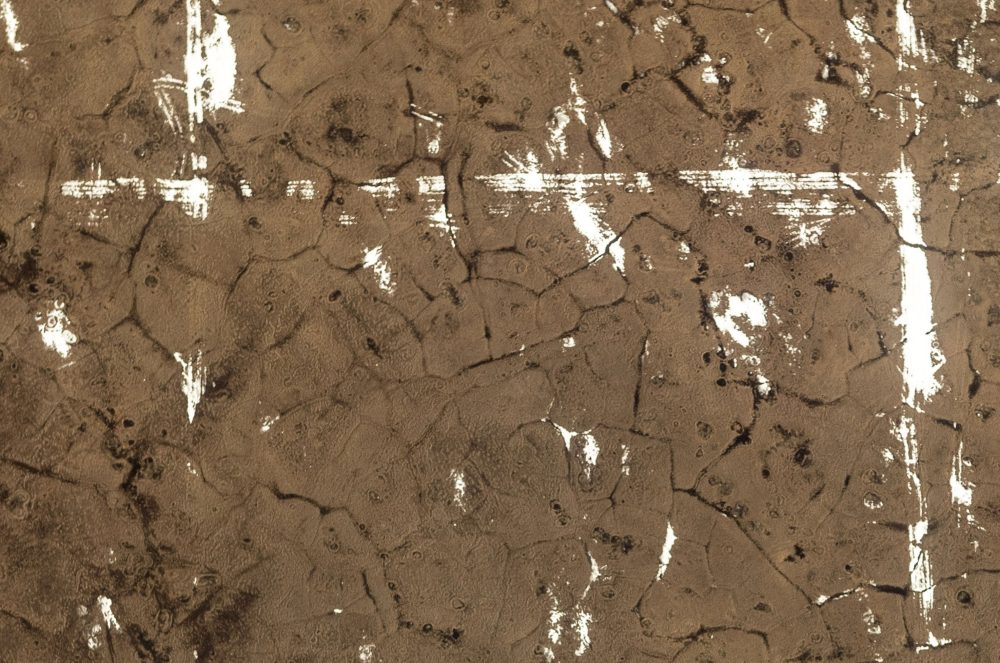
Between the tire tracks left by this seismic vehicle are small squares, indicated by red arrows. What are they?
Towards responsible oversight of seismic operations in winter.Here is a close up view of them. These are the vibroseis plate imprints. These vibroseis vehicles are enormous, weighing ten tons or more. They use very large, low pressure tires to try to minimize tire impact on the tundra but the entire point of these vehicles is to smush a small plate into the ground as hard as possible every few meters and shake the hell out of it to create enough acoustic energy to bounce of geologic structures thousands of feet below the surface. So the whole idea of using low pressure tires is kind of moot when the vehicles they are attached to are deliberately using the weight of the massive truck itself to create the highest pressure possible on that plate without rolling the truck over. I’ve scoured the relevant regulatory studies and guidance, and no mention at all is ever made about the impact of the high-pressure vibroseis plate on the underlying tundra and ecology. Indeed, the regulations state “vehicles will be selected and operated in a manner that eliminates direct impacts on the tundra caused by shearing, scraping, or excessively compacting the tundra” —I don’t know their definition of “excessively compacting”, but if putting 10 tons of weight on a small plate and shaking the hell out of doesn’t meet it, I’d hate to see what does…
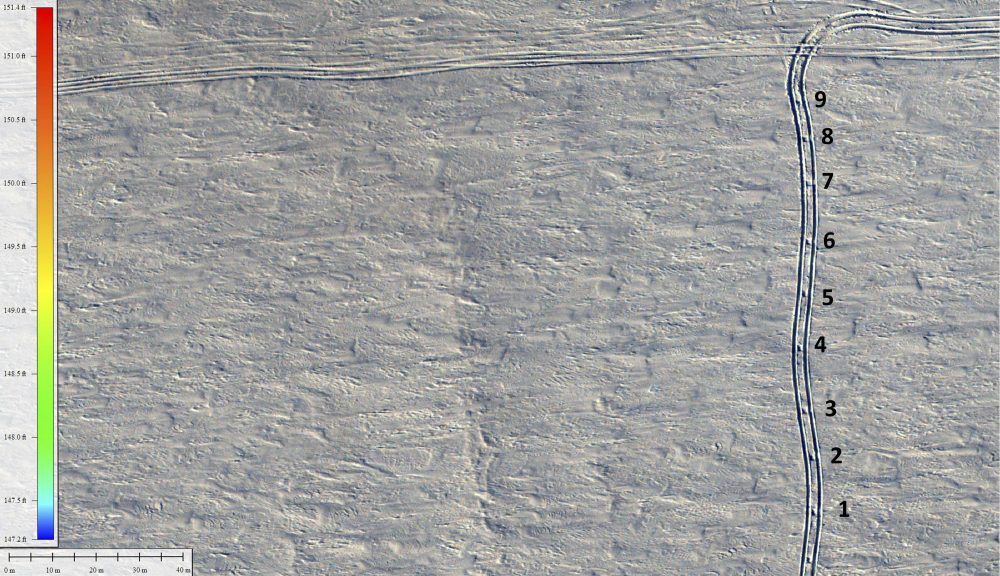
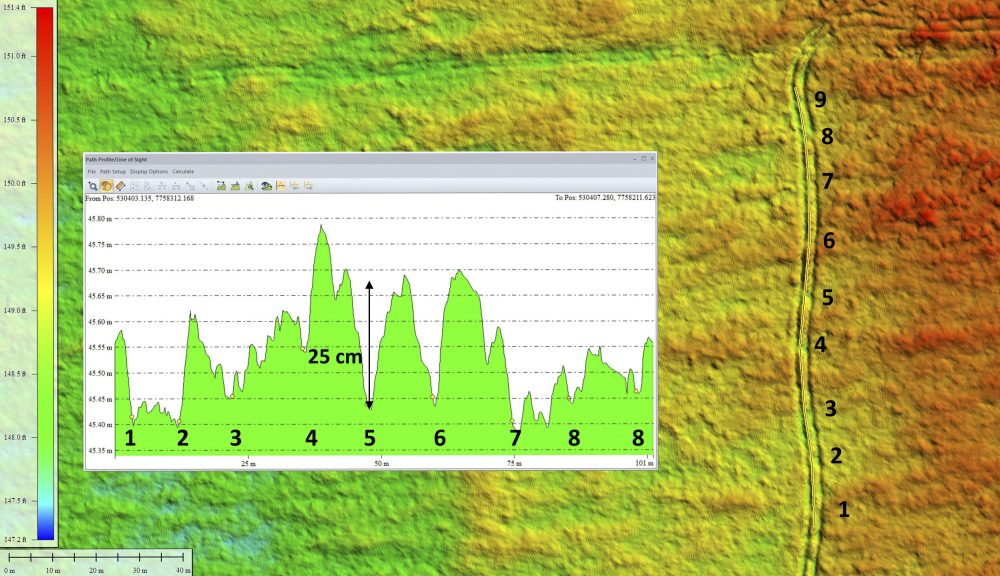
Towards responsible oversight of seismic operations in winter. The depressions and initial snow depth of the plate impacts can be measured by fodar too. Here I’ve drawn a transect in between the tire tracks of the vibroseis truck and numbered each plate depression on the map and the profile. The depth of the depressions from the plate are likley exceeding the snow depth here given the pressures involved — that is, the tundra itself is likely depressed substantially too. Once I make the summer map, we will have enough data to provide guidance on the impacts of these plates.
Towards responsible oversight of seismic operations in winter. Though the plates are small, their potential impact on the landscape is enormous – every line on this grid has bunches of them, that’s the entire point of the grid itself. Plate sizes range from 1-3 m2 and from what I’ve seen here impact spacing is 5-10 m. On a 200 m x 200 m grid covering this ~750 km2 area with a shot every 7.5 m, this equates to 1,333 impacts per square kilometer or 1-3 km2 area (500-1500 acres) of plate impacts (depending on plate size) for this campaign. Assuming a 2 m plate used on a 200 m grid in the 1002 Area, I estimate there would be ~8 km2 (~3200 acres) of plate impacts alone (not including tire tracks). For reference, this is nearly 3 times more than the total allowable footprint of infrastructure within the 1002 Area (1200 acres). Three thousand acres of impacts is not nothing, yet there have been no studies on how the tundra responds to these high-pressure impact plates as far as I can find.
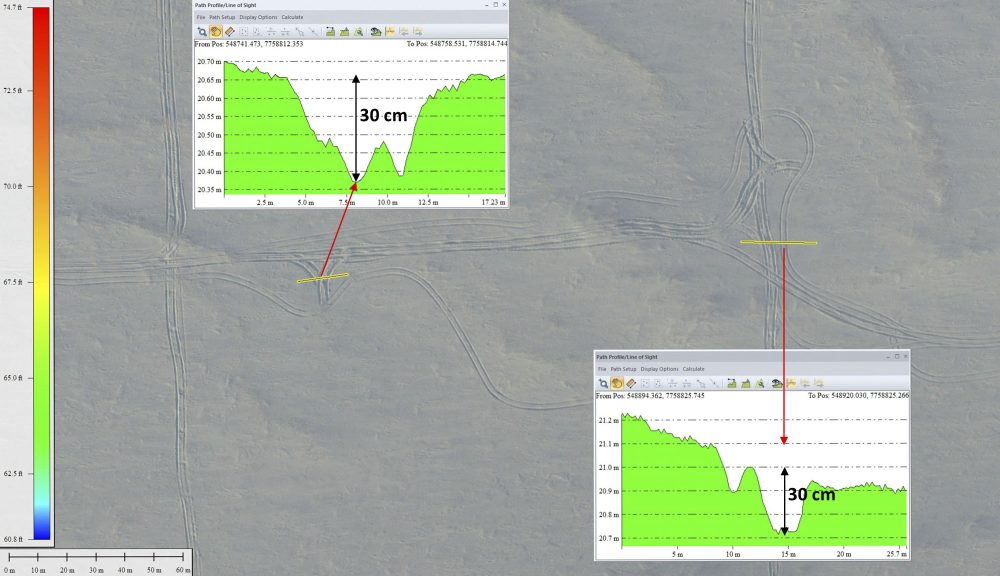
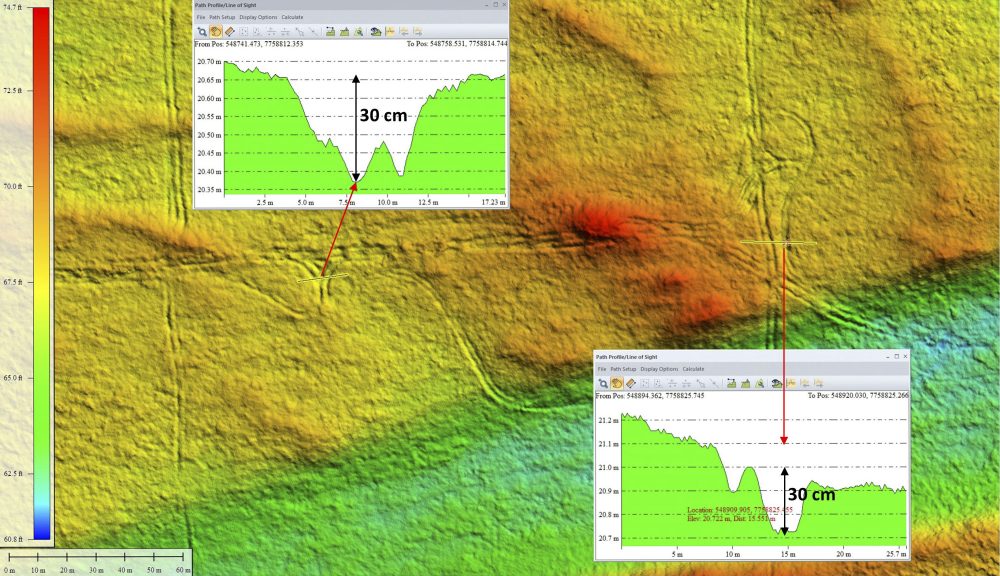
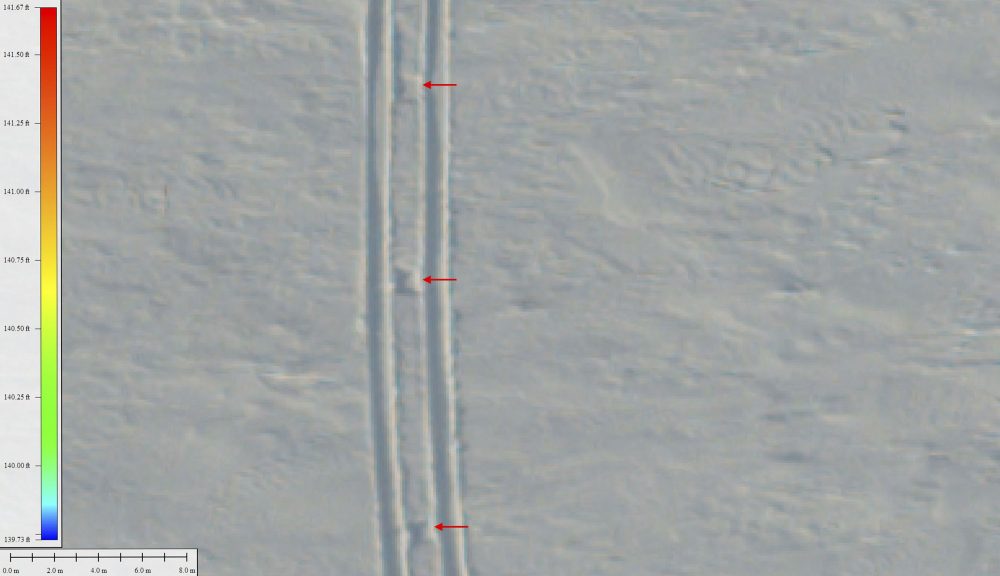
Towards responsible oversight of seismic operations in winter. Some grid lines were major thoroughfares, perhaps about half of the ones trending east-west, with impacts of 10-30 m wide. Here a north-south thoroughfare intersects with and east-west one, creating a tangle of impacts up to 50 m wide. Therefore, when determining how much snow is required to protect the tundra, we must consider both single-use tracks and multiple use thoroughfares independently.
Towards responsible oversight of seismic operations in winter. Seismic operations on this scale take months to complete and during this time there are dozens of wind storms and blizzards. Despite this, nearly every track made during these campaigns remains visible throughout the entire winter. Here we can see someone was doing donuts a few weeks ago near the center of the image, but the tracks don’t cast deep shadows because they have been filled with snow. But the sintering caused by getting smushed by the vehicle tires causes them to resist scour and catch drifts, so their location can still be noted and snow depth measured.
2. Are the current protective regulations actually working?
The answer is that it depends on who you ask.
The problem is that there is no definition of what “working” looking like because there is no regulatory definition of what “harm” looks like. This is a major oversight within the regulatory guidance documents and the skeptic in me believes this oversight was deliberate because it is so blatant and troublesome not have such a definition. Without a definition of harm there is absolutely no way to provide meaningful oversight and, to me, it turns the entire NEPA process — the process in which the public is supposed to have a say in how are public lands are treated — into a farce.
In this section I argue for the creation of an methodology for defining what “harm” looks like that is acceptable to all stakeholders and an objective system of measuring whether that standard has been met by permittees that is also available to all stakeholders.
Personally, I would consider all of the impacts documented below as “harm”, but I’m not here to press my personal view but rather to make the point that by mapping the impacts in the years following a seismic campaign we will have the data necessary to have a rational conversation about the acceptable level of harm in a way that can objectively measured. For example, are the tracks visible the following summer? After two summers? After ten? How deep are the ruts? Is the vegetation stressed? Has hydrology been changed? These are all easily observable through airborne mapping. And once mapped, these data can be shared amongst all stakeholders to ensure that the rules are being followed and that they are working as planned. That is, these maps become a spotlight that cannot be ignored.
What these questions get at is: What severity of impact is acceptable? Once that is decided based on the observables within the maps (visibility, plant stress, rut depth, hydrologic change, etc), we can then compare the observed impacts to the snow depth at the time of operations (see previous section) to determine how deep the snow needs to be to keep the impacts within the acceptable range in the future. That is, with each new seismic project, we can perform this comparison again to test our predictive skill and improve the regulations accordingly.
The examples below demonstrate what this spotlight looks like. Within the NEPA process, stakeholders would have the power to advocate for the severity of harm that they consider acceptable in an objective, measurable, scientific way that eliminates the subjectivity that currently plagues both the existing regulations and the public demand for accountability.
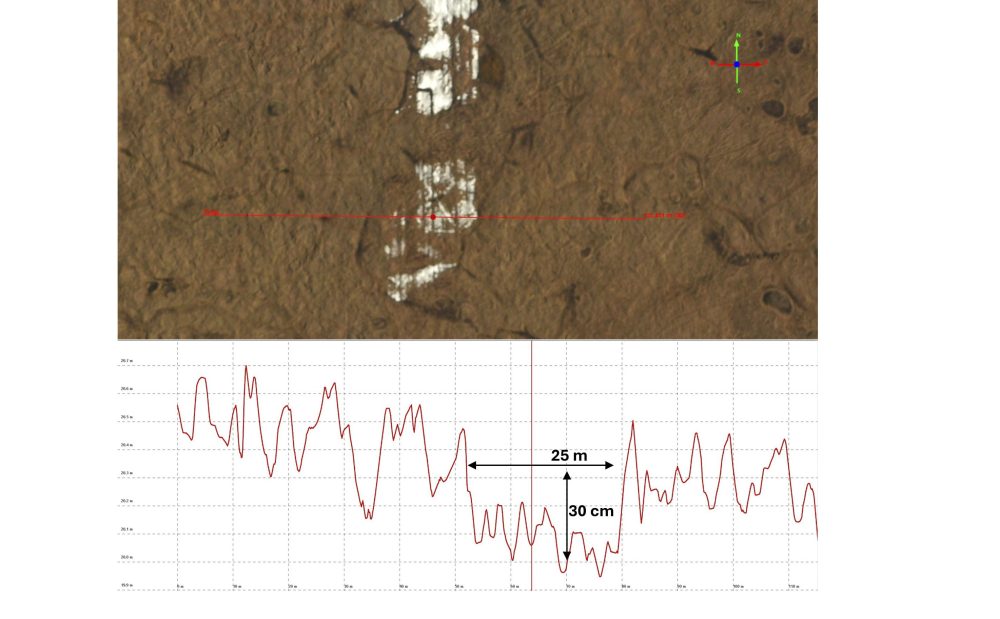
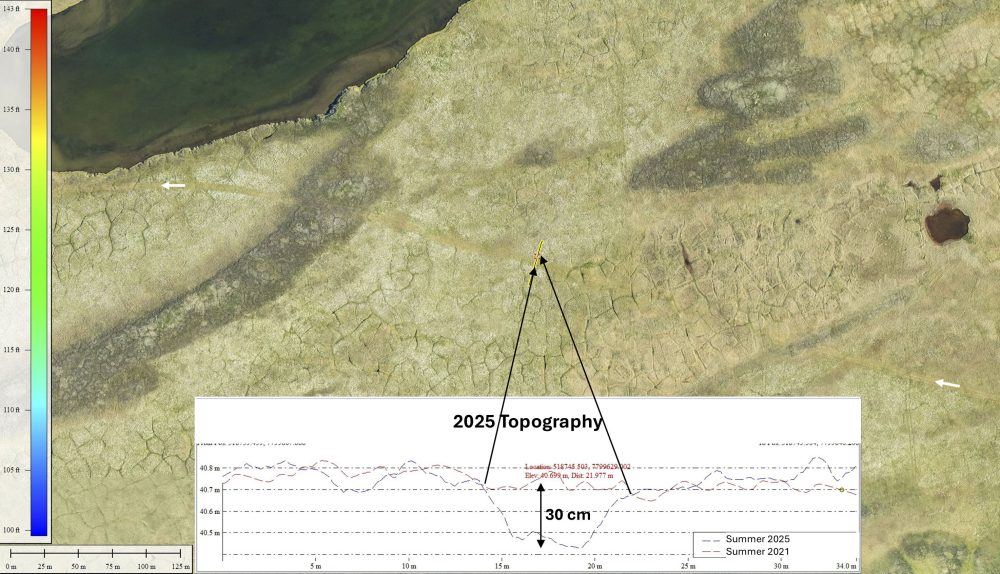
Towards responsible oversight of seismic operations in summer. Here a few months after operations ended at Pt Thomson, adjacent to the Arctic Refuge, the area was characterized by trails that were 25 m wide and 30 cm deep. Is this OK? The point is we have the ability to measure these impacts now and it is irresponsible not to. With these measurements in hand we can both improve the regulations in a scientific way and ensure they are working.
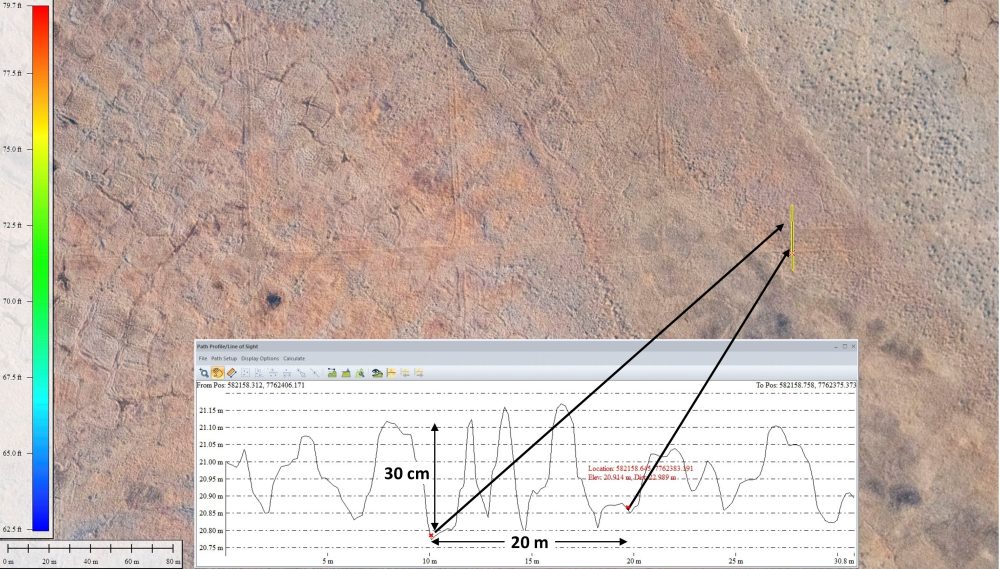
Towards responsible oversight of seismic operations in summer. This 20 m wide trail is still visible two years after work was completed. Is this OK? With the ability to measure every tire track, we can objectively discuss the answer to this question.
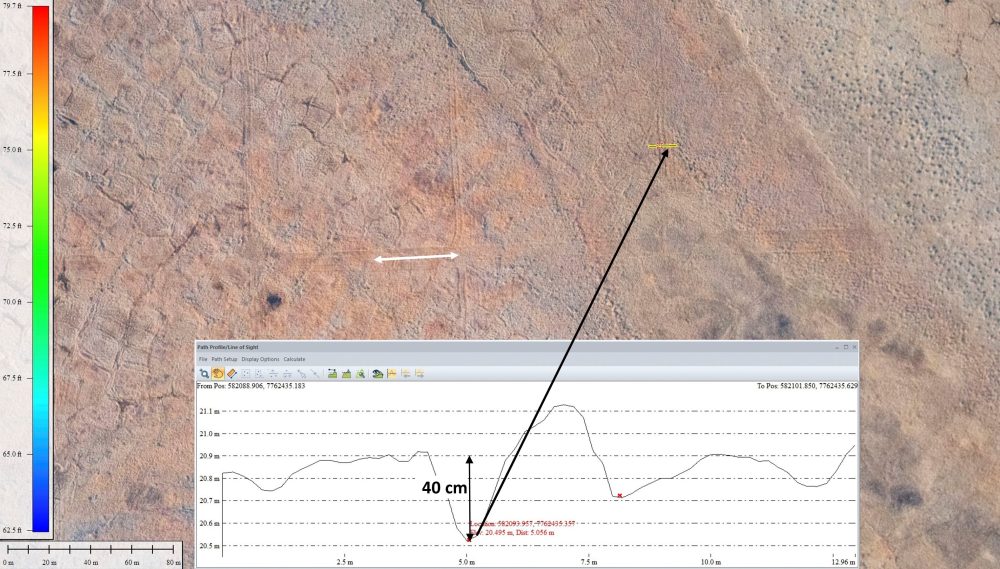
Towards responsible oversight of seismic operations in summer. Here a single vehicle track is captured, again two years after the work was completed. One tire left a bigger rut than the other tire. Why? With such mapping both during operations in winter and afterwards in summer, we can start to answer questions like that and improve the regulations to minimize harm.
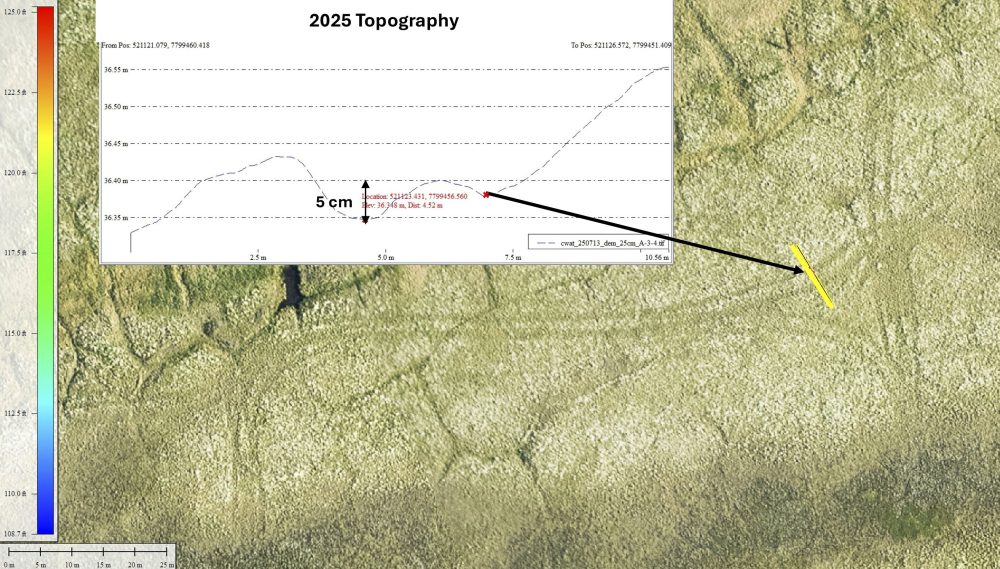
Towards responsible oversight of seismic operations in summer. Here the ruts left behind two years later are only 5 cm. Is this OK? To me, it’s not just about rut depth. Here we can see the Eriophorum crushed by this vehicle has been harmed because it is no longer blooming like the ones surrounding it. I calculated this damage could cause a ~10% reduction in Eriophorum in a previous blog. Is this loss significant to caribou? With maps like these we can objectively measure, understand, and discuss questions like that.
Towards responsible oversight of seismic operations in summer. Here a snow road has left a 30 cm depression 4 years after it was used. Is this OK? Using repeat mapping like this we can measure these impacts, use them to improve the regulations, and have a standard for harm that we can objectively measure.
Towards responsible oversight of seismic operations in summer. Here’s the longest term view we have of seismic impacts — 25 years after seismic operations ended within the Arctic Refuge, the landscape has still not stabilized. What’s gone missing here is caribou food — is this OK? These seismic lines were spaced 5 km apart — would this be OK on a 200 m x 200 m grid? Or on a slope? It’s past time to insist on a rational, objectively measurable regulatory standard for what constitutes harm.
Towards an objective, responsible definition of harm
Without a definition of what harm looks like, we have no way to measure it or determine if the protective regulations are working let alone being followed. The examples above give a sense of the metrics we have at our disposal to create a functional definition with responsible oversight.
What I propose here is one example of many possibilities because it is the easiest to visualize — what percentage of the seismic vehicle ruts are visible after 2 years? But the analysis can (and should) be expanded to include metrics of ‘depth of ruts’, ‘vegetation stress’, ‘hydrologic change’, etc. and the number of years varied from 1 to 25.
The idea is a simple and easily achieved: determine the exact routes of each seismic vehicle during winter operations with airborne mapping (see Section 1), measure which of those routes are still visible after 2 years (see below), divide the two numbers to get a percentage of track visibility in summer, then compare this number to the regulatory limits established for such harm. I call this method “Linear Impact Years” (LIYs) and “Linear Impact Year Ratios” (LIYRs).
For example, as part of the permit approval process, the Agency can define harm as LIYRs of 2% in Year 2, depending on the sensitivity of the ground. Then in Year 2, if we measure more than 2% of the winter routes having visible scars, we have an objectively determined that the regulations have not been met. Using the snow depth data during operations, we can determine what caused the harm — were the snow depth regulations were insufficient (and improve those regulations for next time) or did operations occur over snow that did not meet the regulatory standard?
For the 1002 Area, I imagine that LIYs related to depth of vehicle ruts might be the most important regulatory limitations — that is, an actual limit of, for example, 10 km of total rutting greater than 5 cm as opposed to a ratio. While visible scarring is indeed a huge concern here, in terms of caribou population dynamics what we are concerned with mostly is a rapid change in hydrology caused by tire rutting on slopes. To measure this accurately, we would also need three maps: a snow-free map before operations begin so we know know rut-free topography, a map during winter operations capturing each route, and a map the following summer(s).
These LIYs and LIYRs have the potential to eliminate the normal prevarications and obfuscations about harm because these LIYRs don’t lie — these metrics are the spotlight which cannot be ignored if they were regulatory required.
I think it worth stating the obvious here just in case — this method of using each new seismic project as an opportunity to improve methodology and regulations within the 1002 Area only works if we limit operations to small areas each year such that these improvements have time to evolve. That is, it would have been nice if we began this process 10 years ago so we’d be ready for it now, but it is what it is. It is also worth mentioning that such iterative, progressive improvements do not have to be made in the 1002 Area itself — such studies on any seismic project anywhere in the Arctic will benefit the 1002 Area.
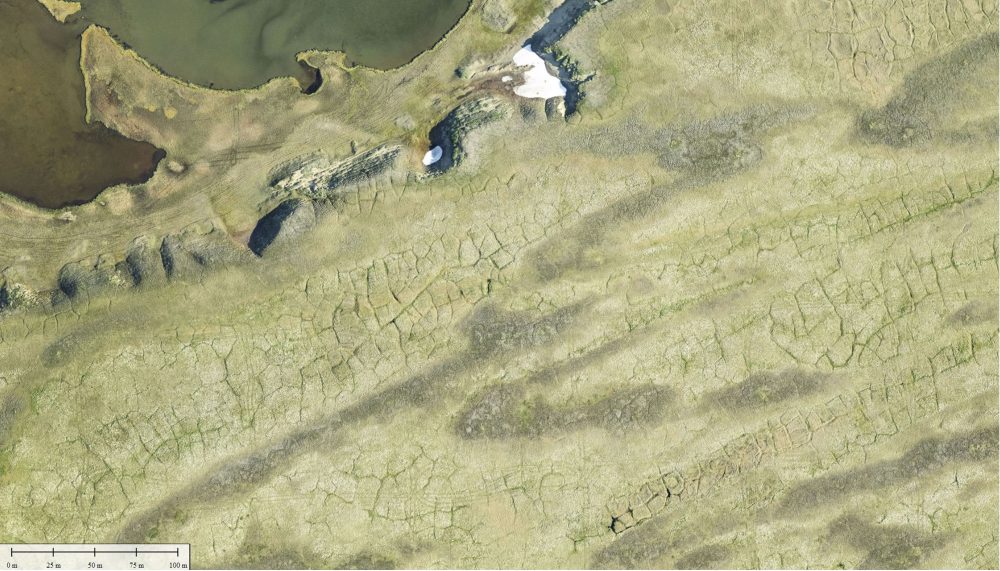
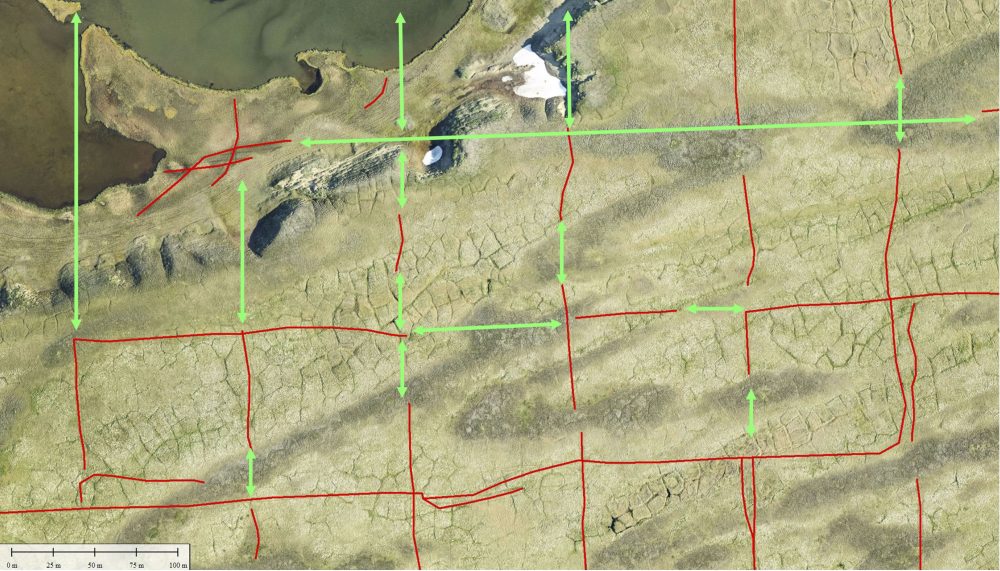
Towards an measurable, objective measurement of harm. An example of an measurable, objective means to determine if regulations on protecting the tundra have been met using LIYs and LIYRs. Here I’ve traced the observable tire ruts in red (difficult to see at this scale) and surmised the location of vehicle travel that I cannot find in green. That is, here we can see that there is some amount of snow thickness that actually does protect the tundra (green lines) according to this visibility metric. Some tundra types area also more resistance to harm, as indicated by the correlations between tundra color and the green lines. Unfortunately, there has never been a study that maps snow depth/travel in winter and severity of impacts in summer — but this needs to become standard practice so that we can scientifically determine the minimum amount of snow required for protecting the tundra and hold operators to account for following those regulations. Here I’ve used rut visibility as the metric, but we could also add rut depth, vegetation stress, or hydrologic change for a comprehensive suite of objective oversight measures.
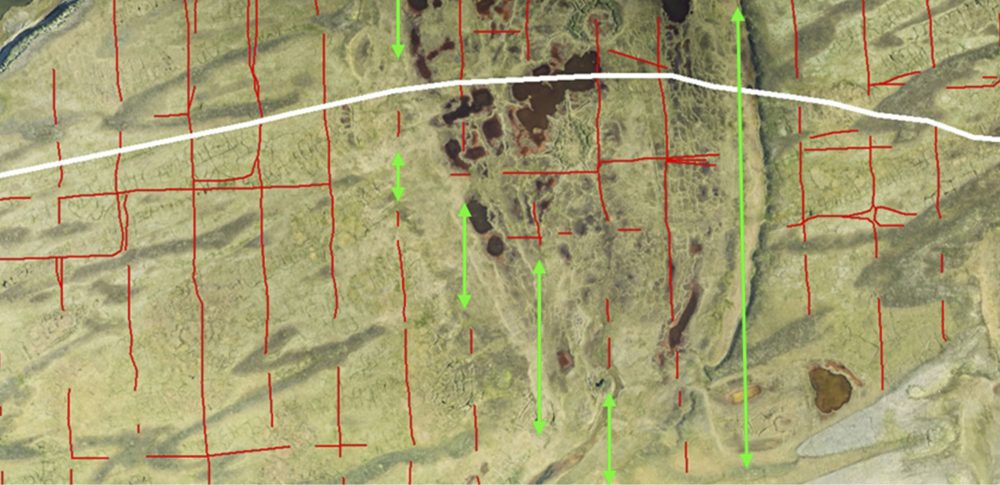
Towards an measurable, objective measurement of harm. Here is another example of the LIYR concept. In this case we can see that the green lines are concentrated along the banks of this drained lake — here we know that thick snow drifts form each winter and it is these drifts that keep the winter vehicle travel from scarring the tundra. Somewhere between “thick drift” and bare tundra, using this robust, available technology a snow depth can be scientifically determined that prevents scarring — there are no technical limitations preventing this, all we lack is a spotlight that cannot be ignored to make it happen.
Seismic operations are only permitted in winter, when sufficient snow exists to keep the heavy vehicles from causing harm. Unfortunately, there have been only a few studies of what constitutes ‘sufficient’ snow thickness and those are over 20 years old using methods that the author’s admitted were crude and insufficient. All subsequent studies of the impacts of seismic operations have shown permanent scarring. In terms of harm within the 1002 Area, I’m specifically thinking about how do we keep seismic operations from leaving any trace at best and causing a major decline in the Porcupine Caribou Herd at worst. The next section attempts to tie everything we know and could know into a series of tools that we could implement to ensure no harm comes to the caribou.
3. Is there enough snow in the 1002 Area to keep seismic operations from harming the Porcupine Caribou Herd?
Again, the short answer is that we do not know, despite this being a legal requirement in NEPA.
And again, the long answer is that there is no technical limitation to that gaining knowledge — the tools to answer this question have been around for over a decade.
Answering this question first requires understanding two things:
- How much snow is required to protect the tundra?
- What is the interannual variability of snow cover in the 1002 Area?
For the first question, Section 1 and Section 2 address how we go about the measurements required and a previous blog describes the terrain sensitivity in relation to the Porcupine Caribou Herd. Currently the regulations are set at 25 cm, though essentially no science supports that value.
This section begins with how we can answer the second question and ends with how we can use all of these data to answer the overarching question: Is there ever enough snow here to keep seismic operations from harming the Porcupine Caribou Herd?
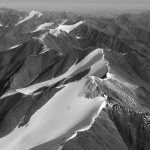
The 1002 Area is composed of foothills trapped narrowly between steep mountains and coast such that the topography causes winds to scour snow to bare ground here often throughout winter in a patchwork manner. The first blog in this series describes in great detail that the 1002 Area is not a coastal plain — here I describe why this matters for snow cover. That is, the snow pack here is never a uniform blanket, the many hills and ravines lead to bare ground adjacent to deep drifts such that it is rare to be able to place a uniform grid of seismic measurements without running over bare ground. Plus, given the strong winds, even if sufficient snow existed yesterday, it might not exist tomorrow, causing heavy vehicles to be stranded and unable to exist an area the way the entered without crossing bare ground.
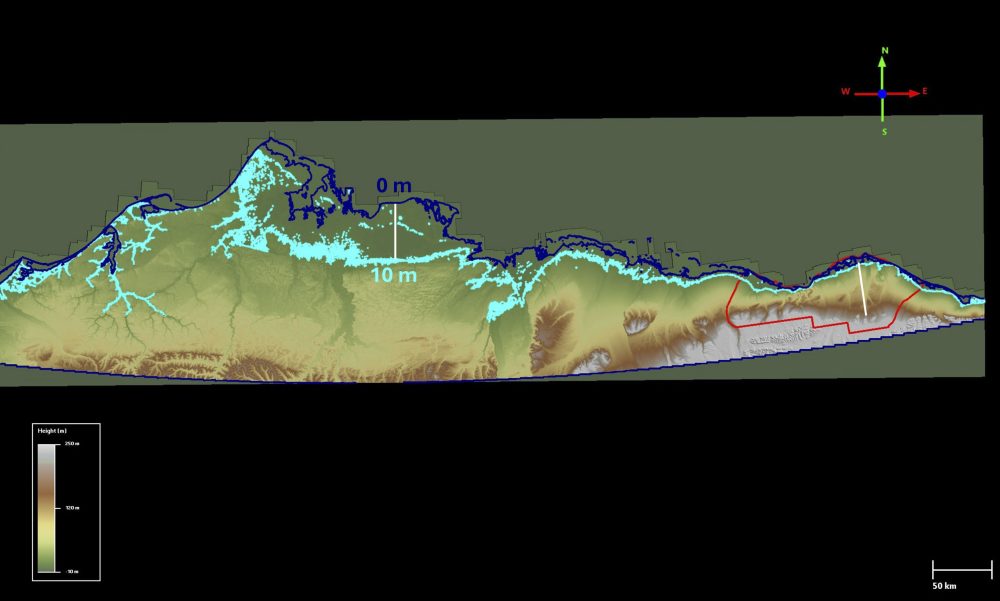
Towards responsible measurement of snow depth. The 1002 Area (red outline) is not a coastal plain. In terms of sensitivity of the tundra to disturbance, the region dominated by coastal plain processes is limited to the area between sea level (dark blue) and 10 m (light blue) contours. As can be seen, only a few percent of the 1002 Area is controlled by coastal plain process, the sensitivity to disturbance over the vast majority of it is controlled by hillslope processes. Essentially, a vehicle rut on a flat coastal plain may turn into a puddle but its impacts are limited locally — that same rut on a thawing hillslope becomes a stream which can drain or fill huge areas.
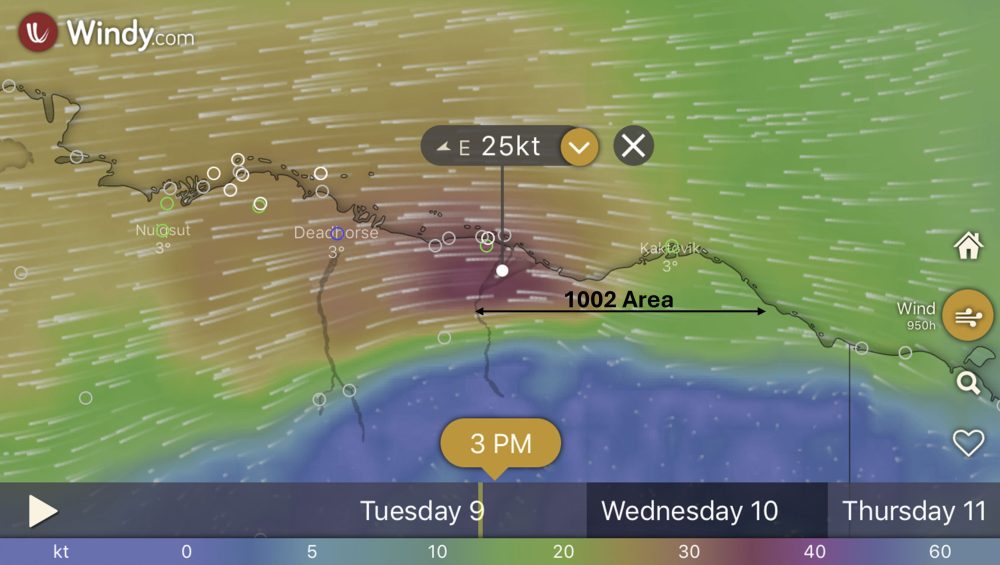
Towards responsible measurement of snow depth. The mountains have been pushed so far north here that the dominant east-west winds must funnel around them over the 1002 Area, intensifying and scouring snow. The combination of strong winds and irregular, steep terrain means that snow distribution here is highly variable — on flatter shelves the snow is often scoured away completely and in the incised cut banks of rivers and streams it accumulates into thick drifts.
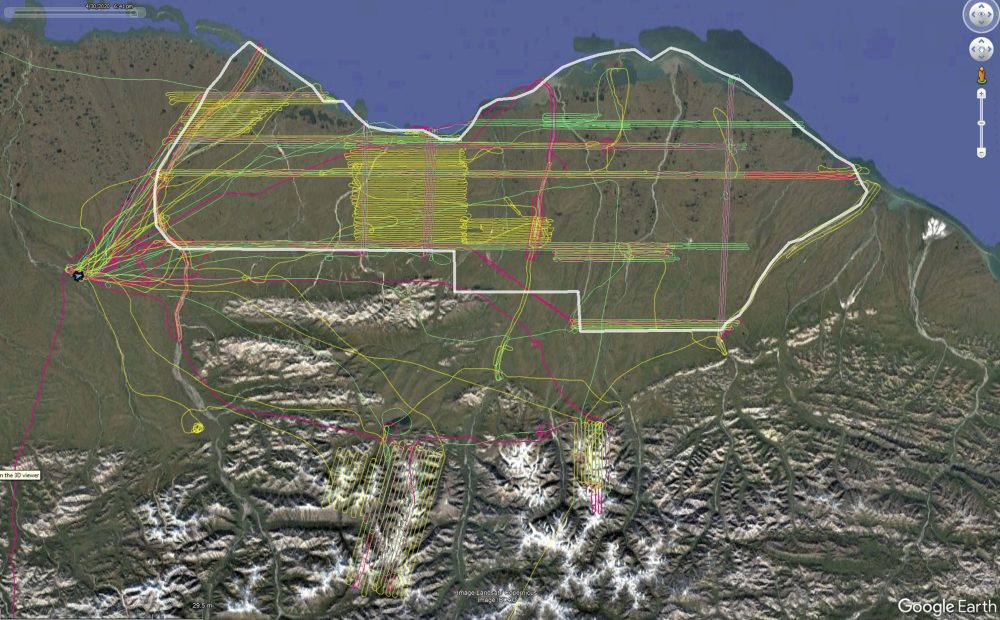
Towards responsible measurement of snow depth. I’ve been mapping snow thickness here since 2014. These are some of my flight lines over several years. Ideally we would be measuring snow thickness of the entire area each year, but in the absence of any external funding, I’ve been doing the best I can on my own by working along transects that I hope are representative of the broader area.
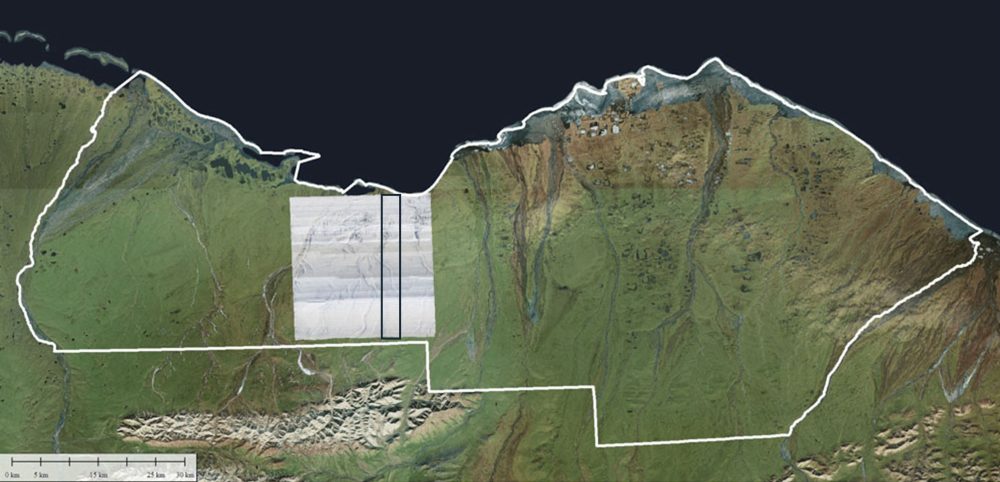
Towards responsible measurement of snow depth. The white block is my largest contiguous measurement area, covering a USGS quad and the steepest region of the 1002 Area (white outline). The black inset is a transect that I first measured in 2014 when I was developing this method for measuring snow thickness from the air and since then I and others have been using it as a primary indictor of long-term interannual variability.
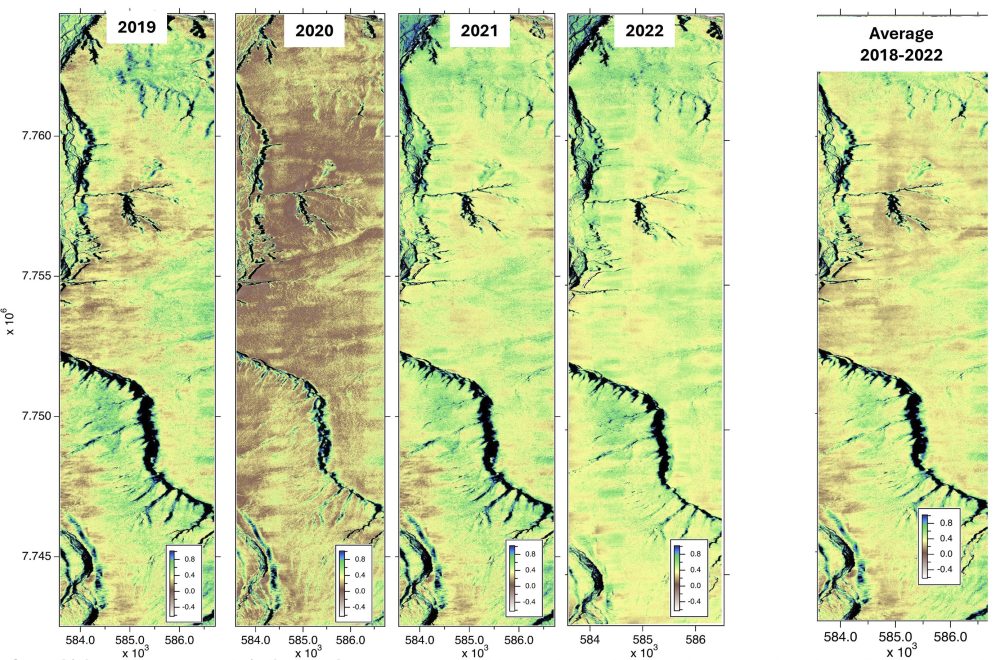
Towards responsible measurement of snow depth. Here is the snow thickness data from the black inset in the previous image, along with a composite average from these four years. As can be seen here, patterns of thickness and thinness are persistent year to year, though the actual values change. (Note that snow depth doesn’t go below zero as suggested in the color scale, this color coding was selected to make thin snow more visible graphically as brown and the 25 cm regulatory standard as yellow. Note too these are just preliminary plots made for this blog, a lot more rigor is required to finalize them.)
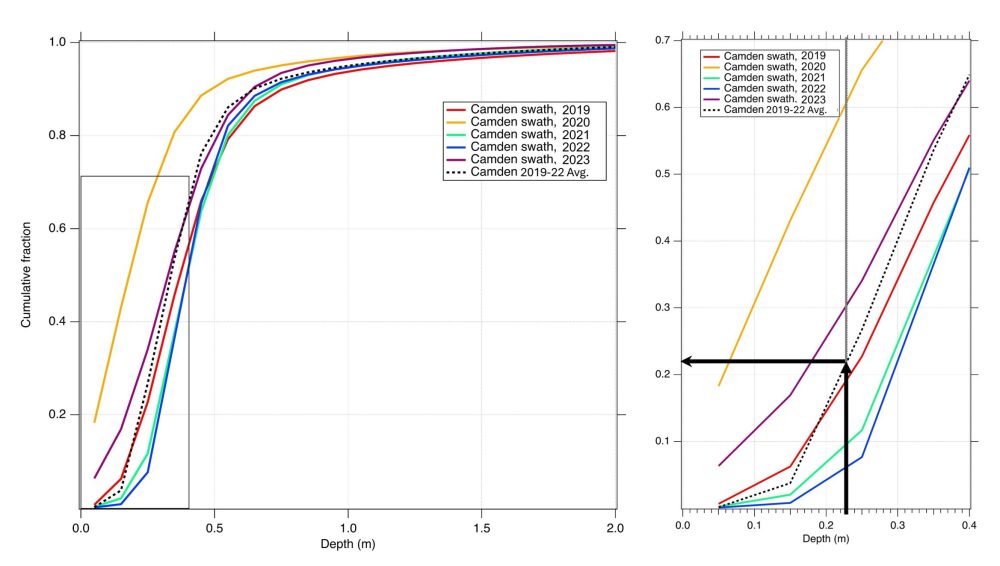
Towards responsible measurement of snow depth. Here is the distribution of snow thickness from the previous figure, as well as a four year average, with a detailed inset on the right. The black arrows at right indicate how to read the data: the four year average (dotted curve) crosses the current 23 cm regulatory threshold (vertical black arrow at x-axis) at about 22% of the cumulative total (horizontal black arrow). This means that on average over these years, the snow is too thin to meet the regulations over 22% of this area, but in some years as much as 60% of the area has too little snow. With a long enough time series (4 years here, but 10 is better) we can reliably predict both liklihoods like this and start to get at their trends (we expect less snow and more rain as climate continues to warm here). But knowing the total area above the threshold is only part of the story – it says nothing about when a 200 m grid segment will be fully supported by sufficient snow. For that we need to a better planning tool, as described next.
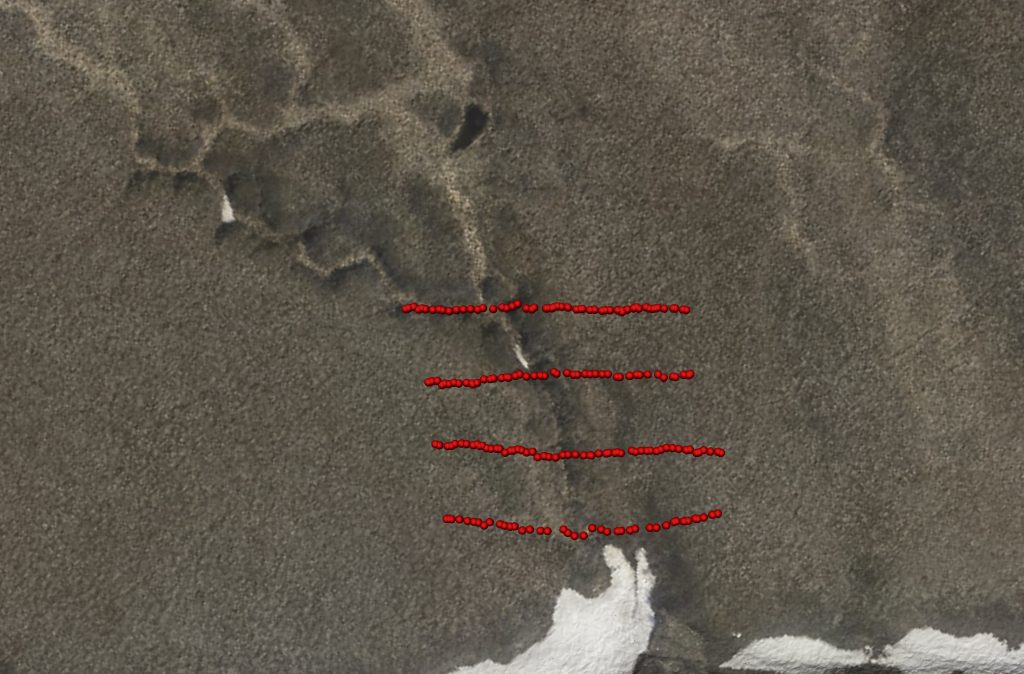
Towards responsible use of snow depth measurements in protecting caribou. In my 2019 blog about these snow depth measurements and their importance in actually protecting the tundra, I tried to visualize what a 200 m seismic grid would encounter, as seen with these red lines. On the smallest scale (upper left), these lines would each encounter bare tussocks, violating protocols. As we zoom out (upper right), the situation gets worse for seismic. As we continue to zoom out, the question remains – would it be possible to operate on a 200 m grid anywhere without encountering bare ground or below-minimum snow thickness? The next several figures describe a method to answer that question that could be implemented for planning right now.
Towards responsible use of snow depth measurements in protecting caribou. Here I’ve implemented my 2019 idea using real snow data from 2023 along the same transect as previously shown. I analyzed each segment of a 200 m x 200 m to determine if at least 90% of the pixels it overlay had snow greater than the 25 cm threshold — if they did I colored them green. Of fundamental importance here is to understand that only 43% of the potential grid lines passed the minimum snow-depth threshold despite 70% of the total area passing it (see previous line plots).That is, the distribution of snow matters — if we want to protect the tundra and the caribou that depend on it, we need to analyze snow and snow travel using maps like these — a few weather stations giving point measurements cannot possibly capture the level of detail necessary to ensure the required protection for caribou.
The examples below of this planning tool are not meant to describe an actual trafficability study for this location but rather to demonstrate how such a tool can be used, because there are many methodological uncertainties and heuristics that remain to be developed fully. The general idea though is sound: can the driver of these huge vehicles operating in polar night be reasonably expected to look 200 meters ahead to determine from the cab of his vehicle whether the snow thickness is above or below the 25 cm threshold? I claim that this is unreasonable and that the only responsible way to ensure that the minimums are met on every grid segment is to first measure the snow thickness on every grid segment, as I demonstrate below. I provide more detail on this in this report. That is, this is what responsible development looks like here — taking care to ensure that not a single track gets laid on snow that’s too thin to protect the Porcupine Caribou Herd.
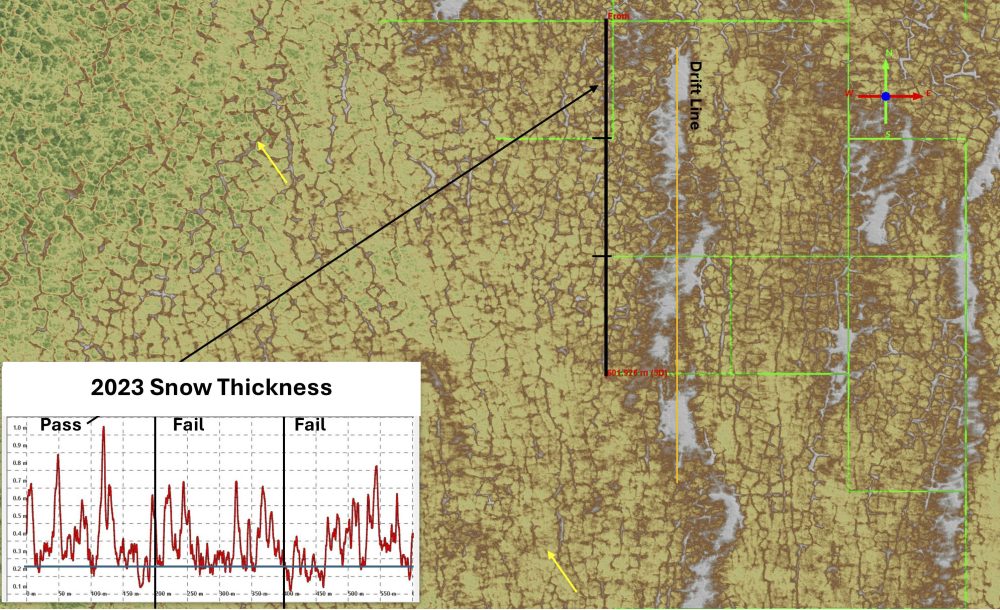
Towards responsible use of snow depth measurements in protecting caribou. Shown here is the same trafficability analysis as previously, zoomed in to better understand it, showing 2023 snow thickness with passing lines in green. The regulations in the 1002 Area specify 25 cm as the minimum snow cover, which is at about the yellow color here, trending towards green — you can see visually the green lines generally match up well with the brown color. Here a tundra bluff approaches the river bank (lower left) which is covered by thick drifts (white). But despite the drifts being large and plenty thick enough, there are only a few grid segments on them because of their shape — the grid segments fall on too much bare ground surrounding them. And there is no way to get to them without travelling over thin snow. The black box is the focus of the next figure.
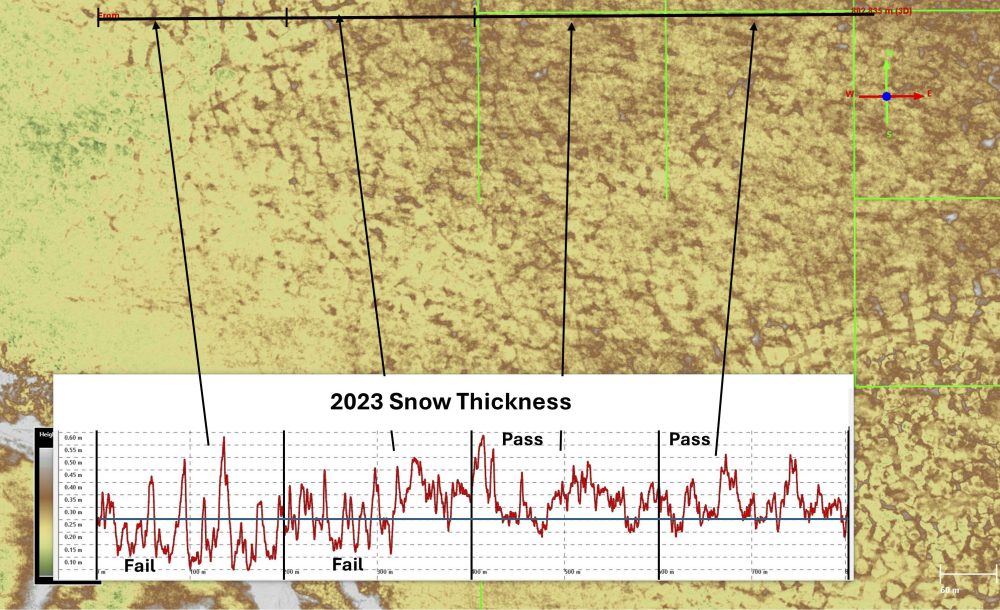
Towards responsible use of snow depth measurements in protecting caribou. This 800 m long transect (black line at top) covers 4 possible 200 m grid segments over the same 2023 snow data: two of these segments passed (green lines at top) and two failed (no green lines). Wind scour intensifies to the west near the bank, but there are still many locations above the threshold, just not enough, as the thicker locations are mostly inside melted ice wedge cavities. Towards the east away from the river, the snow is thicker even though both lines have pixels that fall below minimums. Here I’ve somewhat arbitrarily used 10% below the threshold, but any number could be chosen once more rigor is applied using the methods I’ve described in Section 1 and Section 2. Regardless, look at the winter image on right, it is impossible to tell how thick the snow is or which grid lines would pass — is it reasonable to think someone driving a truck would be able to tell this from the cab 200 meters away?
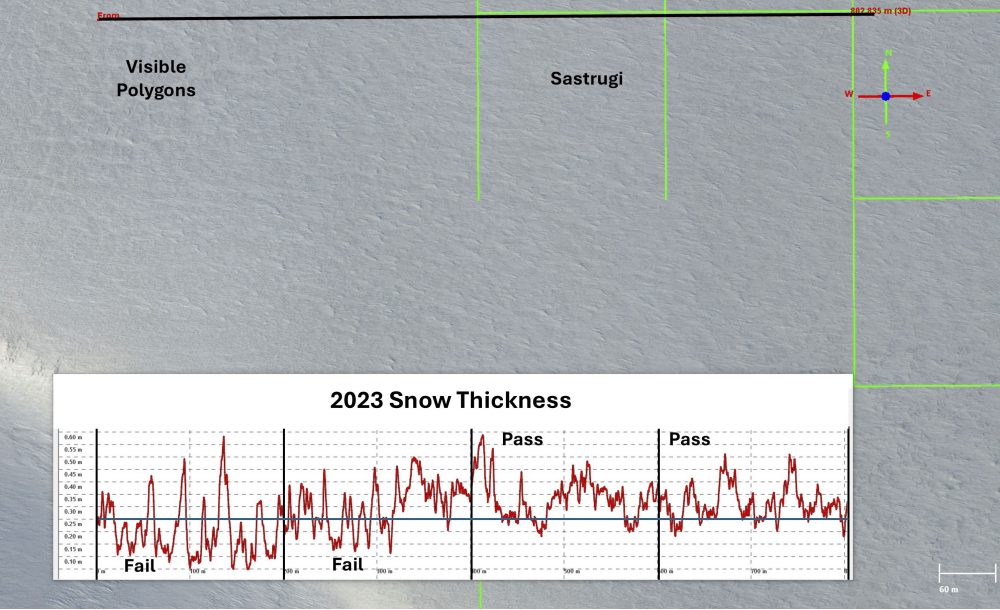
Towards responsible use of snow depth measurements in protecting caribou. Here is a 1200 m transect, reinforcing the point that despite everything looking white and snow covered, most of this area falls below the snow depth threshold. Note that despite the large drift at left, it does not cover enough of the line segment to pass. Note also, as with the previous analysis, this transect is not exactly on the grid lines so that the green lines can be seen, reinforcing that exact grid location matters. Again, this analysis is only useful in protecting the tundra if the equipment operators are using it in the field, something not currently required or even suggested by the regulations.
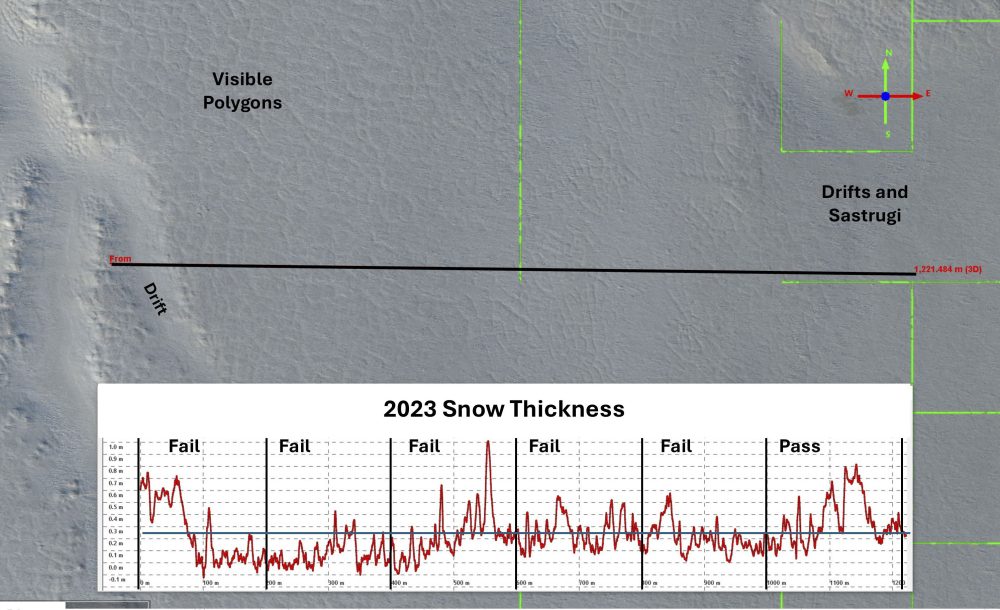
Towards responsible use of snow depth measurements in protecting caribou. Here is another example of how imposing a uniform grid of operations on a landscape that could care less about grids causes challenges. Here four segments fail, despite riding over large drifts. Several grid segments elsewhere pass in locations they would otherwise fail because they accidently align with large drifts (black arrows). If routes are planned with a tool like this rather than simply imposing a uniform grid, more ground could be covered with less risk of damaging the terrain irreparably by utilizing thicker snow (red arrows).
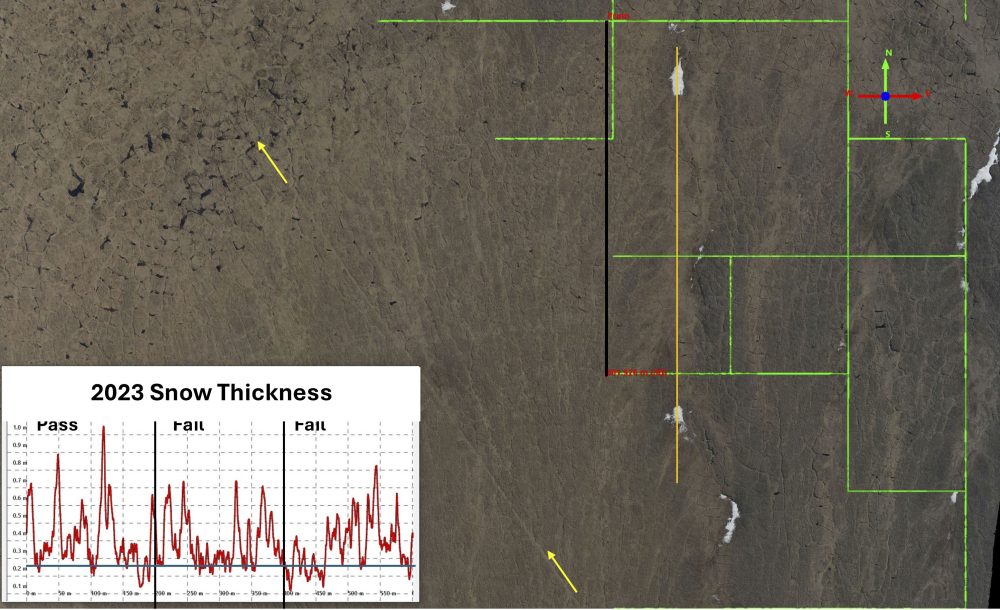
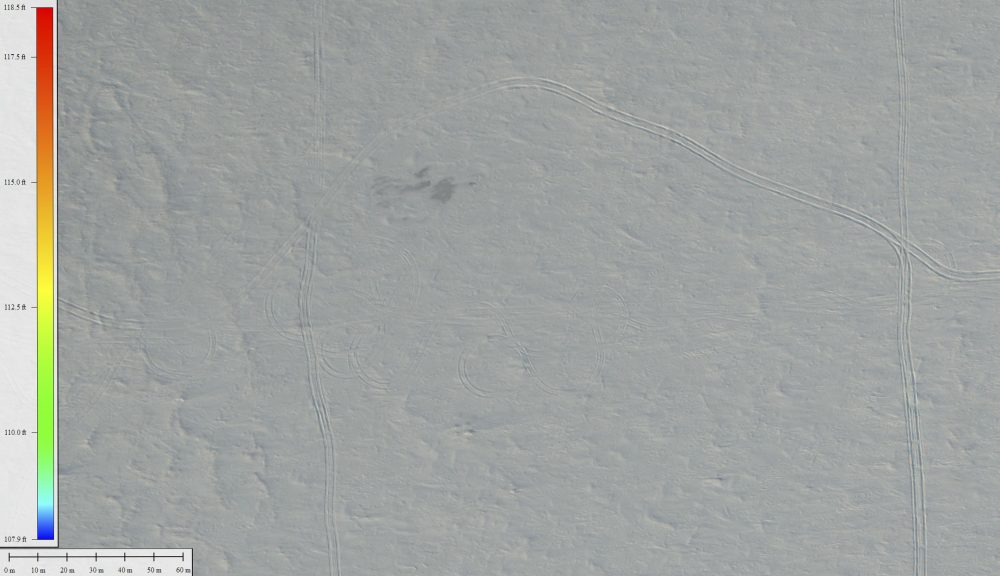
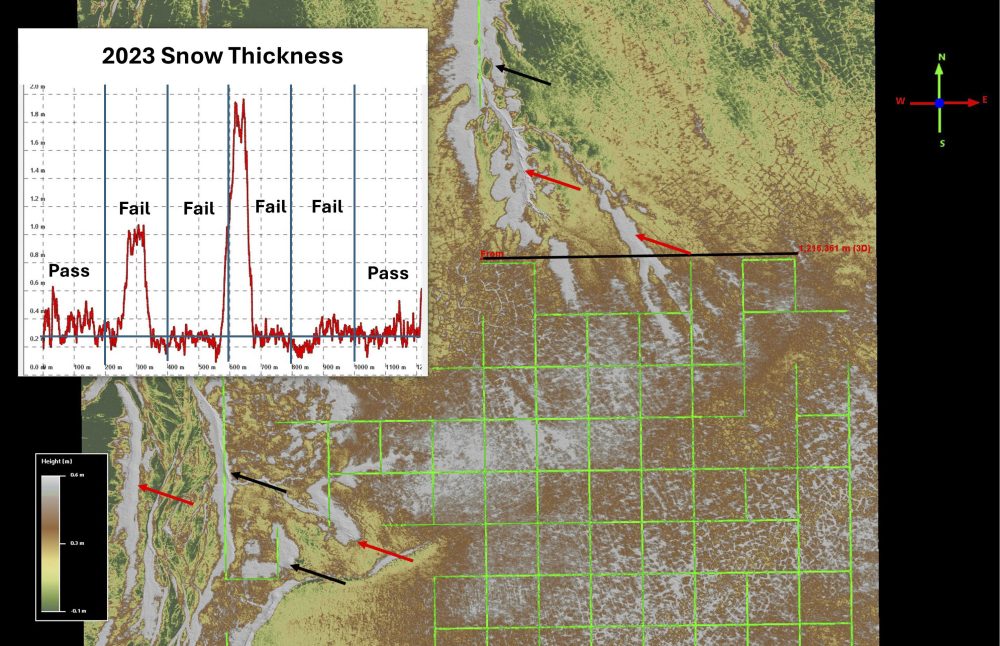
Towards responsible use of snow depth measurements in protecting caribou. This 600 m transect on the 2023 snow depth (left) demonstrates why 1 segment passed and 2 failed. Here we see that all three segments have most of their points over the threshold, but two do not have sufficient numbers (more than 10%) — is it reasonable to assume that an heavy equipment operator is going to figure out these grid segments fail the threshold from the cab of his truck 100-200 m away when the computer can barely do it? In the 1002 Area, failure to adhere to the regulations could have devastating impacts on caribou populations. At right is the same 600 m transect as the previous figure, this time overlain onto a summer 2014 orthoimage. Seen here (yellow arrows) is a trail left behind from winter travel in some prior year. Is it is a coincidence that this trail is only visible in regions which failed to pass the snow depth threshold in 2023? Remnants of the drift seen in the previous figure under the orange line are visible here, demonstrating that drifts tend to form in the exact same locations each year such that route planning using data or averages from prior years can be used to improve protections in any given year.
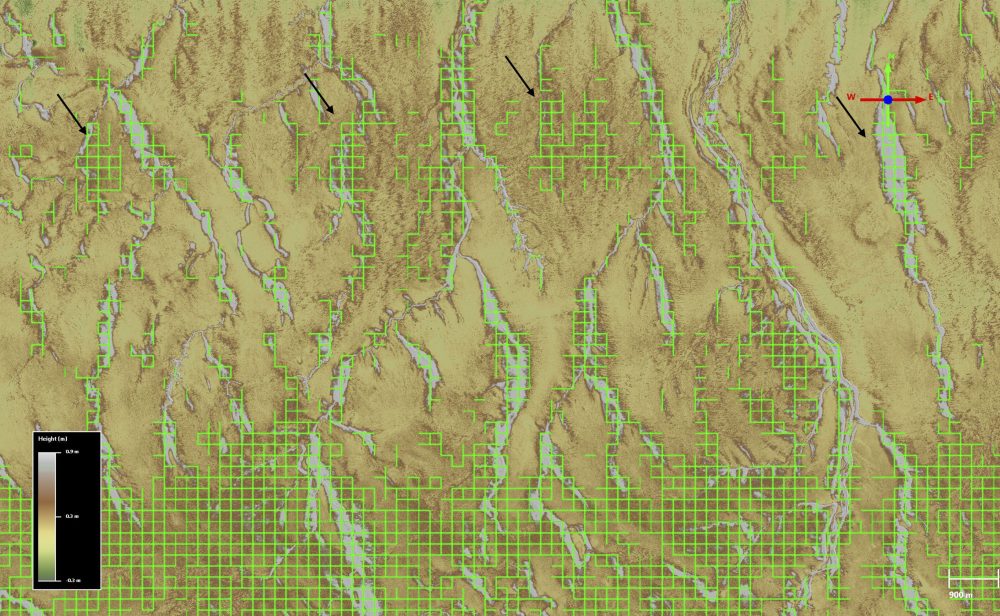
Towards responsible use of snow depth measurements in protecting caribou. After a heavy snow, the entire landscape may be in the green, like the southern portion of this image. But after a heavy windstorm, much of this snow may be blown away creating green-grid islands seen near the top of this image. If trucks were on the job during the storm, how would they return from these green islands to the camp below without traveling over snow that did not meet the regulations and so endangered the Porcupine Caribou Herd? The regulations offer no guidance on this because they barely mention seismic work at all. That does not meet my definition of responsible development and I hope that this series of blogs has convinced you to agree.
Conclusions
We’ve seen laws here get ignored before, largely because no one had collected the data necessary to support either side of the law suits. The practical result is that the absence of any information means the courts side with the BLM — the government finds itself innocent until proven guilty, by us.
That is, having no scientific data works to the Government’s and Industry’s benefit, so neither of them is going to fund the required studies.
It’s time to go on the offensive and collect these data ourselves.
Seismic operations are planned for this coming winter in the 1002 Area to support the lease sales being held this summer, though as yet no permits have been applied for. This summer is therefore our last and best chance for ensuring that if development is going to occur here that it is done responsibly. Together we can hold our politicians to account using data which cannot be dismissed because we are the only ones collecting any data at all.
I’ve already mapped this new seismic work in April of this year (see Section 1), now I need to map it again this summer so that I can measure snow depths (subtracting summer topography from winter) and measure the severity of impacts (Section 3) such that we will, for the first time, know how much snow is required to actually protect the tundra in a responsible way.
We will then hold all the cards because only we have these data.
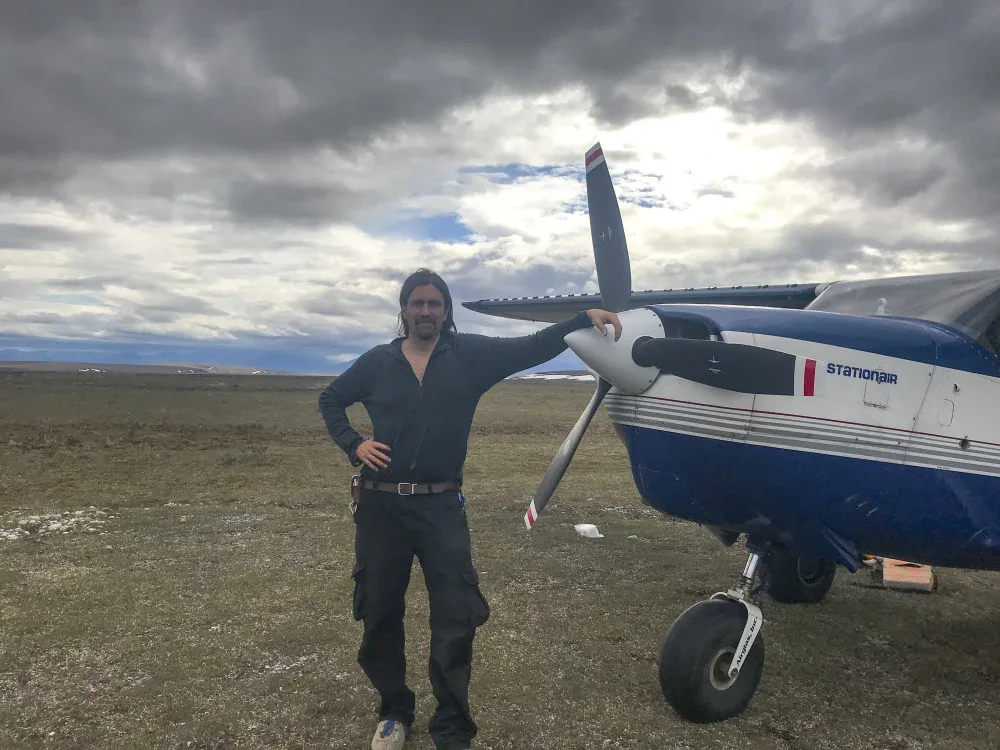
Me, in 2018, bringing a Leatherman to a gunfight by mapping the entire 1002 Area to shine a spotlight that couldn’t be ignored on seismic operations. I did it because it needed to be done and I was the only one both capable and willing to do it– I didn’t wait to be asked, I didn’t ask for permission, and I didn’t wait for someone to pay me. It needed to be done then because without it we would not know the potentially devastating linkage between seismic operations and the Porcupine Caribou Herd that we do today. (Or rather, we would have found out the hard way.) I’m asking for your help now to take this research to the next stage by acquiring the data required to understand how much snow is needed here to prevent that outcome. The Government is not going to fund it and Industry is not going to fund it — I know because I’ve asked. So it’s down to you and me.
So if you are feeling generous and see the value of what I’ve been doing here, please consider donating to the GoFundMe account I’ve established for this project.
The data in this spotlight cannot be ignored without tossing out the rule of law altogether, in this case NEPA, the laws that are supposed to give citizens a fair chance at understanding the environmental impacts and choosing the among the options.
And I am working with a team of lawyers dedicated to protecting these outcomes and who are eagerly awaiting these data so they can shine their legal spotlights on them.
Together, our collective spotlights can connect with these weak spots…
In terms of impacts, the law states that existing Environmental Impacts Statements do not satisfy the law if “there are are substantial new circumstances or information about the significance of adverse effects that bear on the analysis”. Is wiping out half of the caribou’s preferred foods significant? Only if we shine a spotlight on it that can’t be ignored.
In terms of planning, the law states that “all practical and reasonable means to avoid or minimize environmental harm” must be utilized. As I’ve shown in the previous blogs and this one, airborne photogrammetry is both practical and reasonable as a tool to minimize harm, but it will be done only if we shine a spotlight on it that can’t be ignored.
In terms of oversight, the law requires the “BLM will ensure their lessees … adhere to all lease stipulations and required operating procedures when conducting permitted activities in the Coastal Plain”. In this blog I’ve shown what true oversight can look like — but it will be used only if we shine a spotlight on it that can’t be ignored.
So please consider shining a spotlight that can’t be ignored by your politicians and the BLM, and amplify these messages through your favorite nonprofits:
- “Harm” to the tundra must be defined in an objectively measurable way
- Harm must be measured objectively through airborne mapping and the data shared with all stakeholders to ensure compliance
- The regulatory guidance on seismic operations must receive the same level of care as infrastructure
- Seismic operations should not be permitted until methodology and regulations can ensure the Porcupine Caribou Herd will not be affected
- Snow depth should be measured for 3 years prior to any seismic activity to determine where the snow is reliably thick enough to use responsibly
- Snow depth be measured during seismic operations to ensure regulations are followed and to improve future regulations
- Vehicle trafficability in the field needs to based lines overlain onto snow depth maps to prevent grid segments from travel over snow that is too thin
- The potential damage caused by the vibroseis plate must be studied and regulated before seismic work proceeds in the 1002 Area
If you want to dig in further, here is the BLM’s Record of Decision that contains all of the regulatory guidance for seismic operations and infrastructure development. As you will see, there are only a few lines regulating seismic within that entire document. In my response to the public comment period to this document, I wrote a detailed report from which this series of blogs was adapted from and which included 10 pages of recommendations for how seismic operations should be regulated. Please consider reading both and ask yourself why my 10 pages of common-sense recommendations were not already included and why they were not adopted once read by BLM — if you think they should, shine a spotlight on them that can’t be ignored.
And please consider donating $17/month to the overall cause. There’s no shortage of research that needs to be done here — the seismic mapping project is only one of many. If you found these blogs useful, please understand that I did all this with my own funding often at odds with the powers-that-be so please consider paying it forward as I can be much more efficient and focused on staying ahead of the game. If only 250 people donated $17/month, I could at least cover my costs for this research. That’s the price of a coffee and sandwich at Starbucks — are there 250 people out there that would sacrifice that once a month to help protect the Arctic National Wildlife Refuge? I hope so, but I’ll keep at it in any case and encourage you to contribute to this effort however you can.