

Ghost and zombie glaciers of the Arctic National Wildlife Refuge
The value of participating in long-term baseline measurements of the glacier-climate interactions
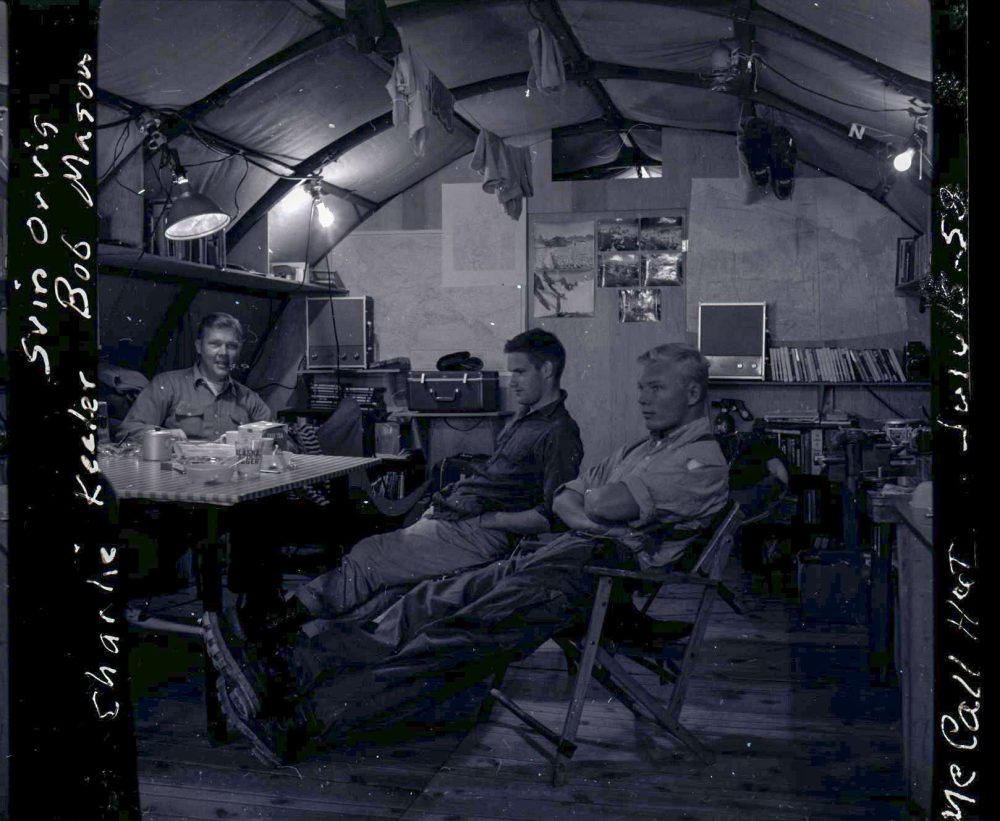
I’ll never forget holding up the negatives to my bedroom window in the dim light of Fairbanks midnight before our first August trip to McCall Glacier in the Arctic National Wildlife Refuge.
I began leading the research project there a few months earlier, in May 2003. It was the biggest field project I had ever led myself and I felt a lot of pressure to succeed.
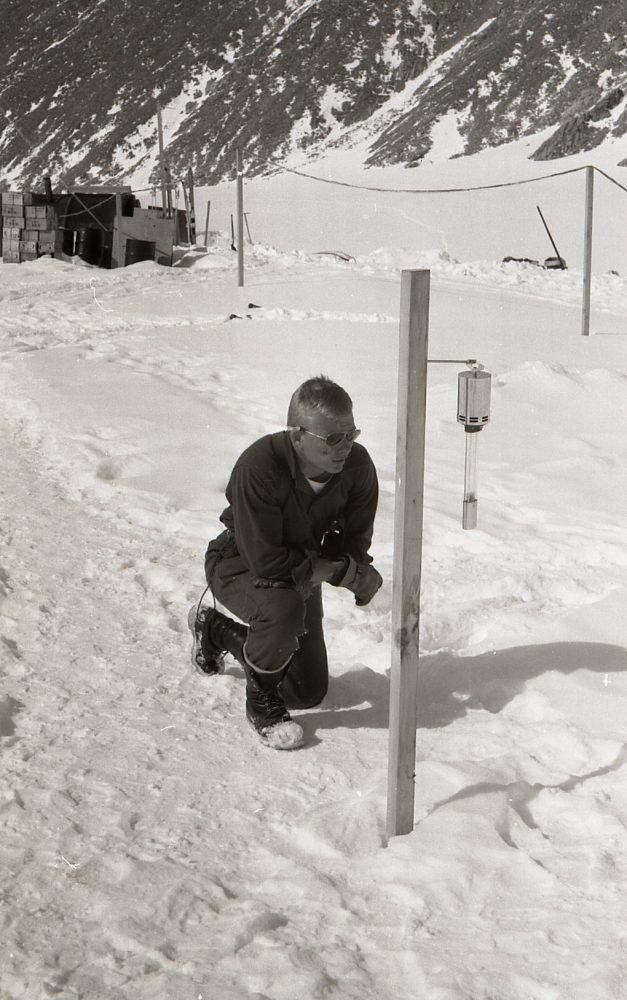
As a new Professor, I was eager to demonstrate how I could bring this research program into the 21st Century. At the time, I was somewhat shocked to learn how little science tech had changed out there since the program began in 1957. In May we installed several automated weather stations, installed 60 mass balance stakes to track snow fall and ice melt, and incorporated GPS for the first time for surveying– in all creating the about most comprehensive set of measurements of any glacier in the world. We were only there for about 10 days but accomplished a huge push with a small team, a push that felt even huger as I had only two months to prepare having spent the winter in Antarctica.
In the 1950s, to measure glacier motion the team had to climb the surrounding peaks to triangulate the positions of stakes on the glaciers using optical theodolites. Though the monuments they left on the peaks allowed future research to mostly stay on the glacier, not being one for heights I replaced all this with GPS surveying when I took over. It still required some climbing to survey in these monuments, but at least we only had to do it once…
Over the summer I began to learn more about the history of research here. The project began in 1957 as part of the International Geophysical Year (aka, IGY) and this was the US contribution to Arctic glaciology, complementing the US Antarctic Program (which was 100x the financial and logistical scale). Many of researchers who had been involved with the program over previous 45 years were still around and many were still active. Indeed, I had taken over from one of my mentors and he had taken over from one of his, and both had offices next to mine. All were eager to share their stories and tell me what they wished they had done or what they hoped I would do.
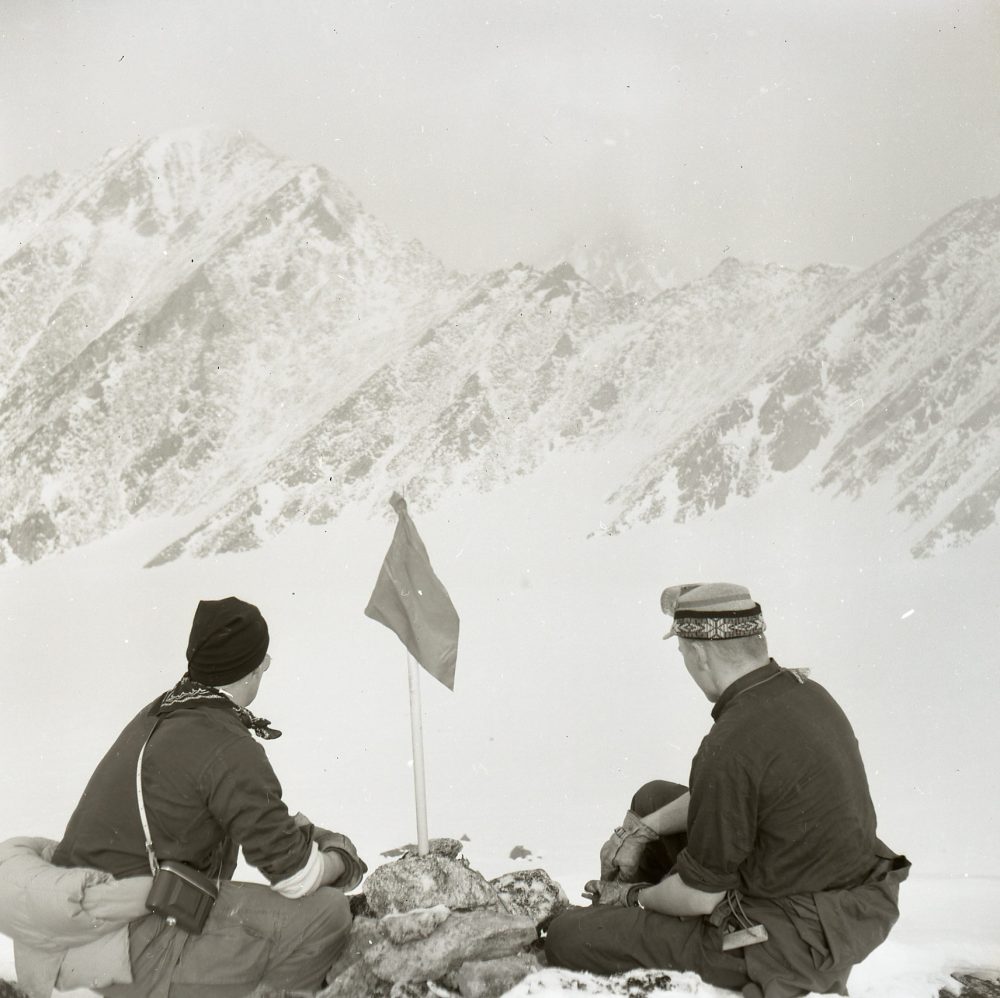
During this time I learned that Austin Post had spent the summer there in 1958. He was an icon in glaciology, or perhaps even an iconoclast. He had no formal education in glaciology (or anything else) but through decades of observation and photography had built up an archive of knowledge and photos that are, even today, unrivaled. He published few papers, but almost any glaciologist my age or older has been influenced directly by his ideas and suggestions.
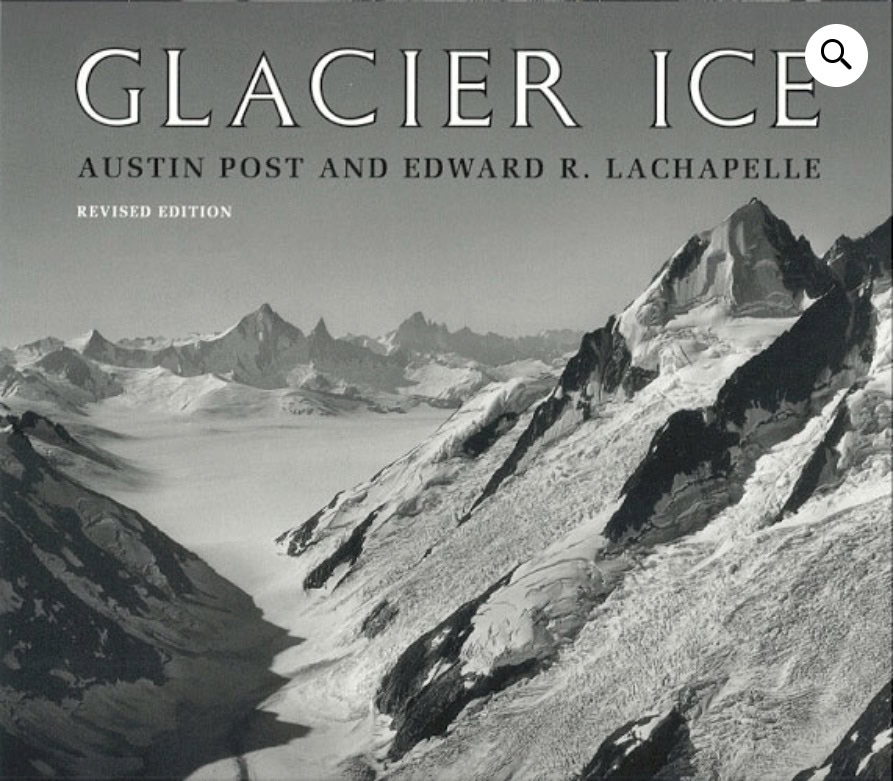
My favorite book on glaciers. It’s mostly photos taken by Austin over several decades and annotated with captions, giving a flavor for what glaciers are all about better than any textbook can.
It turns out he was not meant to be part of that expedition, but filled in to help finish the work of his best friend, Richard Hubley, the leader of the expedition who died on the glacier the previous winter during their planned 18 month field trip. When I learned this a few weeks before my August trip, I contacted him to let him know that I was now leading the project and was trying to learn more about its history.
A few weeks later and a few days before our August trip was to begin, I received a shoebox in the mail filled with hundreds of medium format and 35 mm negatives — photos he had taken during his trip there — with each located on a scrap of map paper, along with some useful thoughts. None had ever been printed before and likely they had sat in a shoebox like this for decades.
It was these negatives I was holding up to the light in a hurry, trying to get a few hours sleep before our departure.
While they were all great and I have since repeated many of them, the one that stuck out to me was a photo he had taken of the terminus of the glacier that summer. It had perfect composition from a mountainside, so was not simply a snapshot he took casually.
This was the one!
I wanted a photo that could capture the imaginations of those who would never visit here personally, to give them some sense of the changes that had occurred since the program began. This corner of the Arctic is incredibly remote, even for Alaska, yet there was almost no research being done here on the physical landscape as it related to climate change. The 4th International Polar Year (the IGY was the third) was only a few years away in 2007 and I wanted to put McCall Glacier on the map as an example of the importance of long term baseline studies.
Our August field trip was ending soon and I still hadn’t taken the repeat photo yet. After a full day of field work I decided to find the photo location rather than head back to camp. It was late in the evening, but it doesn’t get dark here and I felt it was now or never given how quickly the weather can change and how far this photo location was from our camp at mid-glacier.
It took several hours of scrambling up loose rock ridges to find the spot, each ridge taking an hour or so to traverse up and down. At first I made the mistake of trying match the distance of current terminus with the perspective of the old one, forgetting that in the past 45 years that the glacier had retreated substantially — duh!
But after several scrambles up the valley walls I felt confident I had found the spot — several large flat rocks made the obvious place to sit, have lunch, take the photo, and soak in the view.
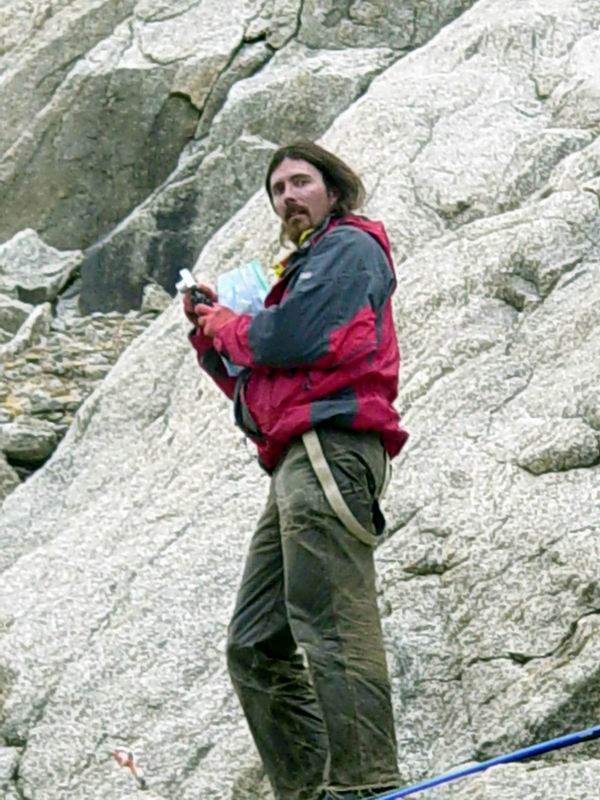
Me, with my cutting edge 2 megapixel camera, ticked off I had scrambled up the wrong slopes and worried that my 32 megabyte memory card was nearly full because I was taking too many photos on the way up in case I never found the actual spot.
It was a eureka moment and changed my perspective about this place forever. Re-taking that photo connected me to the past in a way that conversations and reading professional papers never could. I was literally standing in the footsteps of those who stood before me.
While my goal was to educate the world about the value of long-term baseline studies, it was me who got the education beginning that night.
The team that started this research got dropped off in April 1957 and planned to stay there until September 1958, eighteen months later. My trips were planned for half as many days. Blitzkreig missions compared to their lifestyle missions.
It took a few weeks for the eureka moment to fully sink in (it’s still sinking in actually) and realize that something important was being lost in field Science. That I was missing something. Probably a lot of things. While my automated equipment certainly does a better job of recording weather than their manual observations, what they do not give me is time to pause in this Wilderness and let nature tell me it’s story by being there every day to make those measurements. My stations record the winds but can’t give me the insights that come with walking back to camp during a 100 mph wind storm watching the snow scour down to bare ice in the path ahead of me. My stations tell me the relatively humidity but they don’t capture the smell that the fog carries when it rolls in from the tundra every afternoon. My stations tell me when the snow is melting, but they don’t capture the spectacle of slush flows powerful enough to wash the station away and incise rivers into the ice along their chaotic path that grow through the summer. These blitzkreig trips give me a ton of useful information, but they are not substitutes for living on the glacier, watching it for years, and seeing what I did not expect and would otherwise probably never realize.
I also began to more fully realize that many of nature’s most interesting stories don’t fit into a human time scale. Austin’s photo was taken 45 years earlier, yet it was 10 years later before the main story I describe below began to unfold and 15 years after that to hear it clearly. Without the foresight of the pioneers here, I’d only be guessing at key points of that story or, if I had limited my efforts here to one 3-year proposal cycle, I probably would have missed it completely. So much of environmental science is devoted to using clues to figure out the past because there are no stories already told to draw from. Long-term baseline environmental studies like these transcend our individual mortal coils, allowing us to hear nature’s trans-generational stories that can be passed down, fleshed out, expanded, and combined with other stories. It’s like a painting that is never complete yet touches those who look at it any point in its journey, suggesting to the next artist where the broadest brush strokes can benefit from refinement to its current audience. In a way that describes Science itself, but to me it is somewhat more poignant when an enormous hunk of nature, a glacier, is responding daily to it’s environment in a way that takes decades to manifest fully and several lifetimes to figure out.
So I made the decision then to be as old school as I could manage in this modern world while still bringing to bear the of best the 21st century technology — lifestyle science rather than blitzkreig science — listening more sensitively but for as long as needed. Prioritizing hearing the stories nature was telling in its own time rather than just the time my funding made available. I question that decision often. And often with curses. But I’ve never answered otherwise. I’ve been listening to this story now myself for nearly 25 years and don’t regret a moment of it.
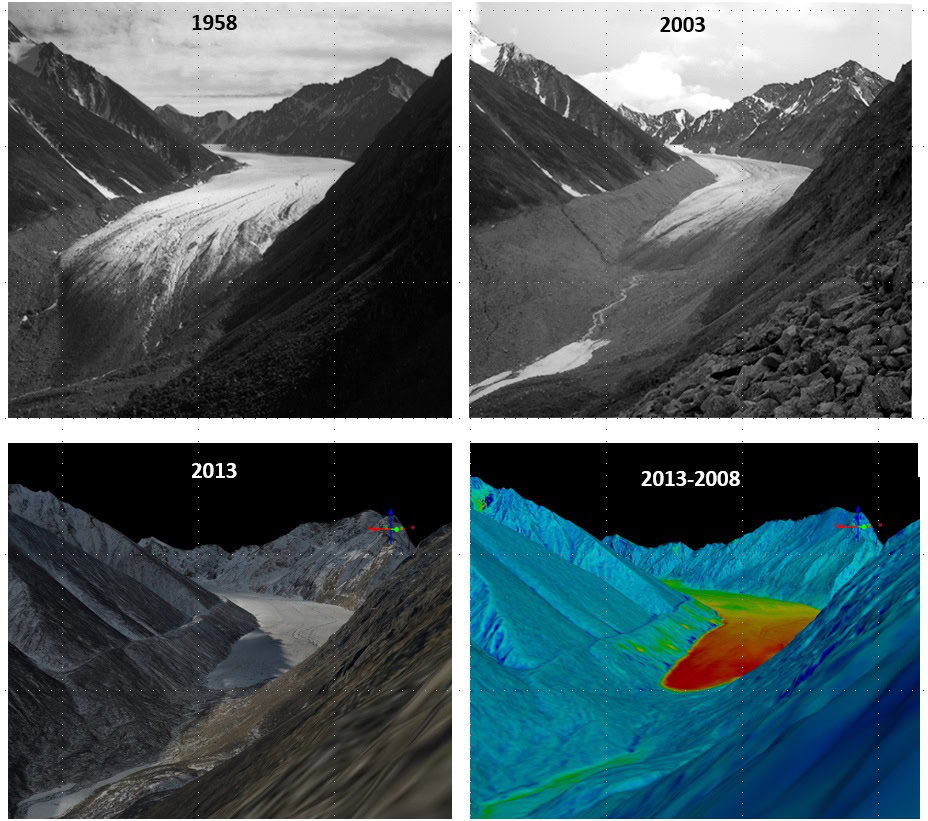
The terminus of McCall Glacier, from old school to new school. At upper left is the photo that Austin sent me in his shoebox of treasures. At upper right the photo I took to repeat it, with the midnight sun coming from the north behind me. At lower left was the first fodar map I made of the glacier, shown in a 3D perspective from that photo location. At lower right, a visualization of ice volume change comparing two topographic maps 5 years apart. I don’t know if I will ever get to that spot on the ground again, but I hope whoever takes over from me makes that trip, because it’s worth it.
Introduction
This blog tells the story told to me by the glaciers in the mountains of the Arctic National Wildlife Refuge over the past 25 years about how they influence the ecology of the 1002 Area and how this influence must be considered prior to oil development there, including seismic operations and infrastructure development.
In short, the glaciers here are disappearing fast and this loss of freshwater and sediments flowing out of them impacts the fish, birds, nearshore marine life, and four legged inhabitants of the 1002 Area, such that without understanding this story it would be impossible either to disentangle the influence of development from the influence of climate warming here or to develop meaningful regulatory protection protocols for it.
Likely there wont be much ice left in 50 years and this has broad implications for the downstream ecology. In the meantime, there is a lot of work we can do to refine and understand what those implications are through a combination of continued field work and modeling of the glaciers here so that ecologists can incorporate this information into the stories that the tundra is telling them.
I hope that this imperfect telling gives you the flavor of that story so that you can feel a connection to this place the way I do. You can read through the details below or jump to the conclusions to learn how you can participate in this effort as it unfolds.
This blog is broken into several sections:
Today’s ghost and zombie glaciers
How do these glaciers impact the ecology of the 1002 Area?
How soon will the zombie glacier apocalypse occur here?
This blog is part of a series I’ve written that describe the sensitivity of the Arctic Refuge’s tundra to disturbances such as seismic operations, largely revealed through my fodar measurements over the years. You can find these other blogs here:
Part 1: How seismic operations threaten the Porcupine Caribou Herd
Part 2: The sensitivity of the 1002 Area to disturbance by seismic operations
Today’s Ghost and Zombie Glaciers
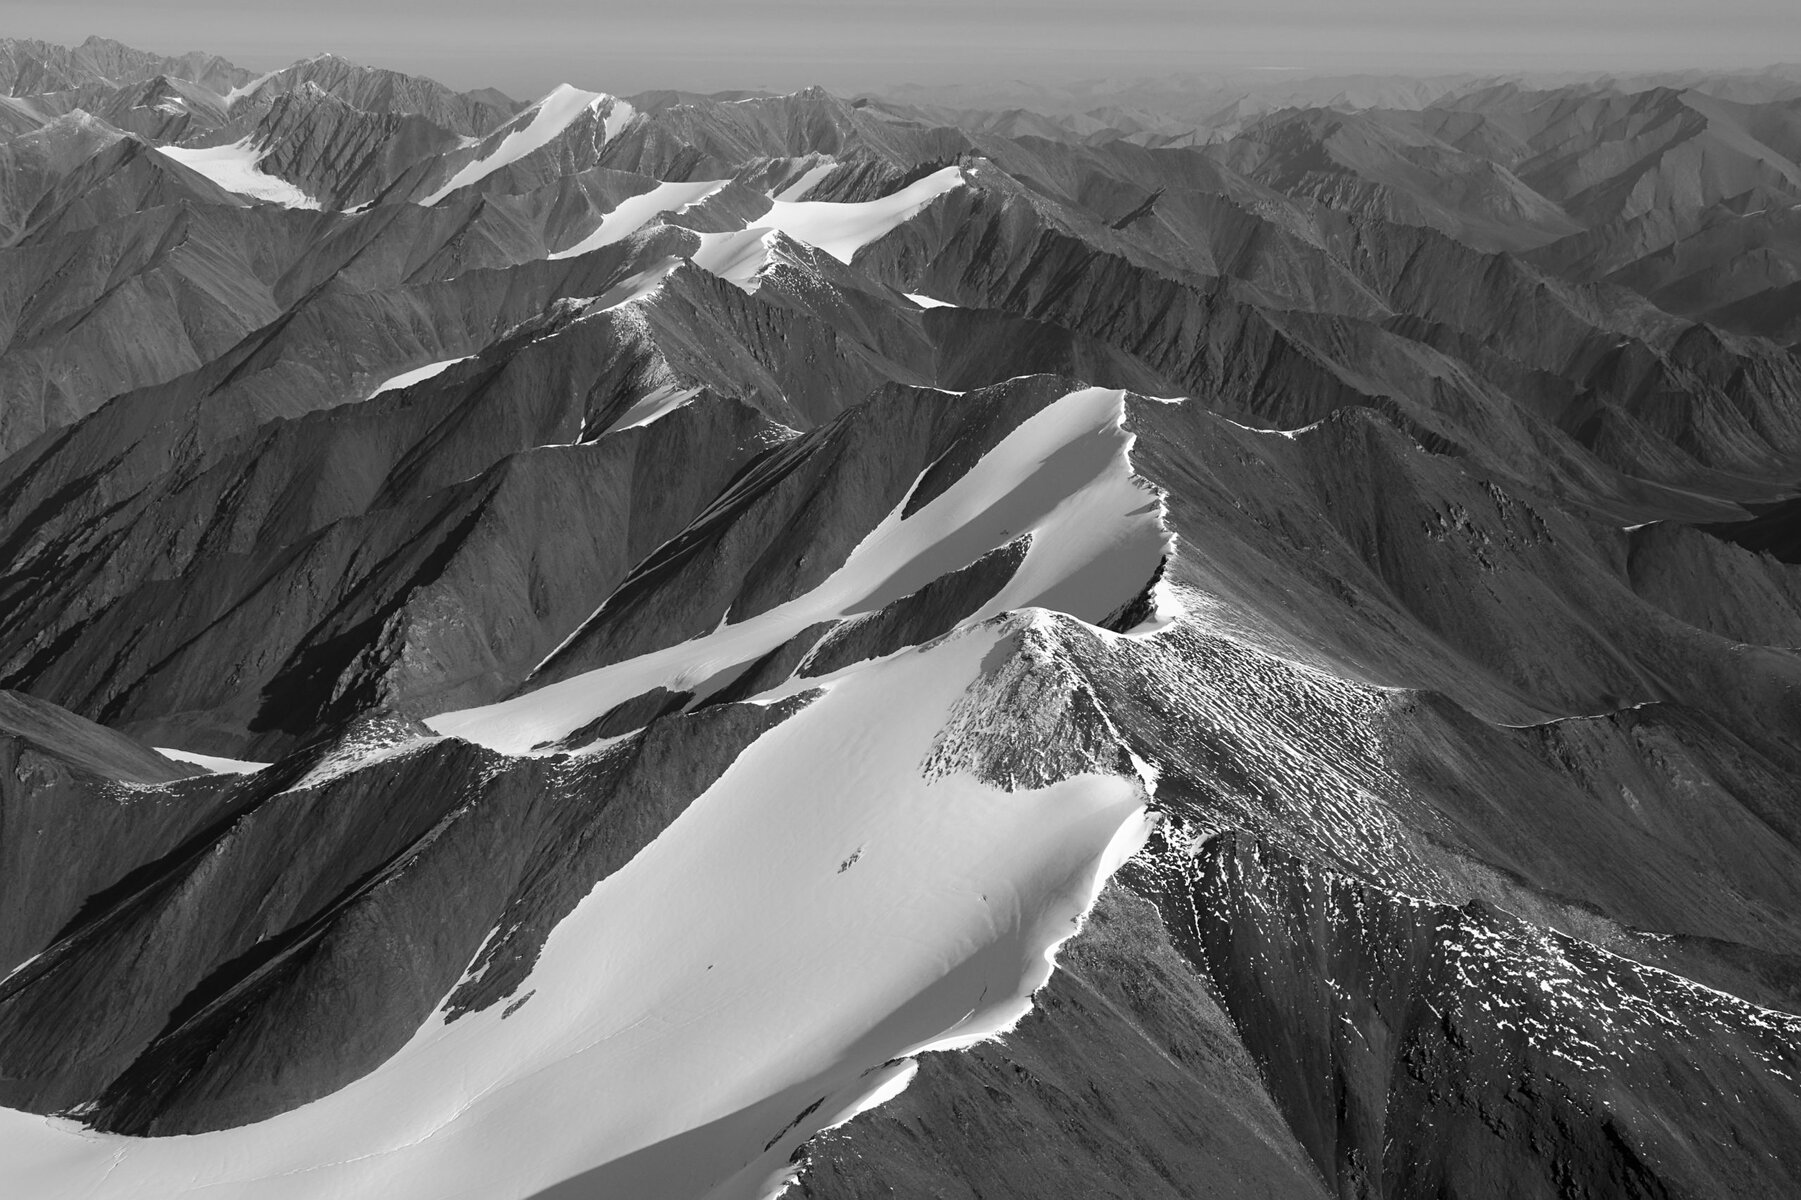
The tallest and farthest north mountains in all of Arctic Alaska are located on the southern border of the 1002 Area due to tectonic activity still pushing them northward, creating the highest concentration and volume of glacier ice in Arctic Alaska. While there is no glacier ice within the 1002 Area, glacial meltwater dominates the major rivers running through it, especially the Jago, Okpilak, and Hulahula Rivers.
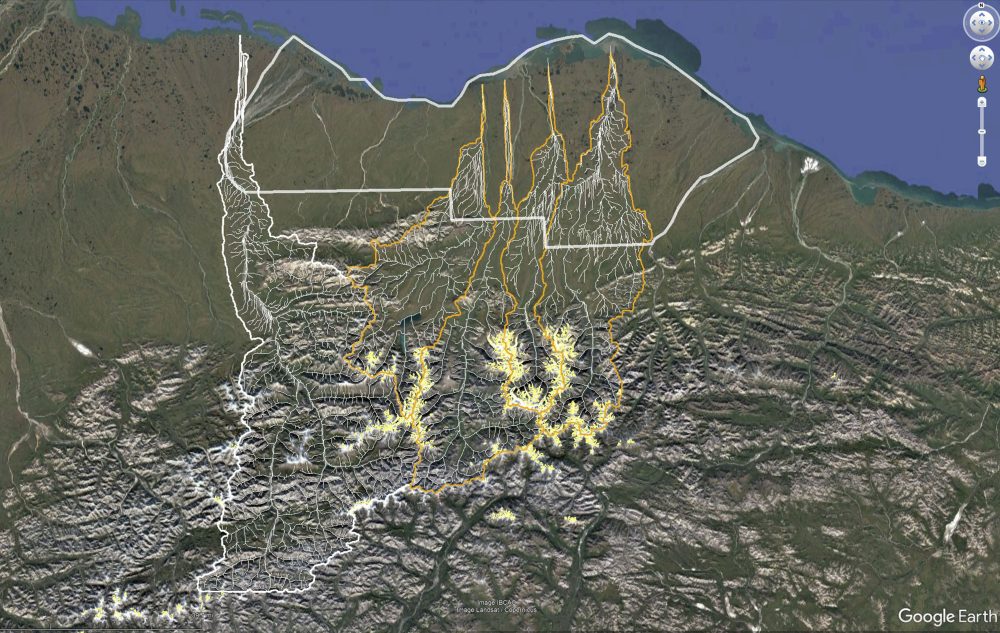
The four watersheds outlined in orange are the Sadlerochit, Hulahula, Okpilak, and Jago Rivers which are all heavily dominated by glacier meltwater. Each river passes through the 1002 Area (white outline) and the loss of glacier inputs (yellow outlines) are changing the ecology there. The channel network here was made using maps derived at the time of the first expedition to McCall Glacier, great accomplishments for their time but broad brush strokes that we’ve since refined.
I compared glacier outlines derived from the c.1956 USGS topographic maps of the eastern Alaskan Arctic to an airborne fodar orthomosaic I created in 2022 to find that about half (47%) of 340 glaciers identified in the USGS maps draining north here are now ghost or zombie glaciers.
Ghost glaciers have melted away completely but have left clear geomorphological signs of their former presence and zombie glaciers no longer exhibit enough of the behaviors of living glaciers to be considered alive and likely cannot be resuscitated even with a more favorable climate. That is, zombie glaciers are glacial ice which no longer behaves as a glacier, where the ice in question is and always will be glacier ice even if otherwise not fully behaving like a living glacier, meaning they are no longer metabolizing snow into ice or actively deforming. In this region, they are remnant ice from living glaciers which have become mostly covered by rock from the valley walls made loose by their former, living selves (that is, they behave more like permafrost now) or have been dismembered or shrunk such that accumulation and transport processes would need to be reborn from scratch on exposed bedrock to create or transport ice as they once did. That is, zombie glaciers used to be alive but are not quite dead yet.
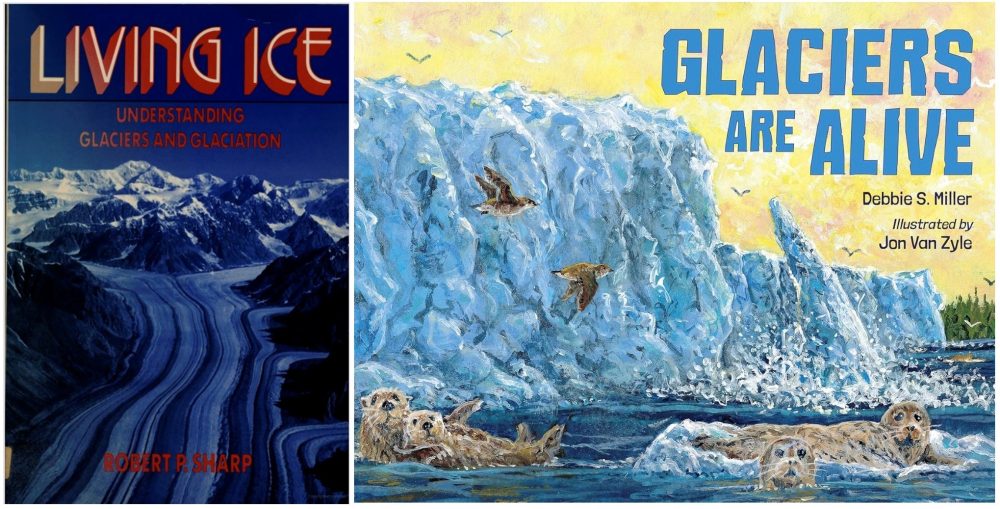
If you want to learn more about glaciers, these are two great books to start with. Both are easily accessible for non-specialists but give the flavor of what glaciers are all about. Though both are dated now as climate warming is turning many living glaciers into dead and undead ones and these books do not discuss them much.
Robert Sharp’s book “Living Ice” to me nicely captures the living nature of glaciers – they metabolize snow into ice and actively transport it to regions that need replenishment to maintain themselves as glaciers in a way characteristic of living beings. Bob was an old school glaciologist that ran with the original McCall Glacier crowd, taking the time understand the spirit of glaciers in addition to the science. He continues the analogy of his anthropomorphic title within his book, for example: “Glaciers are active creatures, delicately attuned to their environment… They expand and shrink, advance and recede, enjoy robust health and suffer unsightly deterioration. Like humans, they win victories and suffer defeat” (emphasis added). Living ice in the form of glaciers has particular behavioral indicators including readily identifiable features such as crevasses, supraglacial streams, moraines, firn, and turning snow into ice, and it is common for us to describe some glaciers as healthy and some as dying, thanks in part to Bob’s work. The terms ghost and zombie glaciers are not in widespread use, in part because the phenomenon is relatively new, but I think the terms capture the spirit of those dynamics better than the alternatives.
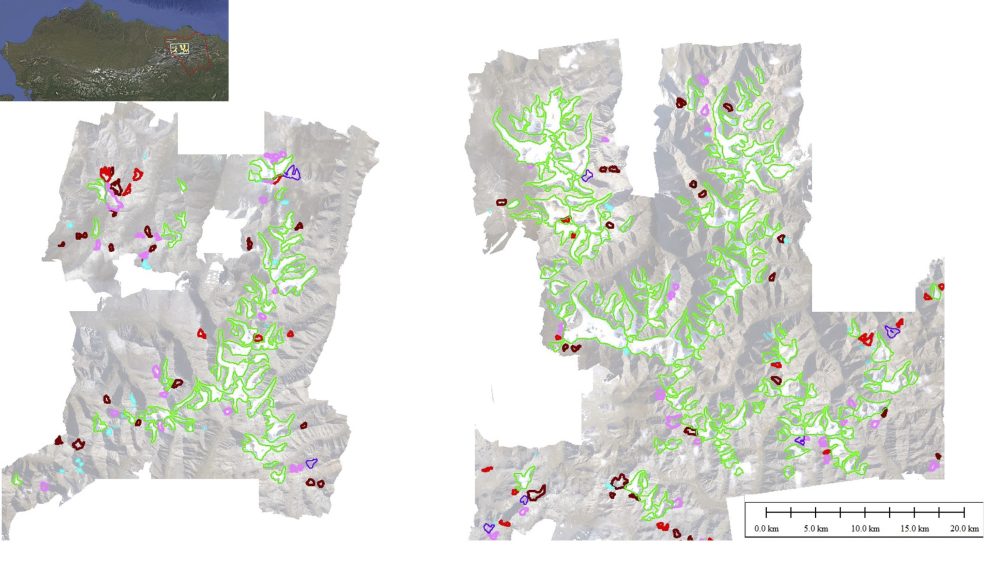
Here is the 2022 orthomosaic I acquired of the region that I compared to the USGS glacier outlines (colored outlines). I missed a few smaller ones on the edges here due to logistical concerns of fuel and weather, but this captures nearly all of them. I found 180 living glaciers (green), 27 ghost glaciers (red), 96 zombie glaciers (42 debris covered (brown); 47 below the living size threshold of 0.1 km2 (pink); 7 dismembered into pieces each below the size threshold (purple)), and 38 glaciers that were already below the size threshold in 1956 (light blue). I made the image here slightly opaque to highlight the outlines.
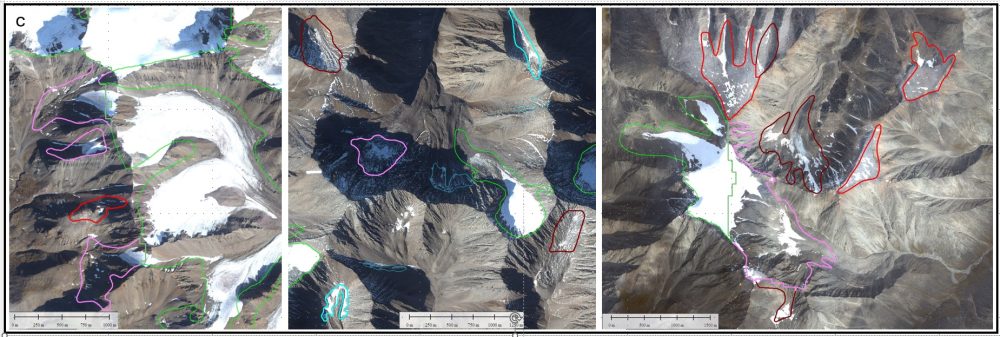
Here is some detail of the analysis. The imagery is my 2022 fodar orthomosaic and the lines are the 1956 glacier outlines. By looking inside each outline, I could measure how much ice was left, if any. I chose 0.1 km2 of visible glacier ice as the threshold for zombie status of the 1956 outlines, as is common in glaciology and described later. The outline colors are the same as in the previous image. The resolution of the orthoimage was about 25 cm, so I could clearly see and measure the ice, if there was any. The biggest challenge was distinguishing between rock-covered zombie glacier and ghost glaciers, but this doesn’t affect the main point that about half the glaciers identified in 1956 are no longer alive.
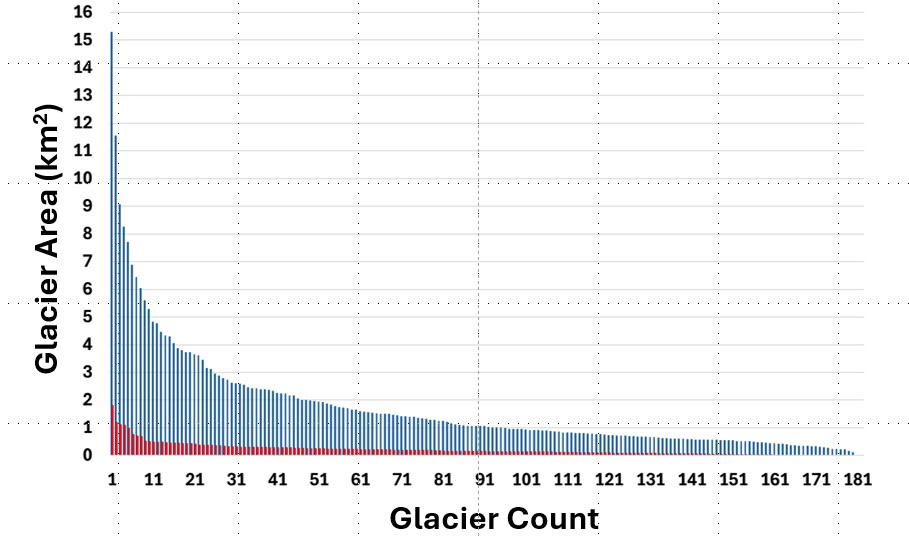
Here is a histogram of all the glaciers identified on the USGS maps, showing the number of glaciers of particular size. The blue ones are glaciers still alive today and the red ones are the ghost and zombie glaciers. As can be seen, the160 ghost and zombie glaciers were the smallest glaciers in this region, likely representing only ~5% of the 1956 ice volume within the region. McCall Glacier is about 7 km2, so is one of the largest.
The loss of these 160 glaciers does not represent a huge volume compared to the total volume out here (about 5%), but they adequately serve as canaries in the coal mine. That is, all of the glaciers here are losing mass and doing so at an accelerated rate, these were just the smallest so they died first.
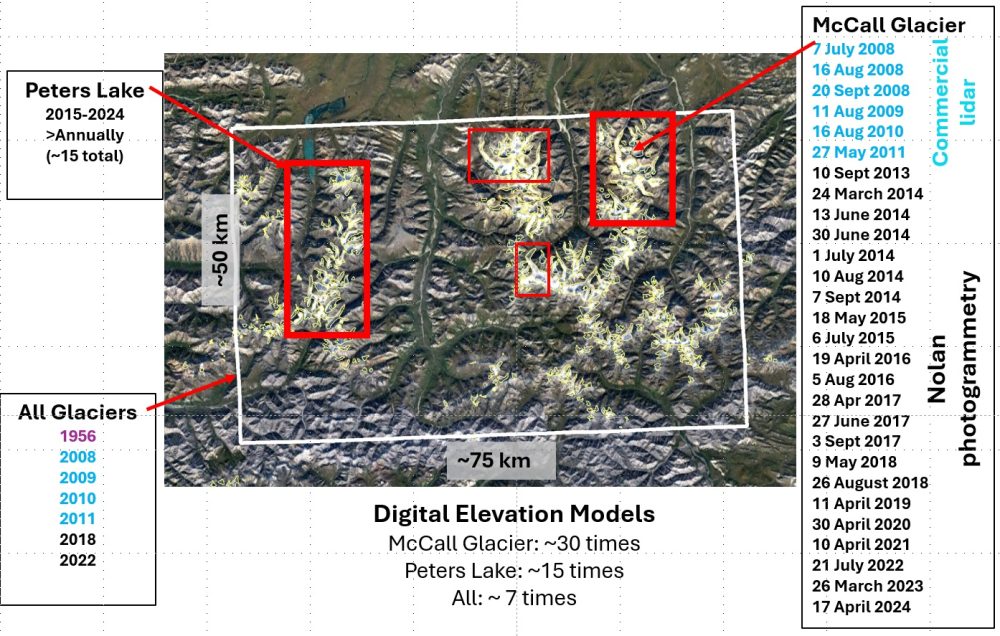
I’ve been mapping the glaciers here from the air since 2008 and have compiled the most robust time series of regional glacier volume change measurements anywhere in the world. So we have all of the answers, such that we can begin searching for the right questions. This slide is a little of out date, I’ve since also mapped in 2025 and 2026 multiple times here.
Here is the terminus of McCall Glacier. The image is not a photograph but a 3D visualization of fodar data. A hundred years ago, the glacier extended beyond the bottom of this image, as can be seen by the ghostly moraine on either side of red line. The red line is a transect from which I extract elevations in the next image.
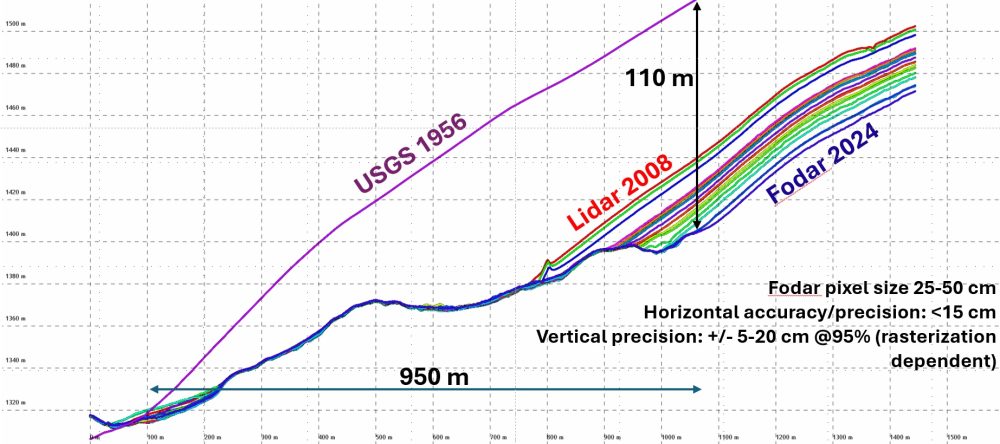
These are the elevations of the terminus over time. We’ve lost about a kilometer of ice here in 65 years and much more since the late 1800s when retreat began. Each year the terminus retreats further back, as the profiles from 2008-2024 show. The rate of loss is increasing with time, though that information comes from looking at the entire glacier, below, since the terminus just responds to what’s happening upglacier.
Here’s what those data look like in 3D. I should have put the years on each image… but the first one in 1956, then there is a big jump in elevation to 2008 and it runs through 2023. When the project started here in 1957, they were able to walk off the glacier onto the top of the moraine where they had their camp (near center before the glacier makes the turn). Now it takes nerves of steel or a few stiff drinks to make that hike, as one has to scramble through loose, car-sized boulders perched on stranded ice. Been there, done that, hopefully never doing it again…
Here is McCall Glacier as seen in a 3D visualization of fodar data. The red line represent the ground track of an airborne laser system created and flown by my PhD advisor. From 2003-2007 we followed this ground track by skiing with a survey-grade GPS to make comparison measurements. From 2008-2011 I hired commercial lidar to make complete maps, then by 2013 I began making these measurements in my own plane using the fodar system I developed.
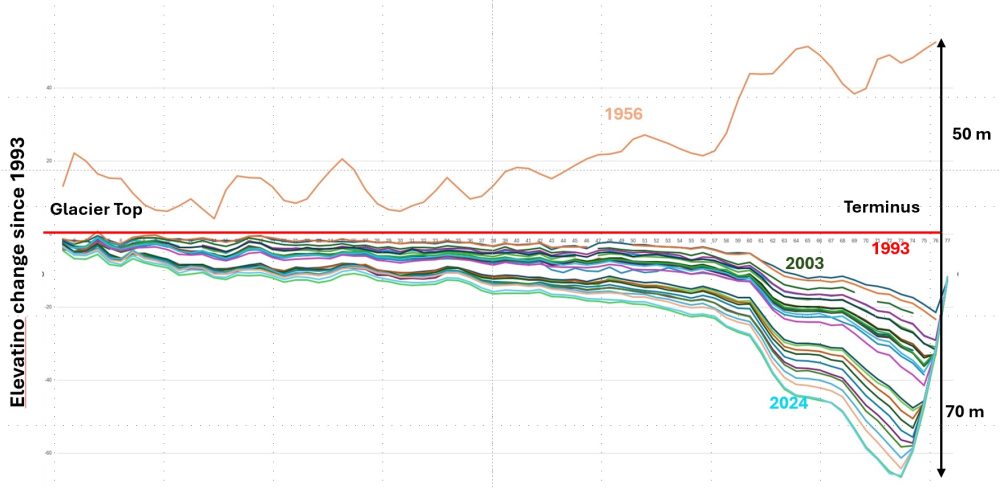
Here is the change in elevation of the glacier surface over time. Each curve is relative to the 1993 measurements (red line in previous image) because the USGS maps weren’t as accurate and make all of the comparison wonky. So if glacier elevation hadn’t changed during these years (a sign of a healthy, living glacier), all lines would plot on top of the red one from 1993. As can be seen there has been over a hundred meter vertical loss since 1956. An important point here in terms of glacier health is the entire glacier has been losing elevation — this is a glacier that is on its deathbed, still alive but unable to support itself because it’s drawing its energy for life from storage rather than metabolism. In particular, it is the upper elevations (at left) that control how healthy a glacier is because this is where snow gets turned into ice to balance the melt that occurs each summer near the bottom. For the past 20 years or so, no new accumulation of ice has been occurring at these upper elevations, so the ice in this accumulation area is being sucked out by the lower elevations, decreasing its elevation into a warmer climate which makes it even harder for it to turn snow to ice and keep its head in the clouds.
The situation seen here on McCall Glacier is representative of all of the glaciers in this region, as captured by the regional maps. McCall Glacier is one of the biggest, so it will be one of the last to go, but we are now entering a period where more and more glaciers will disappear because these glaciers have not been able to create new ice because there is no snow left by the end of summer to later turn into ice. I’ve got all of the data now to track volume loss for this entire region, but it’s one of the things on my list that keeps getting put aside so that I can focus on the story being screamed at me by nature in the 1002 Area as it relate to imminent development activities.
How do these glaciers impact the ecology of the 1002 Area?
These glaciers are all losing mass at a rate that is increasing with time. Based on global models, we are just about at the peak of meltwater discharge, meaning that for the past 150 years the amount of glacier meltwater entering these rivers has been increasing due to melt but as they run out of ice this contribution to rivers will decrease. If current climate trends continue, likely most of this ice will be gone or buried in the next 50 years. This decrease in discharge will strongly affect many components of the 1002 Area’s ecology — how we will disentangle these impacts from those of development if we don’t study and understand the role that glacier loss plays?
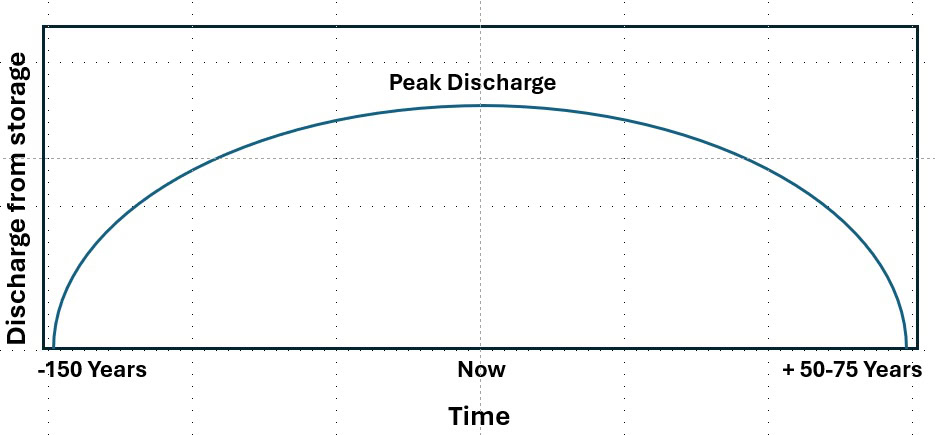
This cartoon crudely illustrate the essential connection between glaciers and ecology. Glaciers over 150 years ago still melted and supplied water to the major rivers here, but the amount of discharge was roughly equal to the amount of snow fall in the mountains because melt was balanced by new snow forming into ice so the glaciers stayed the same size. Some time in the late 1800s, the rate of new ice formation could not keep up with the rate of ice loss due climate warming so they began losing mass from storage — the glaciers began shrinking. The rate of loss has been steadily increasing with time, meaning the glaciers are getting smaller faster. Until recently, this meant the rivers have been getting bigger and bigger each year, which means the ecology connected to them has been adapting to more and more water and glacier sediments each year. But the amount of glacier melt is controlled by their surface area — what the sun can see — so as the glaciers get smaller, there is less ice visible for the sun to melt. At some point, about now, the amount of surface area decreases to the point that even though the surface melt rates (the vertical loss of ice each summer) are increasing each year, the amount of ice melt is decreasing because there is simply less of it to melt. So the discharge into the rivers peaks, as shown in the graph. From this point on, what I consider the beginning of the zombie glacier apocalypse, the rivers are going to get smaller and smaller and the ecology will have to begin to adapt to that. Given that the water and sediments of the four main rivers coming from the mountains are all dominated currently by glacier melt, they will gradually change into looking like the rivers further west, some of which go dry during summer, having a profound impact on the unique ecology of the 1002 Area which has adapted for millennia to the presence of glacier meltwater. The exact shape of this curve and exactly where we are on it has yet to be determined– the curves are theoretical and there are likely asymmetries on either side of peak. And not shown here, in the millennia before this, the glacier was gobbling up more winter snow than would have otherwise melted into the rivers (storage was increasing, which is how they got bigger), so the long-term discharge graph would go below zero on the left, such that downstream ecology has actually been adapting to increasing river discharge for a really long time.
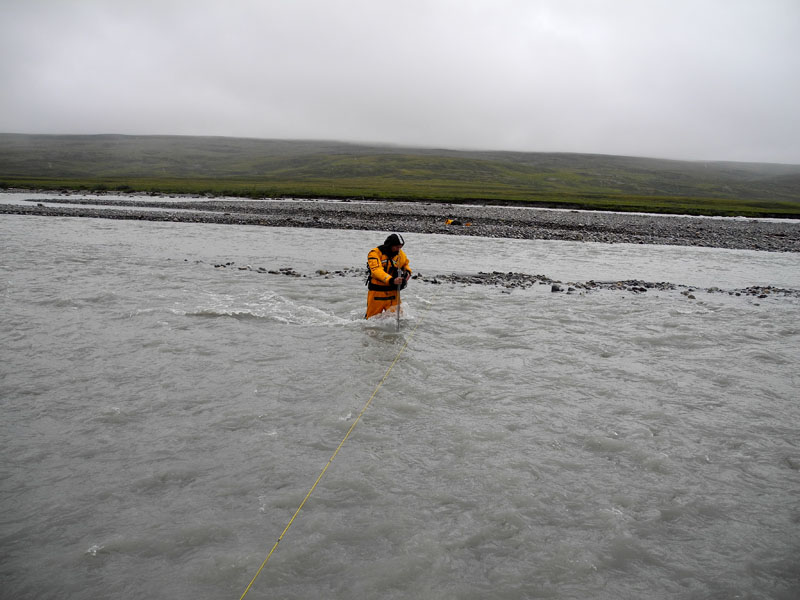
The good news is that stream gaging will get easier over the next few decades. I dislike getting swept away by the current almost as much as I dislike standing on a peak looking down several thousand feet…
Once the glaciers are gone, snow melt from the mountains will begin to dominate streamflow. I’ve been mapping and measuring snow in the mountains since 2014 by creating a topographic map in winter and subtracting one made in summer to get a sense of what water volumes the ecology can expect here in the future. Of course, it’s also likely that there will be less snow as time goes on because more precipitation will fall as rain as summers get longer and winters shorter, but that’s a measurement for some future scientist to make…
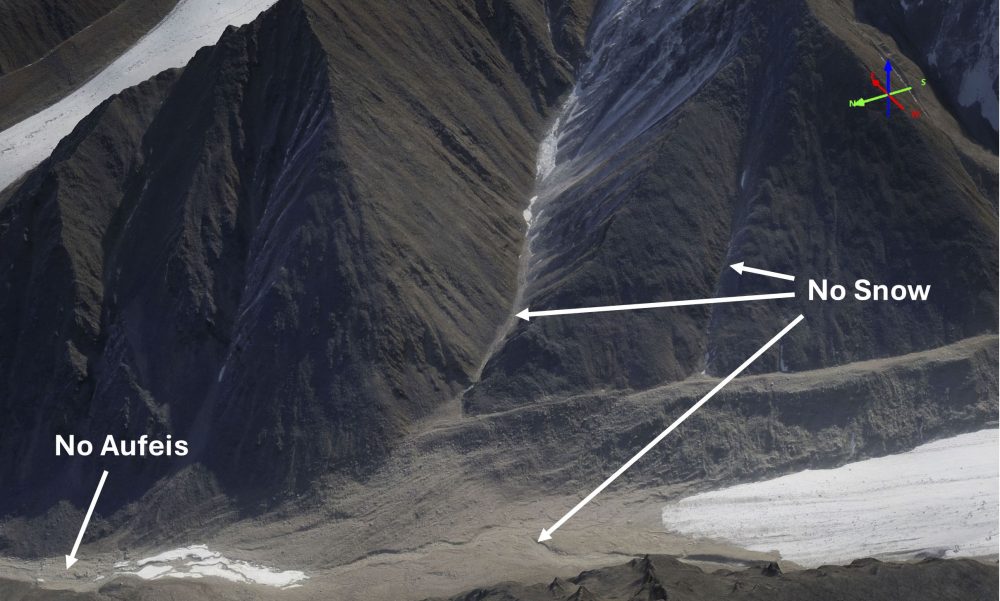
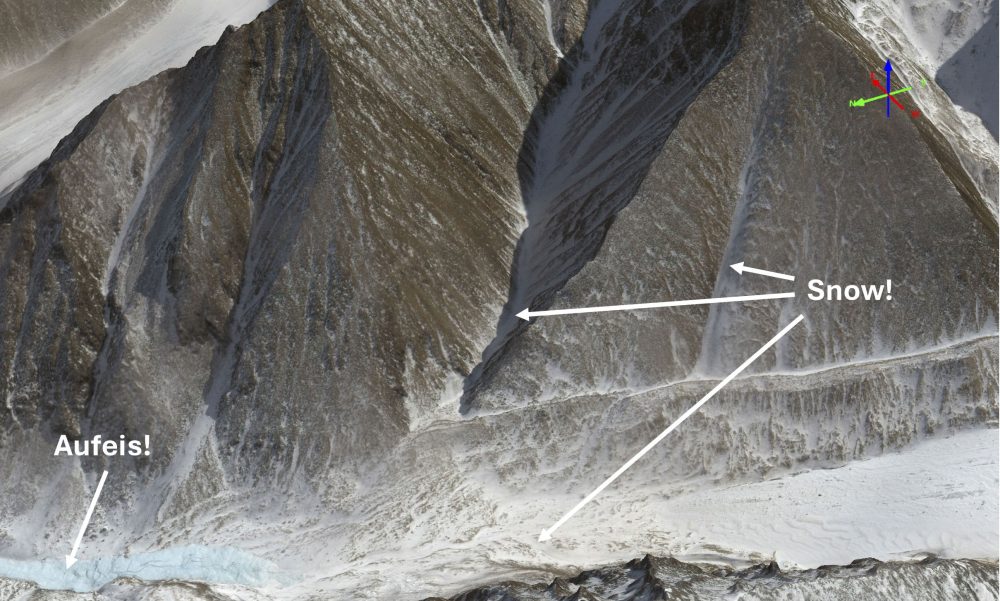
To give a sense of the accuracy of the data and why it’s needed, here is a fodar comparison between summer and winter near the terminus of McCall Glacier. As can be seen, there’s not much snow here at the end of winter and this is typical. This region of the Arctic is dry, like a desert, just without the sand. So to measure snow thickness, we need a tool like fodar that can measure such thin snow. And as you can see, it’s folly to claim there is an average thickness here — a single weather station cannot possibly hope the capture the variations in snow thickness in these mountains.
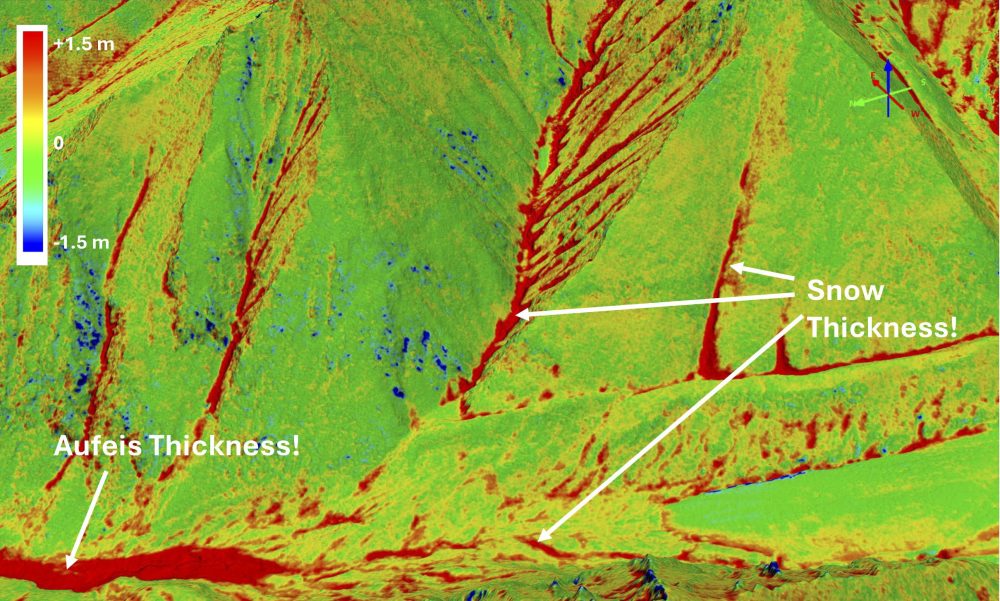
Here is the result — despite how thin it is, we can measure snow here from the air. The yellow/green color represent no snow, so you can see how the drifts (red) dominate the total volume here. The point here is that when these glaciers disappear, snow melt from the mountains will be a tiny replacement and wont extend far into summer when the peak glacier discharge currently occurs. Some of the tiny blue dots represent individual rock falls — you can’t finish lunch here before a snow-machined sized boulder comes crashing down, so it’s important to choose your lunch spot wisely or eat fast!
Impacts of glacier loss on fish ecology
The Hulahula River is home to the largest Dolly Varden run in the 1002 Area, some ten to twenty thousand of them each year. These fish are an important subsistence food for the locals in the village of Kaktovik. They overwinter in several spring-fed holes along the river then go out to see for a few years, returning to make babies. Their return is not coincidentally tied to the peak of glacier discharge in summer. Without glacier meltwater, this river could well turn dry in places in mid-summer, as there may not be enough rain to keep it going. Without sufficient water in the river, what will happen to this important fish run?

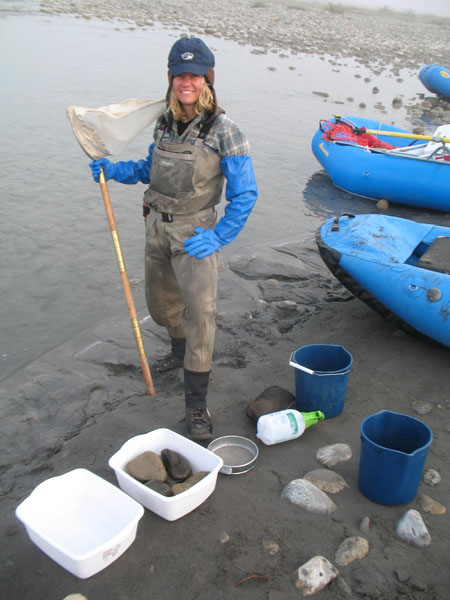
We didn’t eat this Dolly Varden– as part of one of our float trips after glacier field work15 years ago we brought along a fish ecologist to help us understand how the loss of glacier meltwater would impact his descendants.
Impacts of glacier loss on shorebird ecology
Large differences exist between glacier-fed and non-glacier-fed deltas in the 1002 Area which impact shorebird ecology. The glacier-fed deltas, primarily the Hulahula/Okpilak and Jago River deltas, are the largest active deltas in Arctic Alaska because of the huge sediment influx coming from the glaciers. These deltas also have a freshwater invertebrate community which does not exist on the others, which are dominated by marine invertebrates. Tens of thousands of shorebirds migrate to the 1002 Area each year and they depend on food sources from these deltas to build up their reserves for their migration home. The invertebrates of the glacier-fed deltas have a multiyear lifecycle leading them to a be stable, persistent food source, unlike the other deltas which rely on storms to deposit marine invertebrates on them. We looked at the fattening rates of these birds and found that they consistently like to hang out on the glacier-fed deltas and then head to the other deltas after these storms. As the glaciers continue to disappear, the sediment supply creating this bird habitat will lose the competition with the ocean trying to wash it away, creating habitat loss. At the same time, the loss of freshwater will decrease the stable, multiyear invertebrate supply these birds utilize. What will happen to these birds when the glaciers disappear?
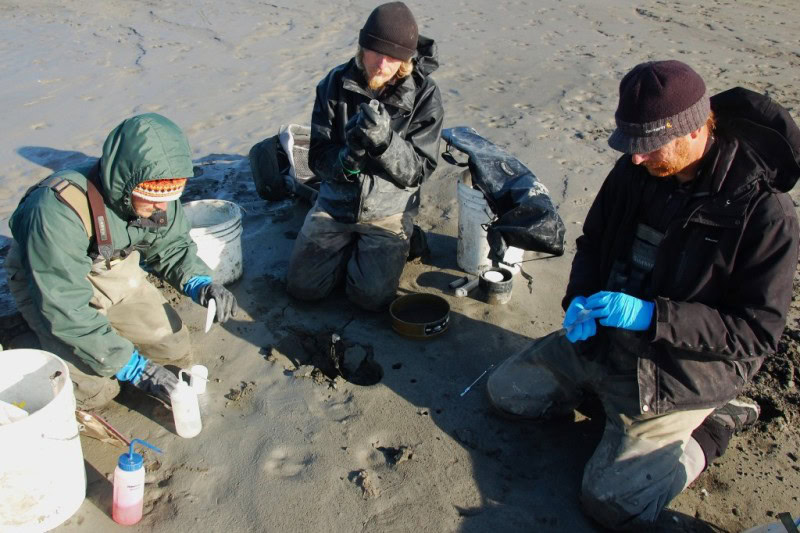
That’s not just mud, it’s a supermarket for birds! Tiny worms and larvae live here which migrating birds prefer to what they find non-glacier-fed deltas.
These invertebrates also live under many of the rocks within the rivers, a sign of their health.
Impacts of glacier loss on riparian ecosystems
Because these rivers have been growing over the past century due to increased glacier melt, they have been eroding their banks more than other rivers, preventing shrubby vegetation from taking hold and washing away a lot of terrestrial habitat. We’ve compared these glaciated river banks to the surrounding ones and found that shrubbery has increased on the surrounding rivers substantially more than the glaciated ones. This increase in woody vegetation is occurring throughout the Arctic due to climate warming here and is leading new herbivores like beavers and moose to spend more time here, have families, and stake their claims. As these rivers get smaller due to the loss of glacier melt, we expect their banks to become more stable and vegetated, presumably leading to an influx of beaver, moose, and other species straight into the heart of the 1002 Area, perhaps also increasing the number of predators. What will happen to the species already living here when the glaciers disappear and the rivers get smaller?
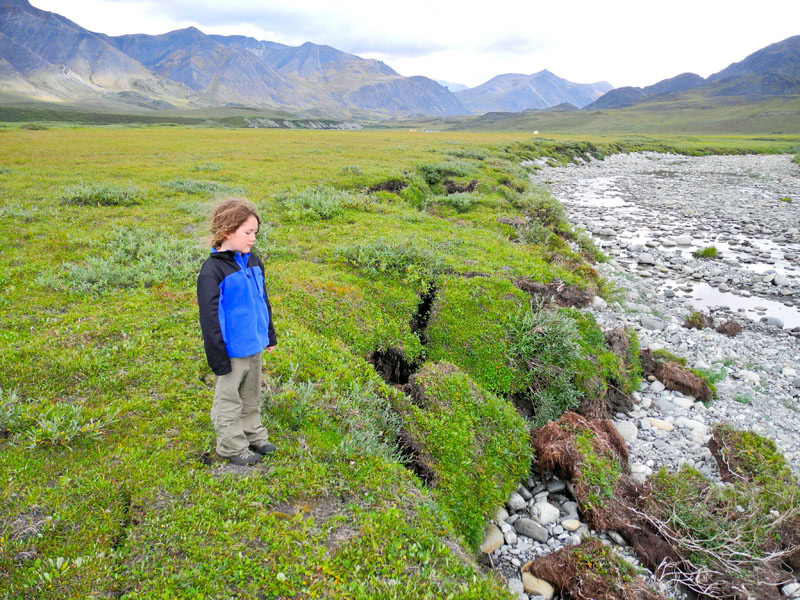
When these glacial rivers run full and are pushed around by the aufeis fields that grow here in winter, they undercut their banks and cause the tundra to collapse into them. As the glaciers disappear, we expect to see less of this and more shrubby growth reinforcing the banks, bringing in new herbivores.
These rivers have enormous erosive force and can separate tundra from their banks completely and raft them downriver.
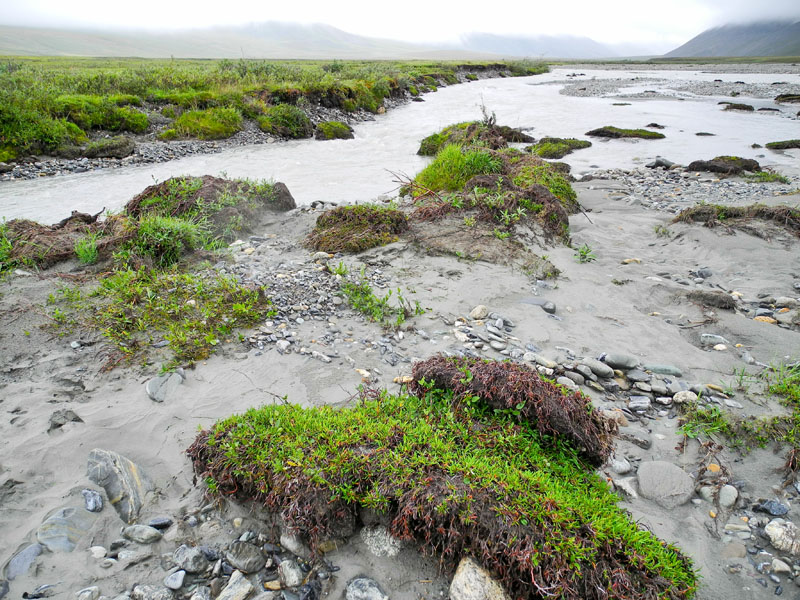
I’ve seen tons of clods like these in random places.
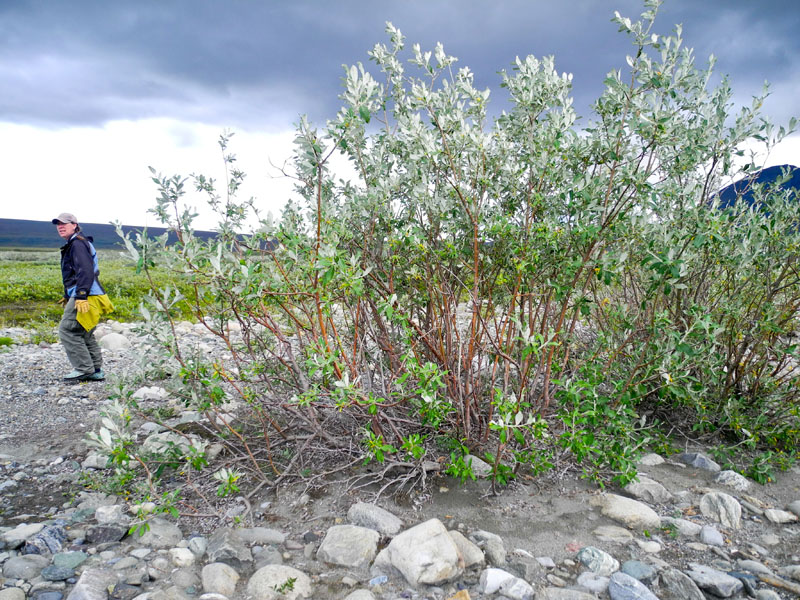
Rivers aren’t the only influence on shrubby vegetation here. Almost anywhere you find stands like these, you’ll also find stems bare of leaves and branches, where ptarmigan stand on snow in winter and nibble away at them in winter. As shrub growth becomes more common in the 1002 Area with the loss of glaciers, we expect other herbivores to arrive for lunch. When aufeis forms around such stands in winter, the entire shrub can be plucked from its roots and floated downstream within the ice, leaving a field of stems as if they were being farmed.
Impacts of glacier loss on marine ecology
Glaciers not only supply a huge amount freshwater and sediments to the coast, they bring nutrients that marine critters thrive on within the lagoons that are freshened by the meltwater. Much of this nutient load presumably comes from all of the tundra that’s being washed away along the river banks, a process likely to slow down soon. These lagoons cover a huge area of the Arctic Ocean coastline and are an important source of subsistence foods for the village of Kaktovik as well as for the wildlife that depend on them. What will happen to these marine foodwebs as the glaciers disappear?
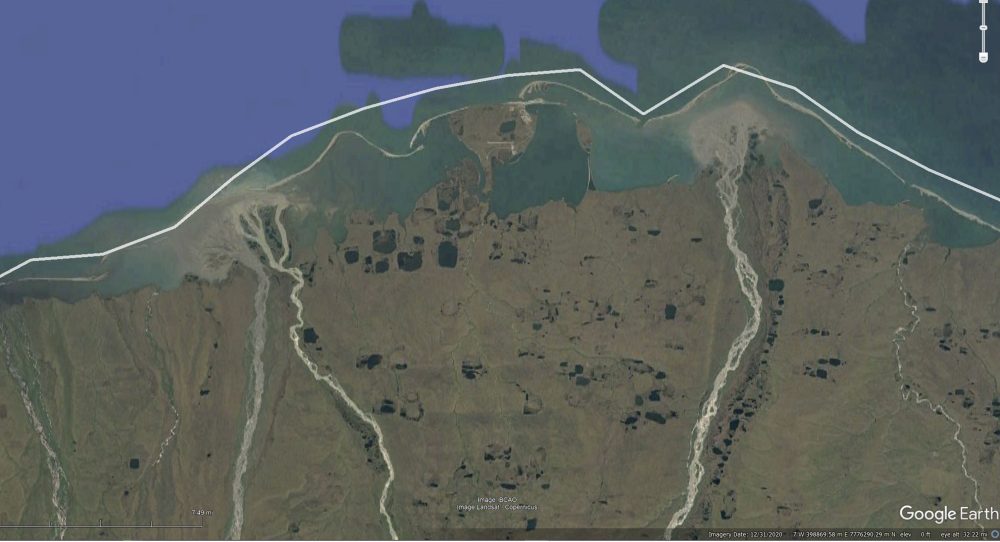
The Hulahula/Okpilak River delta (left) and the Jago River delta are the largest in Arctic Alaska because they are created by glacier sediments. They also help maintain the barrier island system that covers most of this coastline and supply nutrients to the freshened lagoons they form. What will happen to this habitat and ecology when these glaciers disappear?
How soon will the zombie glacier apocalypse occur here?
To disentangle the impacts of climate change on the ecology of the 1002 Area via the loss of glacier discharge from the impacts on the ecology of oil development, it would be handy to be able to predict this decrease in discharge over the future.
The simplest way to predict glacier loss is just to look at the rates of loss over the past century from our long-term studies and draw a line into the future given what we know of how much ice exists today. Depending on how you draw that line, this comes out to about 50-100 years for the bulk of the ice here, and that’s probably a good enough guess for many purposes. But this tells about glacier demise, not the shape of the peak discharge curve.
There are teams of glaciologists around the world trying to do better than that guess for all of the glaciers in the world, as the issues I’ve described here have are common to all, though each region has has its own unique quirks. Given their global nature and their emphasis on sea level rise, the models and data they use are understandably coarse and simple, requiring huge computing power. From these coarse models, we know the peak of the discharge curve is happening about now.
Given that I just study these glaciers and I’m more concerned with ecology than their contribution to sea level rise (which is negligible here), my methods for arriving at this answer try to capture all of the important processes in 3D with as much detail as I can find. I’m not quite there yet as I keep getting distracted by the tundra and the issues surrounding it, but I’m not far away from being able to give the best possible predications of what the shape of the river discharge curves for these rivers will look like over the next 100 years. The good news is that we’ve probably got more a comprehensive set of driving data and validation data here than nearly anywhere else thanks to the long-term baseline we have to draw from.
In this section, I want to give you the flavor of the work that goes into understanding the zombie glacier apocalypse, both on and off the glacier, so you can learn how we listen to the glaciers. I’m going to tell you the story the data are telling me and afterwards I’m going to suggest a way that you can help me continue to listen to the data and share its stories if you found this one interesting and valuable.
What makes glaciers melt?
Of course to predict glacier demise and meltwater discharge, we need a good way to model glacier melt. I’ve written a glacier melt model that takes into account the basic physics involved, based on our weather stations which measure those physics. We’ve found that about 75% of the melt energy comes from sunshine and the bulk of the rest from air temperature. So my model accounts for both of these. Sunshine is the trickiest one because the solar radiation hitting the surface is strongly controlled by cloud cover, mountain shadows, and whether the ice surface topography is pointed towards or away from the sun.

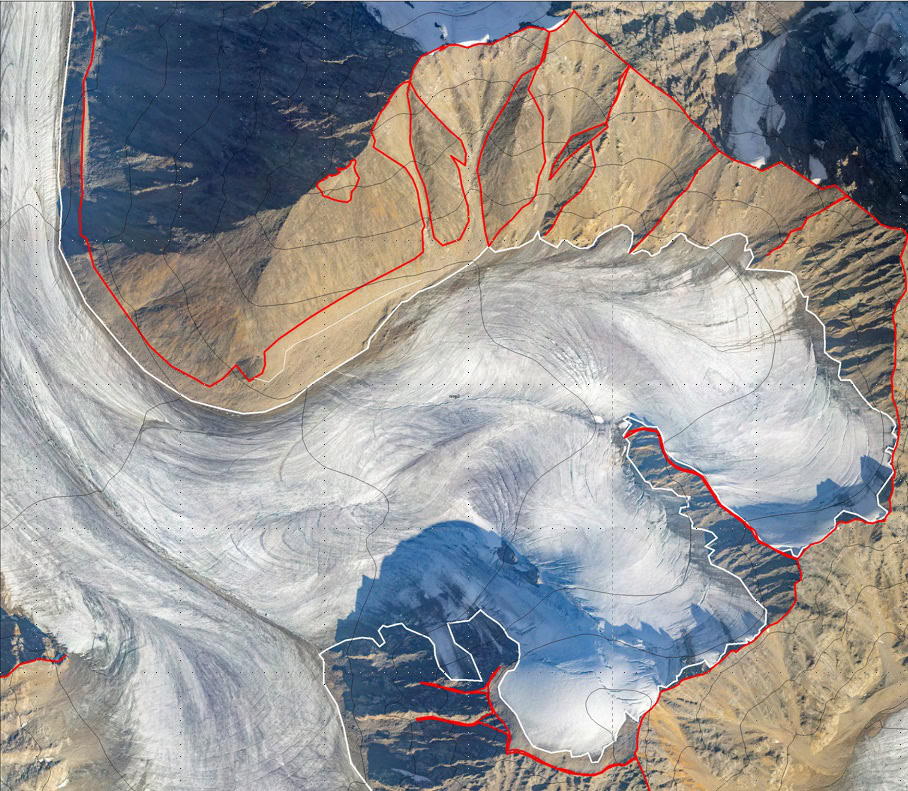
Sunshine matters. A lot. Here is a vertical view of McCall Glacier, with north up. The red outline is the ice limit of 150 years ago or so, the white outline is the current limit. Not only does ice preferentially grow on the north facing slopes, but it melts away first on the south, east, and west facing slopes where it was thinnest to begin with. The ice here is just on the edge of existence, just like the permafrost on the tundra, so it does not take a strong change in climate to zombify them. The disappearing tributaries (between the red and white lines) are effectively ghost glaciers now, though not counted in my study because the USGS outlines did not count them as separate glaciers. The surface that is now exposed by these ghost glaciers is offering up 4000-5000 year old plant materials we’ve gathered that allow us to figure out when they first got buried, which in turn will give allow us to continue the discharge curve I showed earlier back to the time when these glaciers began growing, thousands of years ago.
The model tracks the location of the sun as it swings around the landscape, creating shadows. From this, we can determine the amount of solar energy available to melt ice and snow. The shade of green shown here is related the intensity of sunlight, from a bright yellow to black in the shadows. This simulation is from July 1st — note how the sun never sets here this time of year.
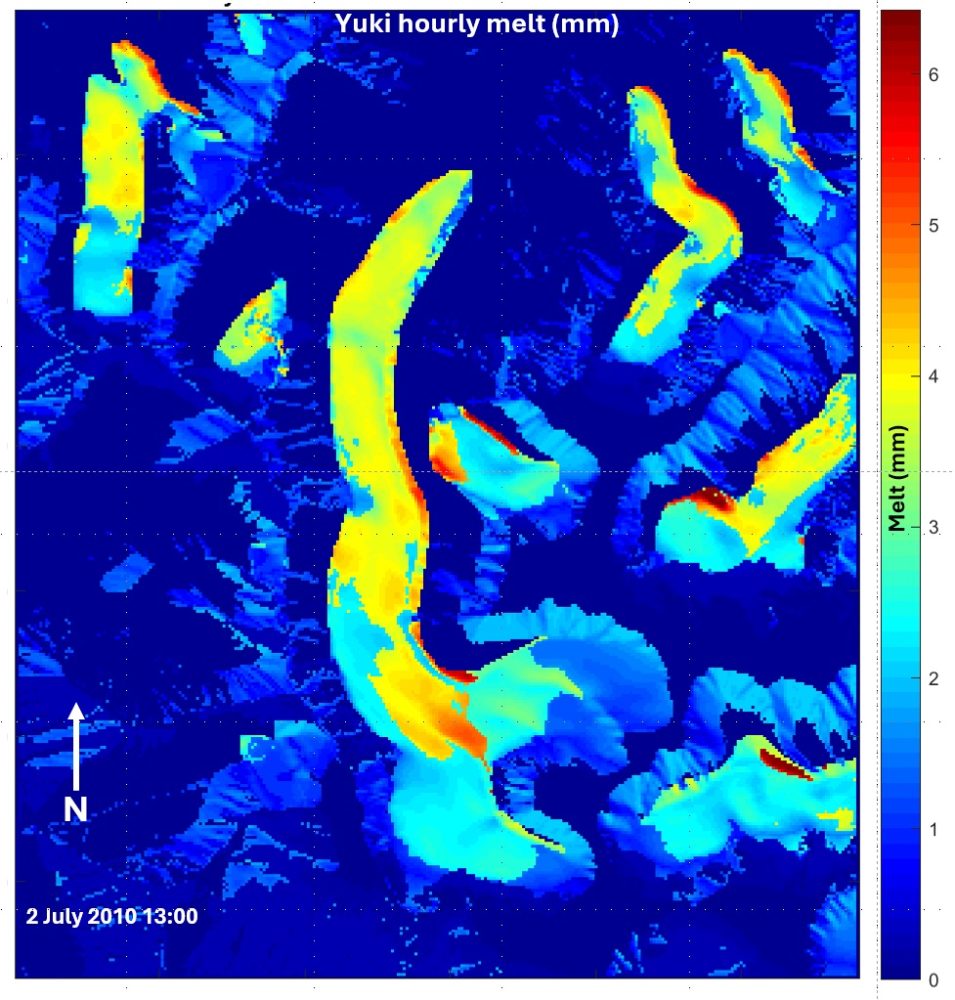
My model, Yuki, calculates melt as a function of sunshine and air temperature. Here is a timeslice of one hour’s worth of melt in July, with the sun coming from due south (bottom). The blue colors represent little to no melt, the yellows and reds lots of melt (well, lot’s for this region anyway), so the brighter colors represent where the glaciers are because there is something to melt there. The patterns are caused by topographic shadows, the angle of the surface to the sun, and elevation (which controls air temperature). Visually this looks quite like what we see on the ground, but scientists are a skeptical lot and visual validation doesn’t usually cut it, so I’ve also compared my model with field measurements.
+
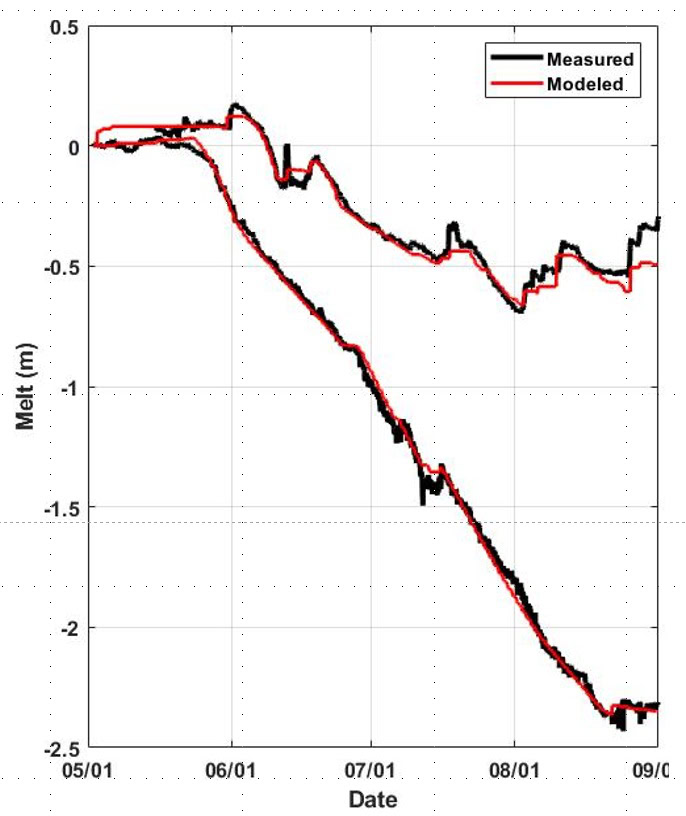
Here I’ve compared my model’s melt predictions (red) to field data (black) over the course of two summers at two different weather stations with automated melt measurements, one in the upper elevations (upper line, with less melt) and one at a lower elevation. If a model can match two locations from two different years this well with any tweaking in between, it must have something right. But I’ve got tons of field data, so let’s keep going.
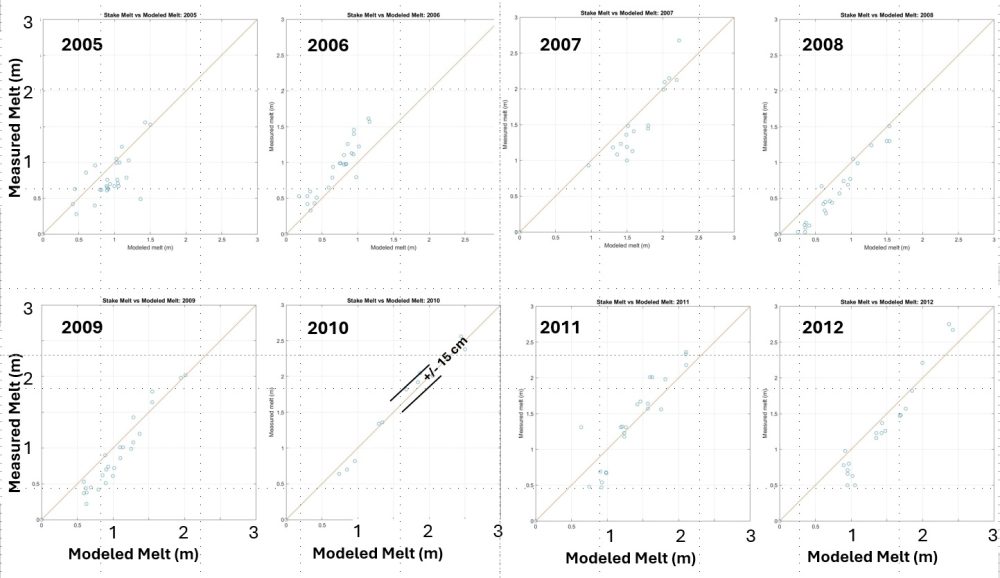
For the past 24 years, one of the main things I do on the glacier is try to figure out how much snow falls and how much ice melts each year. One way to do this is plant stakes into the ground in winter, measure how much sticks out, then come back after a summer and measure them again, then subtract the two numbers. By doing this all over the glacier, we then get a sense of the spatial variations in melt and gain. Here I’ve compared my melt model to those stake measurements over an 8 year period. The diagonal line would be a perfect fit. But as simple as measuring stakes sounds, it’s ridiculously easy to screw up the measurements and there are basic uncertainties on the level of about 5-10 cm due snow density, ice lenses, etc. So this is about as perfect as models get, and this is just a preliminary result. The really good news is that the model works on 50 cm pixels over the entire glacier whereas I only have a dozen or so stakes — the model is much better at giving a complete solution because with the stakes we have to do a ton of extrapolation and guess work about how representative each stake is of its surroundings. And I tend not to put my stakes in the sketchier areas of the glaciers so I don’t Ötzify myself, so the model handles those areas better than I ever could. But where old school meets new school is that I can use the stake measurements dating back to the 1950s to calibrate the model for that year to both getting a better sense of the driving data (air temperature, cloudiness, etc) and get a much more accurate glacier-wide melt map than using the stake data alone.
As climate warms, these glaciers are getting colder
It may seem counter-intuitive that glaciers at the top of steep mountains in a remote region of the Arctic may be getting colder as climate warms, but it is indeed the case. I was far from the first to come up with this idea, but the long history of the McCall Glacier research program was the first to capture this process while it is unfolding. And in this context of cooling ice, McCall Glacier is the canary in the coal mine for the Greenland Ice Sheet, which has major implications for global sea level and life on earth.
So why does is the ice getting colder?
The short answer is that it was that it was weirdly warm to start out with.
Glaciers grow because some of the snow that fell in winter at higher elevations doesn’t melt in summer and this snow gradually turns into ice which then flows downhill to replenish the ice that did melt in summer at lower elevations. This accumulation of multi-year snow is called firn and can be tens of meters thick. When winter comes, energy is extracted from the surface to cool the ice and firn down in manner which you can measure with temperature sensors — it looks like a wave of coldness propagating into the glacier. In the lower glacier, where the snow melted completely in summer, this wave propagates into the ice down to about 15 meters too, largely ignoring the thin snow that falls in winter. In the upper glacier, where firn has accumulated over the years, this wave also propagates down about 15 meters, though maybe a little less because snow is a better insulator than ice. It takes the whole winter for this cold wave to reach this depth, meaning that by spring the glacier ice beneath the firn still has not seen how cold winter is.
When spring comes, the surface of the snow begins to melt. This meltwater then drips down into the firn due to gravity, where it finds really cold temperatures left over from winter. Energy always follows a gradient, so when you have a relatively high energy water drop surrounded by low energy snow, the cold snow starts sucking the heat energy out of the water drop. Eventually it sucks so much away that is the water drop freezes.
When water turns into ice, it must release a lot of energy to accomplish that phase change. We call this latent heat because its not as blatant as the heat we are used to reading on a thermometer. When you chill water by 1 degree from 2C to 1C you have to suck away X amount of energy, but when you chill water by 1 degree from +.5C to -5C (that is, when you freeze it) you have to suck away over 80X.
But where does this huge amount of energy go? It goes into the firn itself, warming it up! Our measurements over many years show that after only about 2 weeks of spring melt, this process warms up the entire firn thickness so that firn itself is at the melting point (the warmest it can get!). At this point, there is no longer a gradient between the dripping melt water and its surroundings, so the process stops and the water begins to pool and flow downhill.
The key point here is that it took 7 months or more for the firn to cool down but it only took 2 weeks for it to warm up completely, so by the time the glacier ice beneath the firn is about to realize that it’s winter the firn is already warm, meaning that for all the glacier ice here knows it is in the tropics because it never feels winter. So the ice beneath the firn is at the melting point all the way down, because it has never felt anything warmer than this because it’s been covered by a heated, insulating blanket.
In the lower glacier, the story is different because there is no firn. The cold wave reaches deep into the ice during winter and the thin snow above it doesn’t have enough energy in spring to warm it back up. So the ice here knows all about winter. But… because the ice is so thick, it is actually insulating the heat that is rising from the molten core of the earth, so the bottom of the ice begins to melt. In addition, the ice in the lower glacier came from the upper glacier where it started out warm, so the winter cold wave on the lower glacier is actually fighting against that warm resupply. The result is that for most of the glacier’s life, the upper glacier was made of warm ice and the lower glacier is made of ice that is cold at the top and warm at the bottom.
So that’s the long answer to why the ice was weirdly warm to begin with. Now back to why it’s getting colder today.
As climate warms, more snow gets melted in summer so the snow line moves uphill and begins melting away firn, the snow that fell from many winters ago. The situation since 2005 (with a few excursions) is that the snow line is actually above the top of the glacier, so the firn melted away completely since then.
Thus, the heated, insulating blanket that had been keeping these glaciers warm is now gone and the glaciers are getting colder as a result of climate warming, as they are just returning to the temperature they would have been all along without that blanket.
Thus to make the most accurate predictions of when the zombie glacier apocalypse will start and how it will affect ecology, we have to capture this process in our models.
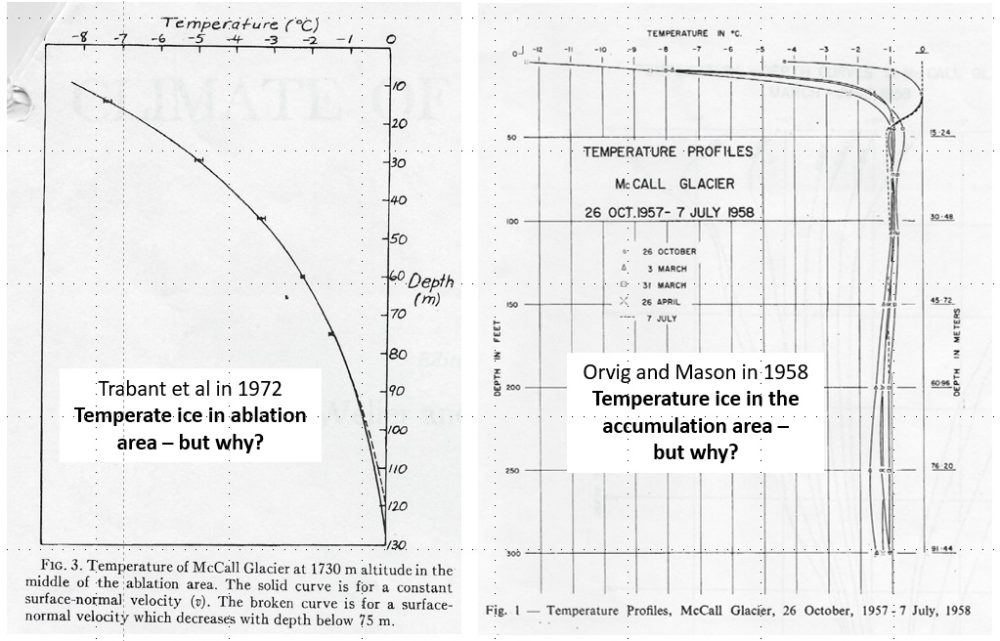
The IGY crowd in 1957 knew this story and they laid down the baseline data for us to capture this process. At right, they drilled a thermocouple string through the firn in the upper glacier all the way to the bottom. As can be seen, the temperatures below the firn (where winter and summer temperatures are felt) are all at about 0C, the melting point of ice. That is, the ice here is warm. In 1972, my predecessors drilled another string to the bottom of the ice in the lower glacier. Here the found it was cold on top and warm on the bottom. They knew the answer then, but our numerical modeling confirmed the story and allows us to model it into the future.
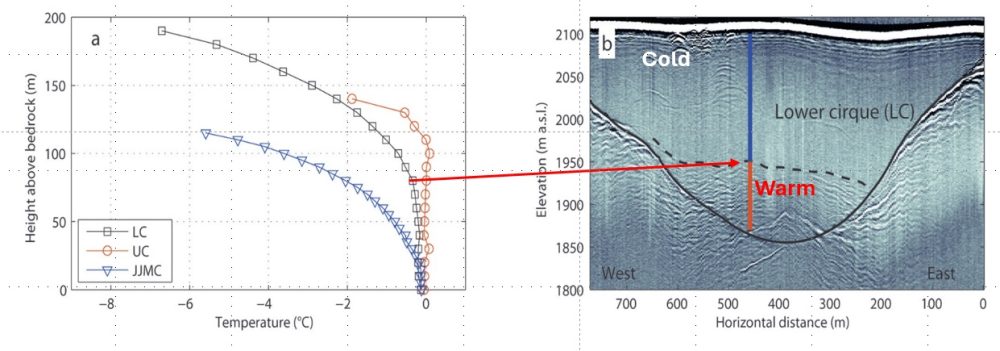
In 2008, fifty years after the first expedition here made their borehole temperature measurements, I repeated them and added a new one. The red line (curves at left) is in about the same spot as the 1958 measurements, showing the ice was still warm here, just like they left it. The blue line is in about the same spot as the 1972 measurements, a little thinner but more or less the same temperatures. The black line is in a new location in between them and here we found a distinct transition in temperature. This location was covered by firn into the 1980s, but it has since melted away completely as the snow line has moved higher than its elevation. Without the heated insulating blanket of firn, the ice began getting colder from the top down and in the radargram at right we can see the cold wave has made it about 2/3s of the way down. This is clear evidence that as climate warms, the glacier is getting colder. These measurements were made almost 20 years ago now and it is almost certain that the cold wave has made it to bottom of the glacier here by now.
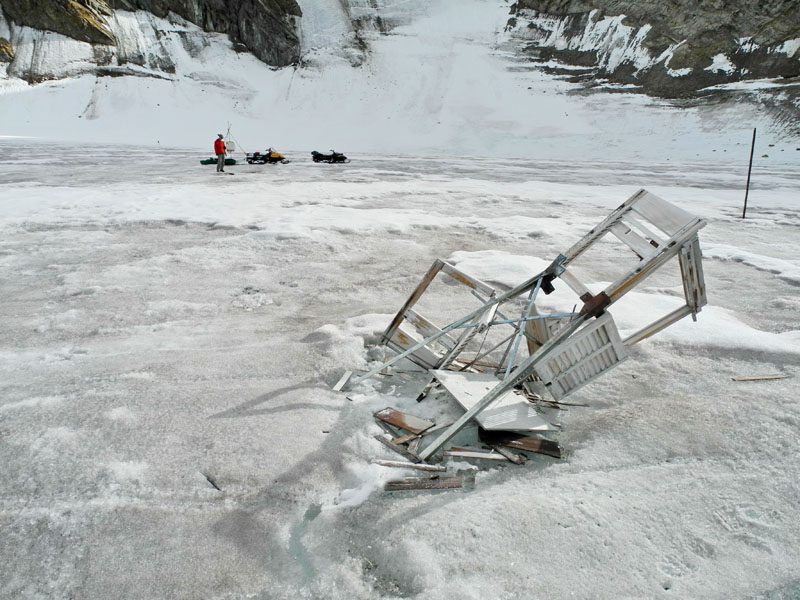
At the location we drilled the new hole which we learned was getting colder from the top down, we found this weather station from the 1970s melting out of the ice. At that time, this area had a thick firn area because the late summer snow line was at a lower elevation. Sometime in the late 1980s the snow line moved higher than this elevation, so the firn disappeared and glacier began getting colder from the top down because it lost its heated, insulating blanket. This weather station is direct evidence of this — it got buried for a few decades then began melting out about 2008.
As these glaciers get colder, they are getting slower
What happens when the cold wave reaches the bottom of the glacier?
The glacier moves slower!
The rate at which ice flows is dependent on its temperature– warm ice deforms faster than cold ice. Think of pouring maple syrup on your pancakes– if your syrup was on a shelf it pours out faster than you’d like, if it was in the fridge it pours slower than you’d like. It’s the same basic idea with glacier ice on a slope.
The rate which ice flows is also dependent on it’s thickness. Ice on a slope deforms under it’s own weight — thick ice is heavier so it deforms more rapidly. Your ice cube on the table doesn’t deform much because it’s too thin, but put a few cinder blocks on and it might. As an aside, I used 0.1 km2 surface area (about the size of two football fields) as the zombie glacier threshold because there is a reliable correlation between surface area and thickness such that we know that ice this small in area is rarely thick enough to deform under its own weight.
But the speeds here are dropping much faster than a change in temperature and thickness could cause, so what gives?
In addition to deforming under their own weight, many glaciers slide along their bottoms, like pushing an ice cube over a table. Through a variety of field studies and modeling, we know that McCall Glacier does this sort of sliding. Or at least it used to.
The ice temperature measurements we made were over 15 years ago and haven’t been repeated since, but because we understand the story we have a really good sense that the ice at the bottom of much of the glacier is now cold because of two processes. First is the loss of firn — the cold wave has now propagated to the bottom of ice throughout much of its length. Second is that the glacier has gotten much thinner, as the plots I showed earlier demonstrate. Thinner ice doesn’t insulate the heat coming from the molten core of the earth as well, so now that heat is no longer melting the base of the ice. The combination of these two processes mean that the base of the ice is no longer warm. Think about putting that ice cube on another larger, colder ice cube and imagine pushing it across it — unlike the warm table, the ice cube on the larger ice cube gets stuck because they freeze together.
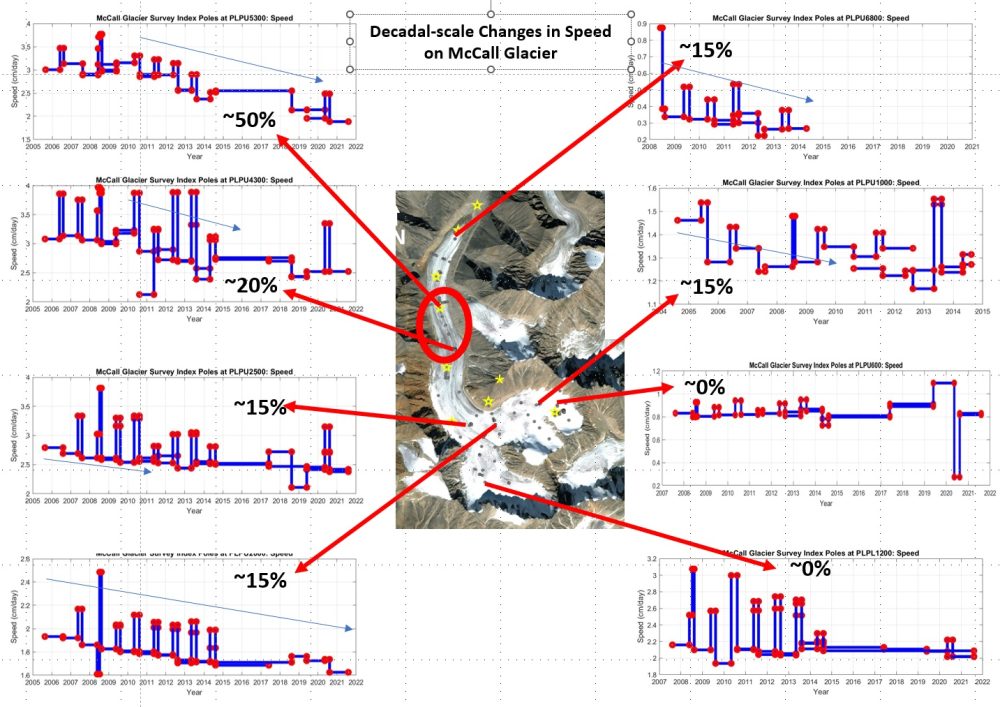
The red circle on the image of McCall Glacier is a location where we know the ice was sliding across its bottom because the speeds we measure here were too fast for ice deformation alone to account for. Since about 2010, the ice surface speeds have been dropping, rapidly. Too rapidly for a change in deformation to account for– the sliding rate here must be decreasing because the ice at the bottom is now cold and is stuck to the bed. As we move upglacier, the percentage decrease in speeds is less, because there was less sliding to begin with and because the ice here is still being kept warm by the warm ice flowing down from the upper regions as it has not had a chance to fully cool yet. As time goes on, what we expect is that the as climate warms, the ice everywhere will get colder, and speeds everywhere will start dropping. These measurements demonstrate the value of long-term baseline studies. The next step is to create a model that puts all of this information together so that we can accurately predict the zombie glacier apocalypse and how it will impact the downstream ecology.
The measurements shown above were created by measuring the location of poles we planted into the ice as they move downhill. It’s great stuff, and more than you’ll find on most glaciers, but it’s still kind of 20th century tech even with GPS.
To move us forward into the 20th century, I’ve begun making two new types of measurements.
First is by leaving continuously recording GPS on the glacier. I’ve only just started doing this last year so I wont have any results to show until I download the data, hopefully in a few weeks. Technological advances, particularly in power management in locations where you can’t just plug things in, have made this possible only recently.
Second has been by using my fodar imagery to track the movement of ice. I’ve only just started doing this too, but the results so far have been really cool. Instead of just a point measurement, by feature tracking we get the motion over the whole glacier surface. This is what we need to evaluate the performance of our models.
By comparing one image to another, we can derive the motion of the glacier by tracking features like crevasses or rocks over its entire surface. This all happens in an automated way. At left are two fodar orthoimages, taken a year apart. Next are vectors (red arrows) that show the directionality and magnitude of the changes between them. The important point to note here is that there is no motion of the rocks surrounding the glaciers, such that we can believe the vectors on the ice. There’s a lot of noise here, the technique isn’t perfect and gets fooled by some of the changes, but this is easily filtered out. At far right is just the speed without the direction. Again the important point to note is that the rock shows zero speed, as we hope, and the glacier shows motion, again with some noise which we can filter out. The fastest speeds are mid-glacier (the bottom of the graph) and the slowest ones are at the terminus where the ice is too thin to deform much under its own weight.
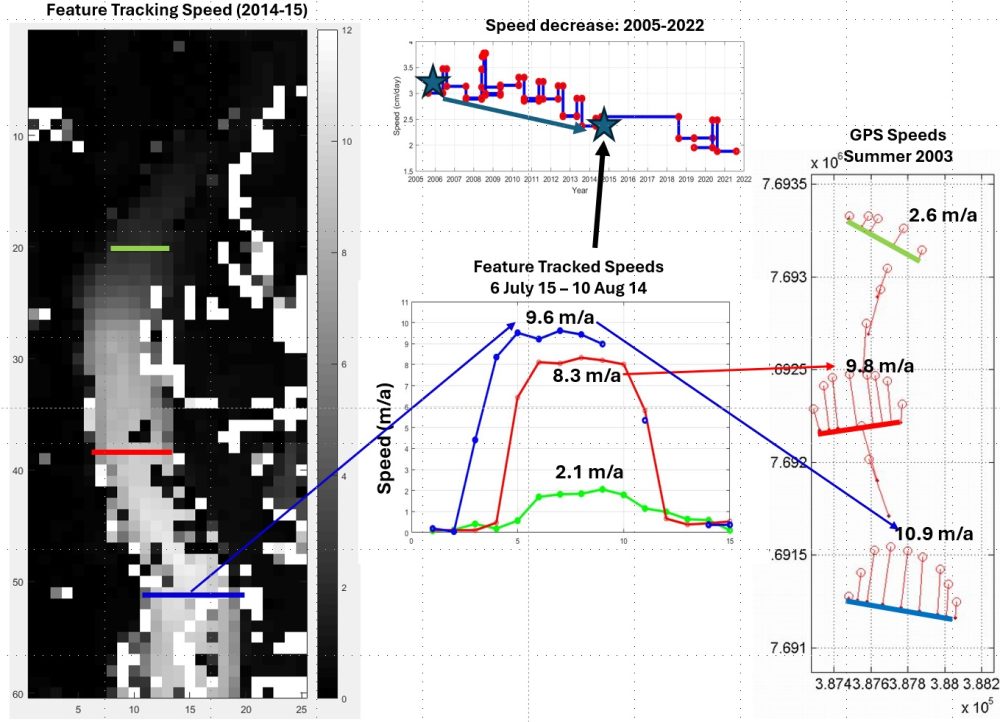
We can compare the speeds derived from feature tracking to the speeds we measure with stakes in the field. The colored transects at left are the locations of our field measurements at right. The plot at center are the speeds derived from feature tracking so we can make direct comparisons to the field measurements. What’s important to note here is that the feature tracked speeds are slower than the speeds measured in the field, which were made 11 years earlier. This is not an error — it is due to a real change in sliding rate: the bed of the glacier has gotten colder over those 11 years and more of it is stuck to the bed. The plot at top center confirms this — over these 11 years, the stake located here has gotten slower by about the same amount as the difference between the airborne measurements and the field measurements. Those field measurements were made in 2003 when I was really after it, we haven’t had that complete a stake network since then as it takes a huge effort to replace stakes as they melt out. But I’d like to implement that network one more time sometime soon, to fully evaluate the airborne technique so we can rely on it more fully in the future. For example, I chose these stake locations because they had been used periodically for 50 years, so these older data can be used to evaluate and possibly improve the model over this time span, done best by direct comparison with new stakes.
Putting it all together
To model these glacier dynamics to aid in our understanding of how they affect the downstream ecology, we need to combine two models and assess their accuracy.
The first model is the one I discussed earlier — we need to accurately predict surface melt as function of sunshine and air temperature.
The second model is one that can track flow and sliding of the glacier, incorporating the changes in the release of latent heat on the glacier dynamics.
So by layering my melt model on top of an ice dynamics model created by my colleagues, we will have the full story. An important part of this layer is tracking the dynamics of the heated, insulated blanket of firn as it grows and shrinks over time, so the model ice below feels it and the dynamics adjusted.
This work is not yet completed, but we’re not far away from full success. The following movies demonstrate that we are capturing all of the important processes, but more rigor is needed in evaluating the details before we can begin modeling the future with the certainty we’d like.
Here is a model movie output showing McCall Glacier growing from scratch (light red) over bedrock (dark red) in a climate favorable to glacier growth. The color bar at right represents ice temperature as the glacier grows. Notice how the ice changes from red to blue about halfway down — this is where the firn ends and bare ice is exposed to winter temperatures. As the glacier grows thicker, you’ll see that the bed remains warm (reds and light blues) at its base in the location we know that sliding has historically occurred. Don’t pay too close attention to the years at top, this output is just an initial demonstration of the dynamics with a lot of hypothetical driving data just to get it going.
Here is McCall Glacier in an environment favorable to glacier ghosting. Notice how the glacier gets colder as it thins — this is due both to the loss of the firn area which generates warm ice and to the geothermal heat flux coming from the molten core no longer keeping the bed warm.
Once we fully utilize the comprehensive suite of long-term data that we have on McCall Glacier to fully evaluate the model, we will understand its uncertainties and be able to rigorously predict the timing of oncoming zombie glacier apocalypse of this entire region.
Conclusions
The zombie glacier apocalypse has already begun. One by one these glaciers will continue to melt away, leaving remnants that will get buried alive in the debris they themselves created or dissolving into ghostly apparitions of their former glory. Because of this, glacier discharge into the rivers of the 1002 Area will begin to decrease within the next 10 years, if not already, and in the next 50-100 years there will be little to no glacial meltwater or sediments leaving these valleys. The bird, fish, lagoon, and riverine ecosystems will be forced to adapt, or not. Decreases in caribou populations, increases in beavers and moose, loss of shorebird species, salinification of lagoons , the disappearance of barrier islands– these are all outcomes we can expect if seismic and infrastructure work proceeds as planned. The question becomes how can we mitigate the risks of development if we cannot distinguish the causes of these outcomes between this development and climate change if we don’t understand the glacier story?
The short answer is that I do not think that we can.
Who should decide which of nature’s stories should be heard and shared?
The founders of this project had great foresight and I will always be inspired and grateful for that. When this project started, glaciology was in its infancy — the core papers accurately describing the movement and growth of glaciers had only been written in the previous few years. Yet, the theoretical fundamentals were known and they went after documenting them in nature. This project was one of the first that deliberately set out to understand the linkages between climate and glaciers over the long term, connections we take for granted today, thanks to them.
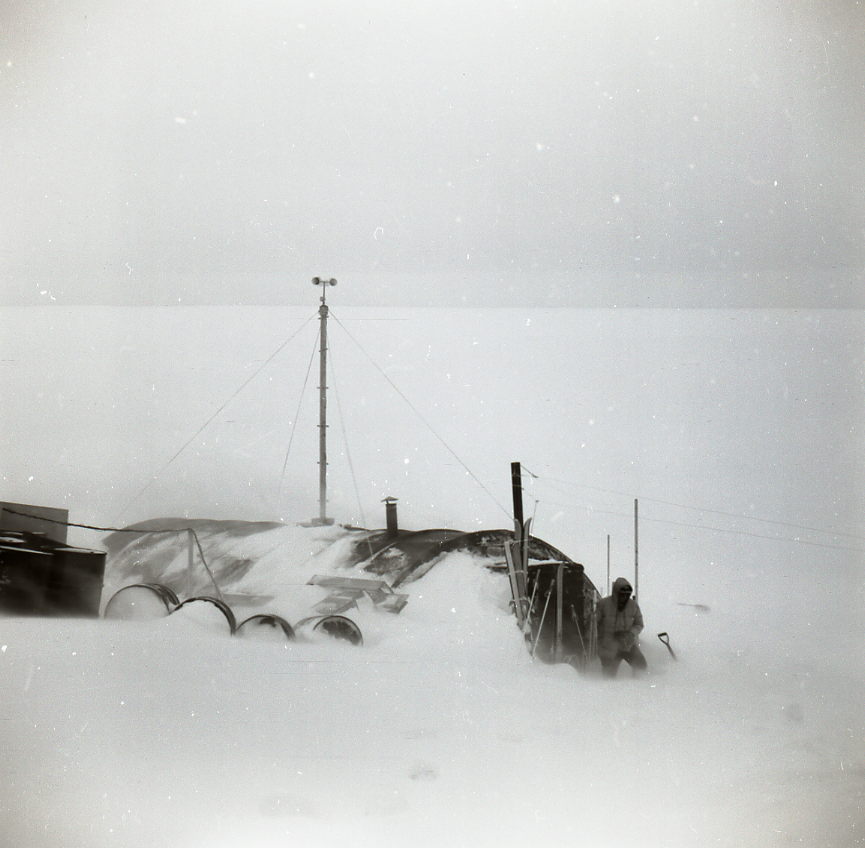
The original team took manual observations of weather every 4 hours, through the night and through the winter. I’ve since replaced this with automated weather stations (and in their original locations), but even those automated stations need maintenance and downloading in this unforgiving and rapidly changing environment.
I feel confident to say that those that had the foresight in 1957 to initiate this project would all be smiling right now if they saw how this story had unfolded. They made weather measurements every 4 hours, even through the night. They surveyed glacier motion by climbing the surrounding peaks to triangulate locations of their stakes. They drilled a hole to the bottom of the glacier to measure ice temperatures in an accumulation area (I think for the first time). And lot’s more.
All because they knew nature would tell them a story here and, most poignant to me, they knew that they were not going to live long enough to hear the end of it.
The uncertainties about the future were huge back then. For example, at the time they drilled into the firn, they thought the warming trend that was causing these glaciers to shrink was about to reverse and grow colder. They had no idea of the rapidity of the warming that was to come or how soon the firn here might disappear.
And that’s the sacrifice — putting in the effort knowing you’re not going to hear the final story, let alone tell it. A delayed satisfaction that may transcend your own lifespan.
The founders of this project went in for an 18 month field season, prepared to winter over. They left their camp behind when the project ended and it subsequently got buried by firn. I’ve plotted its likely location over time and done the math that shows it should melting out in the next few years — a long term mass balance stake! It should yield a treasure trove of artifacts from that period which hopefully will land in a museum, telling their story of foresight and sacrifice.
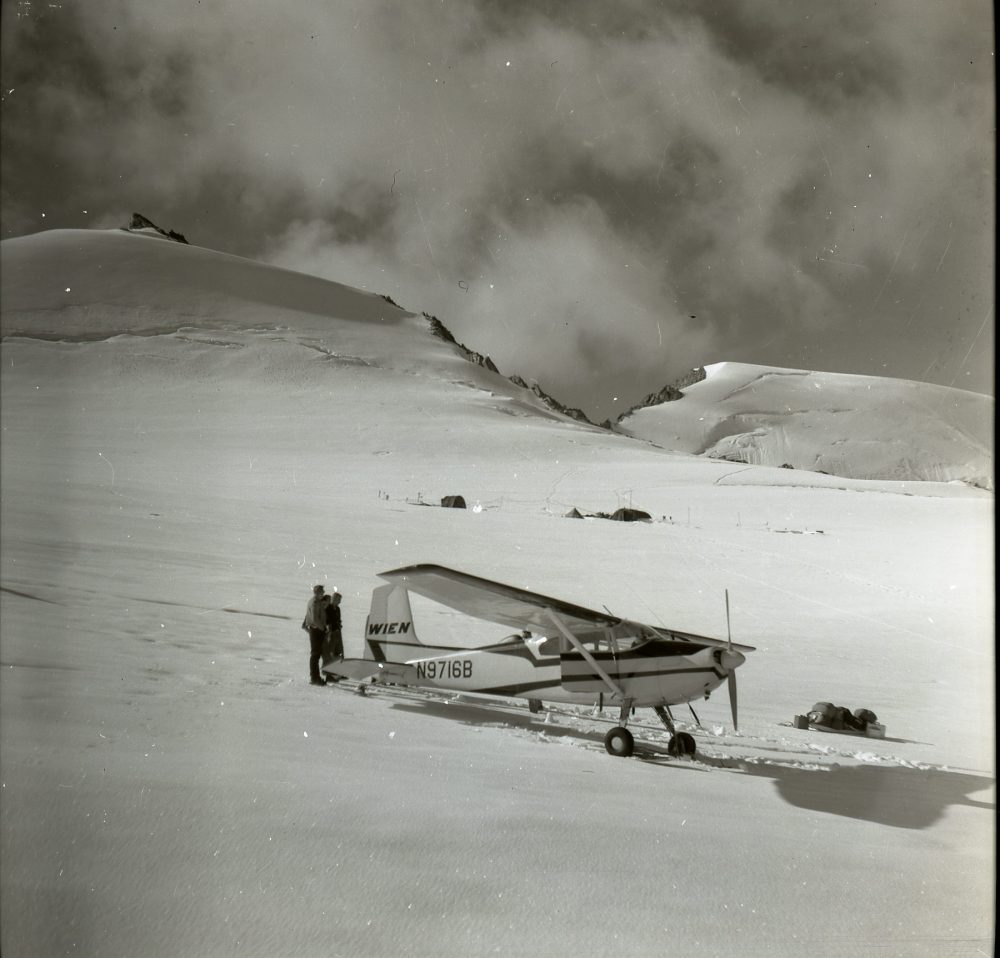
The technology we use to study glaciers has changed a lot in 70 years, but landing on the glacier with a ski plane to support field work hasn’t. Indeed, the plane I use today was born in 1952, before this research program began and could easily have been in this photo from 1958. The pilots here were Fairbanks people and I was fortunate to have met them 50 years later to hear their adventures, thank them for their contributions, and show them photos they never knew existed.
When people ask me what I do, I often tell them I study glaciers. Often the response I get is “Boy, it must be a great time to be a glaciologist because there must be so much funding for it given all these changes!”
I spent 25 years at the University of Alaska and I can say definitively that funding for glaciology was never good.
Proposals to the National Science Foundation for glacier research like this had less than 1 chance in 10 statistically. I was fortunate to receive 3 such grants for research here to support the first 10 years of my involvement with this project, but that was an anomaly. Funding agencies abhor long-term baseline studies, despite an understanding of their value, because the agencies are chronically under-funded and have no guarantees themselves of having money to grant next year, so they don’t want to commit to anything more than 3 years.
For example, submitting a proposal to National Science Foundation to say that I wanted to spend 18 months in the field like they did in the 1950s would literally get laughed at — they don’t spend that much on senior scientist salaries per year for all of the glacier projects they fund. And as of today it’s questionable whether there will even be a place to submit proposals to tomorrow.
So it was never good, but now it’s much worse — the NSF is being gutted, scientific staffing in government is being decimated, and the population is being told by governmental leaders and their influencers that scientists cannot be trusted if the stories nature tells them conflict with the stories they are telling. We are cranking out more graduate students than can find jobs and of the thousand or so glaciologists that exist, the vast majority have nearly-full time jobs teaching because there was simply no money to pay salaries for senior scientists more than a few weeks a year and even less now.
So there is now an existential crisis in the field of glaciology due to lack of Federal funding– a zombie glaciologist apocalypse, but that is story for another time…
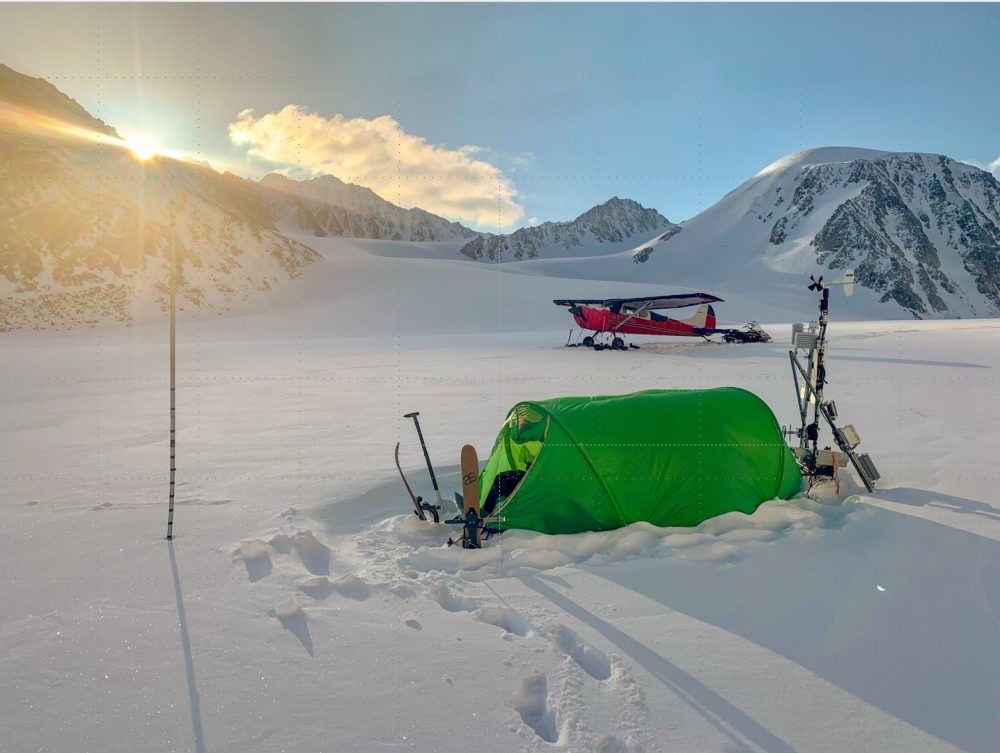
This photo encapsulates everything that keeps me coming out here — listening to the story that nature is telling regardless of external funding, landing in my plane, camping between a weather station and mass balance pole I’ve been maintaining for decades, and rejoicing in the start of a new day here.
I saw this apocalypse coming and that’s why I’ve been doing this as a citizen scientist since 2014 — all of the fodar data I’ve shown here was collected on my own and all of the field work since 2014 has just been done by me, after learning how to fly and buying a plane to get here because I couldn’t afford to pay someone else.
My solution to funding was to start an airborne topographic mapping company and using the profits from that to fund this research, but it’s been trial by fire and though running a solo company gives me a lot flexibility in deciding what I want to study, it still takes up a lot of time. But it did break me out of the mindset that government is the only option for funding and that has expanded my mind greatly as to how to prevent the zombie glaciologist apocalypse.
So as I begin to age out of this field work, I’ve given a lot of thought to how to provide financial tenure for this project and those who will come after me, so that someone will be here to watch this zombie glacier apocalypse unfold and hear the story it tells. I’ve got a plan and it will take a few years to play out, but by the 5th International Polar Year in 2032 I hope to able to promote that this research program is self-sustainable forever through passive income from investments and thus immune from political whims, such that by the 6th International Polar Year 25 years later we will be bringing together thousands of independent glaciologists who are doing the same, for the benefit of us all.
In the meantime, I’d like your help.
So what can you do?
A few years ago, I might have suggested you call your politicians and explain to them the value of long-term baseline studies here. To tell them the story you’ve heard. To make them believers too.
But grasping tighter onto solutions that were never working is not the scientific path.
I believe that path is financial freedom from government so that we never have to call them or ask their permission– an uphill, losing battle that’s been fought for decades and how we ended up here.
As I said, I have plan for that financial freedom, but it will take a few years to play out.
In the meantime, let’s show our politicians that we don’t need their permission to listen to nature.
Let’s take away their power to rewrite the narrative.
Let’s demonstrate who holds the real power.
If you enjoyed hearing this story, found value in it, and want to participate in something meaningful, please consider paying it forward to learn how story continues to unfold.
Click here to donate $17/month to help ensure this long-term baseline study not only survives the zombie glacier apocalypse but thrives in it. Everyone who donates will get my monthly newsletter where I share the latest parts of the story I think I’ve learned.
That’s only the price of a movie in theaters these days.
We don’t want the government to decide what movies get made, why should we let them decide what research gets funded?
Our dollars are the real vote.
What’s yours?
If only 250 people in the world thought that hearing stories from McCall Glacier had more value than the latest Hollywood production, it would cover my direct costs each year in keeping this research program going.
If 1000 people thought this I could hire students and post docs and implement much more sophisticated and longer field programs to hear and share the story with much more detail than I can accomplish alone.
And if you are an ecologist (or any kind of ologist) and you found scientific value in this story, please consider getting involved with the project. I’m happy to share data and tell the stories I’ve heard with greater rigor.
I believe together we can make a difference, we just need to choose the story we want to listen to.
My first mentor in glaciology 35 years ago charged me to “Speak always to the unknown friend”. I’m trying my best Mal.
