How seismic operations threaten the Porcupine Caribou Herd
Why I care about the Porcupine Caribou Herd
By 2006 I had been leading the field program for three years on McCall Glacier in the Arctic National Wildlife Refuge, having taken over from one of my mentors, who took over from one of his, in a chain dating back to 1957. I felt like I was part of something bigger than myself, temporarily taking over a mantle of leadership which I would in turn pass on to keep this valuable research program alive. Getting to and from the glacier at that time meant flying a helicopter from the coast for an hour, passing over a green blur of tundra that cost my project a huge amount of money to fly over – if only we could get rid of this tundra to save money on these helicopters! Little did I know that when my son was born that my bad attitude about tundra was about to end.
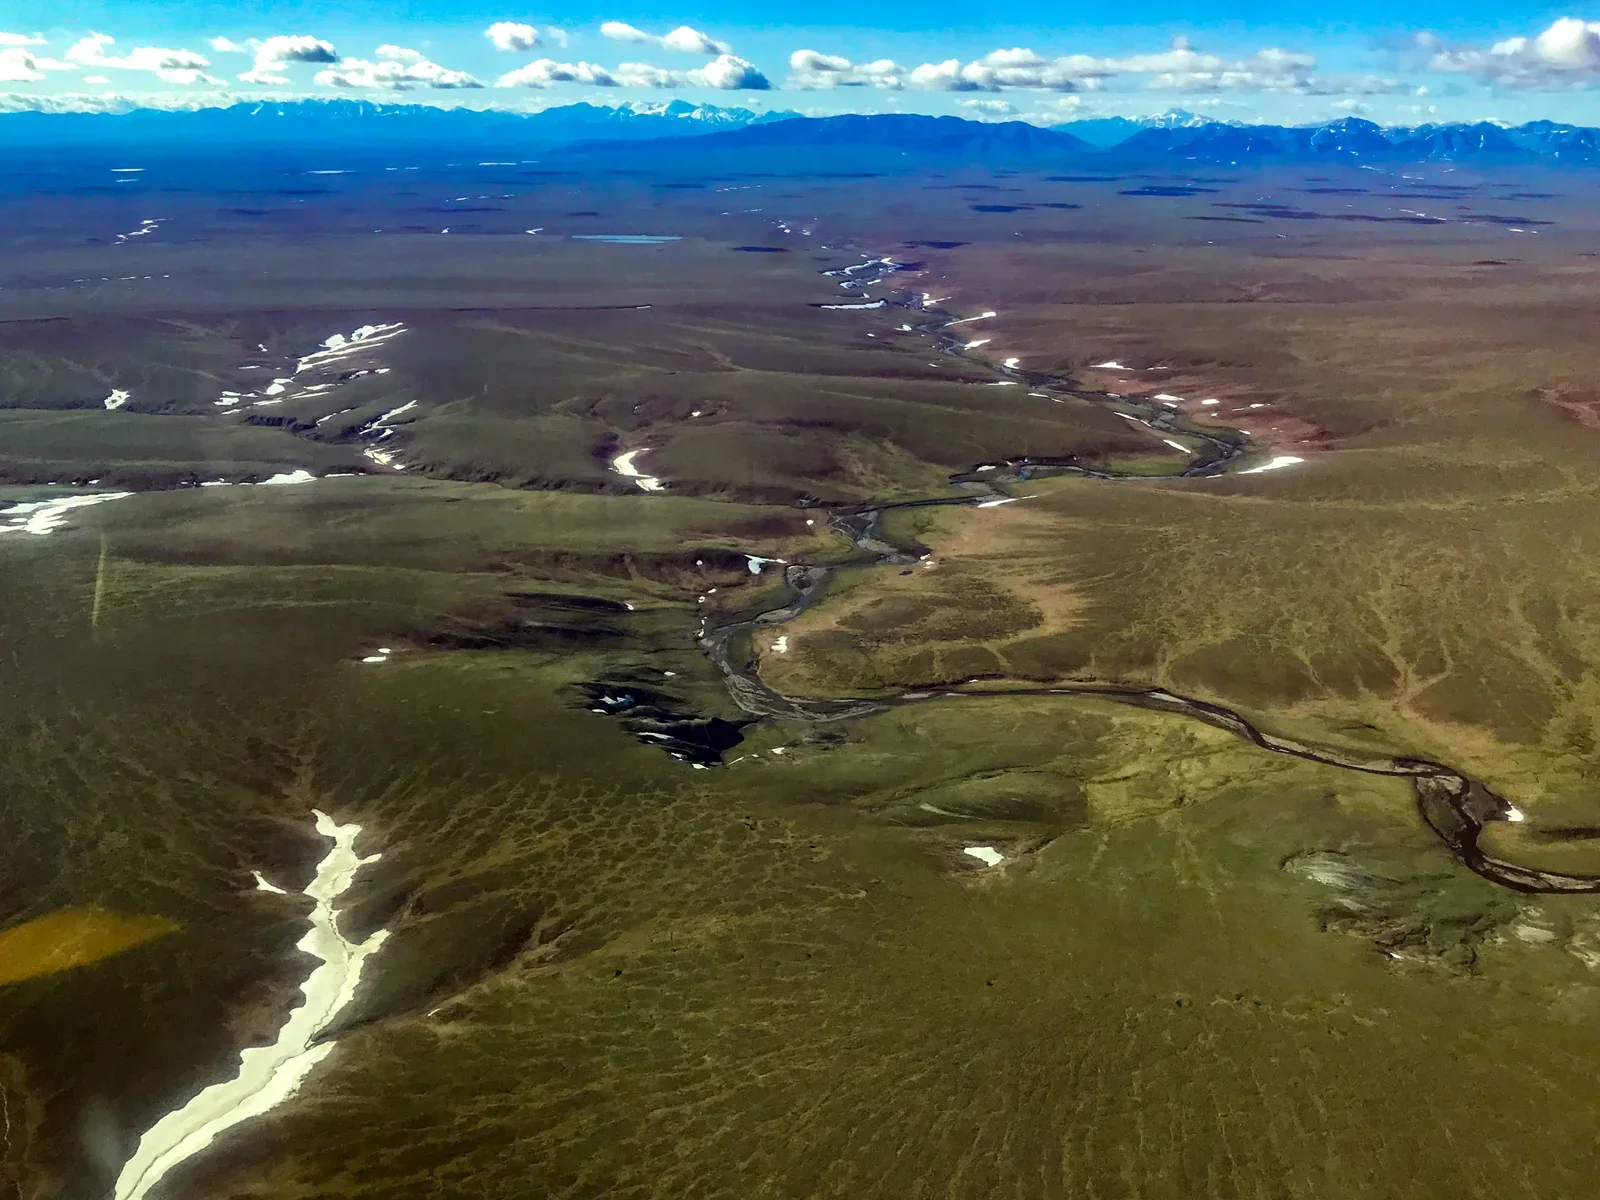
At first, the tundra of the 1002 Area was just this annoying blur of green and brown from the air, slowing us down from getting to the glacier (in the mountains in the background). Note that this tundra is not flat, an important plot point for later: the 1002 Area is NOT a coastal plain.
My wife and I were just completing our first 3 years NSF project on McCall Glacier by the time of my son’s first visit there, in utero at 7 months, much to the dismay of our parents. A year later, we had packed sufficient diapers for a two week field trip and were boarding the helicopter when the pilot questioned us about having an almost one-year-old with us. It’s a long and painful story on its own, but after several tense hours on the tarmac running it up the flagpole, we finally got a No from the Directors office at the National Science Foundation, the tippity-top of the flagpole, so there was nothing to be done at that point: we had to split up– I went off to the glacier without them.
Perhaps needless to say, I didn’t take No for a permanent answer. So after that trip we made a new plan for our August trip three months later – we used the helicopter to transport all of our gear and other team members, while the three of us chartered a bush plane on our own to land us on the tundra – from there we would hike in and reunite with the team.
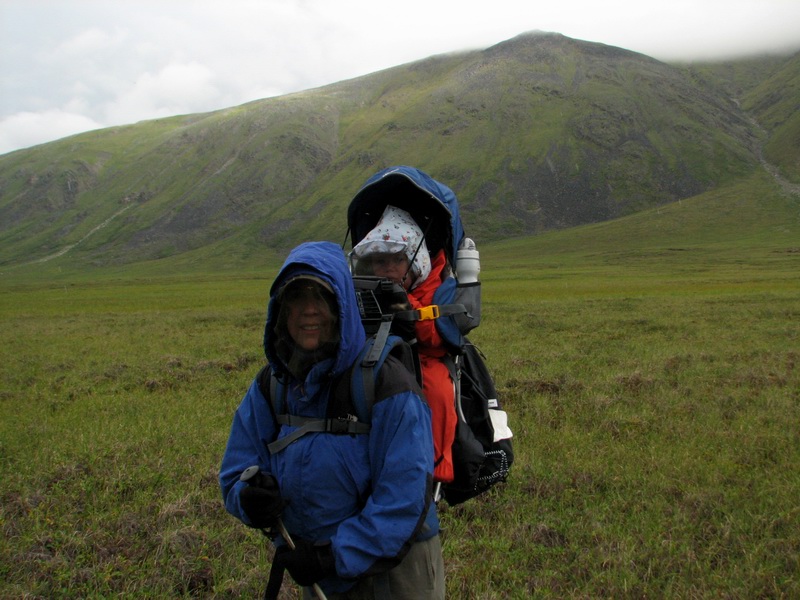
When the plane left, we began sorting our priorities — first we had to protect ourselves from mosquitos and next we had to climb the moraine in the background.
It was my first experience on the tundra. Yes, it was the mosquito-hell I had imagined it to be, but it was also much more than I realized. As we spent several hours scrambling up the steep Okpilak River moraine to get into our valley, it became *painfully* obvious that this landscape was shaped by the glaciers I was studying. And as we crossed rivers it became clear that the meltwater and sediments from these glaciers still exerted strong controls on the landscape. It was in many ways so much more interesting than the glaciers – there was life here! I’ll never forgot the lone caribou we saw — my son at almost-one was largely using sign language to communicate and when the caribou popped up in front of us he made the hand sign for “doggie?”. It was on this mosquito-plagued hike I realized that I had been missing a big part of the glacier story by flying over this landscape at 100 mph…
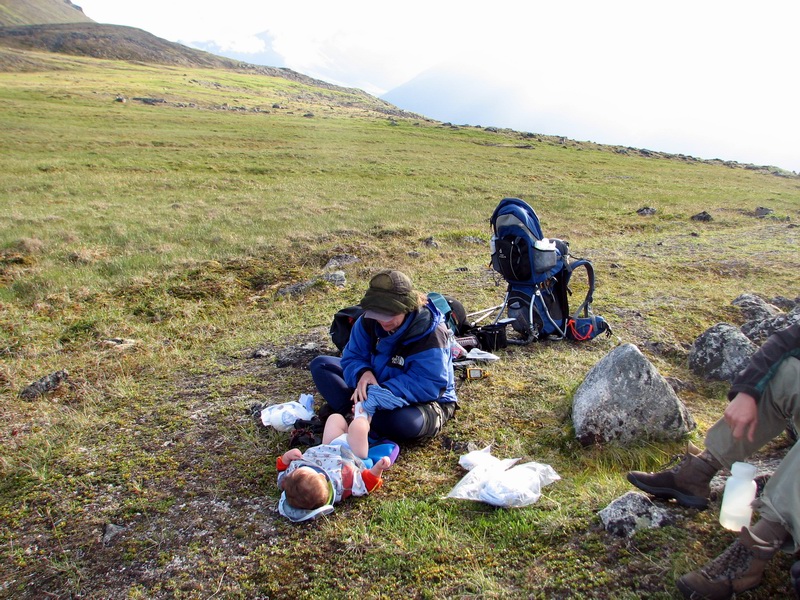
Fortunately we had 11 months of experience changing diapers, so we were able to do it efficiently before the mosquitos discovered so much exposed skin.
I discovered the tundra was more than an annoying green blur, it was an annoying, huge landscape full of a variety of life, all trying to eke out an existance.
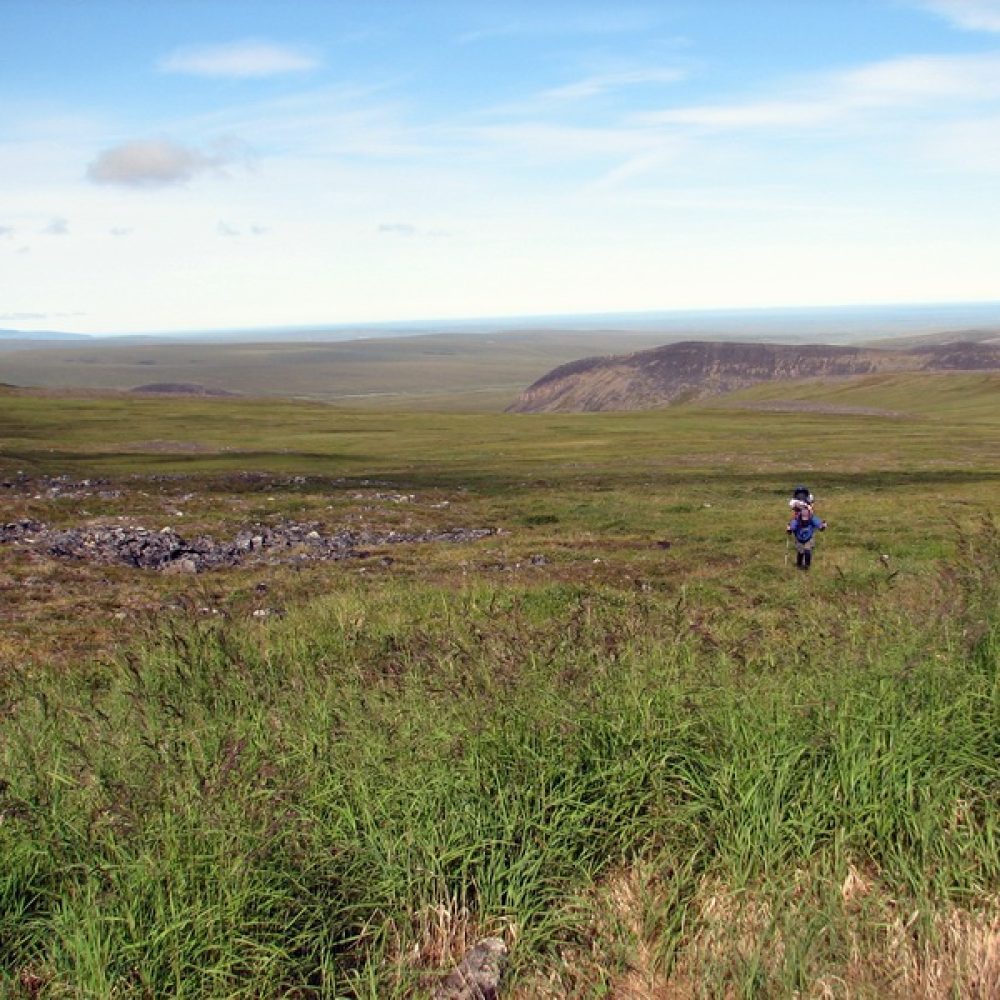
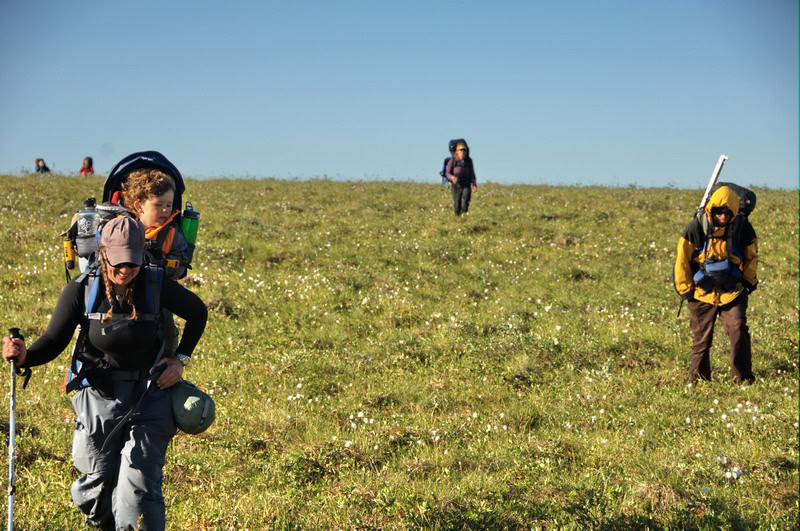
So the next year we planned to spend a week hiking in from a starting point much further from the mountains. This time I brought an ecologist, a student, and a colleague so we could learn more about this green stuff. Walking was hell – giant, ankle-breaking tussocks surrounded us in all directions. Fresh bear scat was everywhere. My backpack was way too heavy – my wife carried our son and I carried all of their stuff, my stuff, and a bunch of science stuff, topping out at close to a hundred pounds. But by the end of our first day of hiking, none of that mattered any more…
As we hiked along the Jago River, a herd of about 50 caribou began crossing the river in front of us And at that moment I got it. Time stood still as I watched them cross one by one. This place suddenly made sense. This landscape was ancient. It was like we walked into prehistory. These caribou were here long before us. This was their home. No lines on a map changed that. We were the visitors here. To the caribou, we were the zoo animals from a foreign land.
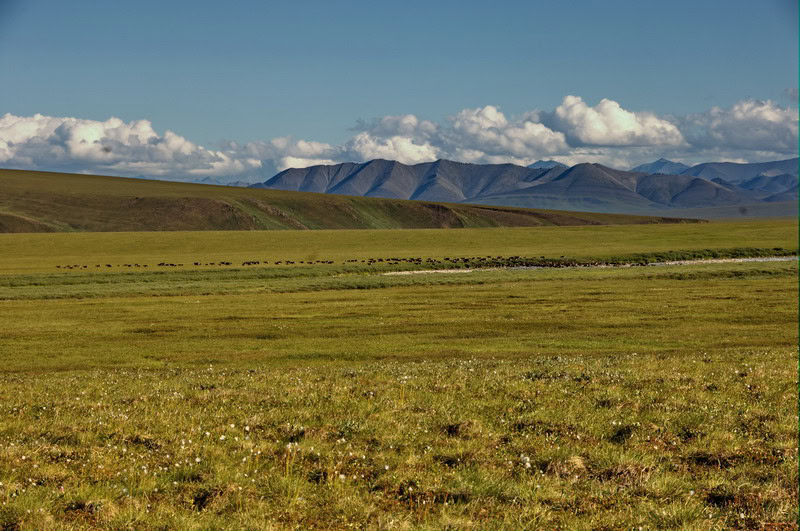
It was these exact caribou that woke me up to what this landscape was all about.
As we continued towards our goal, I couldn’t unfeel that feeling. My backpack was still ridiculously heavy, my ankles were still one misstep from breaking, the bear scat was still steaming, but I had made a connection with this place that transcended all that. Everything living here was doing so just on the edge of survival, where the margins between life and death were razor thin. Nothing would live here if it had the chance to live elsewhere– this location was all that was still available on a crowded planet. It was the same reason I was studying this glacier and not the ones that were much easier to access to the south. Same for the caribou. And the birds. And the bears. And the tussocks. And the mosquitos. That is, despite the hardships and the feeling of being one step away from catastrophe, this landscape gave us something we needed: a home.
After that experience, the heavy backpacks and ankle-breaking tussocks just became part of life in the north.
So after that trip, my new normal became hiking in on the tundra and integrating what I learned there with what I was learning on the glacier. We stopped using helicopters and I brought more and more ecologists with me on our hikes to help me understand this landscape and what the glaciers had to do with it. And in the nearly 20 years since then, I have probably spent more time on or over the tundra than the glaciers I’m nominally studying. It turns out that glaciers exert huge controls over the ecology, even today. But that’s a story for another time.
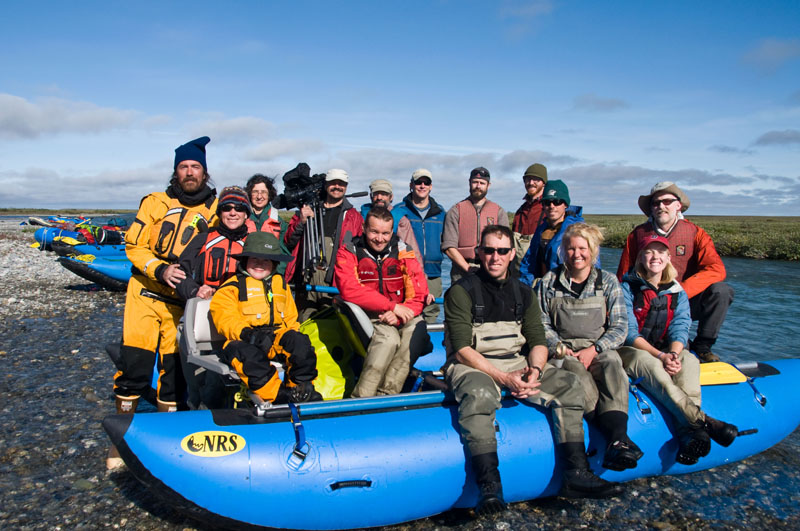
Within 3 years of that first experience, I was leaving the glacier on a raft and bringing a dozen ecologists, hydrologists, and permafrost scientists with me to figure out the relationships between glaciers and caribou.
In this blog, I use my data to tell the scientific story of how the seismic operations proposed on the tundra here may displace the Porcupine Caribou Herd from their home by making it uninhabitable by them, pushing that razor thin margin of survival too far if we do not take care to prevent that from happening. To summarize it: climate warming has radically changed the surface hydrology here by thawing the underlying ice and this physical change has rapidly transformed the plant ecology, already causing a loss of ~8% of the foods calving caribou prefer, so imposing a grid of seismic lines would make surface drainage on this hilly landscape much more efficient, accelerating the current ecological transformation such that perhaps 50% or more of these important caribou foods might disappear for millennia, perhaps decimating their population or changing their migration dynamics.
The potential impacts of seismic operations on the ecology of the tundra, in particular caribou, has not even been considered by the BLM, the regulatory agency, let alone created regulations strong enough to protect them.
So this is a call to action, otherwise seismic work here will likely begin this winter.
For those interested in the details of why I believe this is a possibility I include tons of detail below: it’s pretty nerdy but I tried to make it accessible to experts and non-experts alike as these dynamics matter to me and to the ecology here, so I hope that by understanding them better they will matter to you too.
For those that just want the final bullet points and hear how I think we can avoid this outcome, just skip to the end. Or just skip to the third blog in this series where I lay a plan everyone can get involved with right now to prevent harm to the Porcupine Caribou Herd from seismic operations this winter.
Introduction
There is now unequivocal evidence that forage sources for calving caribou within the 1002 Area are currently being permanently impacted by climate warming and I believe there is conclusive support that seismic operations there have the potential to rapidly accelerate these dynamics in ways that will adversely impact caribou population health and migration patterns. Thus, I believe the risks of irreversible damage to this landscape by seismic operations are greater than those of infrastructure development as seismic would be occurring over 1.5 million acres rather 2000 acres, respectively, but both have equal potential for harm where they occur. Therefore, all regulatory protections to the landscape, soils, hydrology, and ecology from infrastructure harm need to be applied to seismic operations as well. This blog describes that evidence and my conclusions, largely excerpted from this ~500 page report I submitted to the BLM in March 2026 in response to their proposed stipulations and required operating procedures within the Arctic Refuge.
Section 1 sets the background. The sensitivity of the 1002 Area to disturbance is higher than the coastal plains to the west (including NPR-A) because the 1002 Area is not a coastal plain: sensitivities here are dominated by hillslope hydrology not coastal plain hydrology because the 1002 Area is composed almost entirely of sloping terrain. That is, a vehicle rut on a coastal plain creates a puddle but the same rut on a sloping, thawing hillside creates a stream which reroutes hydrology over huge distances.
Section 2 describes the results of a 2020 peer-reviewed paper that describes a 10 year field study that found that increased rates of permafrost thaw and ice wedge melt have led to large changes in surface hydrology that in turn have led to rapid changes in vegetation ecology. Specifically, these physical changes due to climate change here have already caused a permanent ~8% reduction in plants that calving caribou prefer.
Section 3 abstracts these dynamics so they can be understood when observed throughout the entire 1002 Area both within this section and a companion blog describes dozens more examples organized thematically (lakes, rivers, streams, coasts) and this report includes many dozens more examples.
Section 4 reviews the impacts that have occurred from these seismic operations on nearby tundra as examples of what to expect within the 1002 Area unless new protective protocols are developed.
This blog is part 1 of a 4 part series that describes some of the results that I have found from repeat airborne mapping using fodar:
Part 1 (this blog): The conceptual framework behind the predicted impacts to caribou
Part 2: Observations of pervasive hydrological and ecological changes throughout the 1002 Area
Part 3: Recommended best practices required for responsible development of the 1002 Area
Part 4: The impacts of glacier loss upstream of the 1002 Area on downstream ecology
1. The 1002 Area is not a “Coastal Plain”
This region of the Arctic National Wildlife Refuge was reserved for potential oil and gas development under Section 1002 of ANILCA “(1) The term ‘coastal plain’ means that area identified as such in the map entitled ‘Arctic National Wildlife Refuge’, dated August 1980“. Despite this legal designation, the “1002 Area” (typically pronounced “ten-oh-two”) is not a coastal plain in scientific terms and the difference is not simply one of political nomenclature or esoteric science, it is important because the sensitivity of this landscape is driven by the dynamics of hillslope hydrology and processes not coastal plain hydrology and processes. In plain English this means the 1002 Area is not flat like NPR-A, so seismic protection protocols developed for a flat, thawing coastal plain are not likely to work as well as a sloping, thawing hillside because a vehicle rut on flat ground fills with water that becomes a puddle but the same rut on sloping ground becomes a stream that hydrologically connects watersheds perched at higher elevations to lower elevations in an irreversible way, affecting a much larger area. The 1002 Area is unique in Arctic Alaska because it is the only region at this latitude dominated by hillslope hydrology.
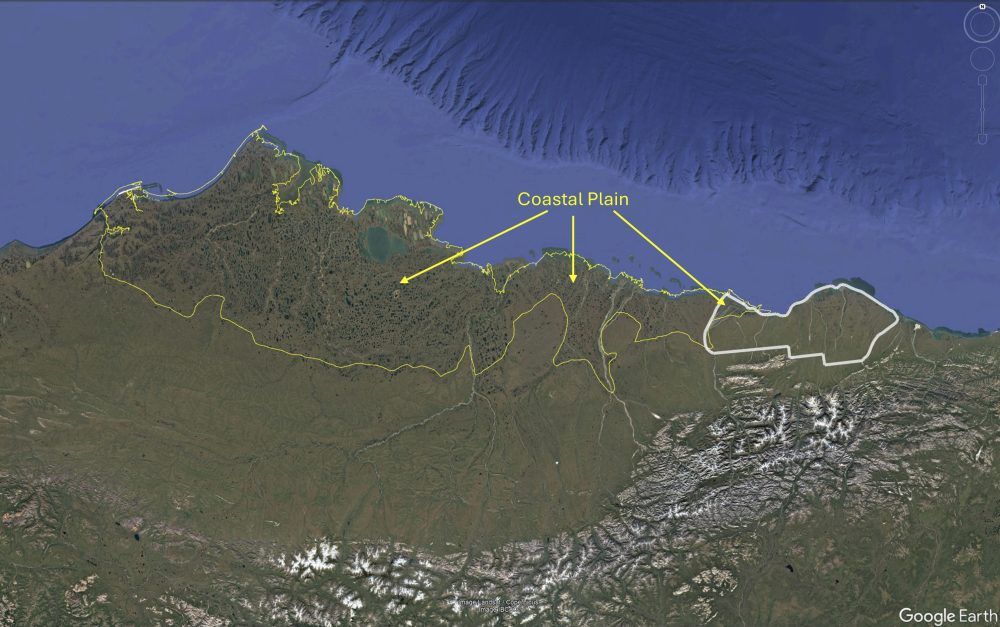
The 1002 Area is not a coastal plain. Even a cursory look in Google Earth shows that the terrain to the region to the west of the 1002 Area (white outline) is dominated by wind-oriented lakes which simply do not exist to the east (except in the northwest corner of the 1002 Area), because active tectonics are still pushing the mountains northward, creating foothills that run into the coast here. That is, wind-oriented lakes are a primary feature of Arctic coastal plains and these simply do not occur within the 1002 Area except to within about 3% of its area as defined geomorphologically.
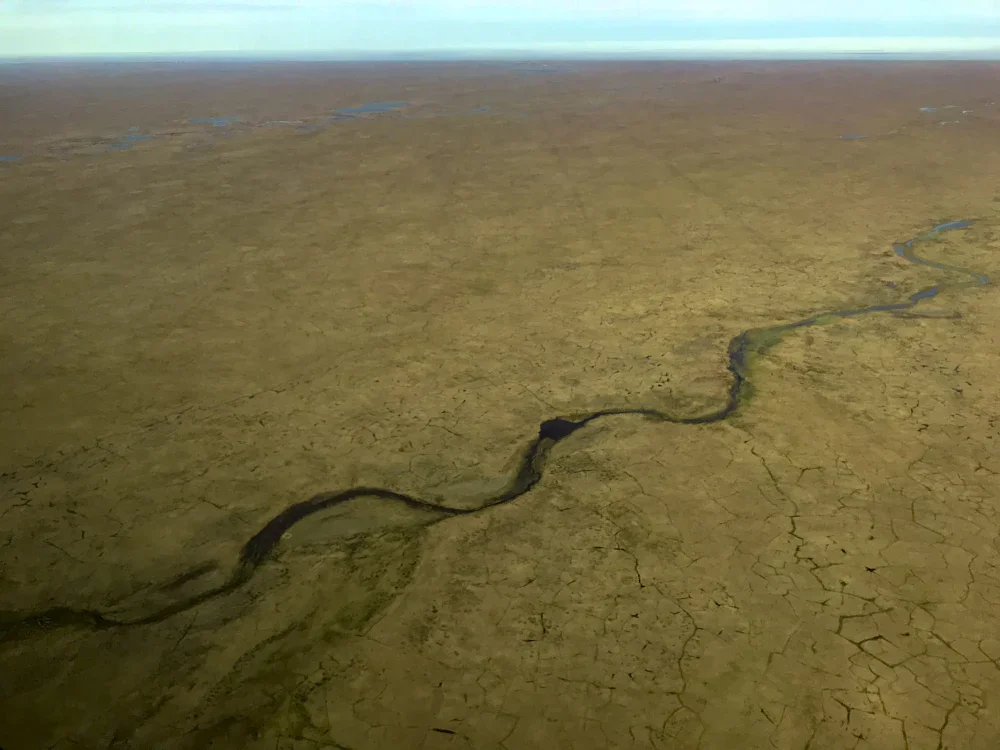
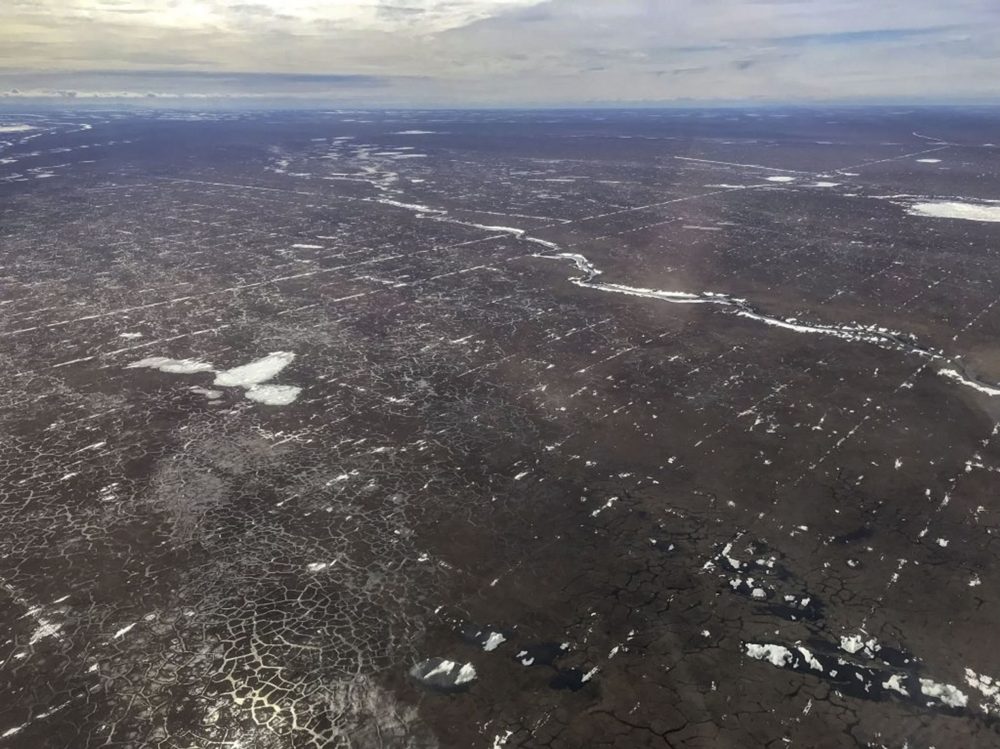
The 1002 Area is not a coastal plain. In terms of sensitivity of the terrain to disturbance, this is what a coastal plain looks like. Puddles that form here, whether due to ice wedge melt or seismic vehicle ruts, largely have no where to go because the ground is so flat and the streams that do form are tiny, slow moving, and have very limited lateral watershed area. This photo was taken within sight of the Arctic Refuge — the transition from coastal plain to foothills happens abruptly at the Canning River (not seen here), because the river forms around the edge of the tectonically-active foothills region that characterizes the Refuge.

The 1002 Area is not a coastal plain. The 1002 Area is not flat. Compare the previous image to this one — do you think their sensitivity to disturbance is the same? Disturbance here is dominated by hillslope processes — unlike the coastal plain in the previous image, water here does have a place to go, so any new flow path leading from high elevation to low will lead to draining and filling and associated changes in plant ecology.
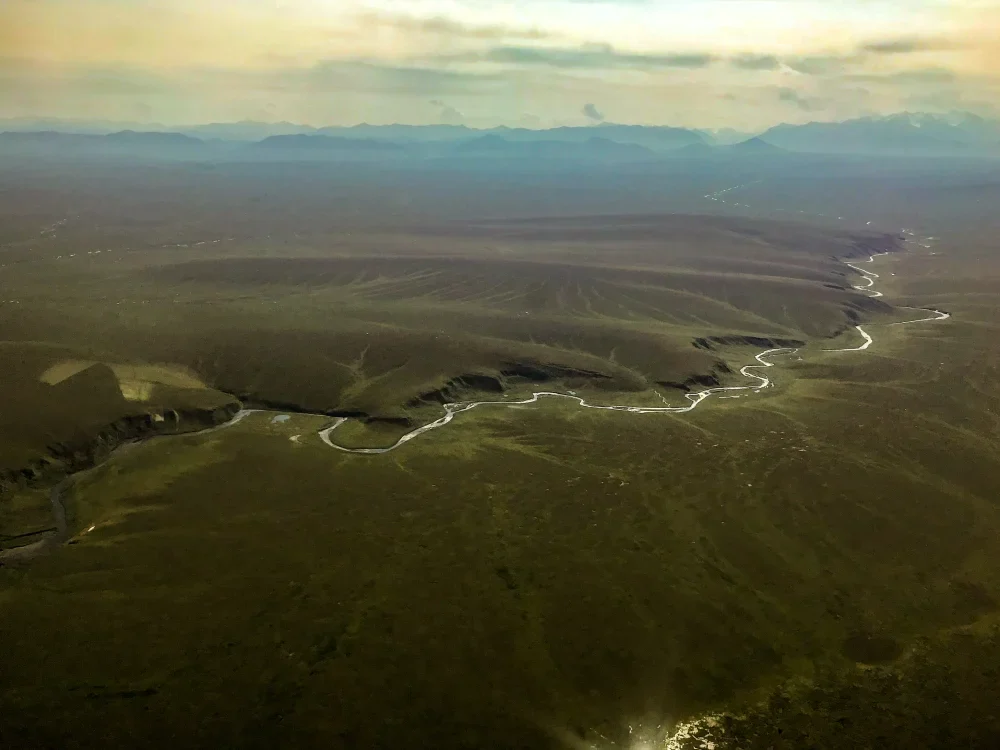
The 1002 Area is not a coastal plain. This rumpling of the landscape is tectonic, like pushing a carpet forward on the floor. It may well have functioned as a coastal plain eons ago, but it is now hilly terrain dominated by the sensitivities of hilly terrain to disturbance.
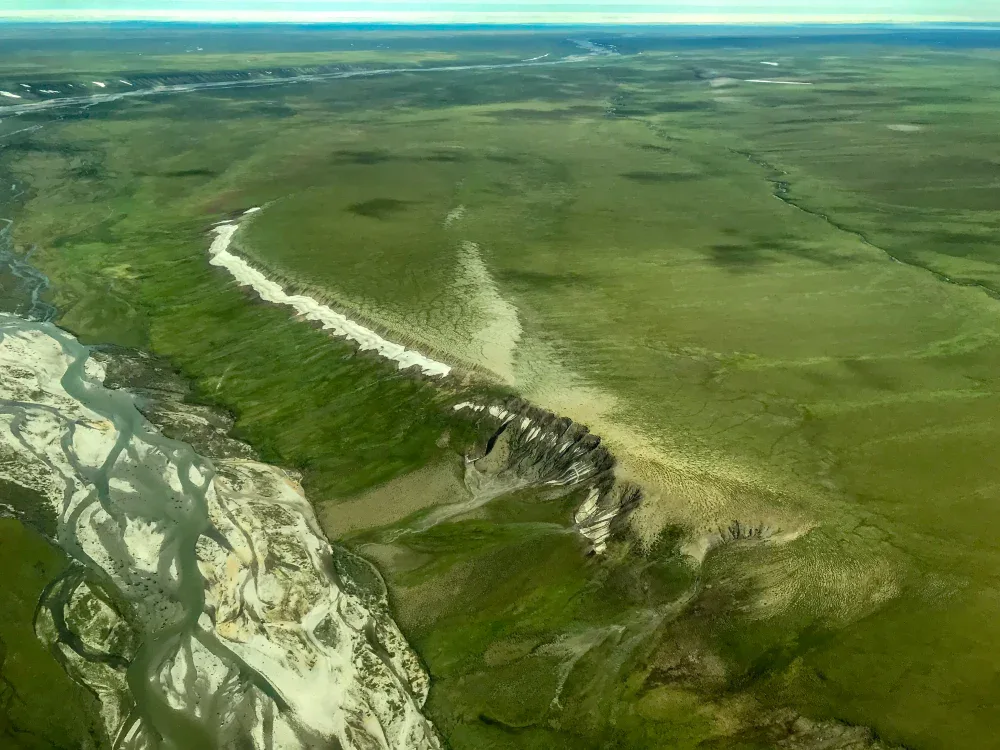
The 1002 Area is not a coastal plain. The rivers in the 1002 Area are vigorous and steep, because they drain mountain glaciers over short distances to the coast. Here, the river has incised itself tens of meters into the landscape — this is not the behavior of coastal plain rivers.
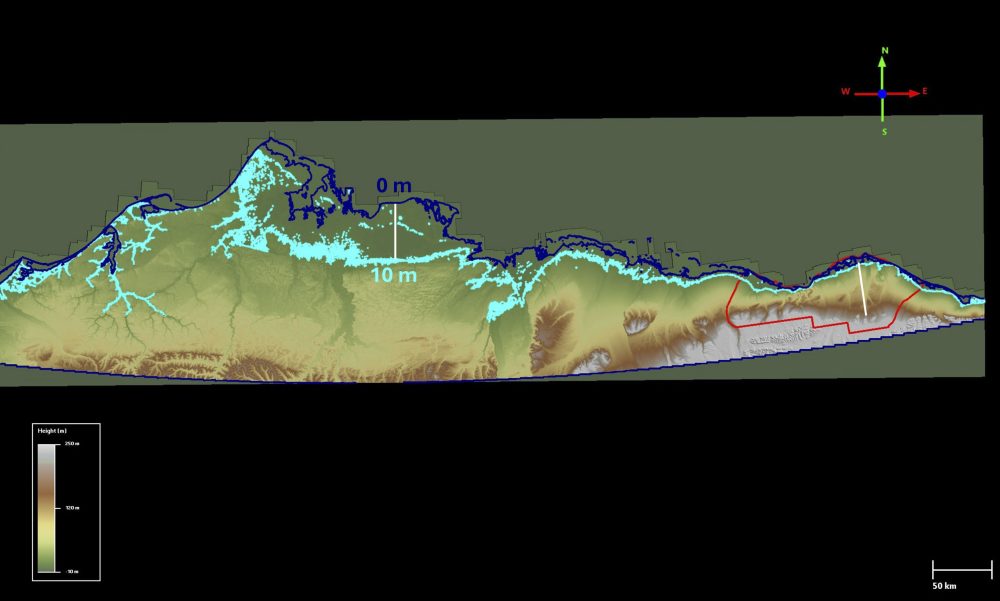
The 1002 Area is not a coastal plain. Here topography of the north slope is colorized (green- low elevation, white- high elevation), highlighting the extreme differences in topography and slope between the 1002 Area (red outline) and the coastal plain to the west. Dark blue line is the 0 m contour (current sea level). Coastal plains are typically formed when sea level falls, though river outwash can also build plains up. Here the light blue line is the 10 m contour, more than one would expect for recent sea level fluctuations so anything above this is not functioning as a coastal plain today. To the west (left), this contour is more than 50 km inland (white bars) – that is, most of the 1002 Area could fit within that entire coastal plain because it’s only about 50 km deep. For most of the north slope, the high elevations (white terrain) found along the entire southern border of the 1002 Area are not found at all at that latitude. Though the slopes everywhere are low compared to the mountains of the Brooks Range (seen in previous image), the difference in slope between coastal plains to the west and foothills in the 1002 Area have significant implications in terrain sensitivity to disturbance, as described later.
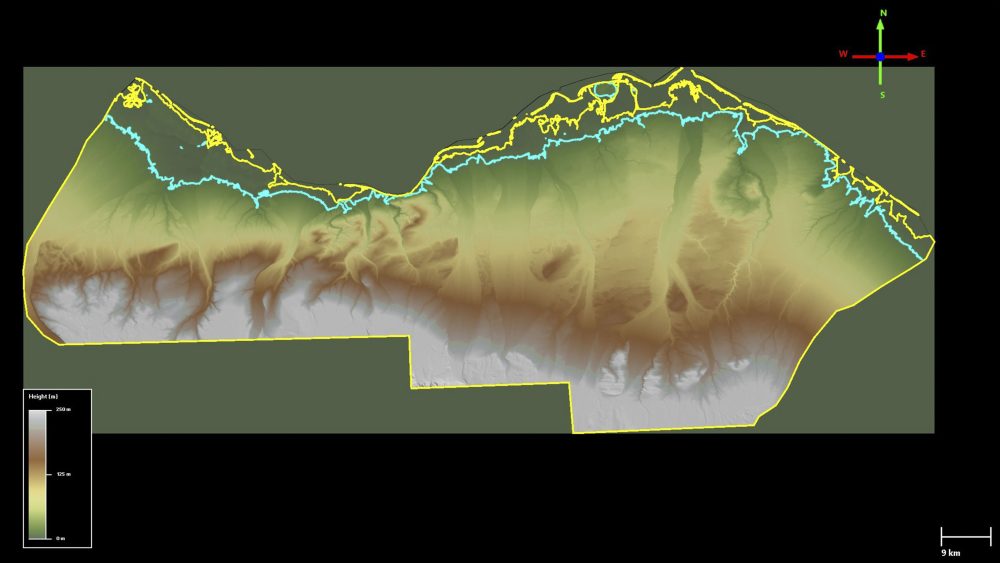
The 1002 Area is not a coastal plain. Here topography of the 1002 Area is colorized to indicate its pervasive sloping nature. Yellow line at coast is the 0 m contour and blue line is the 10 m contour. The 1002 Area is dominated by foothills and river floodplains– very little of this area could reasonably be considered a coastal plain (area between the yellow and blue lines) in terms of terrain sensitivity to disturbance.
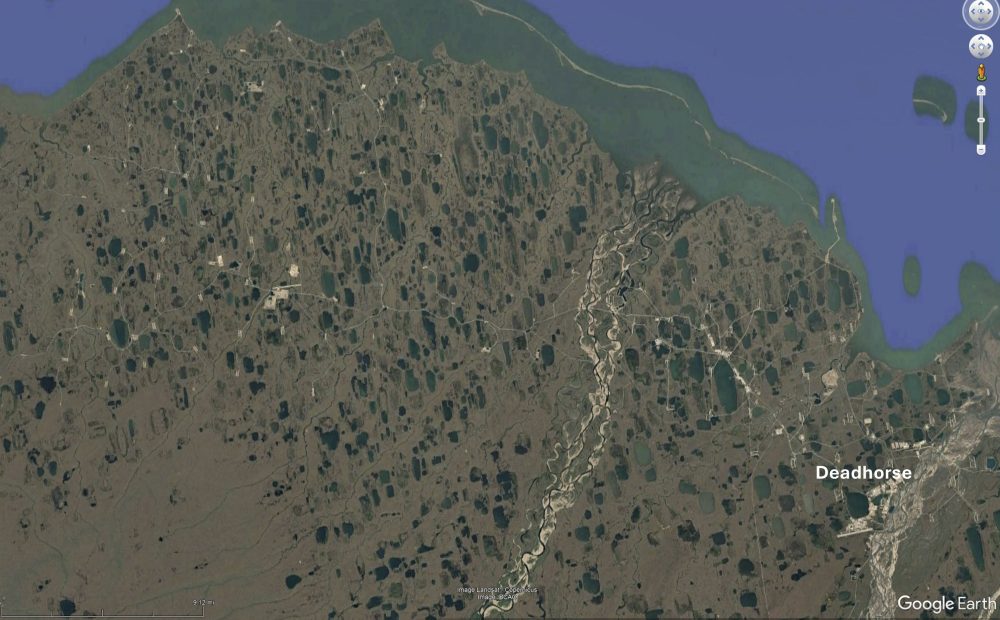
The 1002 Area is not a coastal plain. Here development sprawling out from Deadhorse (lower right) covers true coastal plain dominated by wind-oriented lakes and exceptionally low-slope terrain, as seen here in Google Earth — the lakes exist because the terrain is flat. The elevation of the Deadhorse Airport is only about 20 meters above sea level over 10 km inland from the coast. The 20 m contour in the 1002 Area is less than 1 km from the coast over much of its width and rarely more than 4 km. Developing the 1002 Area, including seismic exploration, simply has challenges that have not been in the current protection protocols because frozen terrain thawing on a slope has different vulnerabilities to disturbance than frozen terrain thawing on a coastal plain.
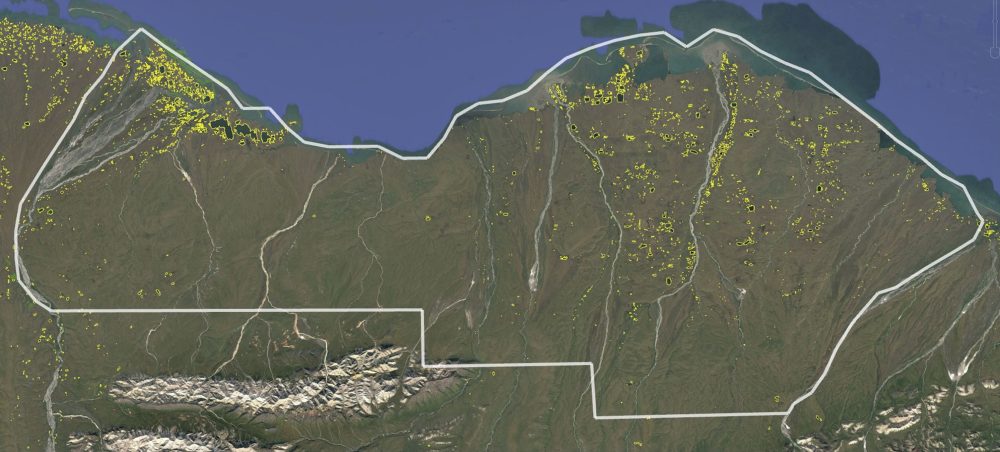
The 1002 Area is not a coastal plain. Here the official USGS lake boundaries (yellow outlines) have been overlain over the Google Earth imagery to highlight how few lakes there are in total and how small they are, especially in the western half of the 1002 Area (white outline). There are fewer lakes in the western side because it is steeper there, as these are true foothills all the way to coast near Camden Bay (left of center), being pushed forwards and upwards by the Sadlerochit Mountains (lower left). The eastern side has a different history and tectonic dynamic; this area may once have been lower lying or flatter more recently, characterized as a hilly coastal plain. Regardless, today it is not functioning as a coastal plain as the slopes here are much higher than the coastal plain to the west where terrain sensitivities are much different. Both the east and west sides are characterized by perched water bodies, with the main difference between them being the size distribution of those water bodies from ice wedges to large lakes.
2. Field observations of a rapid ecological transformation in the 1002 Area (2008-2018)
The Jorgenson et al (2022) paper (“Rapid transformation of tundra ecosystems from ice-wedge degradation“) describes the results of an intensive, painstaking, knees-on-ground effort, tracking the transformation of a several acre field plot in the heart of the 1002 Area over 10 years which found that ice wedge melt caused massive hydrological reorganization which in turn led to a rapid transformation of plant ecology. Here is an overview of their findings
Ice Wedge Melt
- Ice wedges surrounding polygons are particularly susceptible to disturbance and thaw because they occur just below the seasonally-thawed surface layer, ice wedge melt is now ubiquitous throughout the Arctic, the rate of melt is increasing with time, and the air temperatures driving this melt are expected to continue to increase over the next 30 years.
- Ice wedge melt in the 1002 Area is driven by largely by air temperatures and the trend in summer air temperature is +2⁰C over 80 years from local measurements, with an interannual variability of +4⁰C locally, with measurements showing the warmest summers lead to the most melt.
- Approximately 30% of this polygonal ground is underlain by ice wedges, with the percentage of area with degraded ice wedges increasing from 7% in 1950 to 66% in 2018, with an average ice wedge width of 4.5 m and depth of 3.5 m.
- Initial wedge melt is typically limited to about 80 cm due to stabilization processes that remain unclear but are related to the sloughing of new soils into the water-filled cavity, new vegetation forming within them, and drainage due to new connectivity.
- “Ice wedges go through a sequence of degradation and stabilization stages over a period of decades… with frequent alternative trajectories as degradation of earlier stages is halted and later stages undergo renewed degradation”.
- All phases of this cycle and recycling have been observed to occur within several hectares, indicating a highly-heterogeneous and practically unpredictable future hydrologic trajectory unless studied at the spatial scale of individual ice wedges.
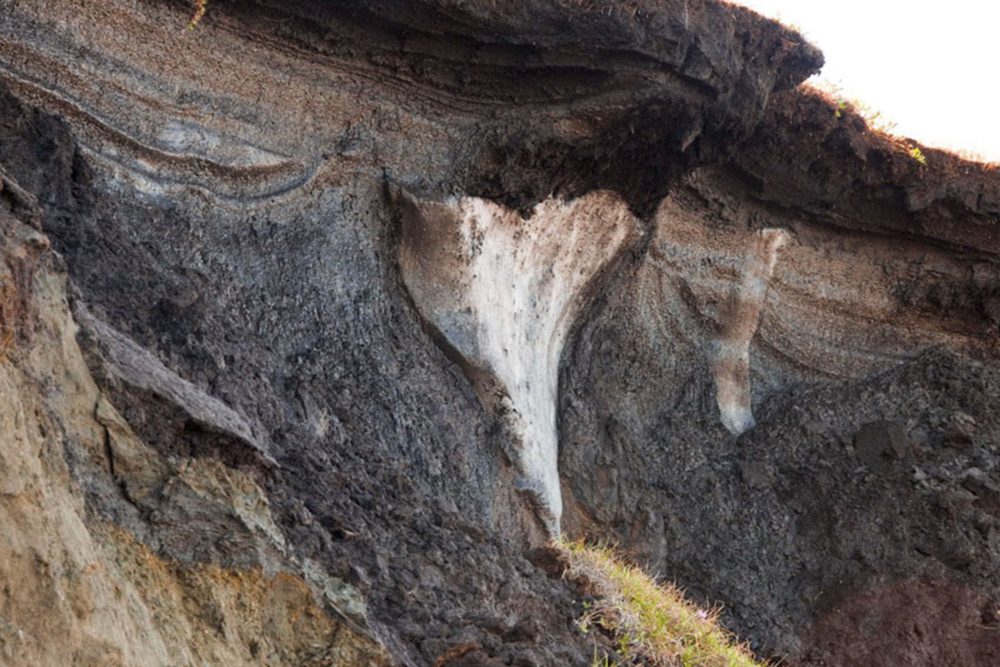
Ice Wedge Melt. This is a cross-section of a typical ice wedge. It was exposed at the coastline near Barter Island by a storm. To understand the dynamics of ice wedge melt here, it is necessary to understand that most ice wedges are covered by soils and vegetation at their tops. This is because warm summer air melts any ice near the surface, so the wedges must form beneath this thermally active layer in ground that stays frozen all year long. So when an ice wedge melts due to climate warming, it is melting beneath the surface — an increase in summer temperatures or a decrease in snow cover warms beyond the overlying soils, which causes the top of the wedge to melt. The weight of soils then displaces the meltwater, causing a surface depression which can this fill that water or from new sources.
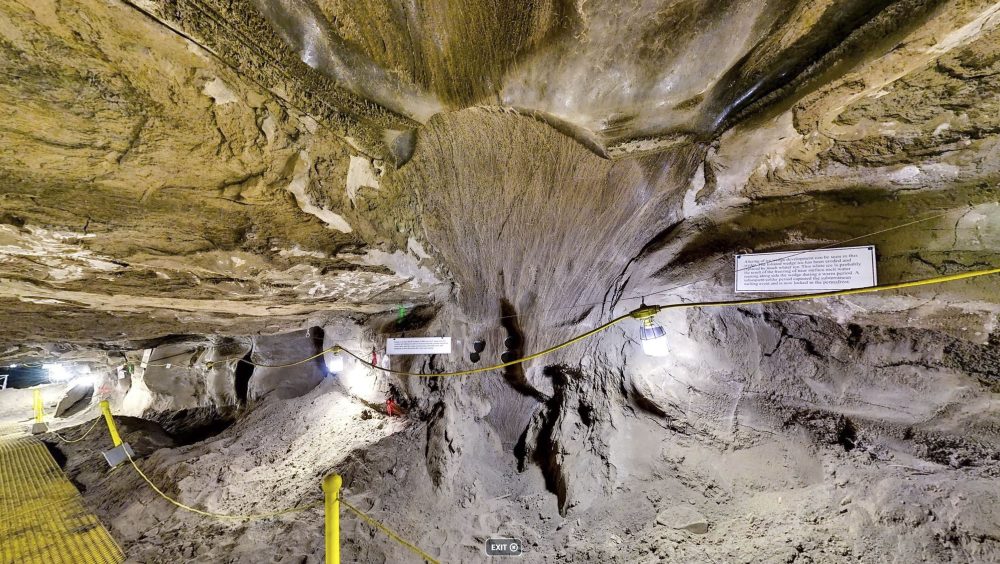
Ice Wedge Melt. This is another cross section of an ice wedge, this time below ground within the CRREL Permafrost Tunnel. The path we are standing on was actually bored through the wedge itself, which is huge. Such wedges are often 3-5 meters deep and several meters wide on their tops. They are formed when the ground cracks in the cold due to thermal expansion and then is filled with melt water in summer which then freezes within the crack, pushing the ground away like a wedge. Over millennia, this repeated cracking and refreezing forms a wedge with many layers, as can be seen here. Because this is happening on a two dimensional surface, the ground cracks form chaotic polygons of irregular shape surrounded by wedges like these.
Hydrologic Reorganization
- Hydrological changes associated with ice wedge melt are found throughout the Arctic anywhere melt occurs, as new drainage networks fill and follow the cavities left behind.
- The connectivity between these water-filled cavities increased from 2% in 1988 to 8% in 2018.
- Total length of drainage networks nearly doubled from 1988 to 2018, with all primary channels shifting into newly-melted wedge cavities. Secondary drainages feeding into them increased in length by almost 200%, expanding watershed areas by draining areas previously poorly drained, if at all.-
- Lateral expansion of stream banks was found up to 2 m and bank collapse of over 0.70 m were measured.
- As degradation improves connectivity, the resulting loss of standing water contributes to stabilization because standing water warms the ice beneath, unless the flow is vigorous causing thermal erosion of moving water to melt ice wedges completely.
- Changes in hydrologic connectivity can re-route flow into wedge cavities that were previously stabilizing. Changes in pH and water quality were associated with each stage in the degradation/stabilization cycles.
- Driven by climate warming and the chaotic nature of hydrologic channels through polygonized channels that have the ability to drain or impound flow, the hydrology of the entire landscape is subject to continued reorganization.
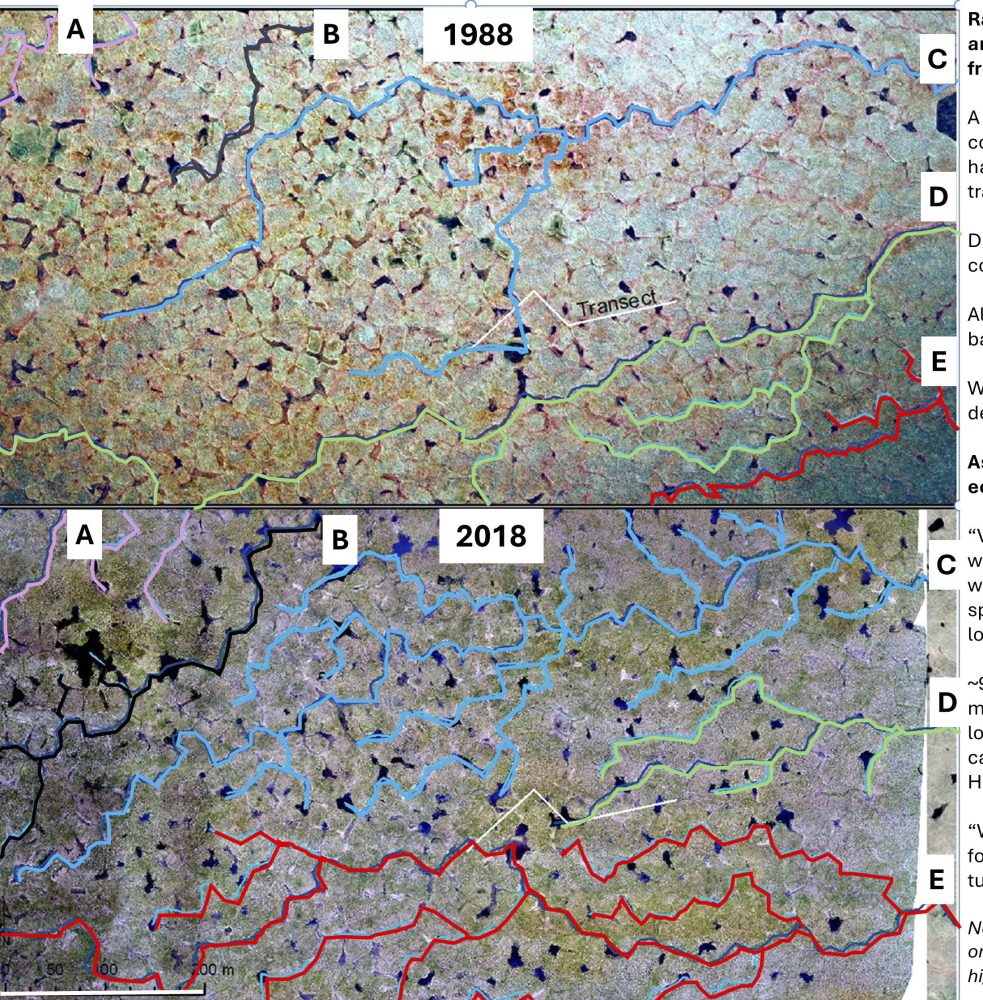
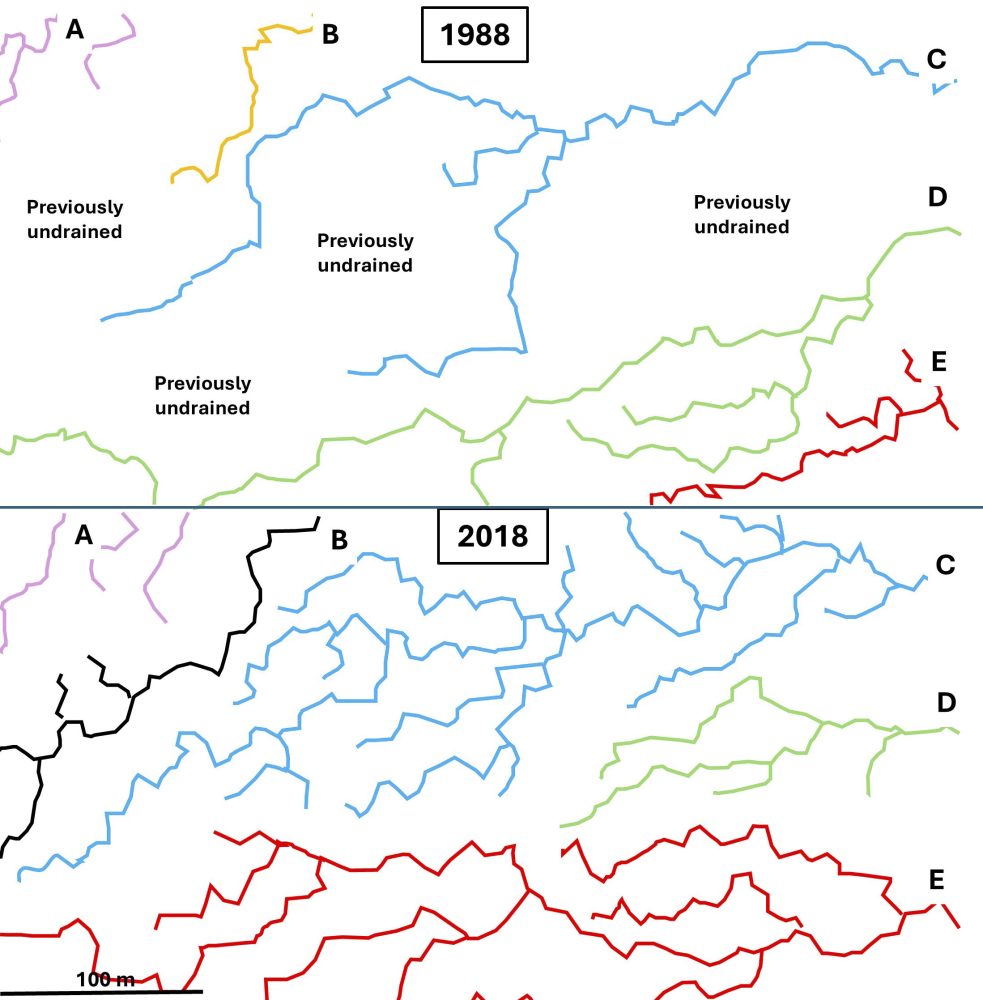
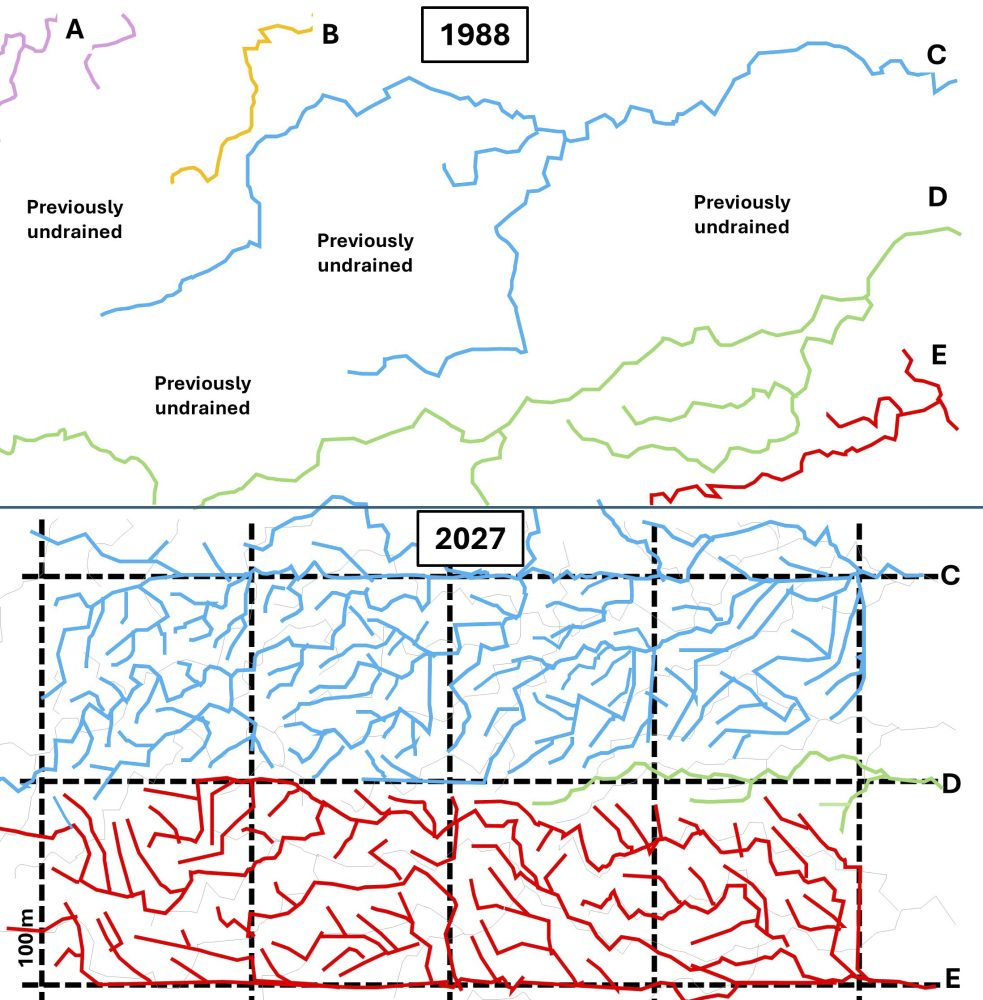
Hydrologic reorganization. The authors carefully tracked the locations of drainage channels within their study area over 20 years. What they found was that previously undrained ground was now draining, because of ice wedge melt. The melting wedges caused surface depressions that filled with water, those water bodies were perched on a slope, when they became deep enough they began to connect with each other, as they connected they began to flow, and as the began to flow they intersected existing drainage channels, as new wedges melted or melted deeper these channels change their upstream watershed areas or their outlet locations. In the illustration above, one can immediately see how dramatically the stream networks have grown and evolved in only 20 years after being essentially unchanged for centuries. (This figure was adapted from the original in the paper).
Vegetative Transformations
- Ice wedge thaw affects vegetation and ecosystems anywhere it occurs.
- “Vegetation structure and composition were completely transformed over the degradation sequence”, with significant increases in sedges, large increases in aquatic forbs, and decreasing tussock tundra largely due to water depth and date of melt initiation.
- In the transition to initial degradation, typically 11 plant species were lost and 11 different species gained, by the loss of shrubs and lichens and gain of sedges and aquatic mosses.
- By the advanced degradation stage, “there was nearly a total transformation of species composition”.
- “We expect that it will take millennia for composition to recover to that of tussock tundra, because tussock tundra is a very late-successional ecosystem”.
- Recent changes in NDVI from ‘greening’ to ‘browning’ across Arctic Alaska may be caused by the initial ice wedge degradation stage (increased greening) to the advanced stage of increased water body growth (browning).
- The ~8% areal loss of tussock tundra and moist sedge shrub tundra due to these processes from 1988-2018 “represents a large loss of critical habitat within the core calving area of the Porcupine Caribou Herd”, as these Eriophorum blooms in spring are sought out in calving season due to their high nutrition.
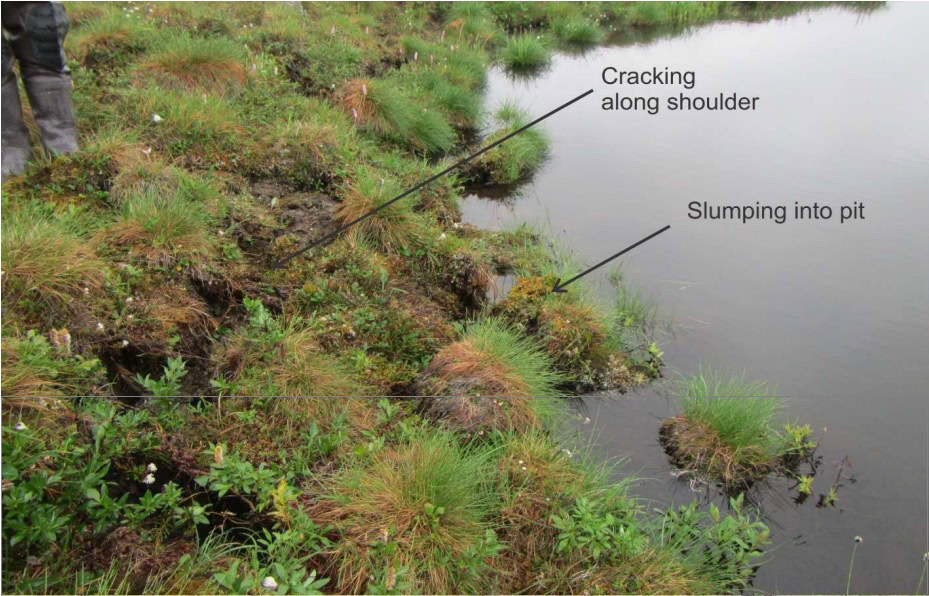
Vegetative transformations. As ice wedges thaw, the surface depression they form fills with water and begins expanding because water accelerates continued melt. As this expansion continues, the surrounding ground sloughs into the depression, transforming the ecology (from Jorgenson et al, 2022).
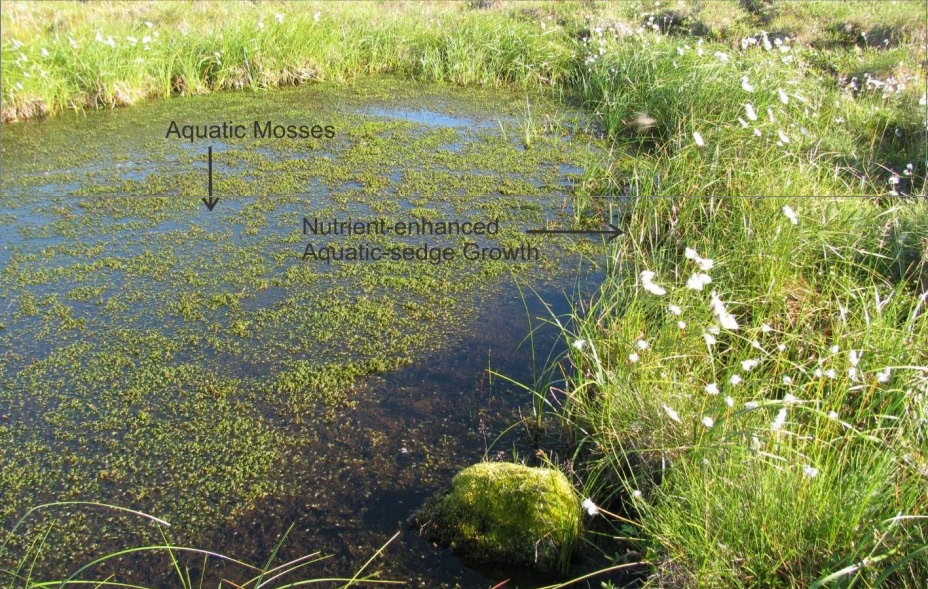
Vegetative transformations. The water filled pits change both the plant ecology that existed before the pit formed and the plant ecology surrounding it (from Jorgenson et al 2022).
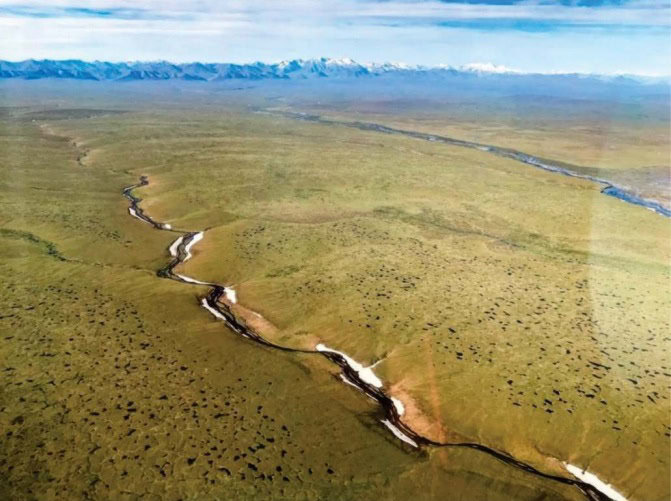
Vegetative transformations. While this transformation of plant ecology may seem insignificant on the scale of a single ice-wedge puddle, consider that the entire landscape is underlain by such degrading ice wedges, as seen in this air photo of the 1002 Area I took in 2020. At this scale, about 8% of primary plant forage species for the Porcupine Caribou Herd has been lost for millennia and likely permanently. Imagine if these puddles, all perched above one another on a slope, are linked together by a grid of ruts left by seismic vehicles — the massive change in surface hydrology would accelerate the transformation in plant ecology already occurring.
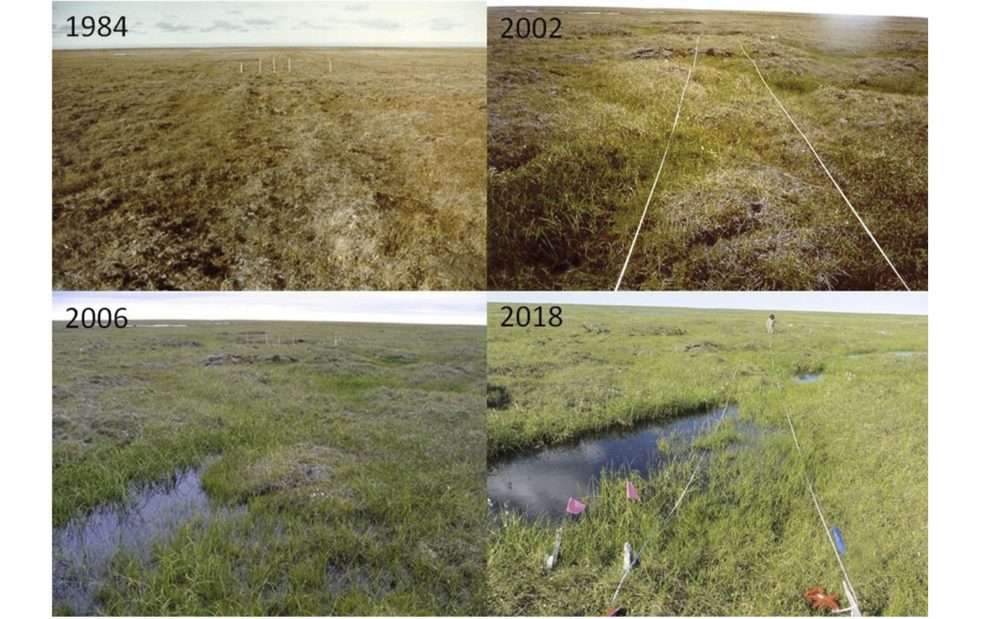
Vegetative transformations. These photos track the degradation that resulted from seismic operations in 1984 within the Arctic Refuge — a different driver than warming, but a similar dynamic result. Note the progression from dry ground to large puddles due to the disturbance. The main point is that when depressions form above melting ice wedges (or tire tracks), the vegetation there changes from terrestrial species that thrive in dry ground to aquatic or semi-aquatic species that thrive in wet or moist ground. Further, the initial depressions cause the sides of the depression to fall into it, widening the resulting puddle and destroying dry-ground habitat. When the puddle links to others and drains, the newly drained ground undergoes further ecological transformation. The authors describe a cycle of degradation and stabilization that may start and stop based on a variety of factors, but that continued warming tends towards creating new destablization trends (USFWS file photos, not Jorgenson et al 2022).
3. Conceptual sensitivity model of perched water bodies applicable throughout the 1002 Area
The 1002 Area is unique for its latitude in Arctic Alaska in terms of its sensitivity to disturbance and its ongoing rapid transformation into new hydrologic regimes because these changes are occurring on slopes which are not found this close to the coast elsewhere. These slopes cause each flooded ice wedge cavity to be perched above one another, creating a hydrologic sensitivity to disturbance that requires different types of protection than required in flatter terrain. That is, the huge number of large lakes that characterize the coastal plains to the west (eg. NPR-A) have no where to go because they are mostly already at the same elevations — for water to move, there needs to be sufficient slope to drive that water over the landscape by gravity and this does not exist there. But such slopes do exist here.
Here I abstract those dynamics to add context to the companion blogs on observations and recommendations.
Dynamics of connectivity of perched water bodies
- The creation and re-arrangement of the hydrological pathways of these perched water bodies requires three things:
- That water bodies exist
- That they exist on a slope (they are perched with somewhere to go)
- That new connections between them are only just forming (else they would already be draining and not perched)
- The 1002 Area is unique in Arctic Alaska at these latitudes such that the first two conditions exist in abundance: there is a lot of isolated, perched water in the form of puddles over recently-thawed ice wedges and it exists on slopes primed for increased connectivity, unlike elsewhere at these latitudes; thus it is perched twice – once because the frozen ground prevents vertical infiltration and twice because these puddles exist in stair-steps above one another. For example, in the oil fields to the west there are plenty of water bodies perched above the permafrost but the topographic gradients between them are tiny, so new connections between them stay local and do not lead to large-scale hydrologic reorganizations of the region – it is the stair-stepping that creates the increased sensitivity in the 1002 Area.
- The drainage networks of this foothill region are immature because the ground has been frozen and therefore resistant to erosion, so water largely follows pathways created by melt. The dominant hydrologic event of the year is spring snow melt when the ground is the most frozen so it runs off or gets trapped topographically. The tundra vegetation and ice wedge channels intercept and impede flow of most of the rainfall in many thousands of small puddles and lakes, perched one above the other mostly without efficiently connecting into vigorous streams. At least until recently.
- Especially relevant here is that any topographic depression (such as ice melt or vehicle rutting) not only leads to ponding but also increases the local topographic gradient (the slope) between the rut and undisturbed ground, facilitating ease of connection and increasing the vigor of flow. For example, when rivers or coasts erode land, they give previously perched water bodies (formerly further inland) a new place to flow due to a steeper gradient to follow (the eroded margin).
- The slopes found here are such that the melt of ice wedges of 30-80 cm, as is common now, provide the connections between these perched water bodies, though the chaotic, low-flow connection network is evolving rapidly as each ice wedge cavity goes through repeated degradation/stabilization cycles.
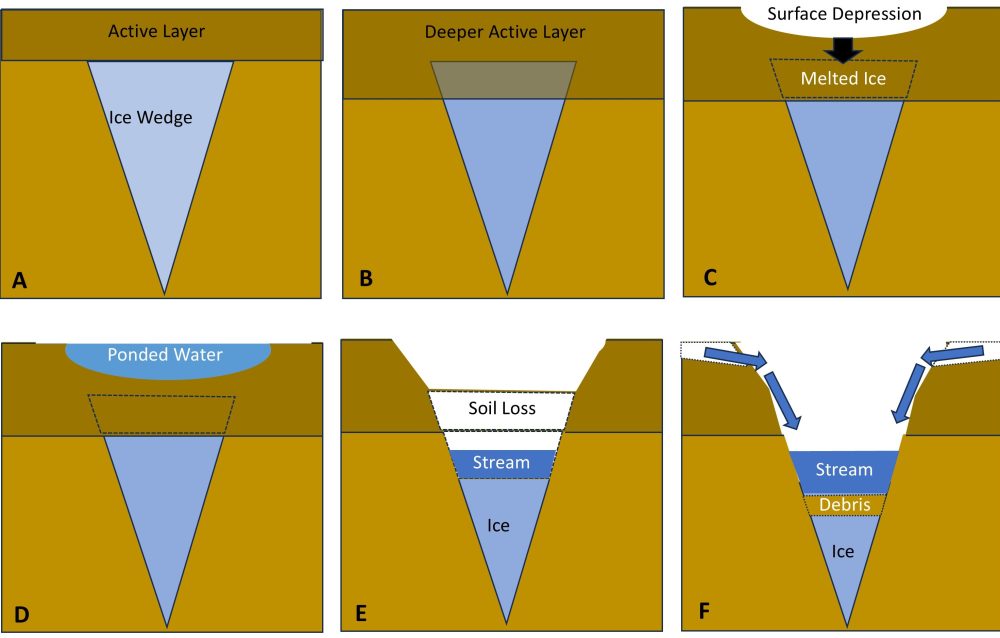
Dynamics of thawing ice wedges. Here I’ve crudely sketched the (over simplified) conceptual evolution of ice wedge degradation leading to hydrological change on sloping terrain. A) Ice wedges are initially covered by some amount of soil and vegetation because any ice higher than this would melt because of the seasonally-thawed active layer — that is, in summer this layer heats up above freezing so it melts ice there. B) A change in climate leads to a deeper active layer which causes the top of the ice wedge to melt (C), which in turns causes the surface to slump into the cavity left behind. D) This depression fills with water from snow melt or rain or the melted ice. E) On sloping terrain, when enough such puddles connect to each other, water begins to flow. If it flows enough or long enough, it can wash away the protective soil layer, putting the stream in direct contact with the ice, creating thermal erosion which rapidly melts the ice deeper. F) If debris like clods of soil or vegetation get washed into the cavity from above or upstream, the ice below can be protected from further erosion for a while, or the wedge can be melted completely. In the meantime, the cavity has become so deep that it begins to attract water from its surroundings due to the surface slope caused by the collapse of the upper rim, creating a positive feedback which attracts even more water from the surroundings, deepening and widening the channel further.
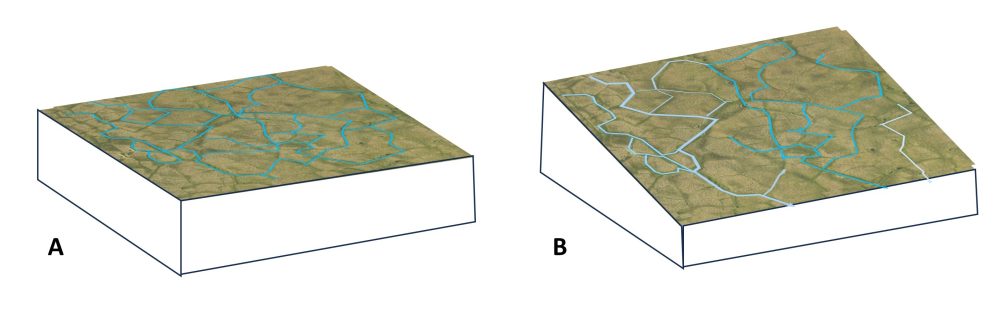
Dynamics of thawing ice wedges. Schematic showing why slope matters. A) When ice wedges degrade on flat ground, the puddles filling the depressions may link up but there is not enough slope to drive flow in any particular direction, so any changes stay localized. B) When ice wedges degrade on sloping ground, once the puddles link up they start to flow downhill, in a self-reinforcing process in which watershed areas are formed, stolen, and stolen back as wedges deepen or get clogged with widespread draining and filling, rapidly transforming large areas ecologically. This is the reason why seismic operations on sloping terrain require different protocols — the risk of widespread harm is much larger because harm is not localized: on sloping terrain the water has somewhere to go and changes in surface hydrology always lead to changes in plant ecology.
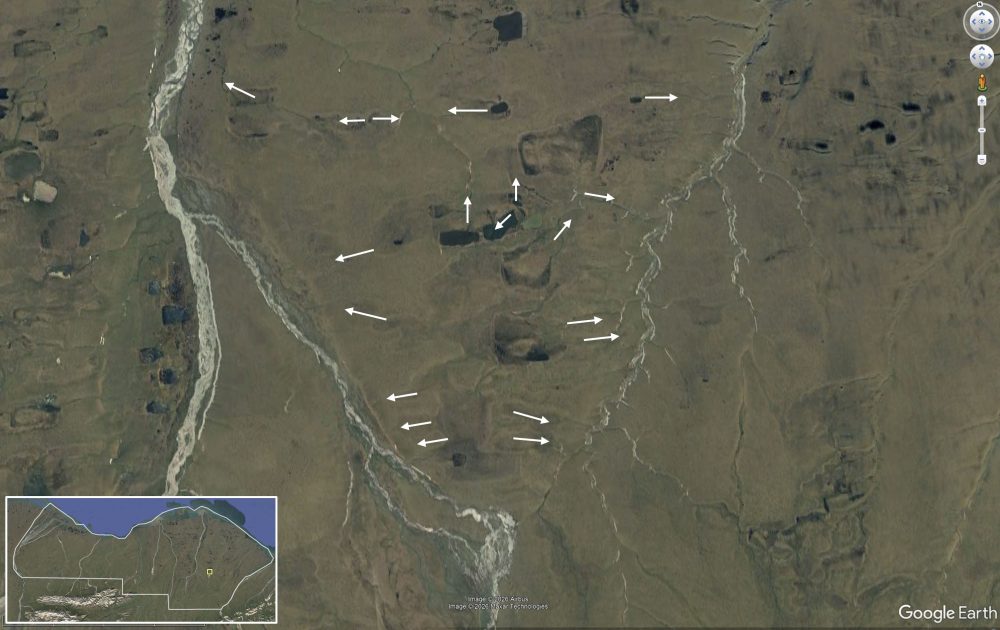
Perched waterbodies in the 1002 Area. Here ancient drained lake basins stranded on a hill between the Jago and Niguanak Rivers can be seen actively draining in different directions off that hillside with the gradients causing those drainages influenced by active erosion of those rivers into what is now a hill. That is, these lakes may have formed in what was a coastal plain when lower millennia ago, but this region’s permafrost dynamics, hydrological stability, and ecological response to change are now dominated by hillslope processes not coastal plain processes. That is, these ancient lakes had a place to drain, so they did.
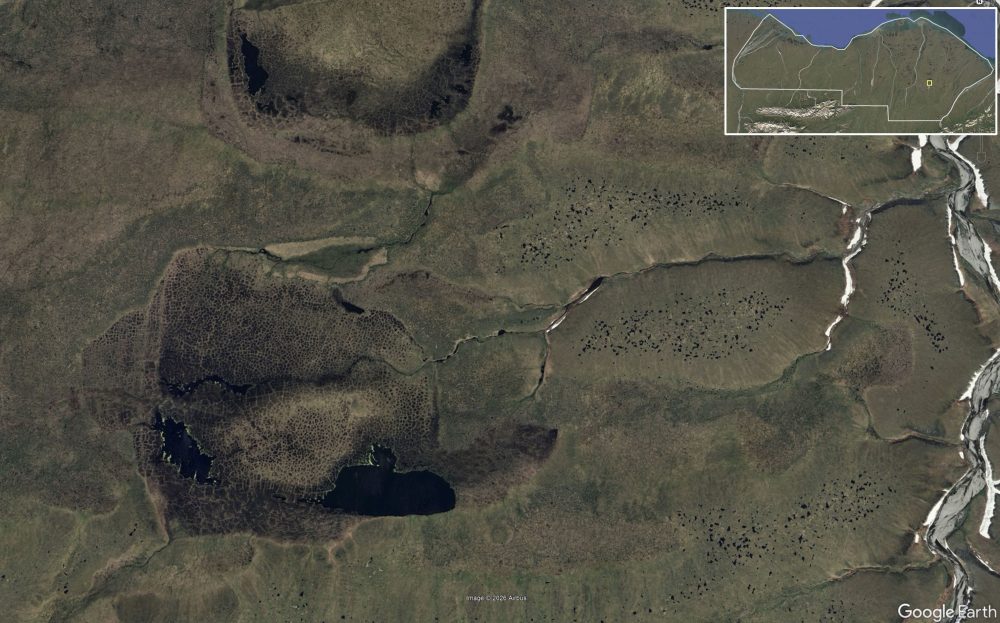
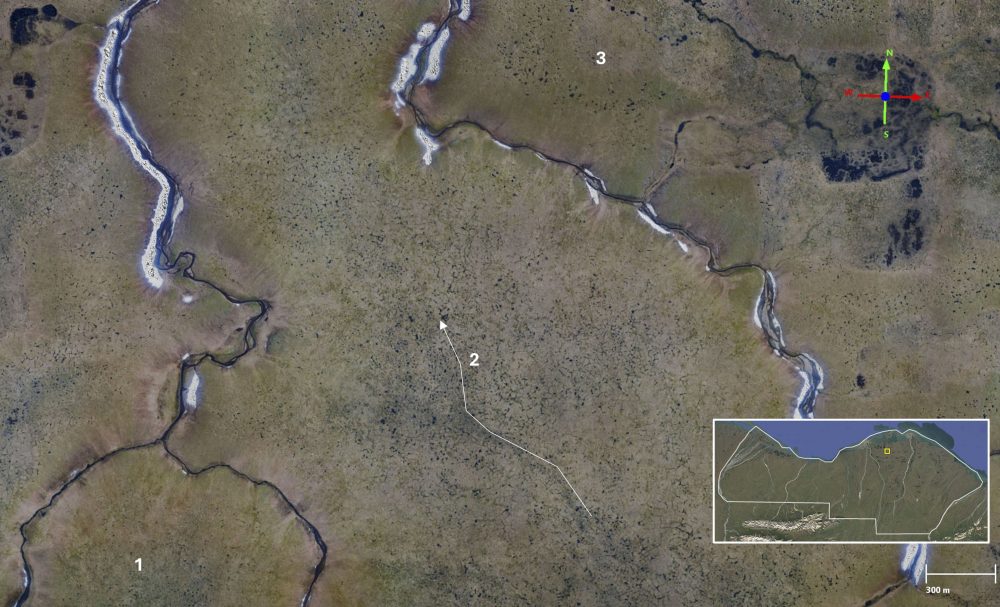
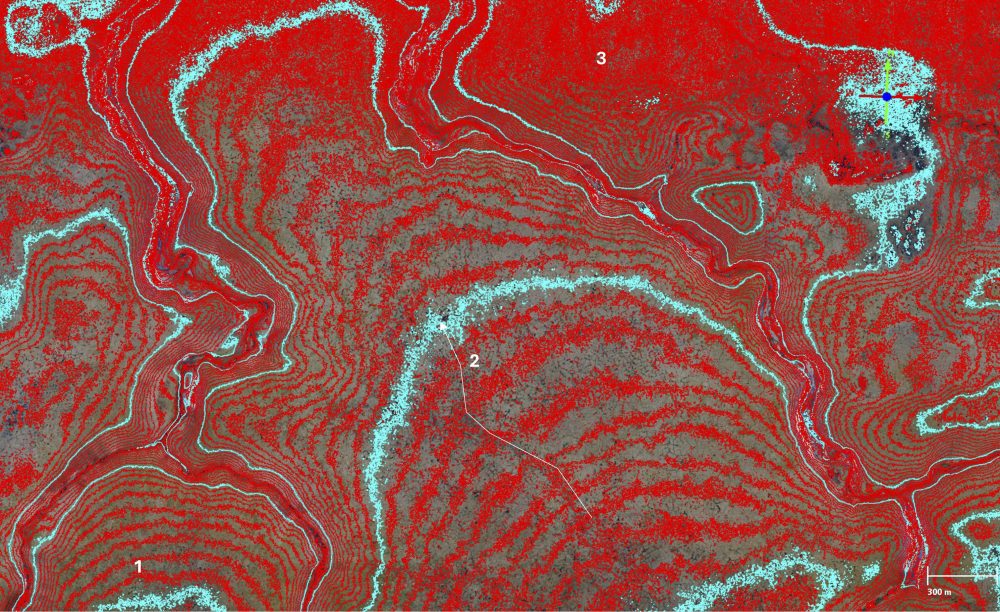
Perched waterbodies in the 1002 Area. Here is a close-up detail of ancient lakes on that same hill as the previous figure, detailing at a glance both the hilly, non-plain nature of the topography and advanced degradation of ice wedges here as indicated by the numerous puddles (large black dots and even smaller black dots). These puddles are new perched water bodies seeking a way to lower elevations, just like the large lakes before they drained. When these large lakes drain, a huge ecological transformation takes place — lakes where ducks and geese lived turns into semi-aquatic habitat where vegetation grows that terrestrial animals can eat. The same thing happens on the small scale — tops of ice wedges covered tussock trundra that caribou ate turns into semi-aquatic vegetation that they don’t like as much. The streams still draining this old lake basin are deeply incised into these hills, driving new, ongoing hydrologic connectivity of these hillsides covered by puddles. That is, as these water-filled ice wedge depressions increase and expand due to climate warming, they create new watershed area for the established streams to connect to and drain. At a glance within this ~5 km wide image, we can see distinct ecology zones (eg, aquatic, semi-aquatic, wetlands, uplands, river channels, etc.) each with their own vulnerabilities to disturbance, meaning for maps to sufficiently characterize vulnerability for seismic operations must have resolution on the scale of ice wedges. At all stages of this process, the plant ecology responds by adapting to wetter or drier conditions, with species favored by caribou taking millennia to return once eliminated.
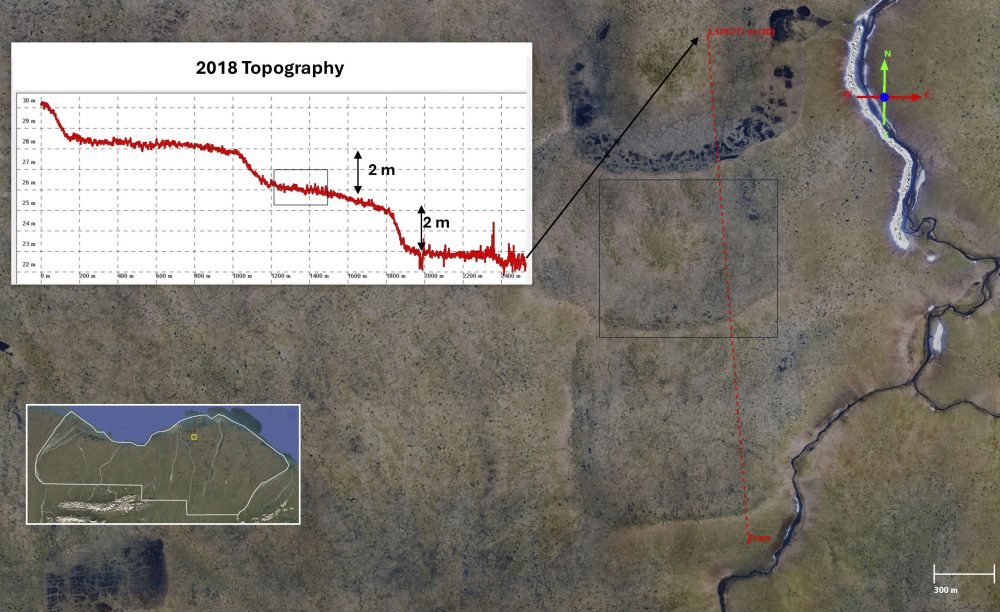
Perched waterbodies in the 1002 Area. These three ancient lake beds (under the red transect line and in the elevation profile in upper left) are an example of large-scale perching of water bodies. Likely these lakes drained one into the other, with the last (furthest north) not fully drained around its margins as new hydrologic connections are formed around the ground raised near its center. These lake beds were only about 2 m above each other (that is, there were only a few meters deep when full), over distances of over 2 km, as seen in the elevation profile. These lakes likely drained many centuries ago, allowing enough time for tussock tundra to form in their drained basins. However, this terrain is now going through another change, this time more rapid and occurring over only a few decades — everywhere we look it is covered with ice wedges that are now topped by liquid water (black dots), a process which tends to eliminate the foods caribou prefer. The pervasiveness of perched small-scale water bodies throughout this entire region increases the terrain’s sensitivity to further disturbance, due to either to continued warming or seismic operations. In terms of this terrain sensitivity, these water bodies are beginning to connect more rapidly than they have in the past few centuries and they are transforming the ecology of the landscape as they do. Black box in profile and image is highlighted in the next figure.
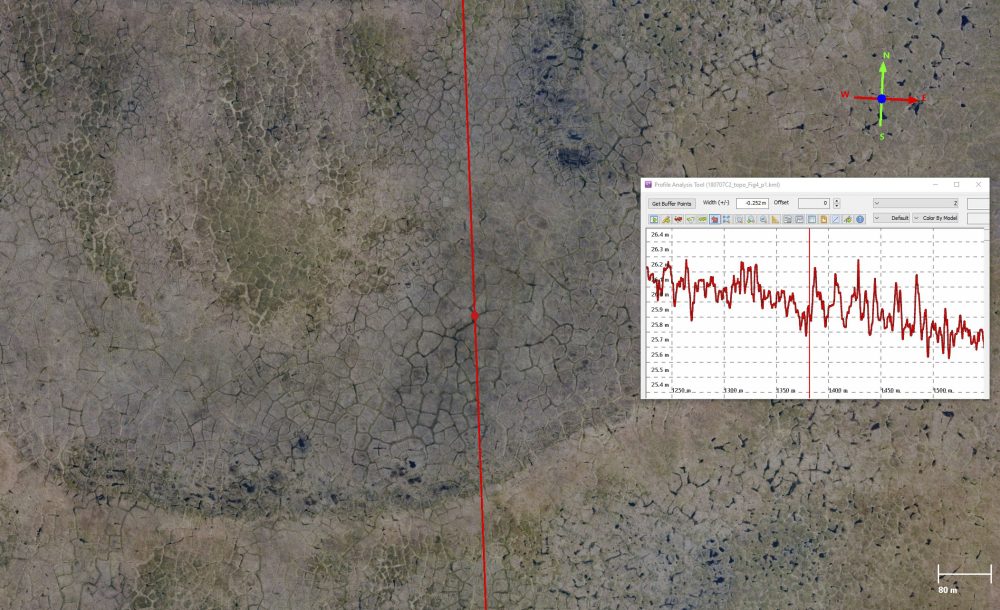
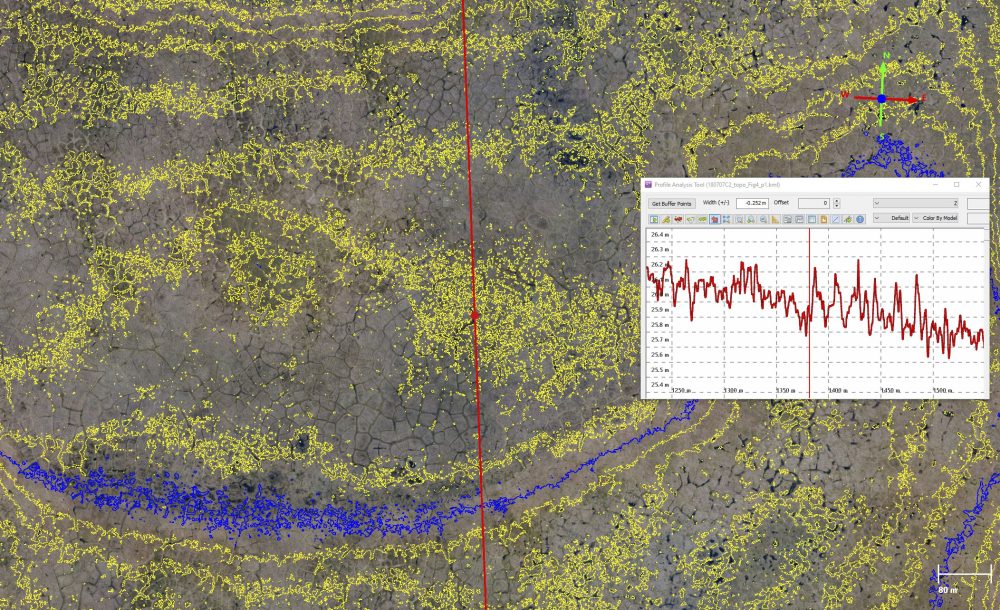
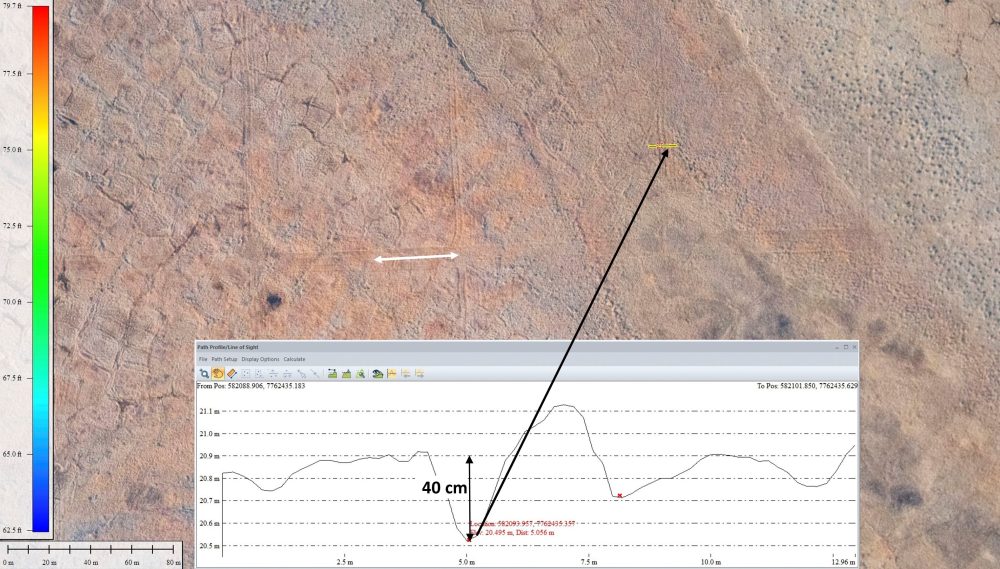
Perched waterbodies in the 1002 Area. Here is the same transect as the previous figure, zoomed in to detail over the black box in previous figure. Note the 10-30 cm peaks and valleys in the red profile – each of these slows or blocks water flow, perching small ice wedge puddles above one another and preventing overall drainage. At right, contour lines (yellow and blue) are spaced 50 cm apart to indicate how dispersed those contours are due to ice wedge topography, unlike most topographic maps were contours are smooth lines. If you look closely, you can see the reason is that the contours follow the shape of the polygons because the polygons are ringed by depressions caused by thawing ice wedges. That is, the surface topography is not dominated by the surface of the polygonal terrain (which would yield single, sharp contour lines) but the depressions caused by ice wedge melt surrounding them (this is why the contour lines are so fuzzy and wide). This is the nature of perched water bodies in the 1002 Area: ice wedge melt of 50 cm here can link terrain a hundred meters away hydrologically, but in an inefficient, chaotic, and essentially unpredictable way due to the polygonal nature of the melt pathways. A seismic vehicle leaving 10-50 cm ruts along the red line or any other line would create a much more efficient hydrologic pathway that would link the ice wedge water bodies in this area, draining them and accelerating the ecological transformation.
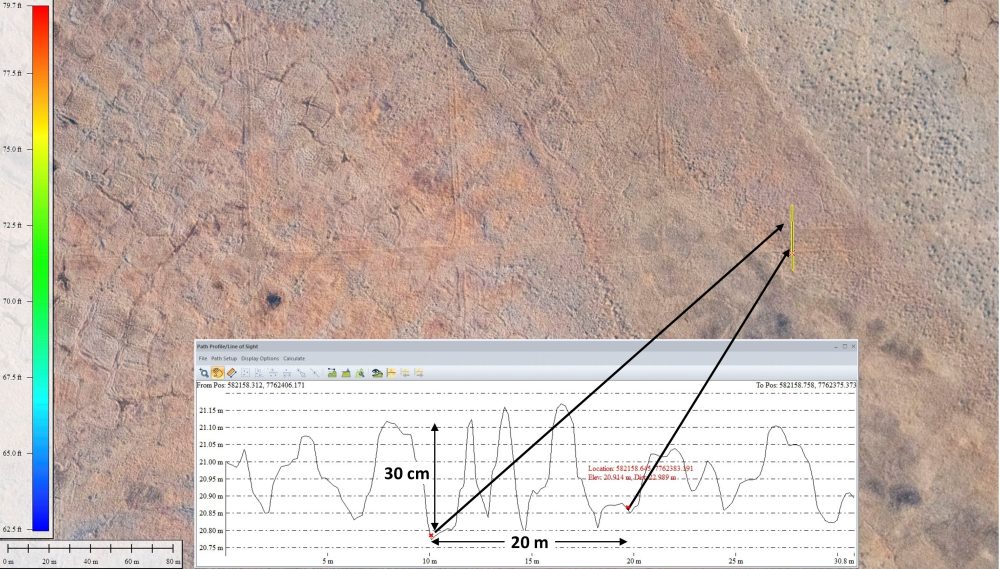
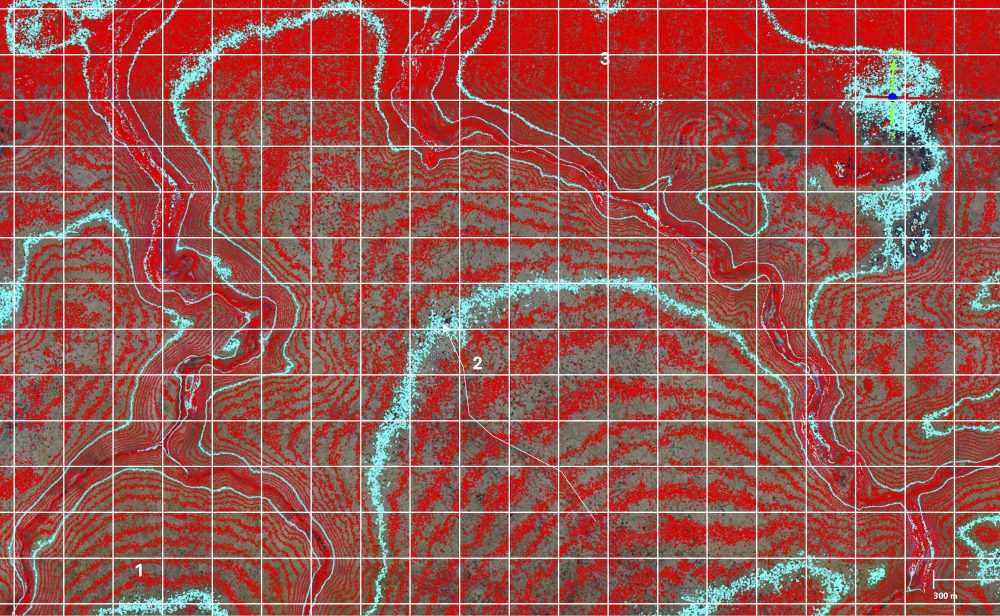
Perched waterbodies in the 1002 Area. Here streams intersect several hills which are in various stages of ice wedge degradation. In the left image, we can see Hill 1 has few visible ice wedge puddles, Hill 2 is covered by them, and Hill 3 is ringed by them. Overall flow is to the north, with about a 20 m gradient north-south. There is some evidence of flow along the thin white line in Hill 2, but most of the puddles in these degrading polygons seem to still be perched for now. On the right image, red contours are calculated every 50 cm, colored blue every 5 m. The contours are highly dispersed (not single, sharp lines) and nearly overlapping on Hill 2, especially where the flow path is evident. On the flatter Hill 3, the contours overlap strongly. At these locations, when the perched water bodies begin linking up, their flow paths will be chaotic, unpredictable, and reorganizing regularly as new wedges melt and tip flow in new directions, competing for upstream watershed areas. Any disturbance that leads these variations to connect to an established stream will cause a rapid transformation of not only hydrology but ecology. That is, once an incised stream forms, it will self-deepen through thermal erosion and that increased topographic gradient will attract neighboring channels to flow into, a cascading process reorganizing all local hydrology.
Ecological reorganization caused by hydrological reorganization
- As standing water forms on the top of ice wedge polygons, it begins to support aquatic or semi-aquatic vegetation that did not exist there previously
- As this standing water links between other perched water bodies, the resulting drainage supports a change in vegetation within the polygonal tundra between the water bodies.
- Flow through these new connections can erode the polygon tundra in part or completely, creating a small pond or beaded stream, changing the location from a terrestrial to aquatic ecology.
- Entire lakes many hectares in size can drain or fill in this fashion, turning aquatic habitats into terrestrial or semi-aquatic habitats or vice versa, a process that has been ongoing for millennia but is now primed for doing so rapidly by the increasing sensitivity of the permafrost to disturbance due to climate warming.
- Any change in hydrology causes a corresponding change in plant ecology, with previously undrained terrain becoming drainable causes the biggest changes to caribou ecology (the loss of tussock tundra).
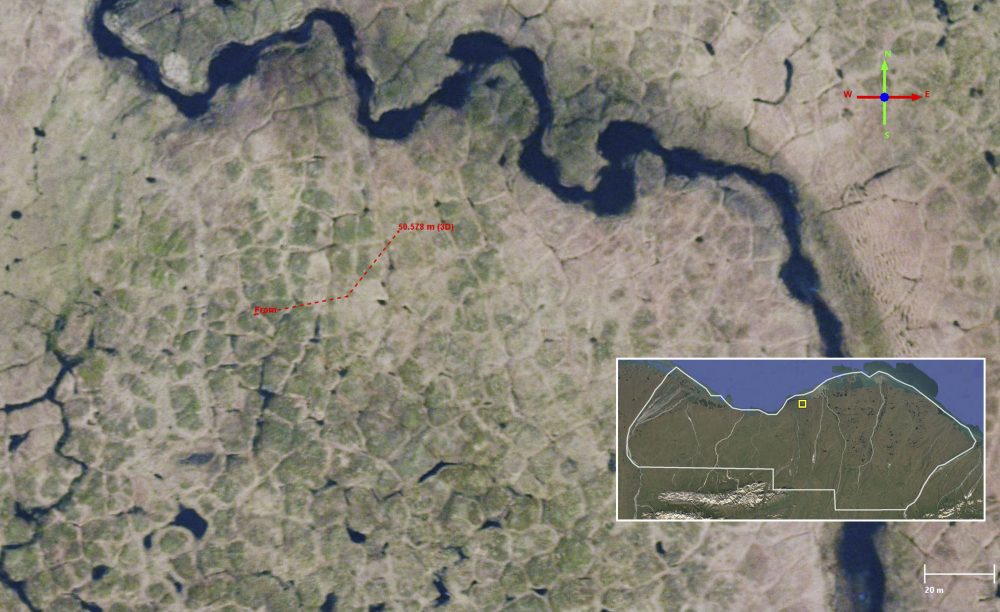
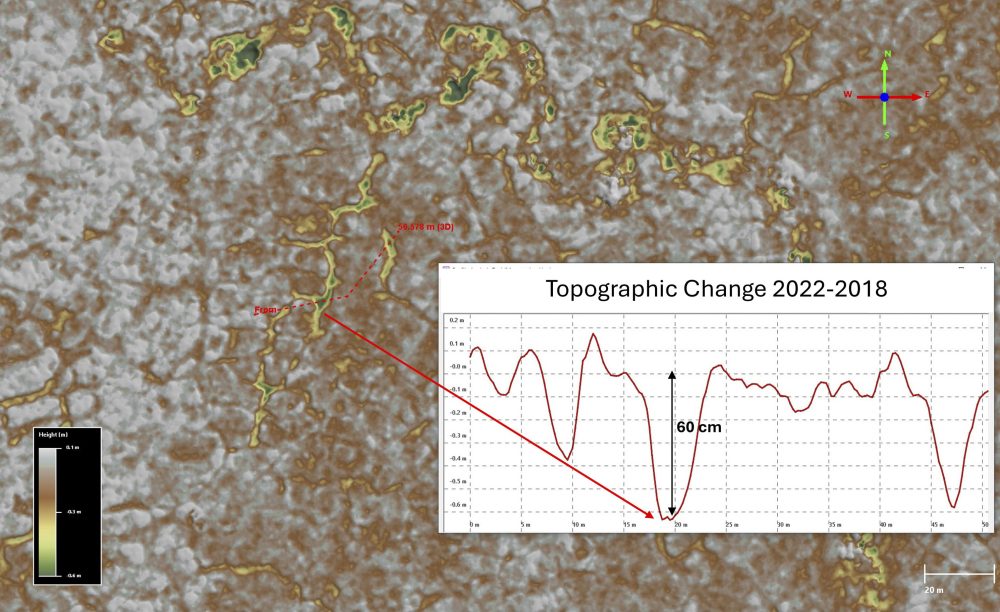
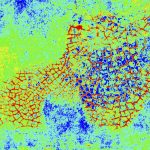
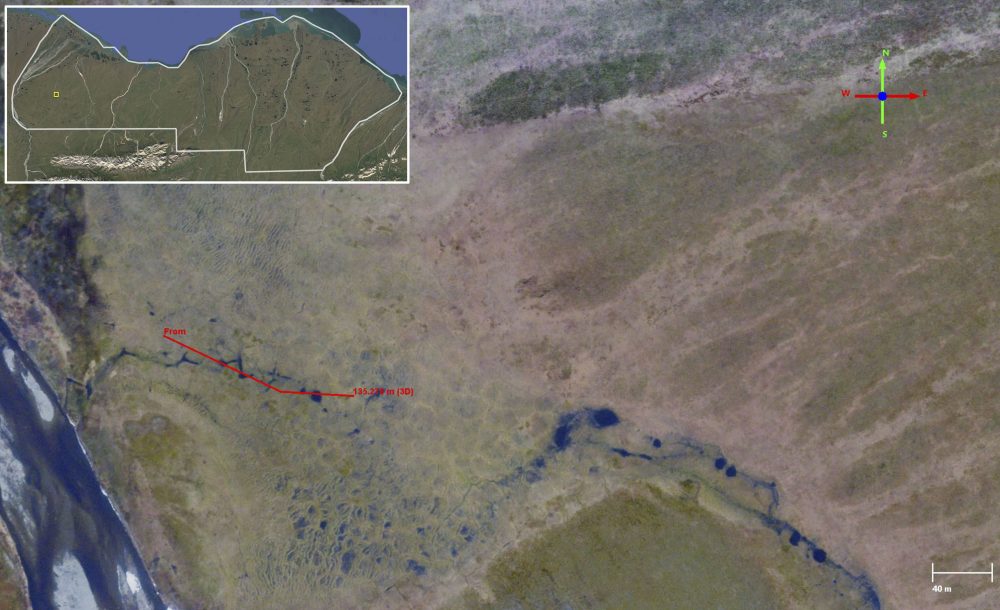
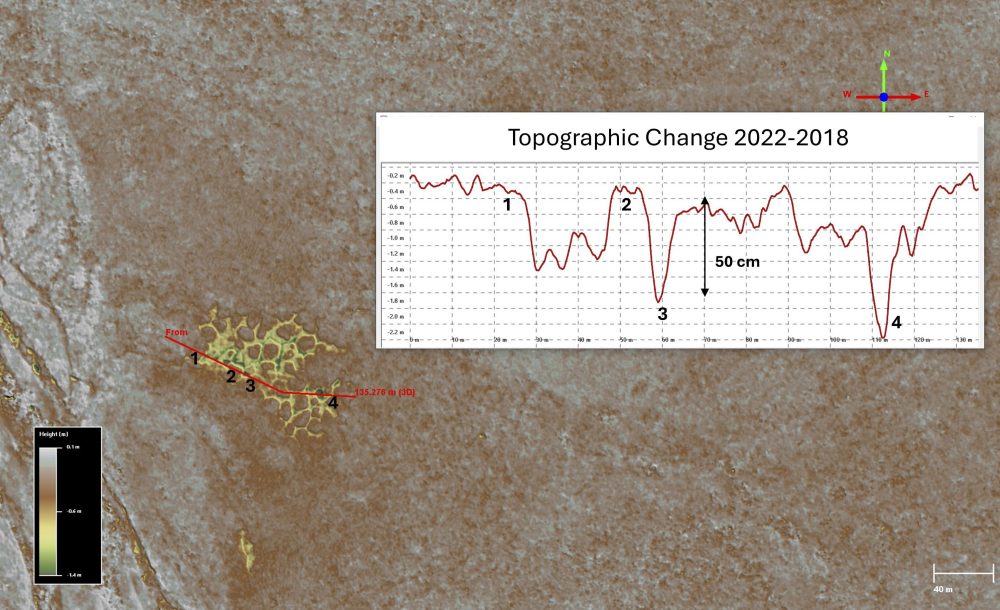
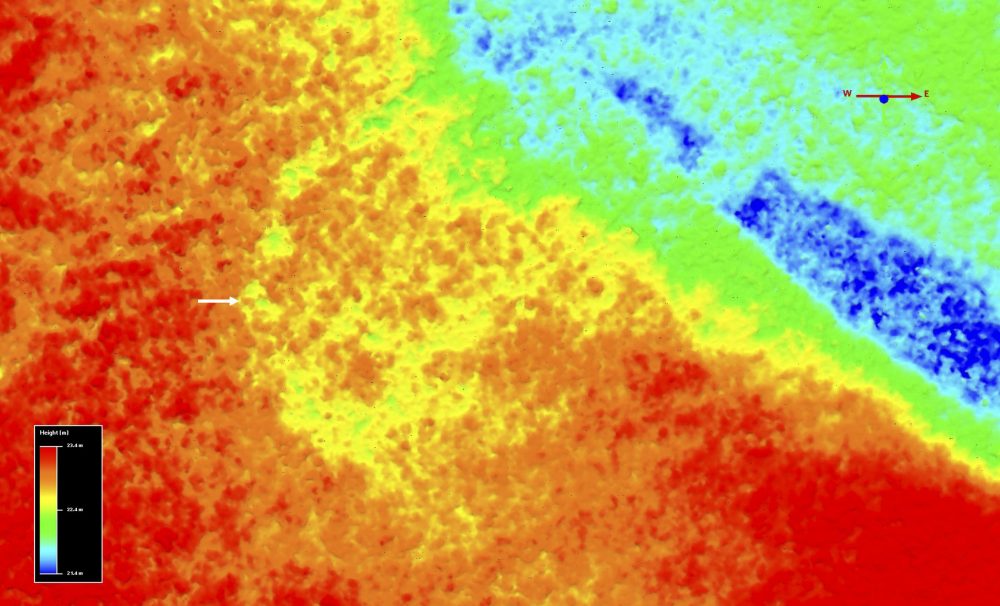
Hydrologic change transforms ecology. The ice wedges underlying most of the 1002 Area are thawing and creating surface depressions that are filling with water which, because the terrain is on a slope, link together to form streams. This process is occurring rapidly due to only to climate warming — here we see these topographic changes after only 4 years (2018-2022). The topographic map and associated image I acquired in 2018 (at left) shows the ground near the stream as dry and undrained. By subtracting topography measured in 2022 from topography from 2018, we can measure topographic change, as seen on the right colored by magnitude (see color bar at lower left and scale bar at lower right). By 2022, ice wedge melt (yellow and green at right) had occurred, draining that area. The red transect shows this melt as being 30-60 cm deep. Many more examples with more complete explanations are giving the next blog in this series and in the report they were derived from.
Hydrologic change transforms ecology. Shown here is another example of how ice wedge melt on a slope is different than ice wedge melt on flat ground. In 2018, water (black color, chaotically following ice wedges) is seen draining over the surface from right to left into a river (red transect). Four years later, in 2022, this water eroded the protective dirt off the top of the wedges, causing not only a meter of melt within the wedge but the complete mechanical erosion of entire polygon centers. This represents not only a change in hydrology, but a rapid transformation of ecology here that preferentially impacts the forage species that calving caribou prefer.
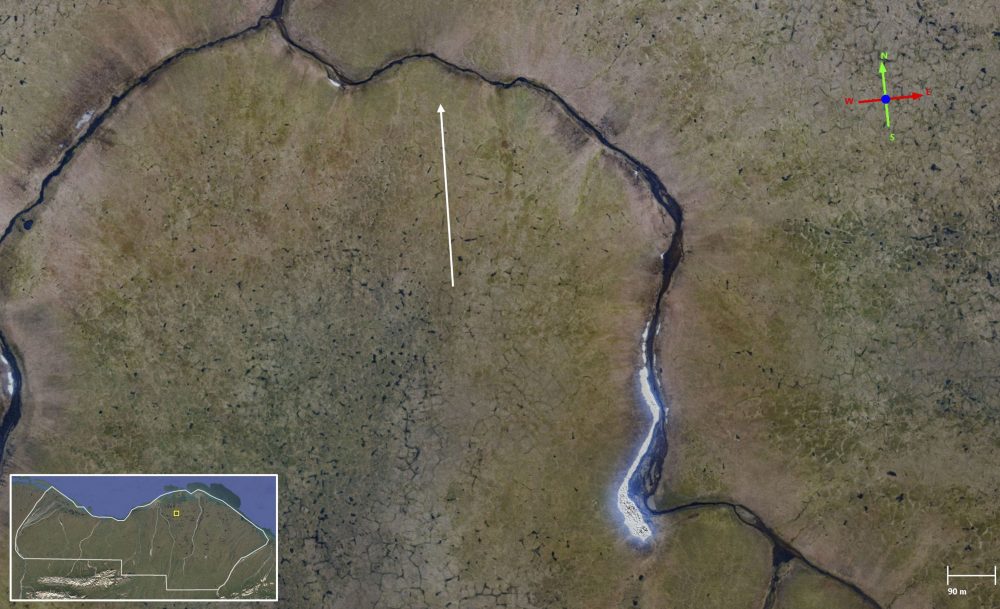
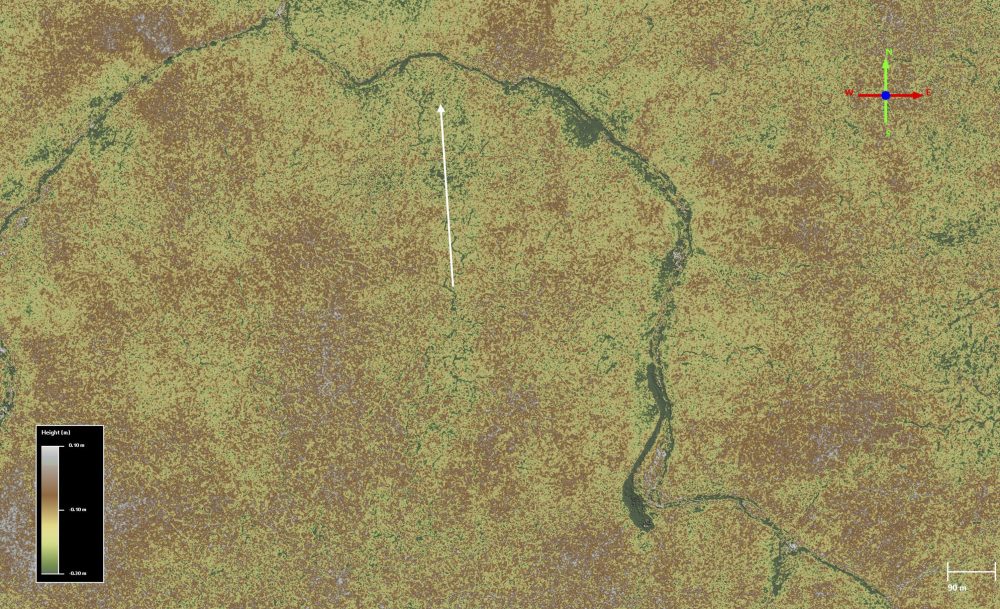
Hydrologic change transforms ecology.The hillslope processes seen in the previous examples are occurring at scale, as seen in this example. In 2018, my imagery shows that water-filled pits have formed all over this terrain. By 2022 (right), ice wedge melt had caused surface depressions of many tens of centimeters pervasively across this hillside, forming a stream (white line) draining previously-undrained ground. Drainage changes like these transform plant ecology because each species has only a very narrow zone of moisture it can tolerate or thrive in.
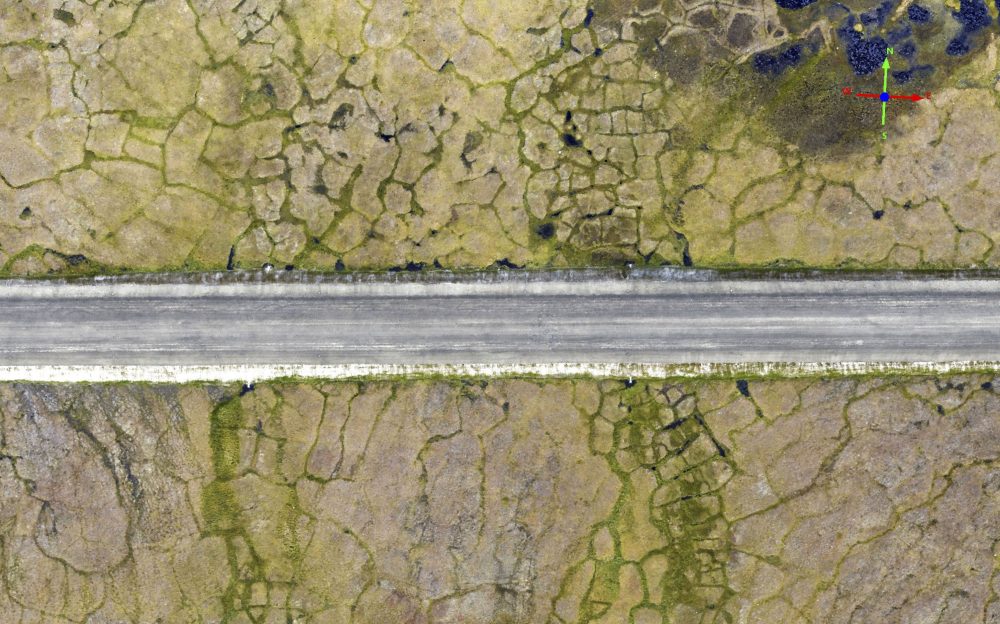
Hydrologic change transforms ecology. Here we see the new runway on Barter Island, at the northern edge of the 1002 Area, has rerouted surface drainage, leading to a change in plant ecology downstream of the culverts (lower) as indicated by the green color within the ice wedge depressions. Note how the hydrology here is dominated by ice wedge depressions not by mechanic erosion as is typical of surface hydrology in non-permafrost regions. The resulting streams are chaotically shaped and change shape not by erosion but by melt of adjacent ice wedges which reroutes flow, as can be seen to have happened here many times.
4. Recent impacts of seismic operations that would be used in the 1002 Area
Oil exploration and development have been occurring on the comparatively flat thaw lake plains to the west for many decades and therefore study of the impacts of recent operations there can give us a starting sense of the impacts that will likely occur within the sloping foothills of the 1002 Area. Though all of the figures in this section detail work outside the boundaries of the Arctic Refuge, each new permitted operation anywhere in Arctic Alaska gives us the opportunity to study the impacts and improve the protection protocols – opportunities that are currently not being taken advantage of. Seismic operations include the creation of snow and ice roads and the measurements themselves. The impacts of these operations can be measured by the photogrammetric technique that I pioneered called fodar, as seen below. Therefore, each new seismic campaign could be used to improve the protocols designed to protect the tundra, hydrology, and ecology of this region by increasing our predictive skills, if the regulations required them, which they don’t. In terms of impacts on caribou, the depth of roads and vehicle ruts shown here are about the same as what climate warming is causing by melting ice wedges, meaning that these roads and ruts could have a larger impact on hydrology, and therefore ecology, due to their pervasiveness and linearity.
Snow and Ice Roads
Snow and ice roads are required for the transportation of people and equipment and man-camps required for seismic operations. These ice roads damage the underlying vegetation for years afterwards, as found in near-infrared imagery which is sensitive to plant health. Snow and ice roads can cause subsidence under their paths of 20-30 cm, lasting years after their routes are abandoned, and some roads have caused permanent scarring through continued thermokarst. Each of these roads has the ability to linearized the hydrology and rapidly transform the ecology on this sloping ground, as described above.
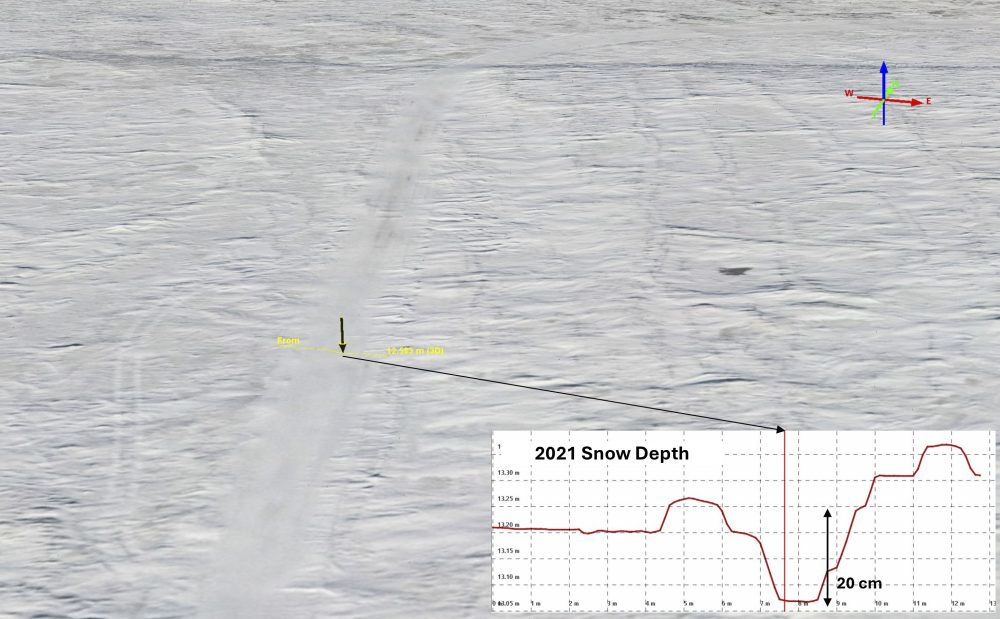
Winter measurements of vehicle travel. Here is a snow road I mapped in 2021 within NPR-A. The yellow profile line corresponding to the plot at right shows the road is depressed by about 20 cm compared to the surroundings. It also demonstrates that we have tools capable of resolving such small changes in topography caused by these roads.
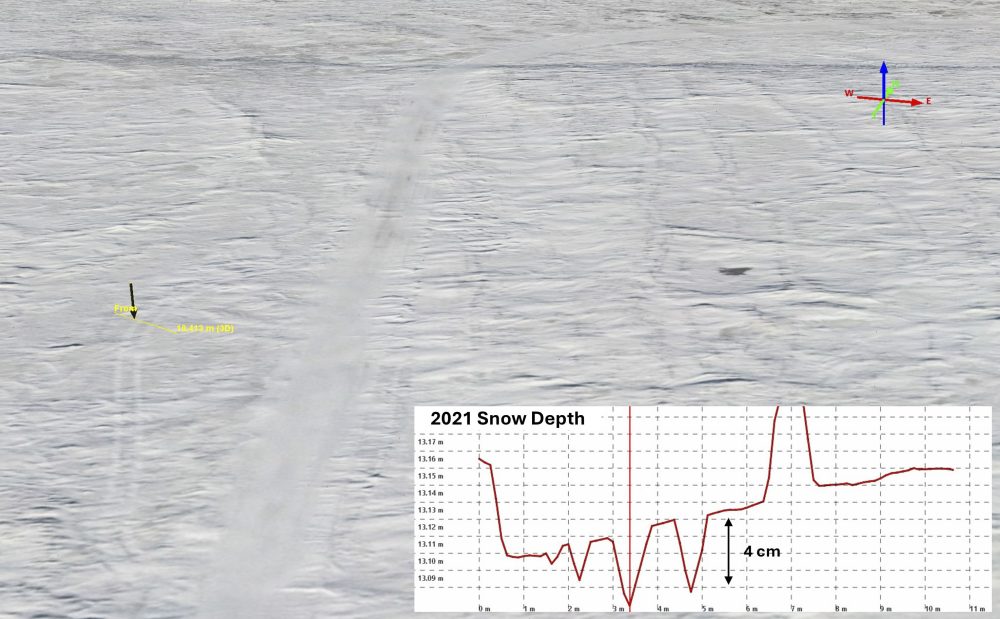
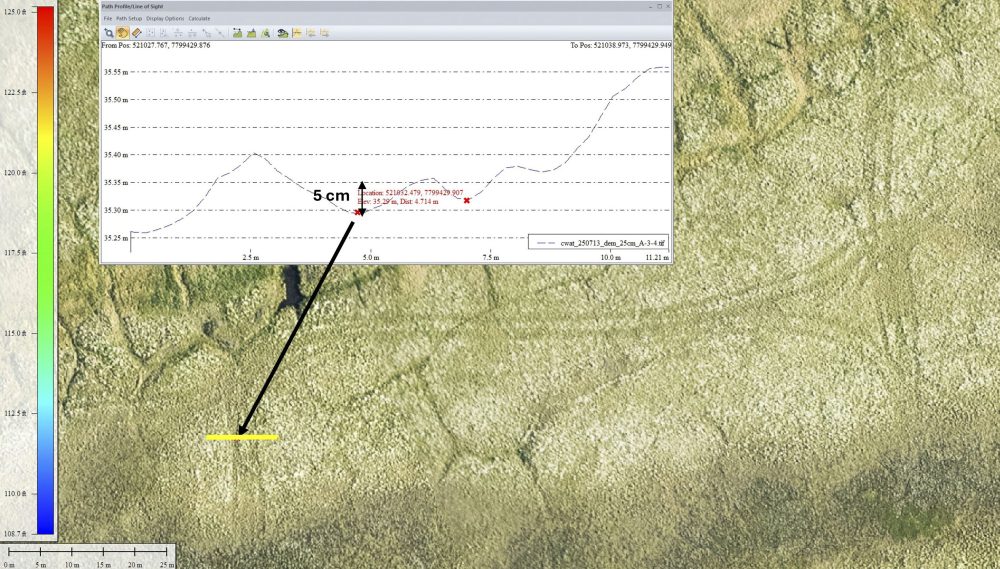
Winter measurements of vehicle travel. Not only can we measure road topography, but vehicle tracks as well. Here, the yellow transects crosses a vehicle excursion from the road that is only a few centimeters deep. Thus, we can therefore measure disturbances of any size so we can later understand their impacts, such that we could improve regulations with each new project, opportunities we are not taking right now.
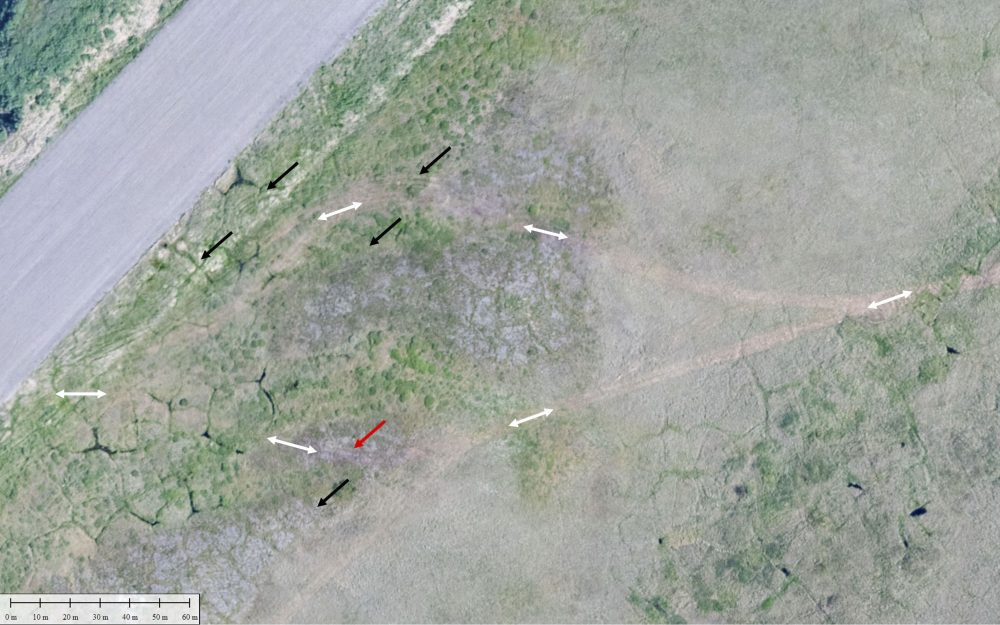
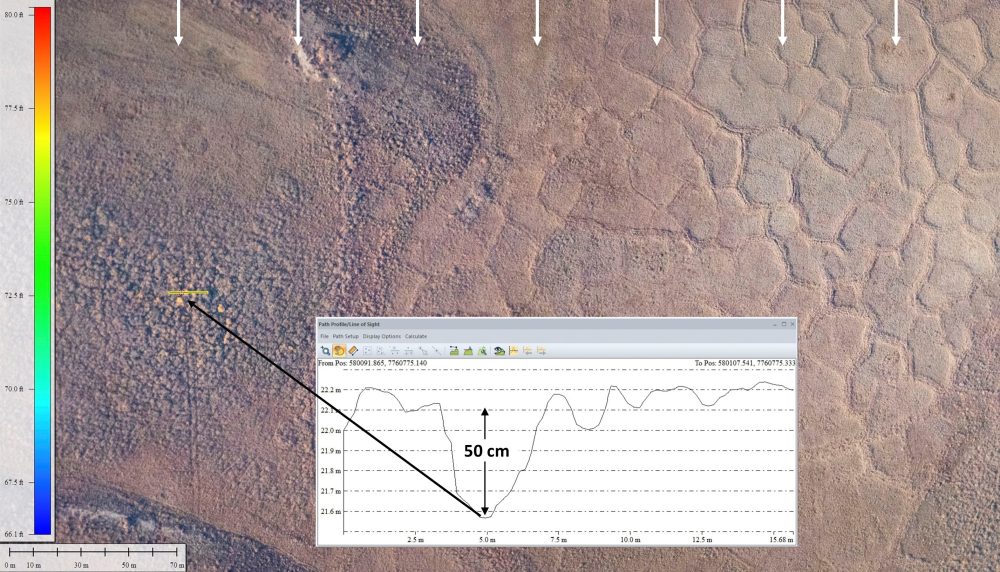
Long-term impacts of snow roads. Here the impacts of temporary snow roads becomes clear. The white arrows indicate the location of the main road in winter (left) leading the Inigok airport which are easily identified in the summer image (right). In summer, the Eriophorum blooms that caribou prefer did not form, causing the vegetation under the snow road to stand out starkly. Even off-road excursions (black arrows) can be tracked and determined to have caused the same sorts of disturbance. These winter data were collected after several storms subsequent to the tracks being made — any travel on snow remains visible until the snow melts because the compressed snow is resistant to wind scour.
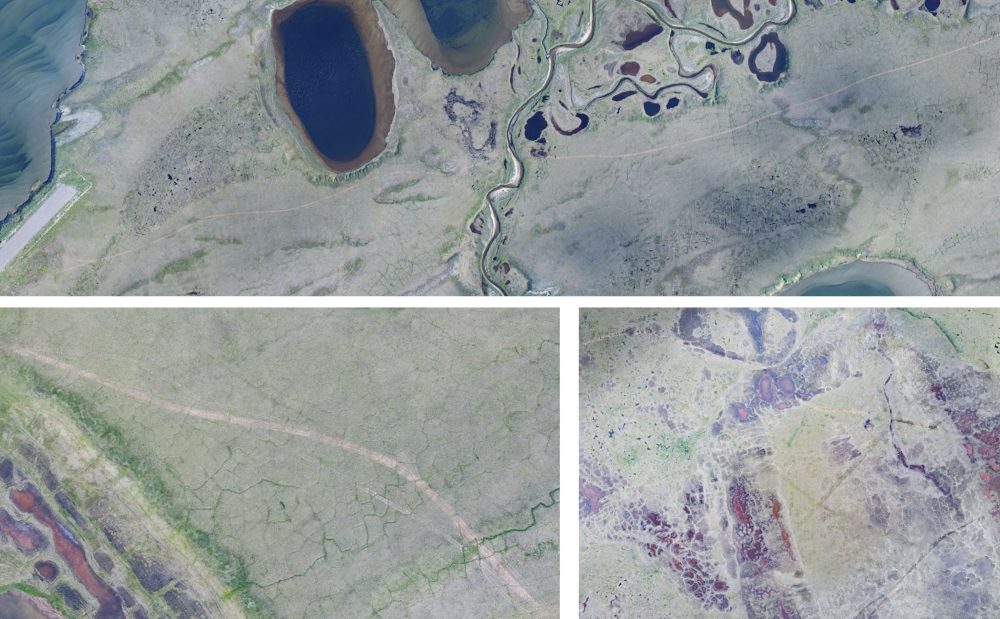
Long-term impacts of snow roads. The snow road from the previous example damaged the underlying vegetation across its entire length, over 50 miles long, seen as a white scar running through these example images from my 2021 fodar in NPR-A.
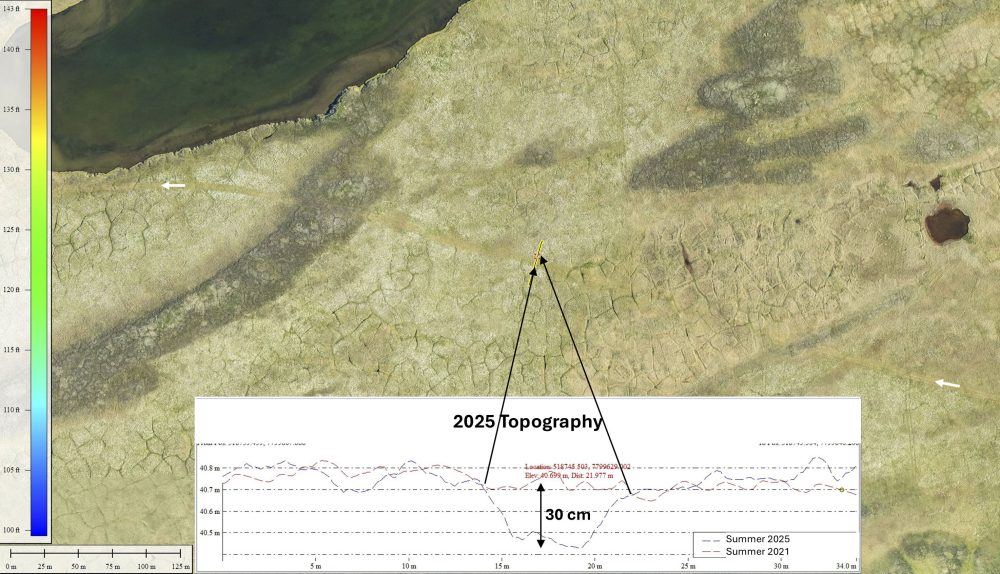
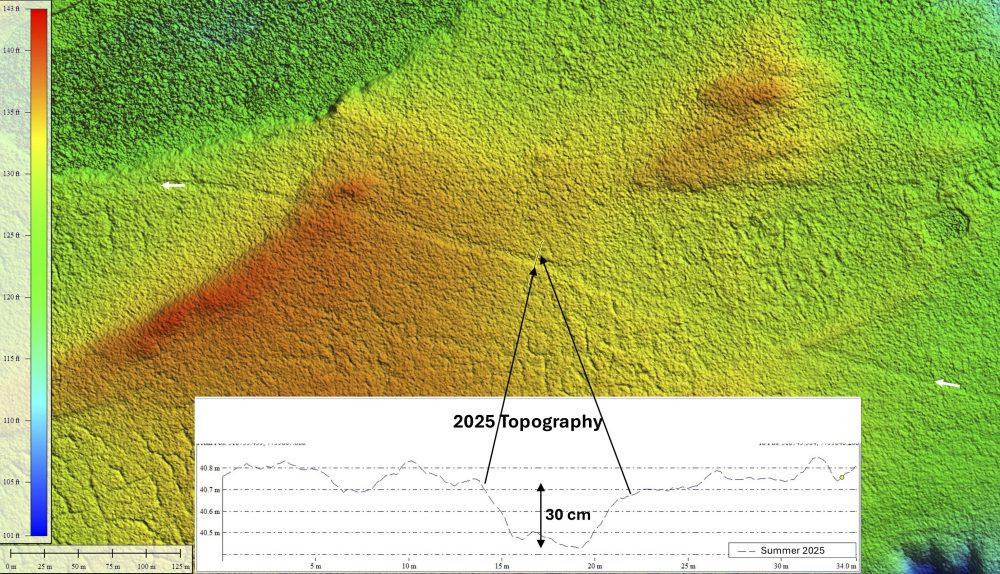
Long-term impacts of snow roads. These roads not only disturb the vegetation, they can leave deep, wide incised ruts in the landscape years after they are abandoned. Here, a comparison of 2025 topography to 2021 topography shows this road left a ~30 cm deep rut that is ~5 m wide. On flat ground like this, the impact may remain local as a big puddle. But on the sloping ground of the 1002 Area, such a rut would lead to the formation of a stream that could turn into a deeply incised river.
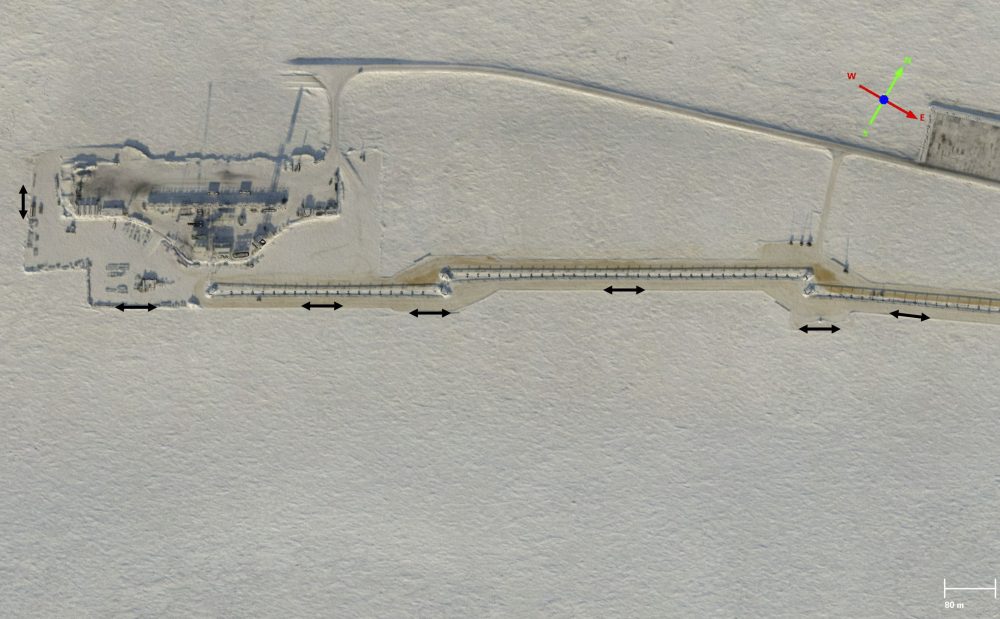
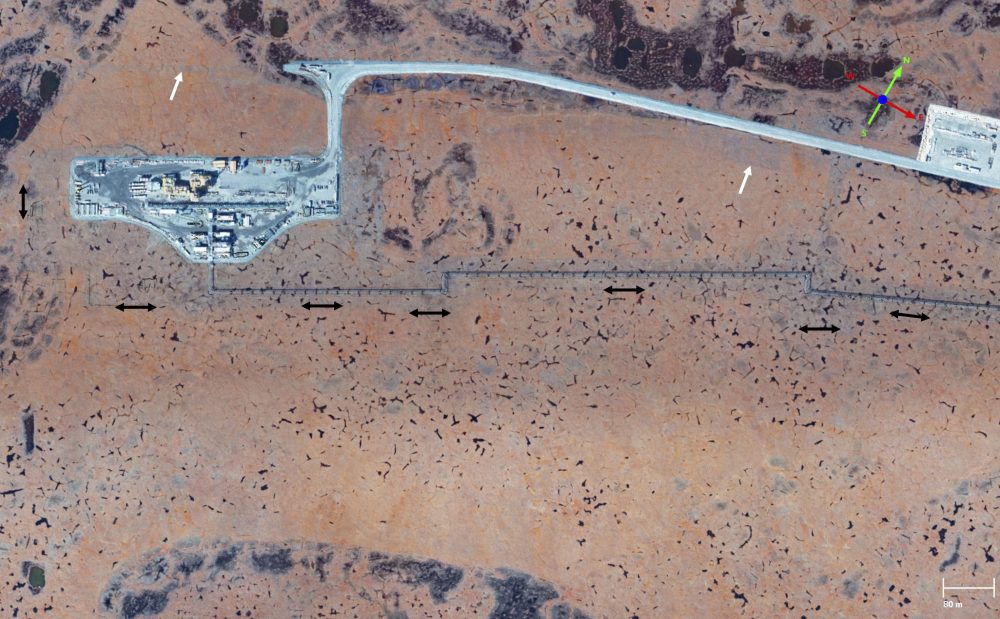
Long-term impacts of snow roads. I mapped this drill pad in NPR-A in winter and summer of 2021. At left we can see the location of the ice roads used to construct the pipeline, with the edges indicated by black arrows. In summer, the near-infrared imagery shows that the underlying vegetation remains stressed, as indicated by the grey color (reduction in photosynthesis). The white arrows indicate the locations of ice roads from prior years (note they are not seen in the 2021 winter imagery), indicating that this plant stress takes years to recover.
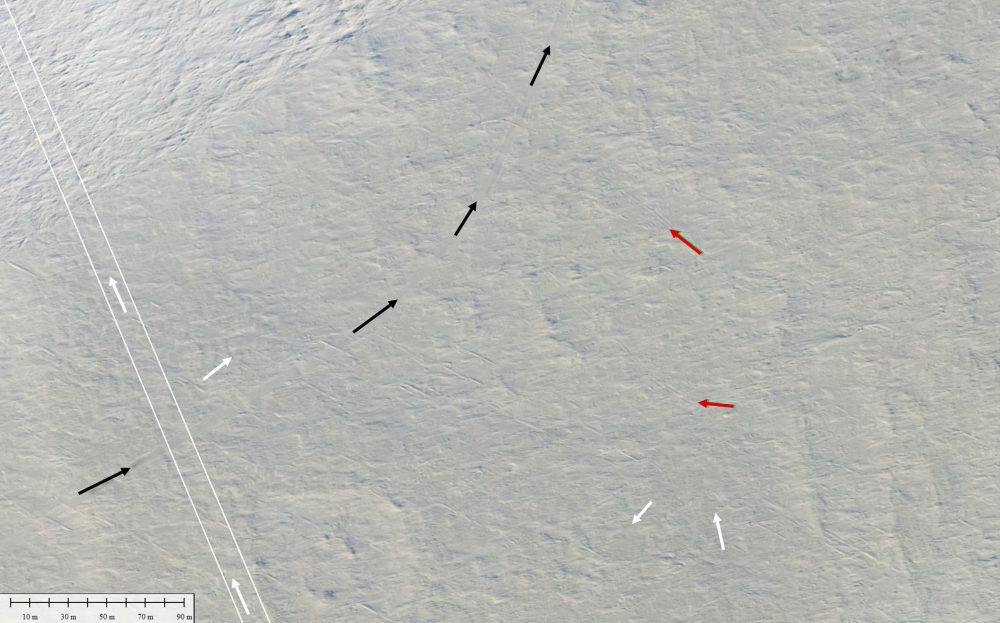
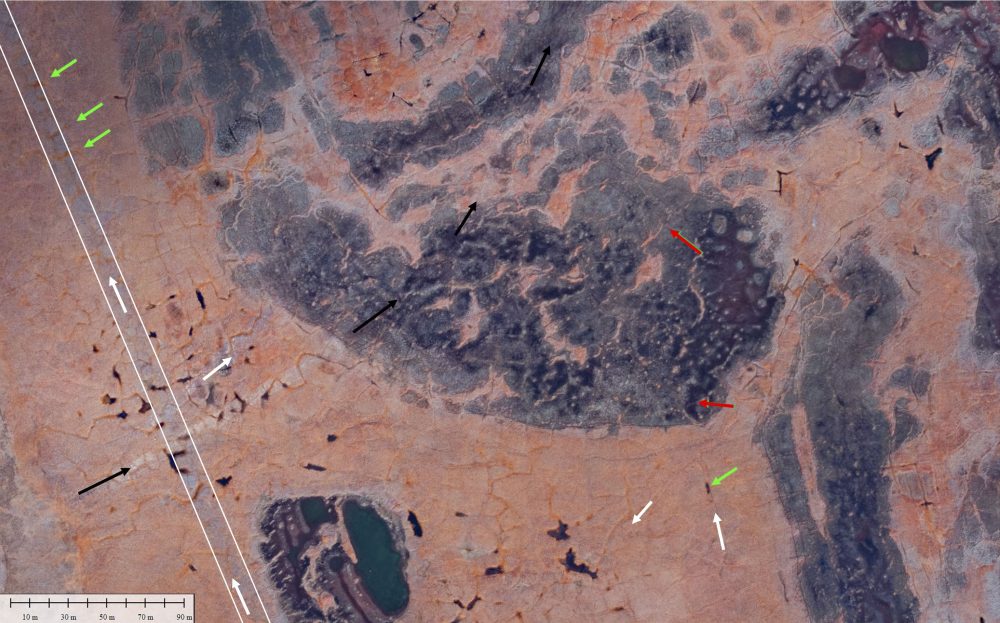
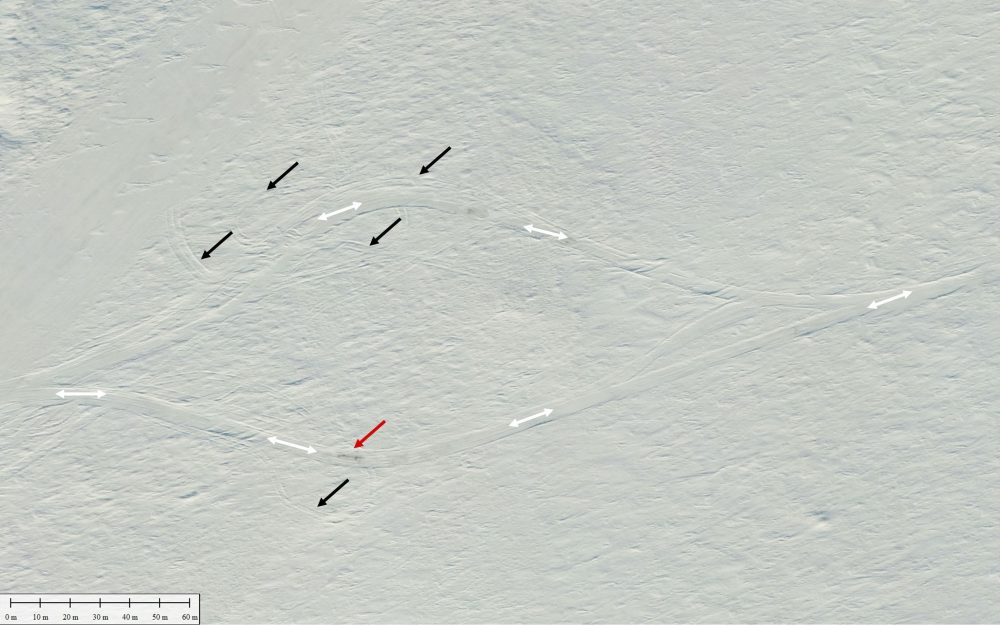
Long-term impacts of snow roads. Black arrows show a 2021 snow road (left image) in NPR-A and red arrows indicate off-road excursions from it in 2021. White arrows (inside thin white lines and outside) indicate over-snow travel evident in the near-IR imagery (right image) that are not present in winter 2021, indicating that the road and excursions from it were made some years prior yet still shows a significant vegetation stress. The 2021 snow road crosses multiple tundra types with different impact sensitivity; on tussock tundra, this nIR orthomosaic shows Eriophorum blooms are severely impacted (white color). Another road (thin white lines) made in some previous year still shows significant vegetative stress and damage in the near-infrared image (right), as do off-road excursions made in previous years (white arrows); these both show evidence of triggering thermokarst (green arrows). Because long-term damage is not revealed by RGB imagery, nIR photogrammetry should be used for long-term monitoring of all future seismic and ice road/pad operations.
Seismic Operations
- Seismic operations using modern methods can often leave ruts in the tundra 5-40 cm during operations, compressing the existing snow used for protection so much that it takes weeks longer to melt than the surrounding snow, an indication that it was not sufficiently thick to protect the tundra. Travel by multiple vehicles or multiple passes by the same vehicle are common and can leave grid trackways 3-25 m wide depending on re-use levels.
- These tracks are often visible years later both in visible imagery as well as near-infrared imagery which is a better indicator of vegetation stress. The vegetation that regrows within the tracks that makes the appearance of those tracks greener is not necessarily (and likely not) the same vegetation that was damaged initially, meaning that no location within a seismic operations area is more than half a grid cell in length from a higher concentration of wind-blown pollen or water-borne spores from new species, accelerating ecological succession.
- Even if tracks are shallow and do not trigger new thermokarst, it is clear that they adversely impact Eriophorum blooms in summer for years. These buds are prime nutrition for calving caribou. Considering rut-widths of 1-3 m depending on number of vehicle passes, a 50 m seismic grid could adversely impact 4-12% of this important forage source for calving caribou, directly in the heart of their calving grounds in the 1002 Area. For example consider a 50 m grid: 50 m x 2 line segments (half a square within a grid) x 2 m rut width = 200 m2 impact over 50 m x 50 m = 2500 m2, so 200 m2 / 2500 m2 = 8% by area.
The examples below are all from seismic operations since 2018, such that the methods and vehicles used are the same as what would be used in the Arctic Refuge this coming winter, if allowed.
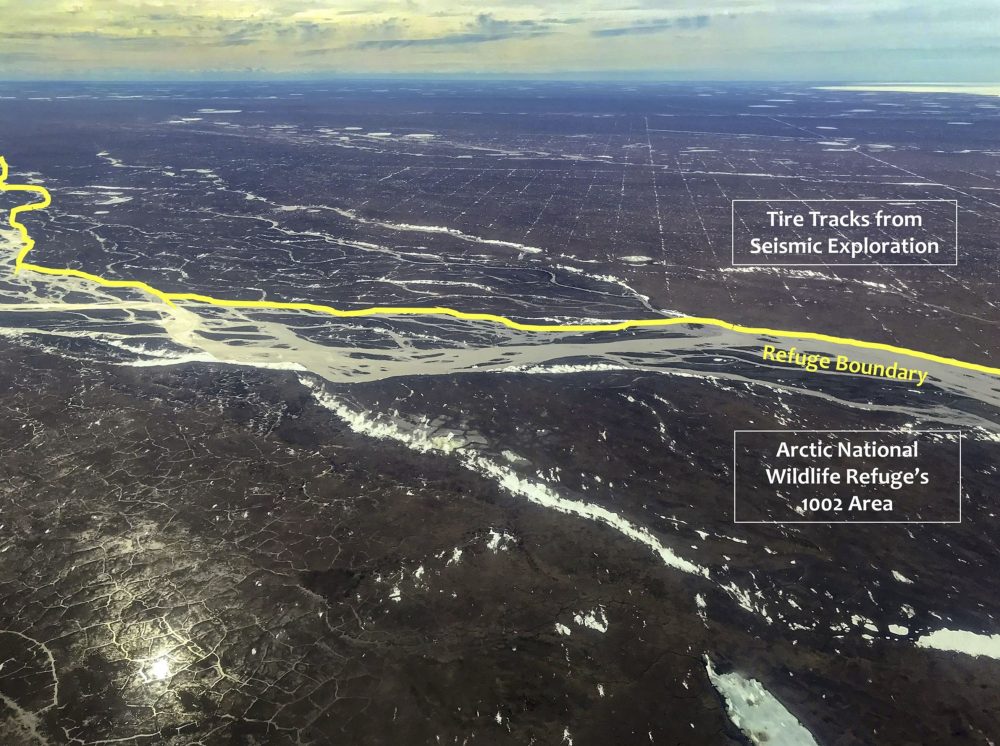
Long-term impacts of seismic vehicles. Here seismic operations in the winter of 2017-18 on the coastal plain (looking west) stopped at the Canning River which forms the boundary of the Arctic Refuge, as seen in the checkerboard of snow left behind.
Long-term impacts of seismic vehicles. The checkerboard is completely underlain by ice wedge polygons, as seen by the puddles of snow melt within their depressions at lower left. Because this is ground is so flat, these puddles largely do not drain because there is no where for the water to drain to. Thus, the damage caused by vehicle ruts is largely localized.
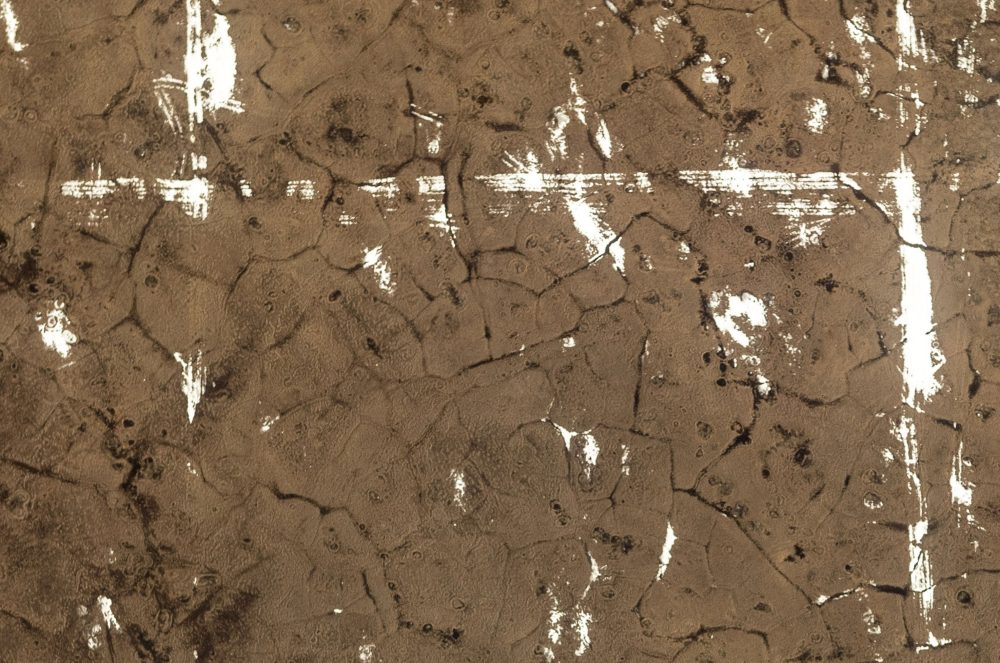
Long-term impacts of seismic vehicles. I mapped the ruts that left the checkerboard behind, as seen in this vertical image. The snow within these ruts has not melted yet because it was compressed and compacted, making it more resistant to melting.
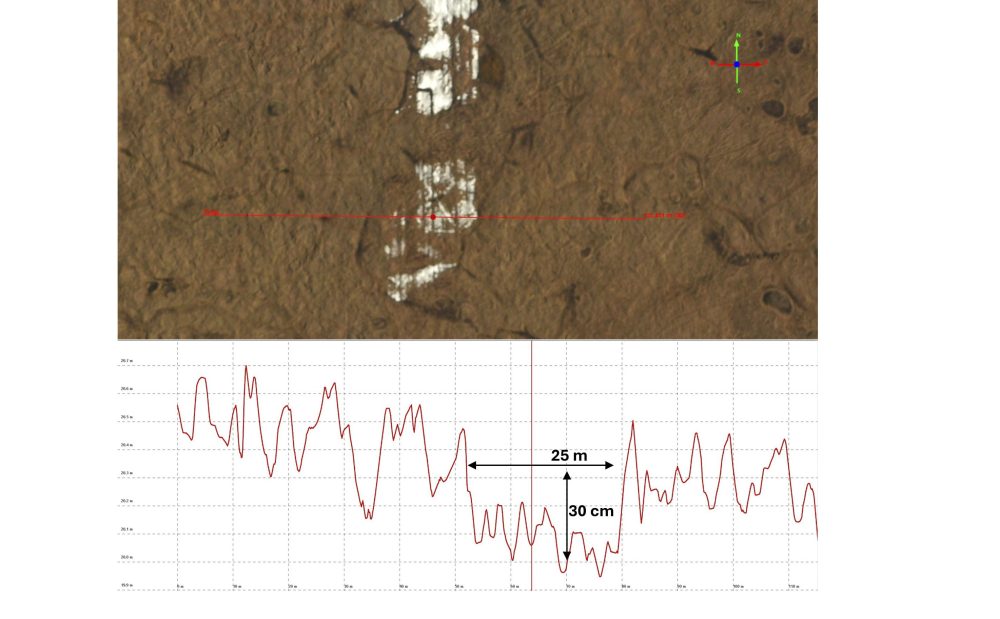
Long-term impacts of seismic vehicles. These vehicles left many trails that were 25 meters wide and 30 cm deep all over this landscape, as measured by my photogrammetry and seen visually. This trail was used many times — at least 5 or 6 times — as indicated by the many individual tire tracks. The fact that this wide, deep rut is here at all indicates that the snow depth was insufficient to protect the tundra.
Long-term impacts of seismic vehicles. This seismic grid in NPR-A in 2020 has a 100 m spacing. As mapped here two summers later, there were still ruts 40 cm deep. Here the two individual tire tracks are resolved (red stars on plot), one 40 cm deep and the other 20 cm deep, made easy to measure because there was only one vehicle using this trail. The white line shows one of many main east-west thoroughfares used by multiple vehicles.
Long-term impacts of seismic vehicles. The main thoroughfares were often 15-20 meters wide with ruts of 20-30 cm, made by too many vehicles to count. Ruts like these persisting for 2 or more years in the sloping, thawing terrain of the Arctic Refuge could cause permanent harm to the plant ecology that the calving caribou there depend on.
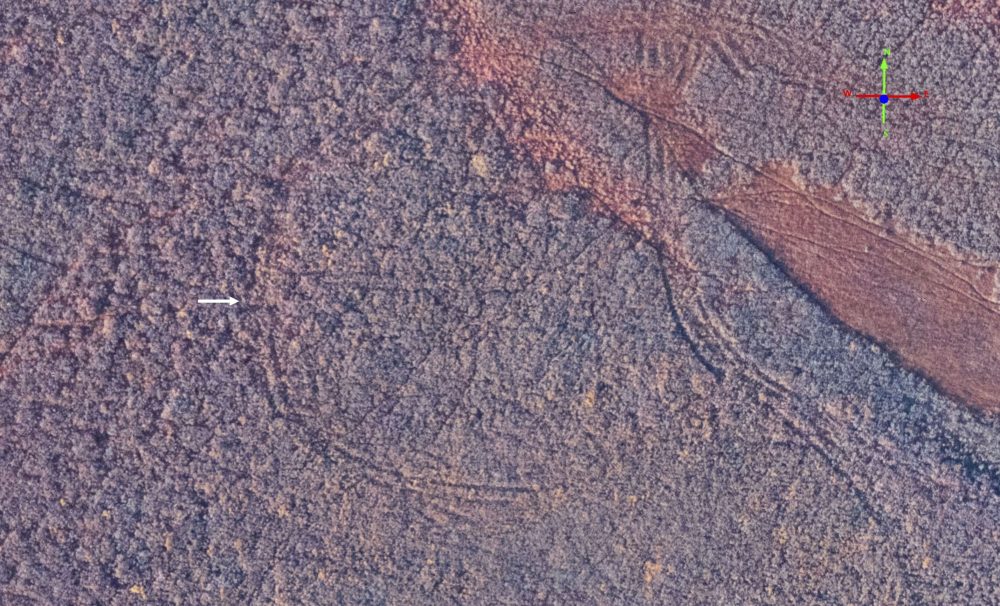
Long-term impacts of seismic vehicles. From what I observed, seismic lines progressed through willow stands indiscriminately. Here we can see fall colors on some of them (black arrow) with a 50 cm decrease in canopy. Likley the willows branches and their roots protected the underlying tundra, but at some cost to the willows.
Long-term impacts of seismic vehicles. Here someone made a U-turn through a willow stand that caused about a meter of the canopy to be crushed.
Long-term impacts of seismic vehicles. Even when the ruts are not deep, as here, the plant ecology is still harmed. Here, missing Eriophorum blooms two summers after the operations ended cause the trails to stand out clearly. The impacts of just the loss of blooms within the tracks can be substantial (4-12% on top of the existing 8% due to climate warming), but the real danger is how the interiors of the grids are impacted hydrologically on the thawing, sloping ground of the Arctic Refuge, as summarized next.
5. Conclusion
While long-lasting visible scars in the 1002 Area from seismic operations would be an unnecessary, reprehensible eyesore in this otherwise pristine wilderness, my biggest concern is that they may cause irreparable harm to the Porcupine Caribou Herd by creating a massive hydrological change which would lead to a rapid, irreversible decrease to the forage species that bring that herd to calve here. I don’t know how large a reduction in food this would lead to (20-50% seems reasonable to me) or whether this would actually lead to a population decline or a change in migration dynamics as I am not a caribou expert, but I do know as yet no one has actually studied this and that concerns me deeply. The final graphics below are what I fear could happen across the entire 6000 km2 of the 1002 Area if no one conducts such studies and improves regulatory and operational protocols to prevent it.
Possible impacts of seismic operations on the Porcupine Caribou Herd. Here a hypothetical 100 m grid (black dashed lines) has been placed over the study area of the 2022 paper, along with the hypothetical massive increase in surface drainage (colored lines). Not only is the landscape sensitive to linearizing drainage along the vehicle tracks, but also to creating new drainage within the untouched grid interior more efficient as well. Efficient drainage in the tire ruts causes thermal erosion of ice wedges, which then attracts more water inputs from its surroundings due to the increase in topographic gradient (deeper ruts attract surrounding water to fall into it), causing further thermal melt and incisement, attracting snow to fill the incisement, warming the ground, and exposing ice wedges broadside to the sun in a positive feedback that may be impossible to stop once started, as further described in the companion blog on observations. This process will accelerate the rapid transformation of plant ecology along each new stream channel within the grid cell interiors,not just in the tracks themselves. That is, the potential harm here is not limited to just the tracks themselves, but potentially to the entire region. Given that an ~8% loss of forage species important to calving caribou has already been lost here due to the formation of new hydrologic channels (see earlier description), an acceleration of this process could increase this loss substantially, perhaps having a profound influence on the Porcupine Caribou Herd.
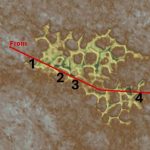
Possible impacts of seismic operations on the Porcupine Caribou Herd. Here an example ~200 m uniform grid is superimposed over the contour lines of a previous figure, simulating seismic operations (note that these operations often work on an even smaller 50 m grid). Every one of these 200 m grid segments has the possibility to link drainage across one or more 50 cm contours (red stripes). When drainage become efficient in such linear channels, it will create a local topographic gradient around the perimeters of the grid cells that will draw drainage from inside the untouched interiorsof the grid cells (red stripes), as the water is perched there only because it previously had no where to go. That is, like in the previous schematic, if the white lines here become incised channels, the red lines (inside the white grid lines, currently not draining) will connect and drain into them, rapidly transforming the plant ecology anywhere this occurs.
To understand the true impact that seismic operations might have on caribou population dynamics, it is necessary to understand these figures: the plant ecology of the entire landscape can be rapidly transformed by seismic operations operating on a grid because the hydrology of the interiors of the grids would be impacted by the grid’s linearization of the hydrology in a way that eliminates plant species that calving caribou favor. Before permitting seismic in the 1002 Area, protection protocols must be developed and implemented to eliminate this possibility, if we want to consider such development responsible.
So what can we do?
If you are a scientist, please follow up on the ideas I’ve introduced here and let me know what you find, I’m happy to collaborate. Contact me if you want the original data to work with yourself.
If you are a fan on the Arctic Refuge, contact your representatives in Washington and the BLM in Alaska and tell them that you are opposed to irresponsible development — until this caribou issue is studied fully and suitable protection protocols developed, seismic work cannot proceed as planned. Amplify this message through your favorite non-profit.
By the time my son was 7, he had spent more time in the mountains of the Arctic Refuge as a percentage of his life than probably any other human alive today. I want him (now 20) to be able to continue to visit and learn here knowing that his father put everything he had into studying this place scientifically to protect it from preventable harm. If you feel similarly, help me help you.
I am an independent scientist — after 25 years at the University of Alaska, I’ve been funding this research out of my own pocket since 2014. That’s all of the map making, all of the field work on the glaciers and tundra, and nearly all of the analysis. I spend roughly $30k/year just for the bare bones field efforts, much more in some years — that’s just my direct costs, not my labor, not my opportunity costs, not my son’s college savings, etc. If all funding for science here comes from Federal sources, who will be left working here when those Federal sources dry up as they are now? Perhaps only me, and your help would allow me to do it much more efficiently and reliably. In any case, no one tells me what I can and can’t study, which is how I ended up being the only person capable of telling this story, and probably the next one too.
So if you found the information in this blog useful, please consider donating to a GoFundMe account I created to protect the caribou from this harm. Right now I’m trying to raise funds to determine, for the first time, the amount of snow required to prevent permanent rutting by seismic vehicles. I’ve already done the winter mapping (presented in the third blog), now I need to do the summer mapping to determine the severity of the winter impacts and then conduct the substantial analysis and reporting prior to new seismic permits being issues in the 1002 Area this fall. This project is described more fully in the third blog in this series.
Or please consider paying it forward by making a $17/month donation and receive my monthly insider’s newsletter keeping you up to date with my latest findings. If only 250 people signed up, that would cover my base costs and keep me focused on collecting, analyzing, and sharing these data, allowing me to stay ahead of the game by letting the data tell me (and you) the next story. That’s like the price of Netflix — are there 250 people in this country that care enough as much about protecting the Arctic Refuge as much as they like Netflix? I hope so!