Fodar Beneath a Forest Canopy
This blog will hopefully go a long way towards dispelling the myth that fodar cannot be used to measure ground topography beneath a tree canopy. Whether it is the best tool for the job depends largely on how you define ‘best’, but I can say without hesitation that fodar is an awesome tool for this job and should not be discounted just because it is not in common practice.
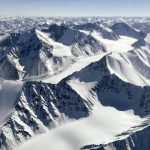
Being an Arctic scientist, I don’t have much occasion to map trees, so I rarely blog about it. But as treeline heads North and there is more interest in mapping in general given the drone craze, I thought it time to give a few more examples of what can be done from an airplane using fodar. So last week I mapped some forested area a few miles from my local airport to demonstrate the power of fodar beneath a canopy. It was the ideal time for it, irrespective of technology, as the snow was largely melted and the birch leaves had not yet popped out. But the spruce were still as green as ever and the birch tree trunks and branches were still plentiful.
The major issue with mapping the ground surface in a forest is that the trees get in the way of seeing the ground. Neither lidar nor fodar can map the ground if the ground is not visible. But lidar has some advantage in that it only needs one view of the ground to make a measurement because it operates like a laser pointer (light is sent out by the pointer and the reflection is seen by your eye), measuring the time it takes for a laser pulse to reach the ground and back, so it can kind of pierce the canopy in this way. However, most non-experts dont realize that the laser pulse of lidar spreads out and may be a meter wide by the time it hits the ground from common mapping altitudes. Thus it still takes quite a large hole in the canopy to get most of the energy to reach the ground. Photogrammetry like fodar requires at least two images covering the same piece of forest floor and from different angles, so it does indeed have more constraints to success than lidar in this regard. But the realworld results between the two technologies turn out to be quite similar. That is, from what I have seen it takes a powerful and expensive lidar unit run at low altitude to outperform fodar, and that is beyond the price range of many users. So the ‘best’ technology has to consider more than just technical performance. If Technology A is unaffordable and Technology B is affordable and does 80% as well as Technology A, which is best? My experience in this case has shown that most people’s minimal specs for a solution in such a case magically conform to 80%. But that’s for the end-user to decide, here I’m just going to show what’s possible so that end-users can make educated decisions.
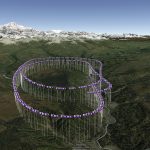
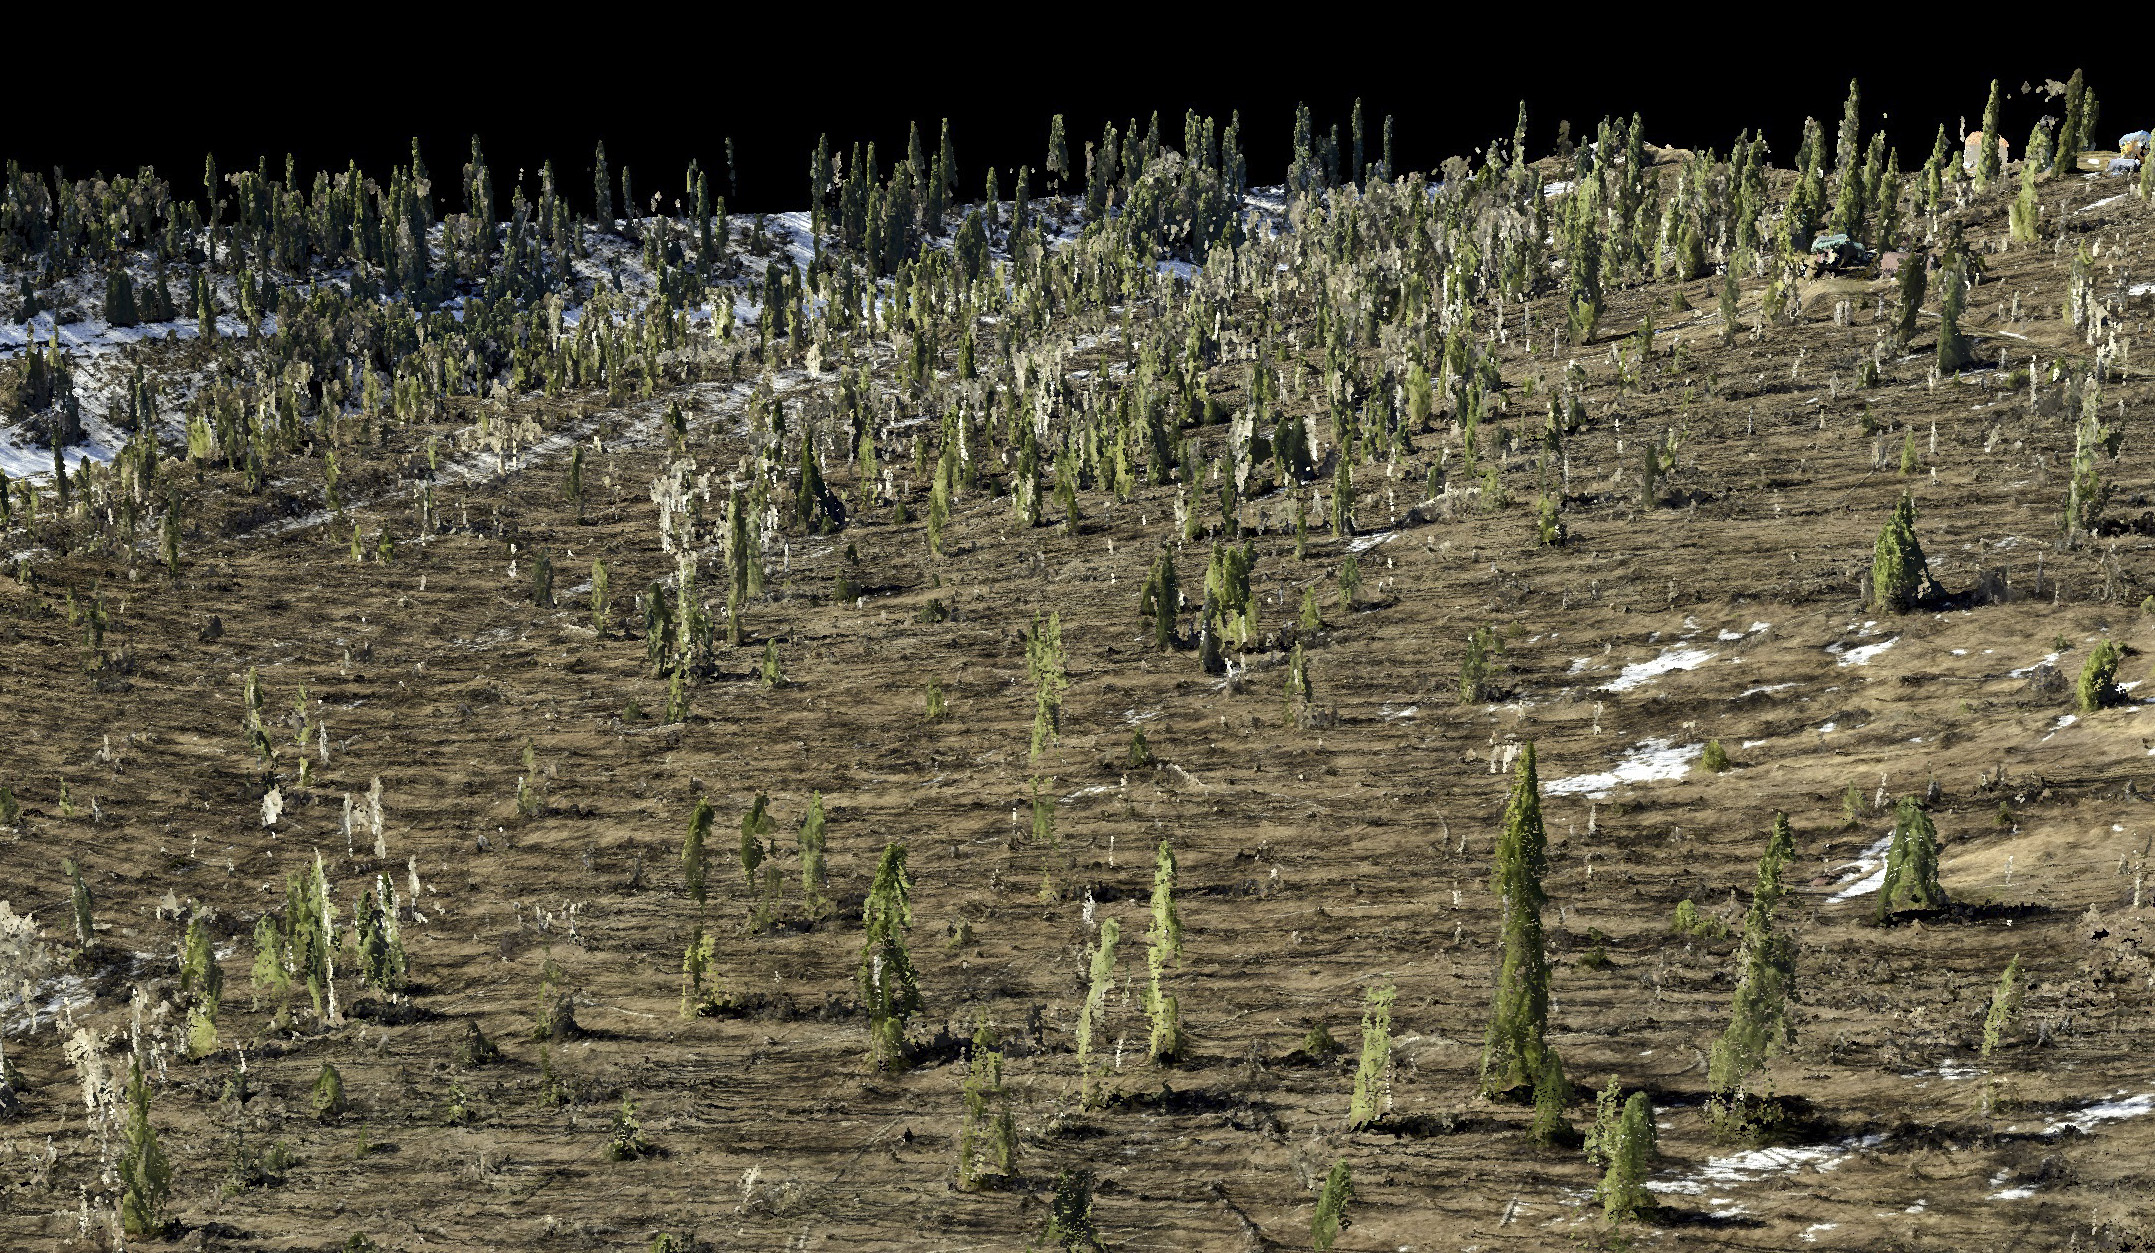
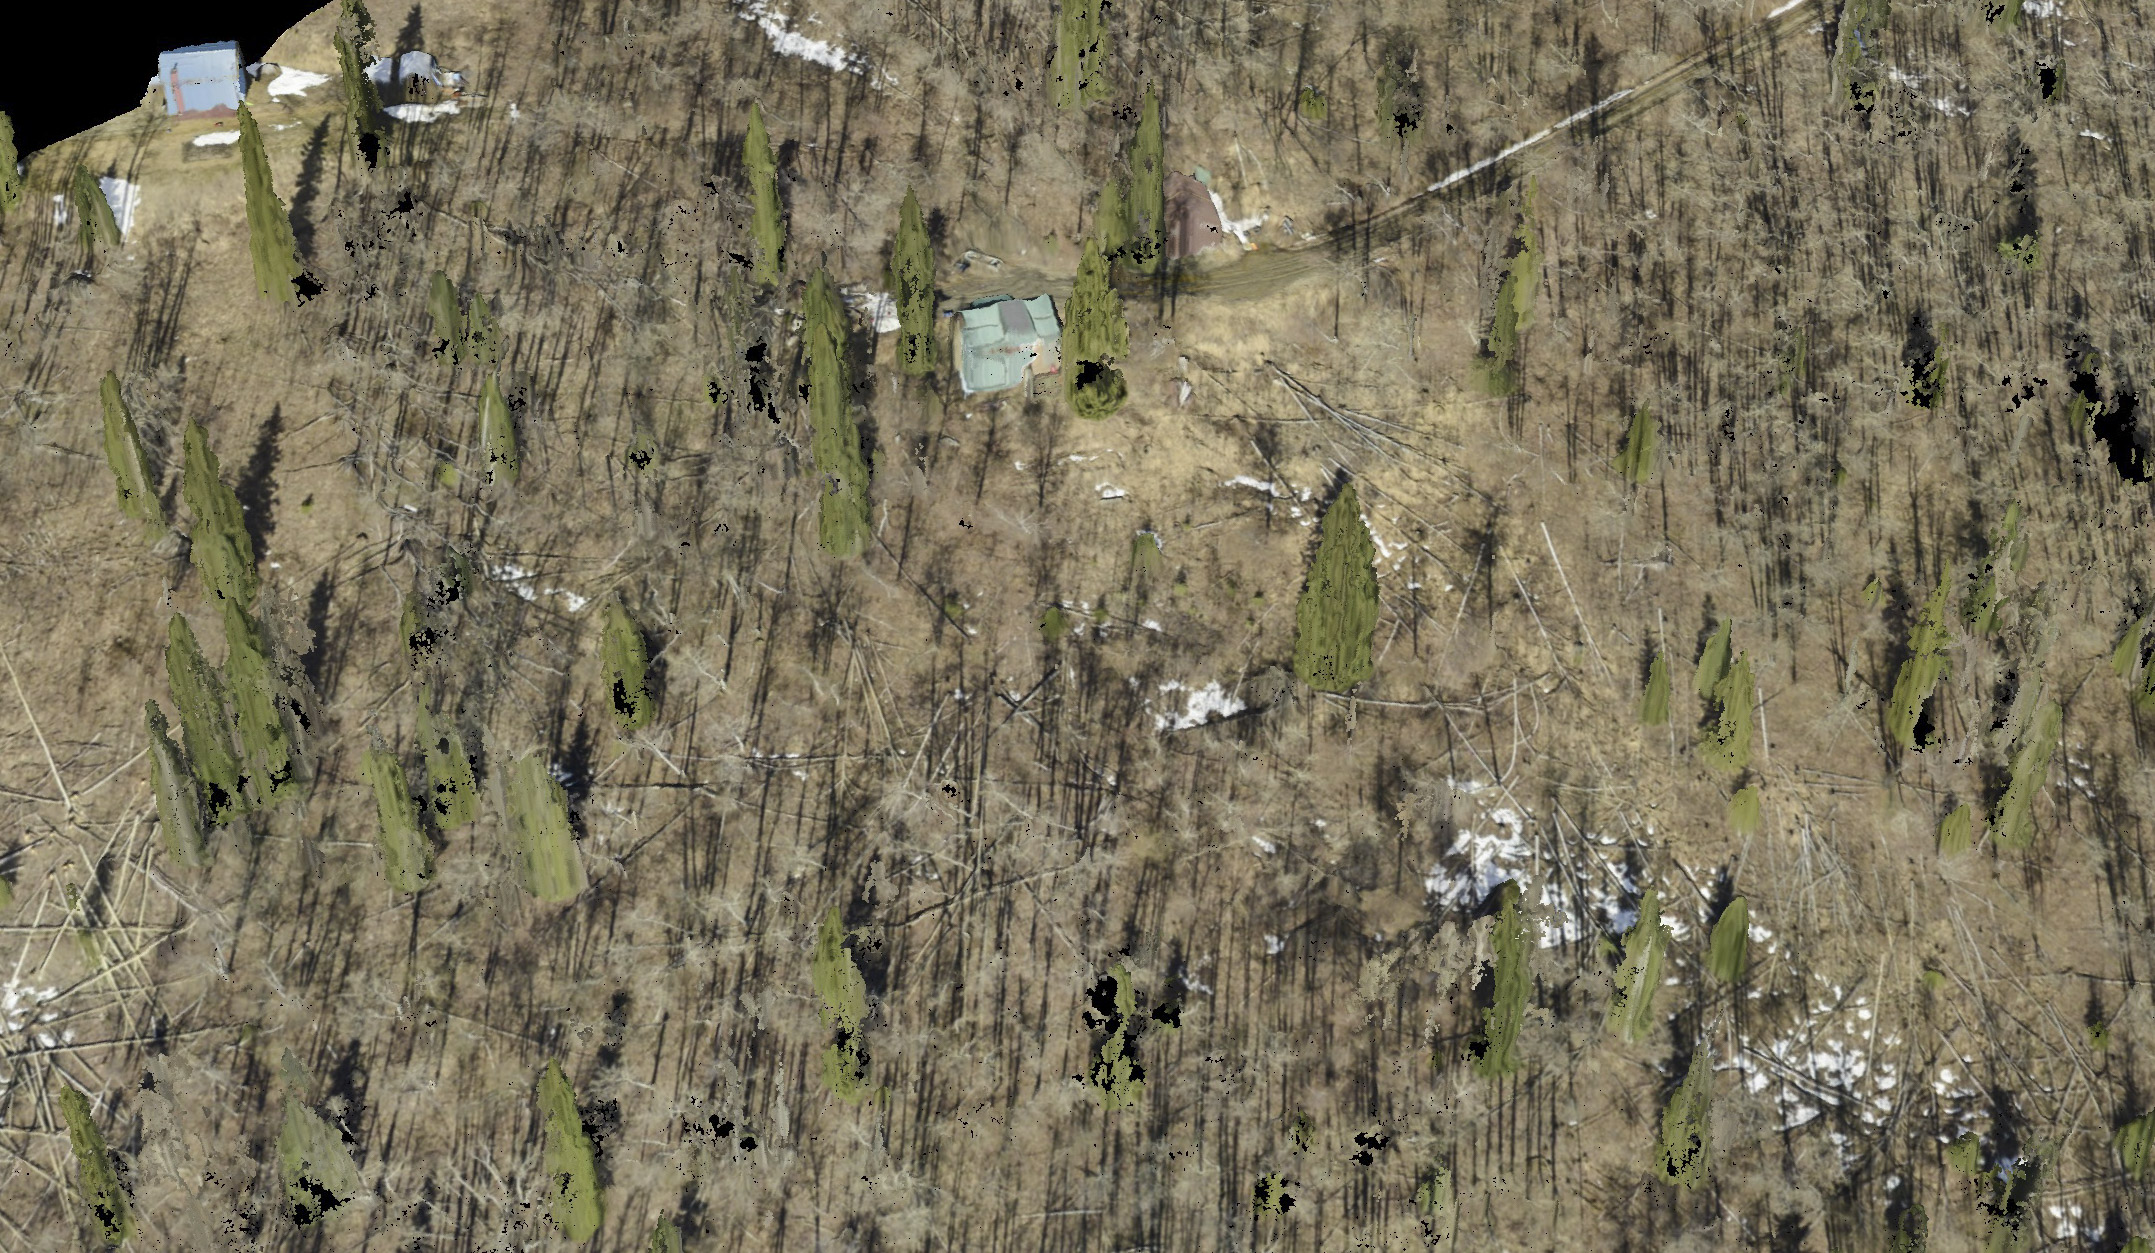
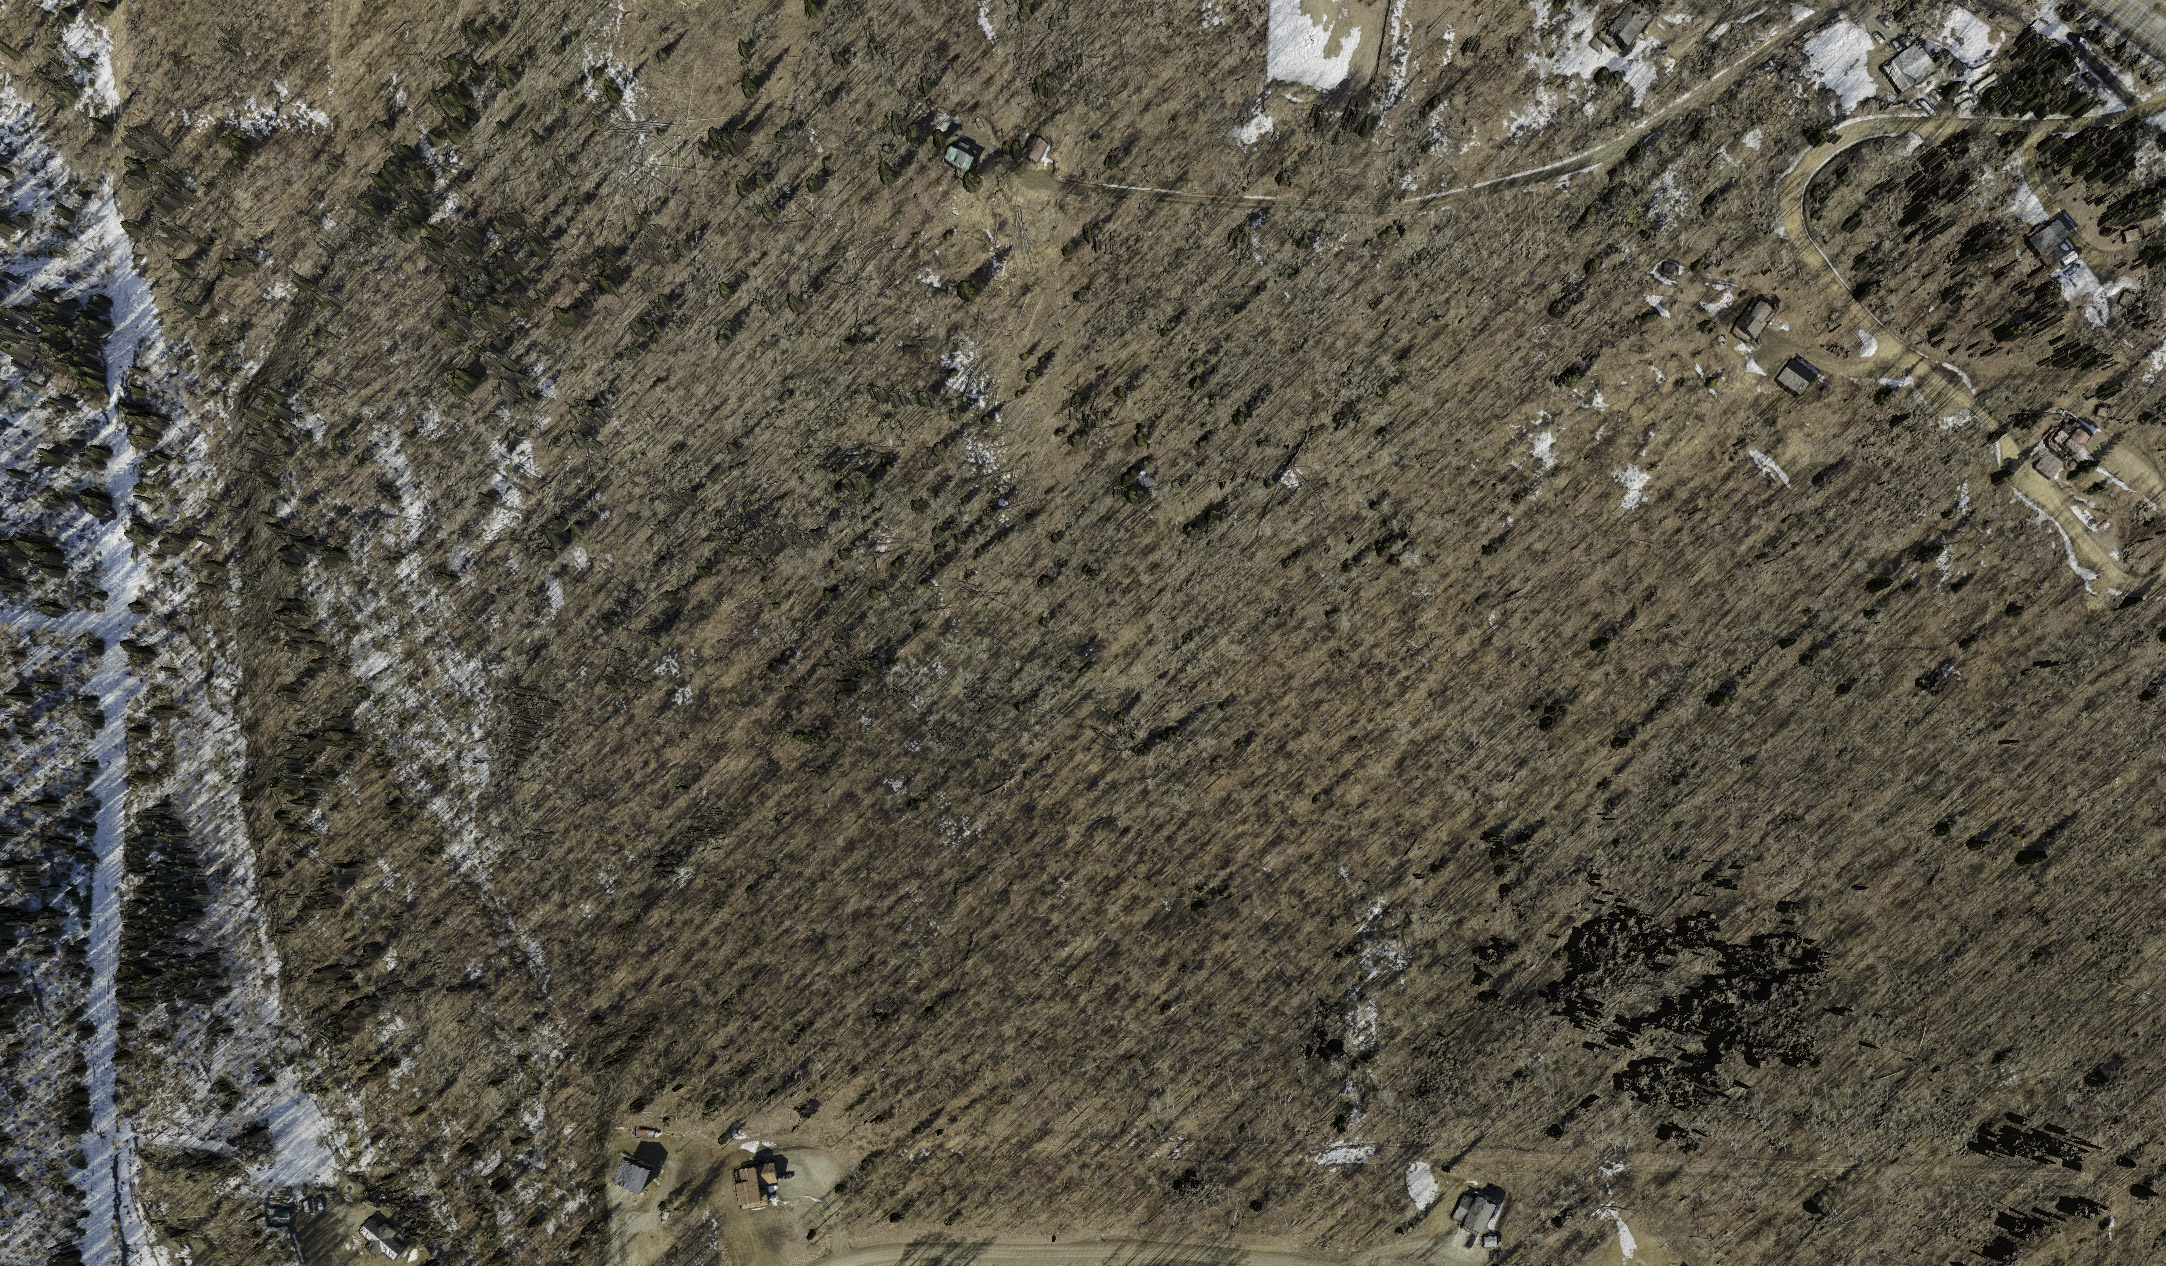
Here is an example fodar data set that Turner and I flew last Thursday. It’s a few square kilometers of forested hillside a few miles from Fairbanks International Airport, where I park my planes.
Here is a closeup view of the same data, this time showing the detail in several houses.
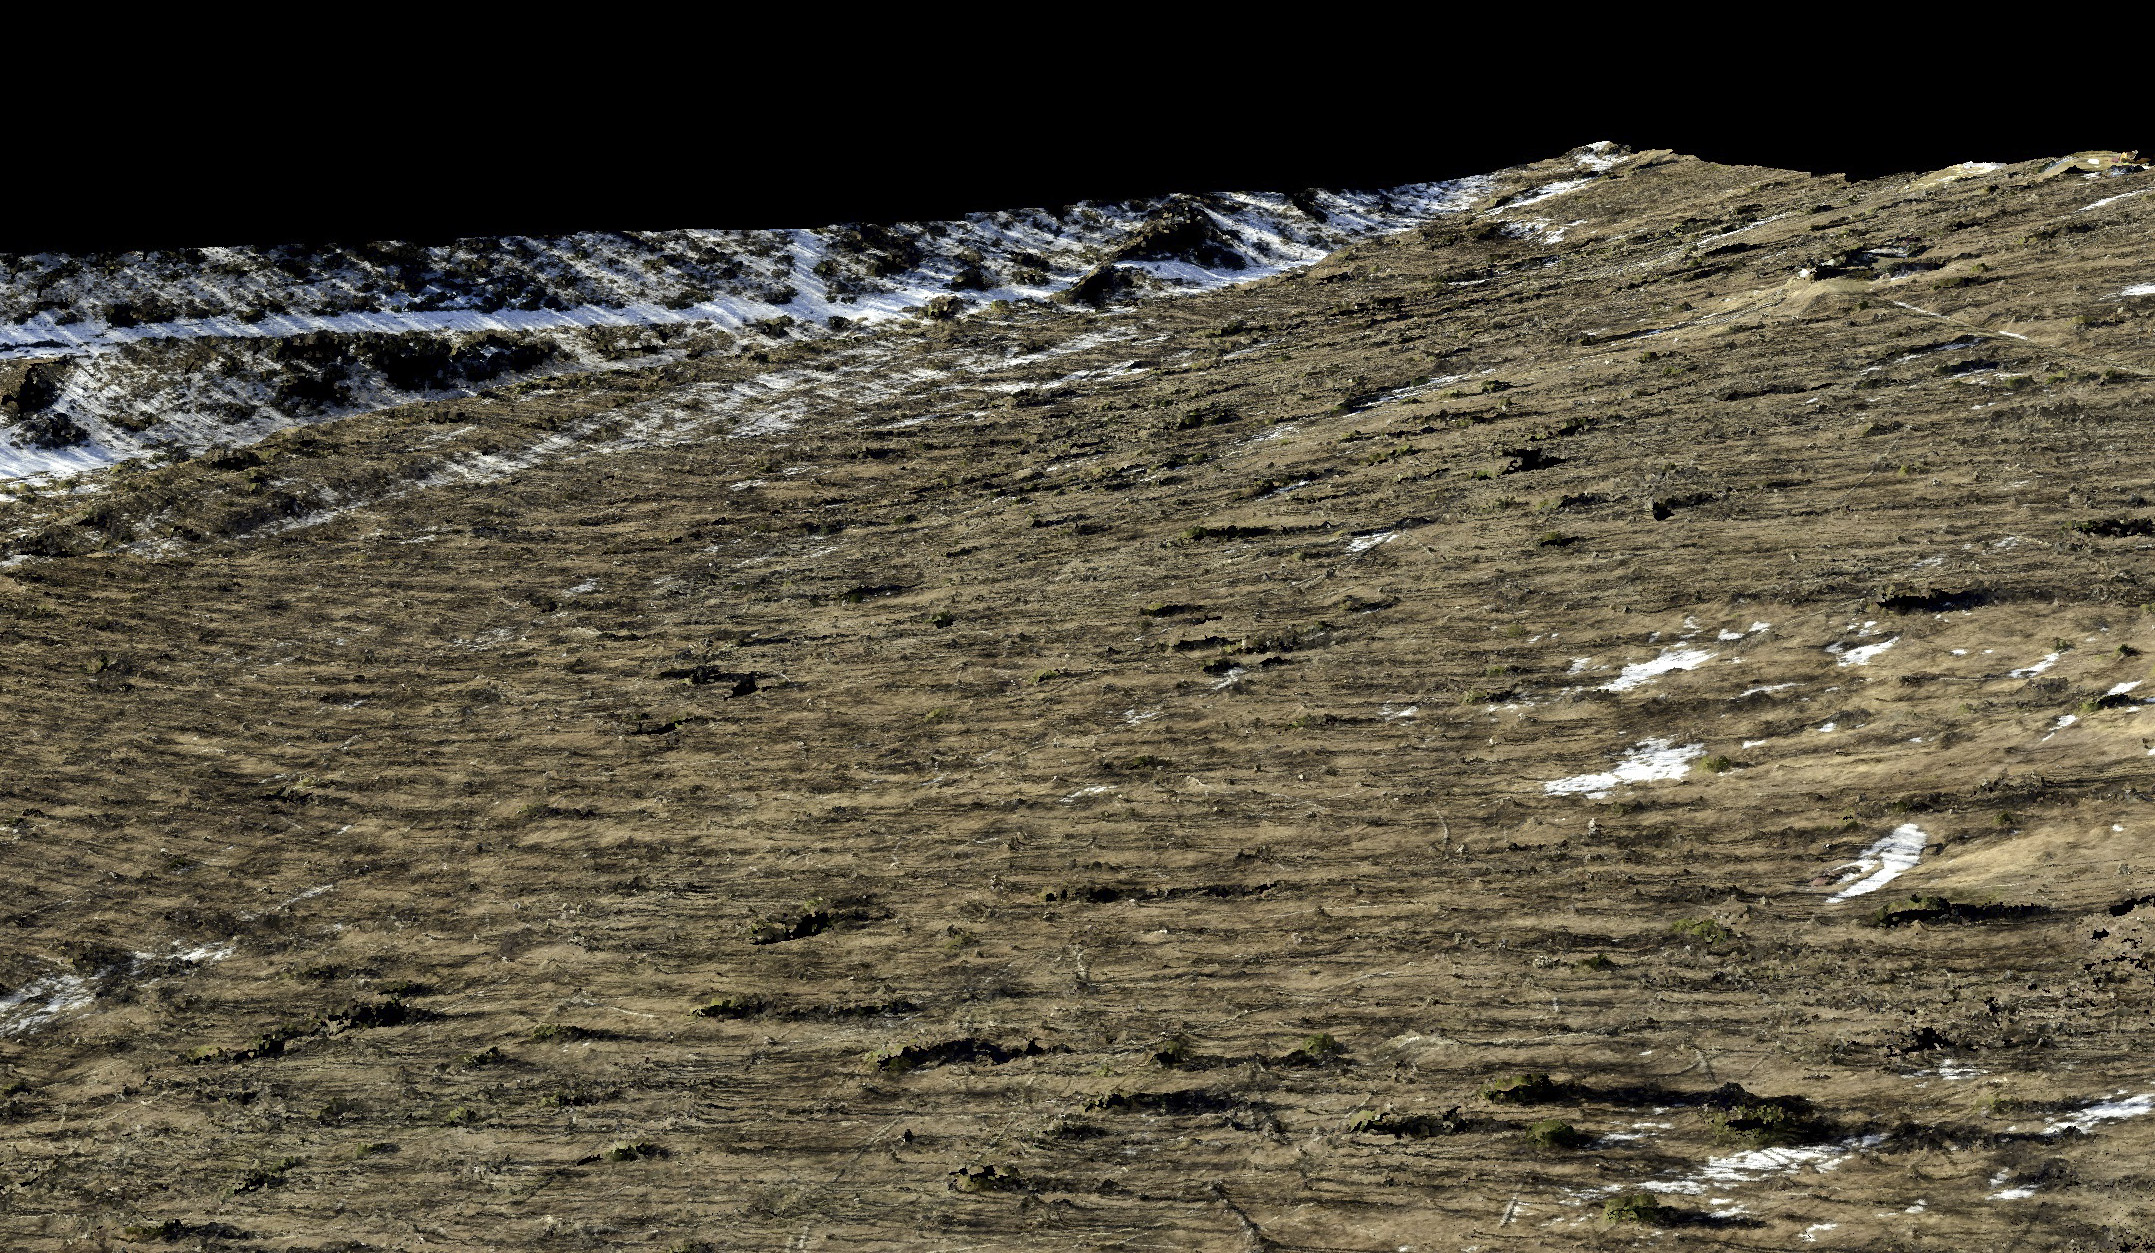
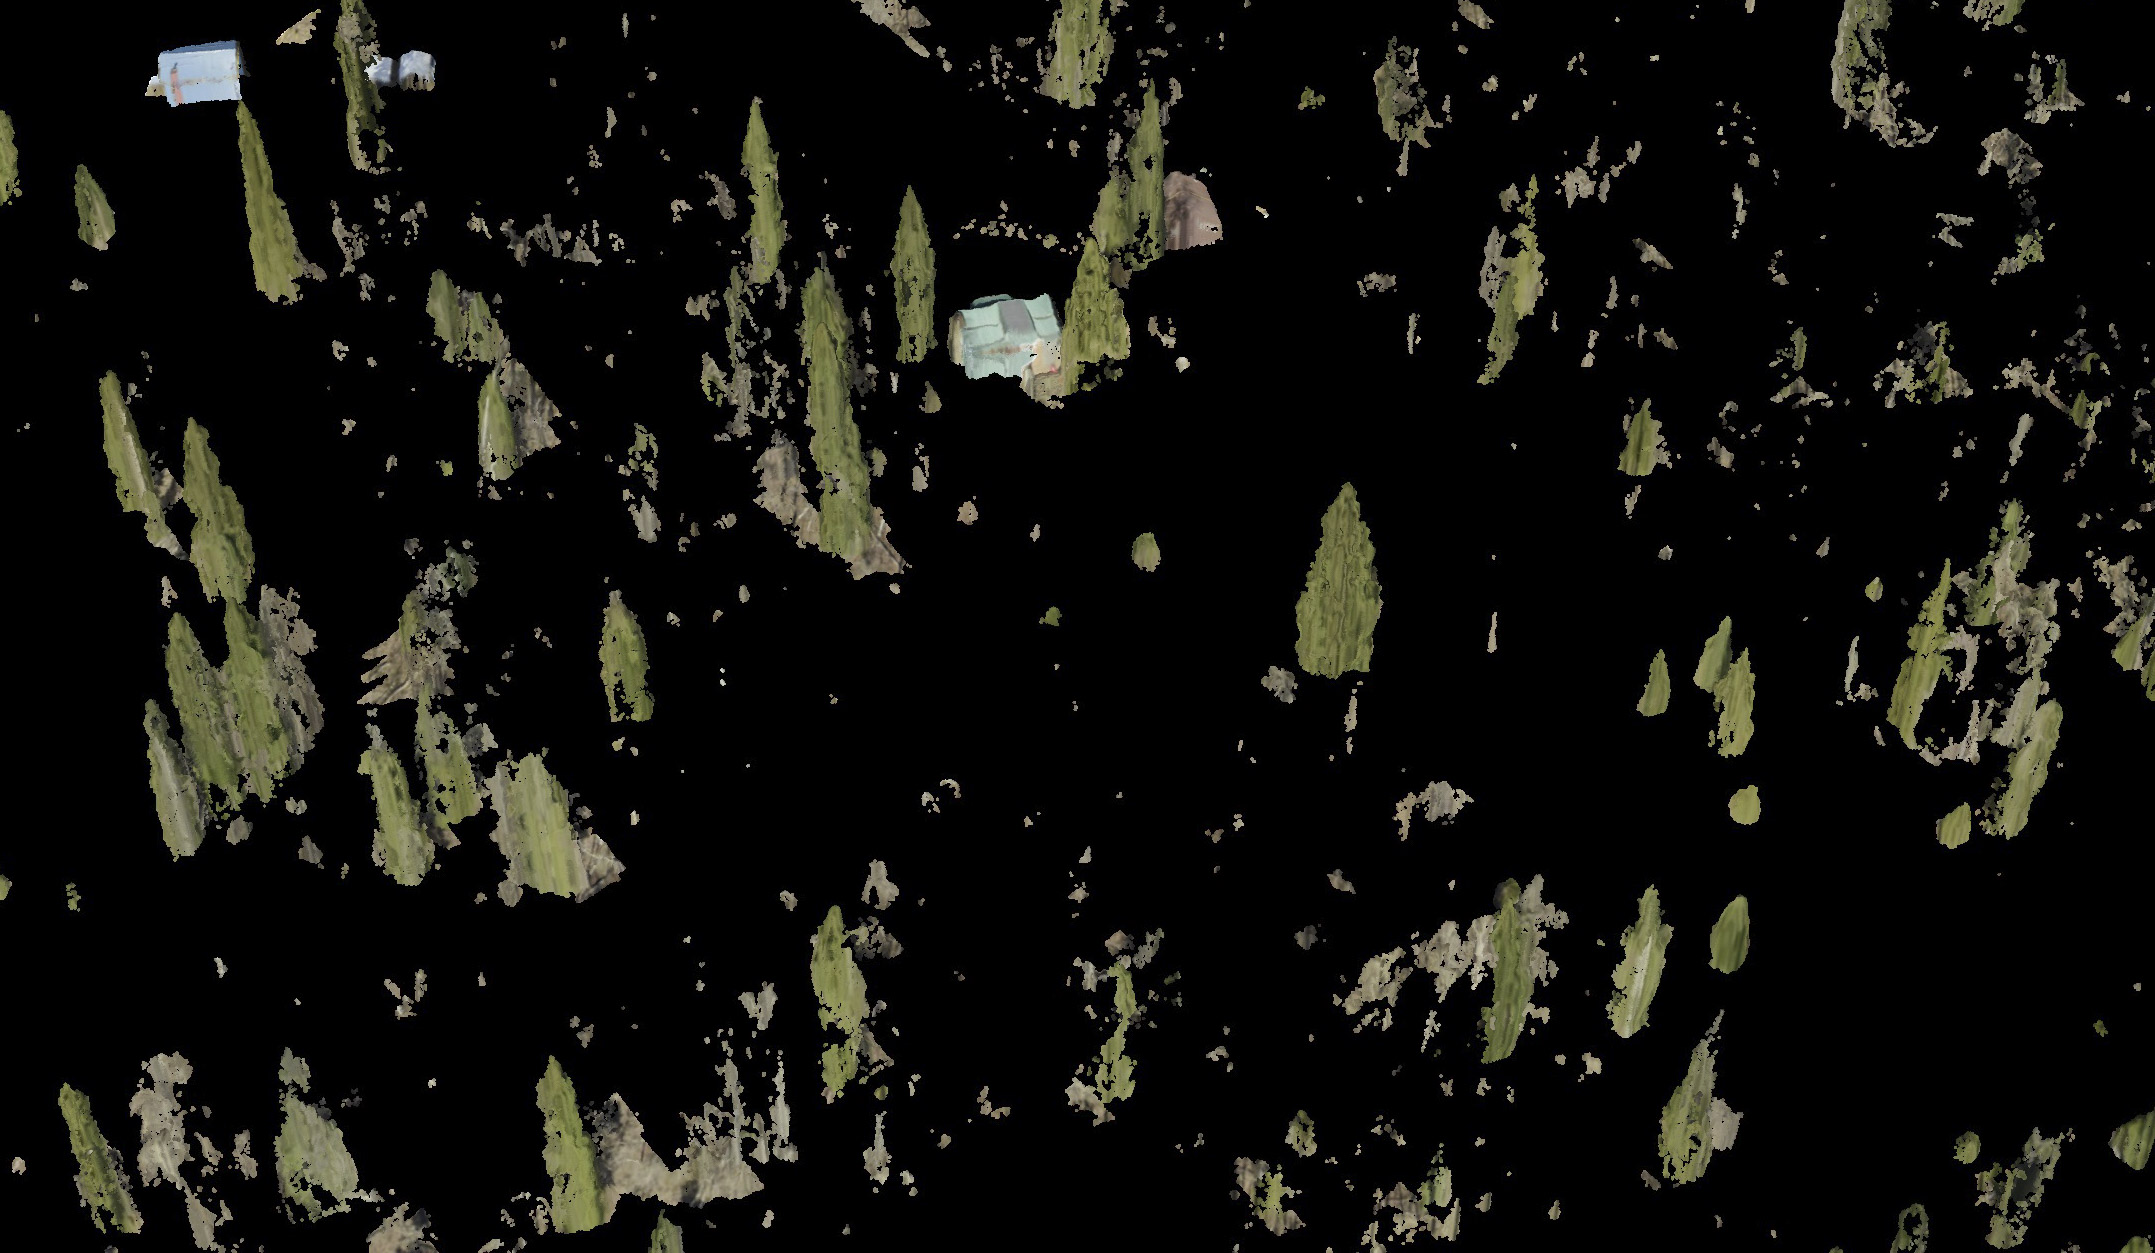
Depending on application, you may be interested in just the ground beneath the trees or perhaps just the trees. Using a variety automated classification techniques, trees and houses are reasonably easy to separate from the ground underneath with the right software. The images below show just that.
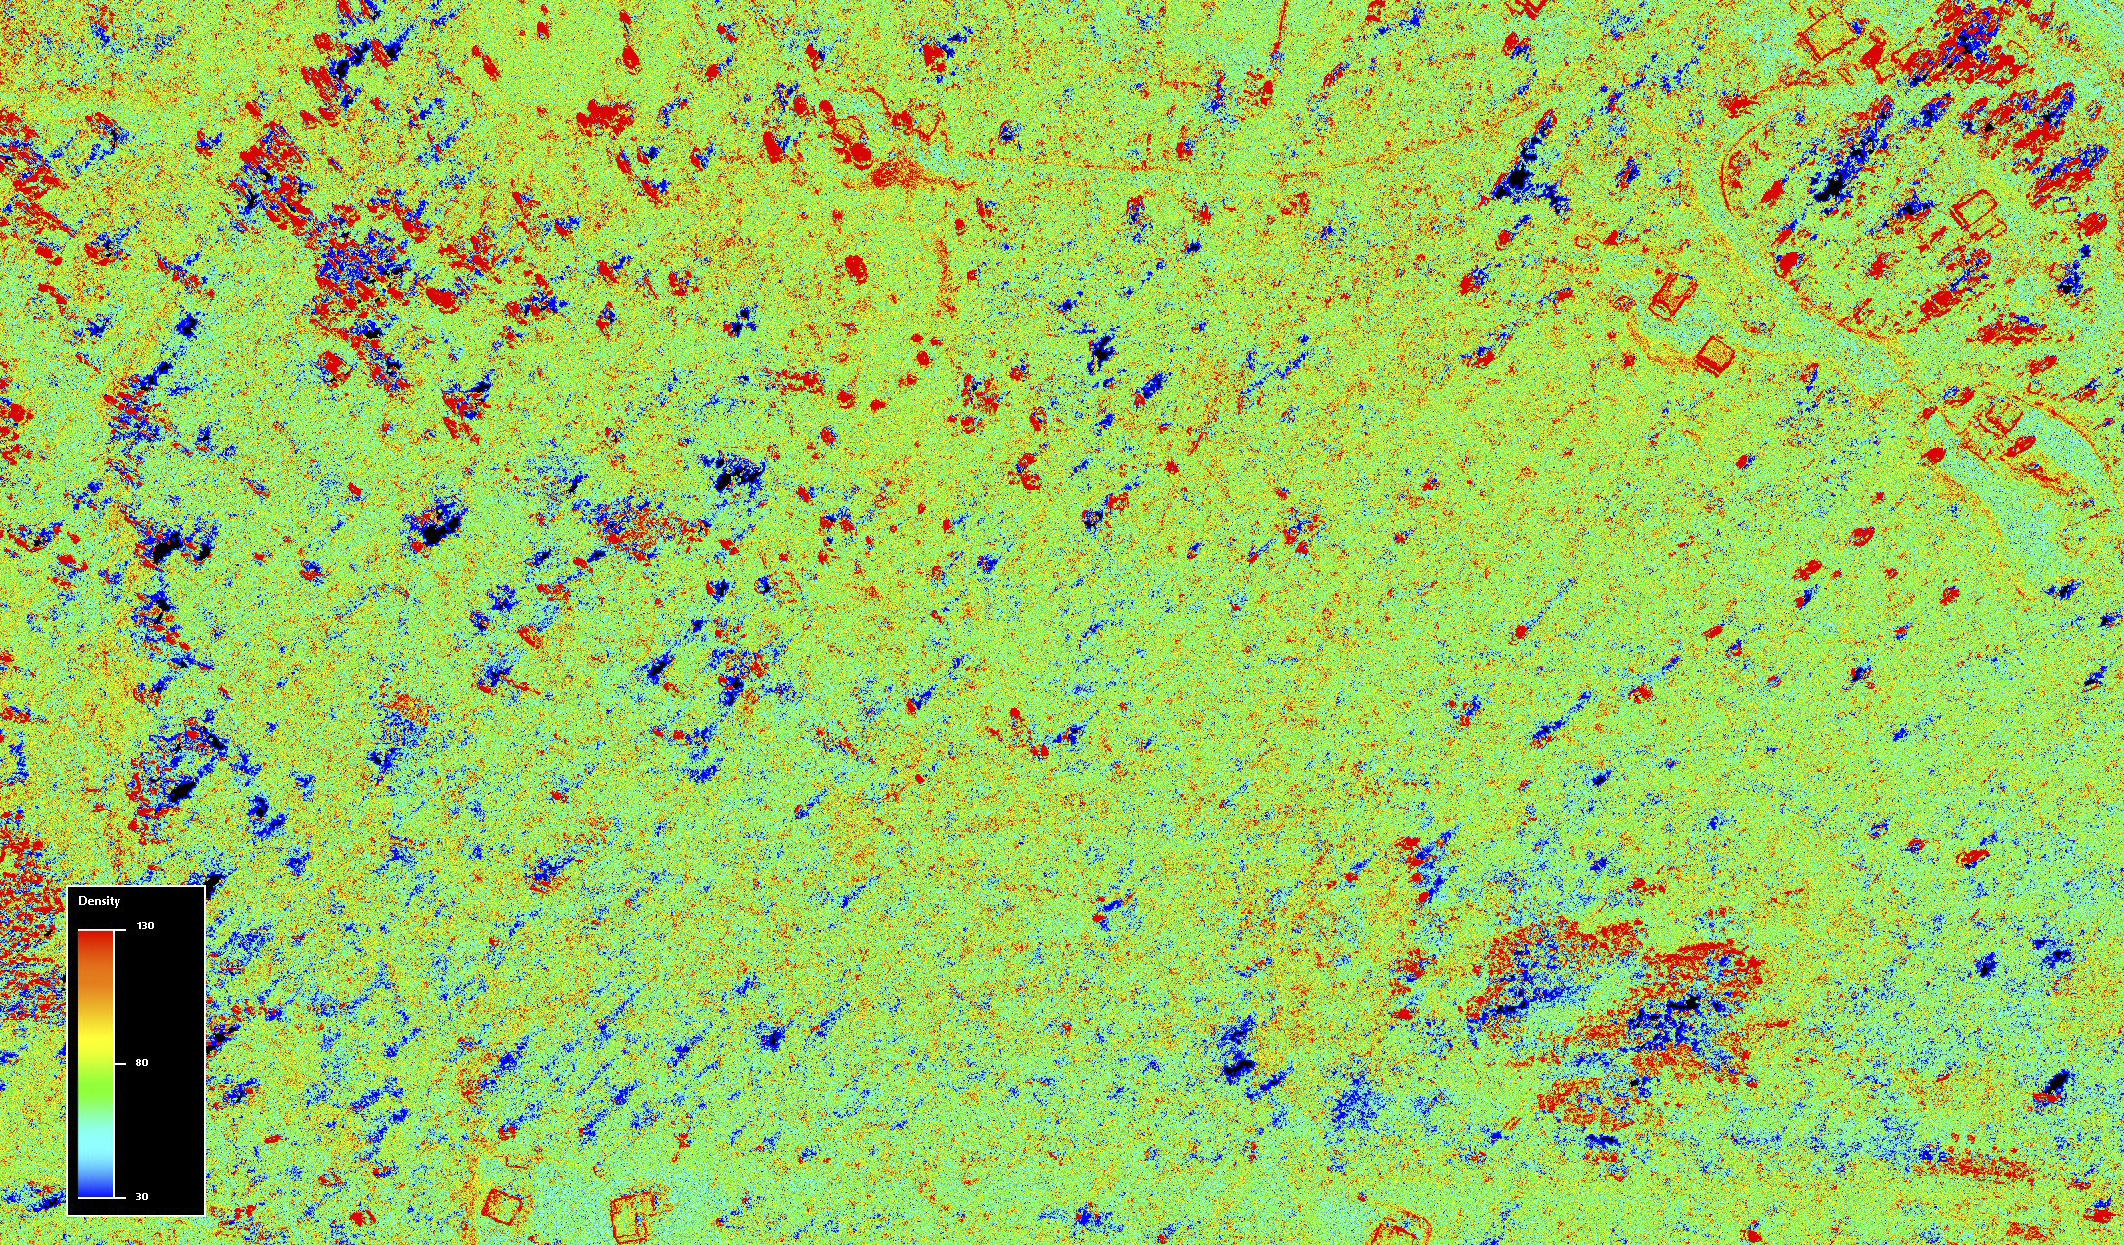
An important consideration when purchasing or using fodar or lidar is point density — the more dense your points, the higher the resolution of your digital topography. Below are some examples of the point density from this project, which was planned to produce about 70 points per meter squared (ppsm).
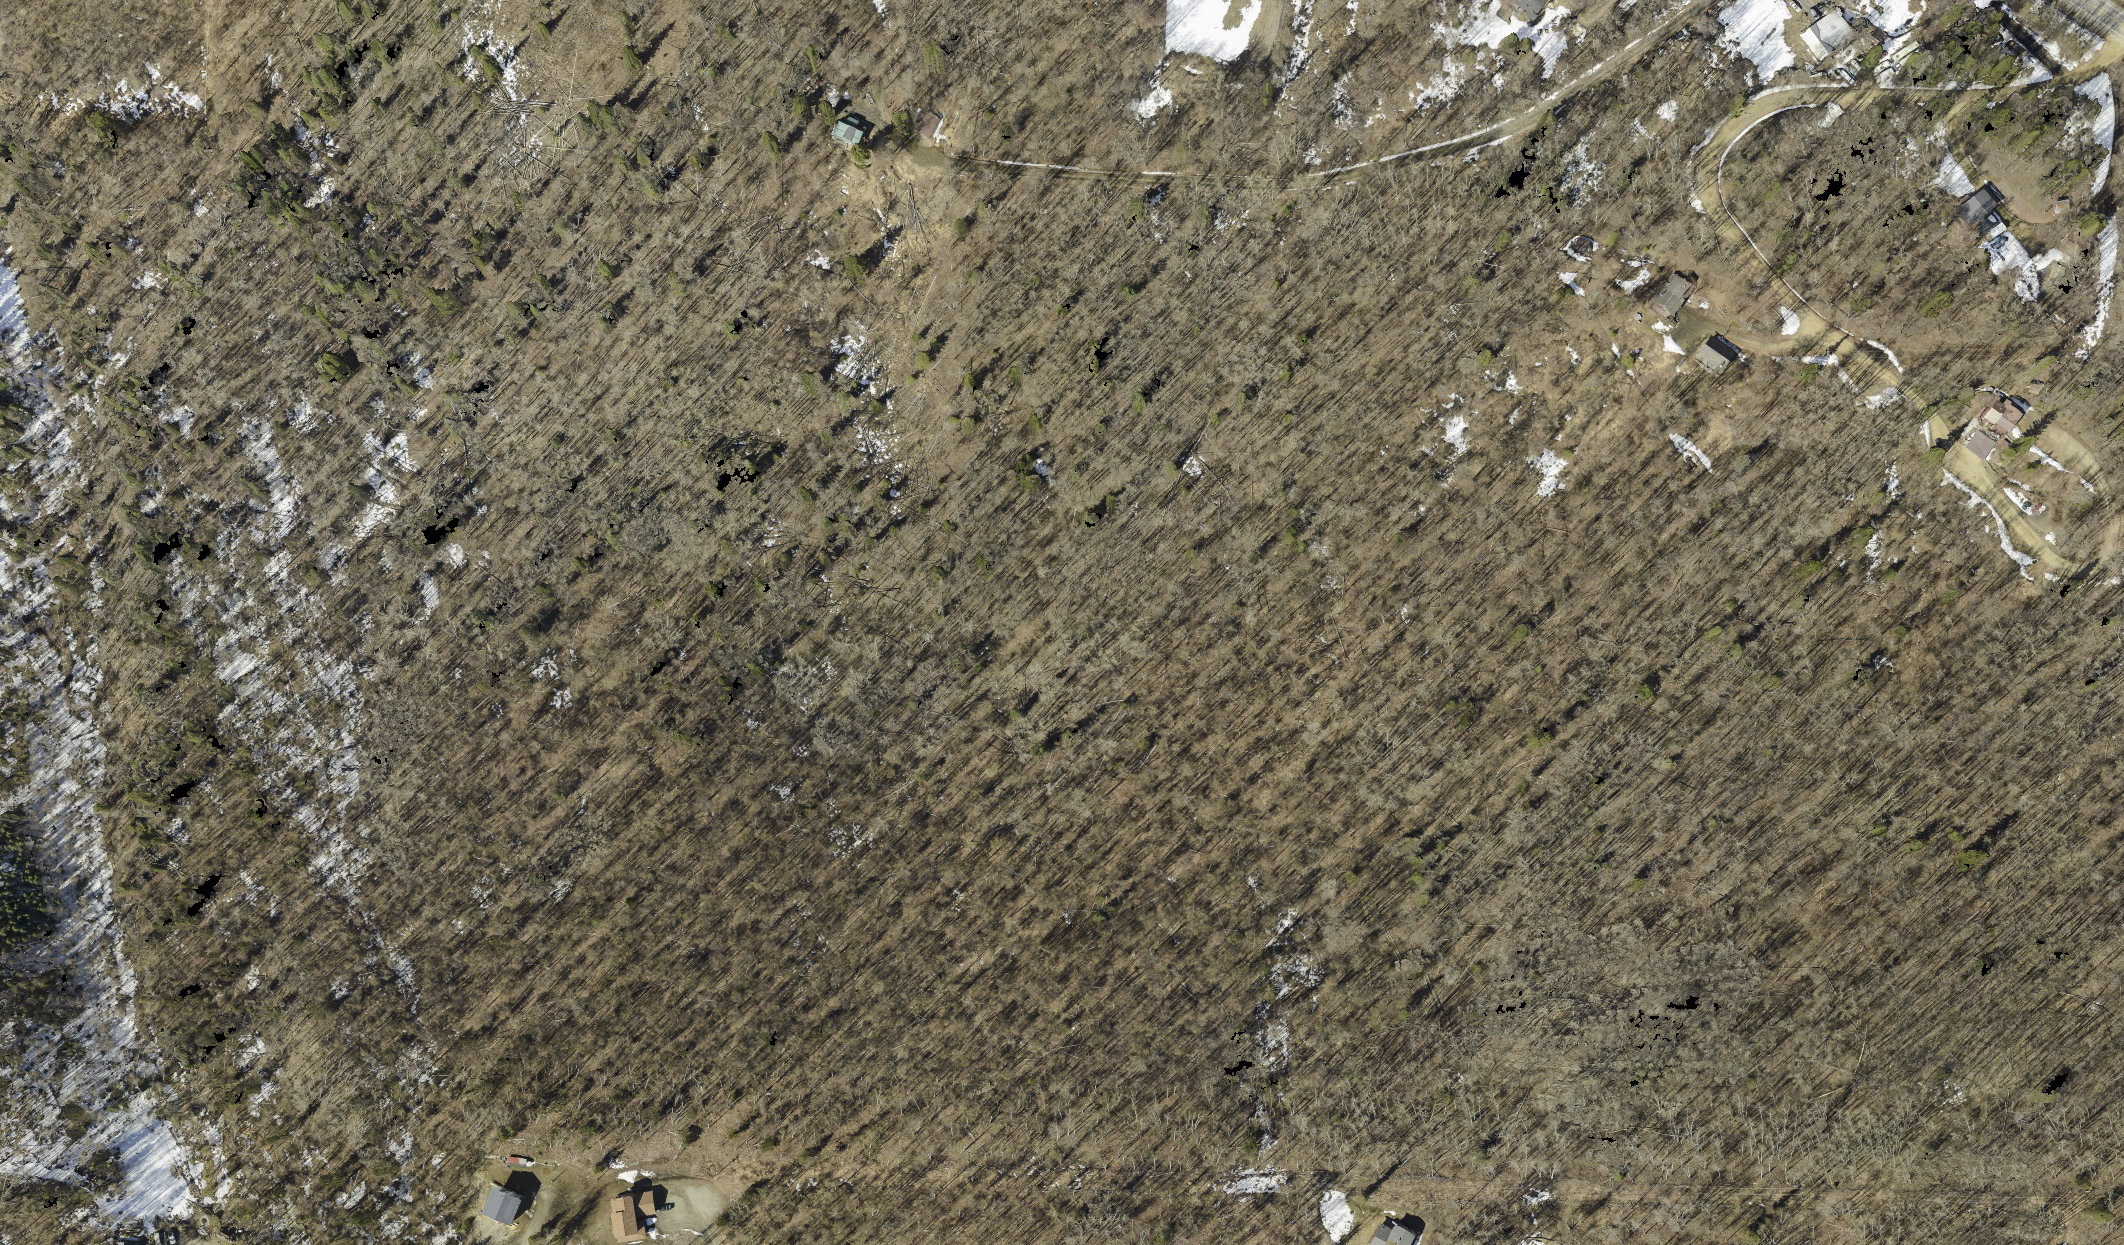
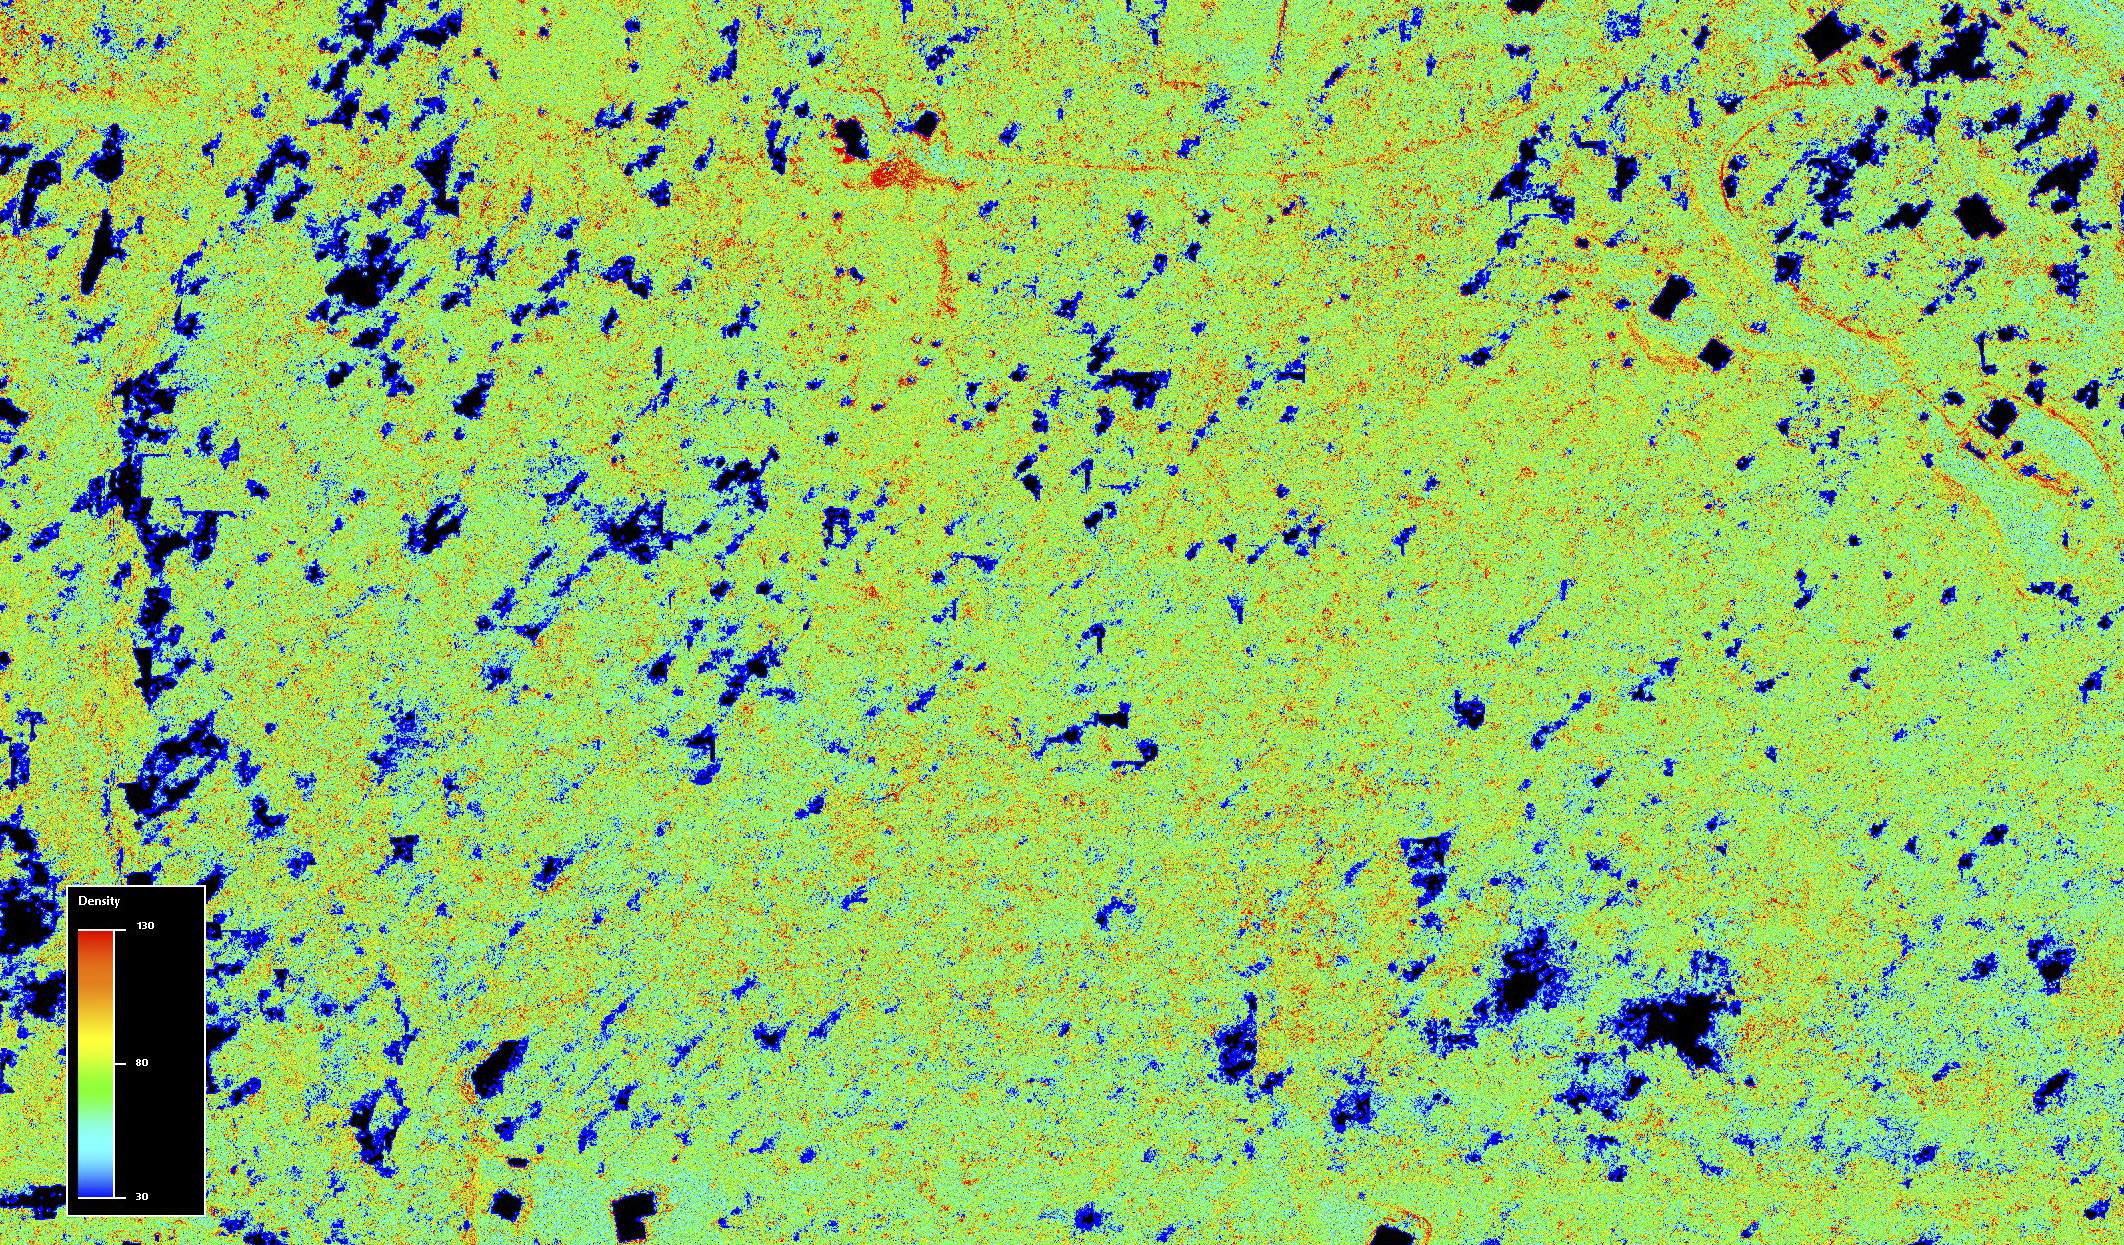
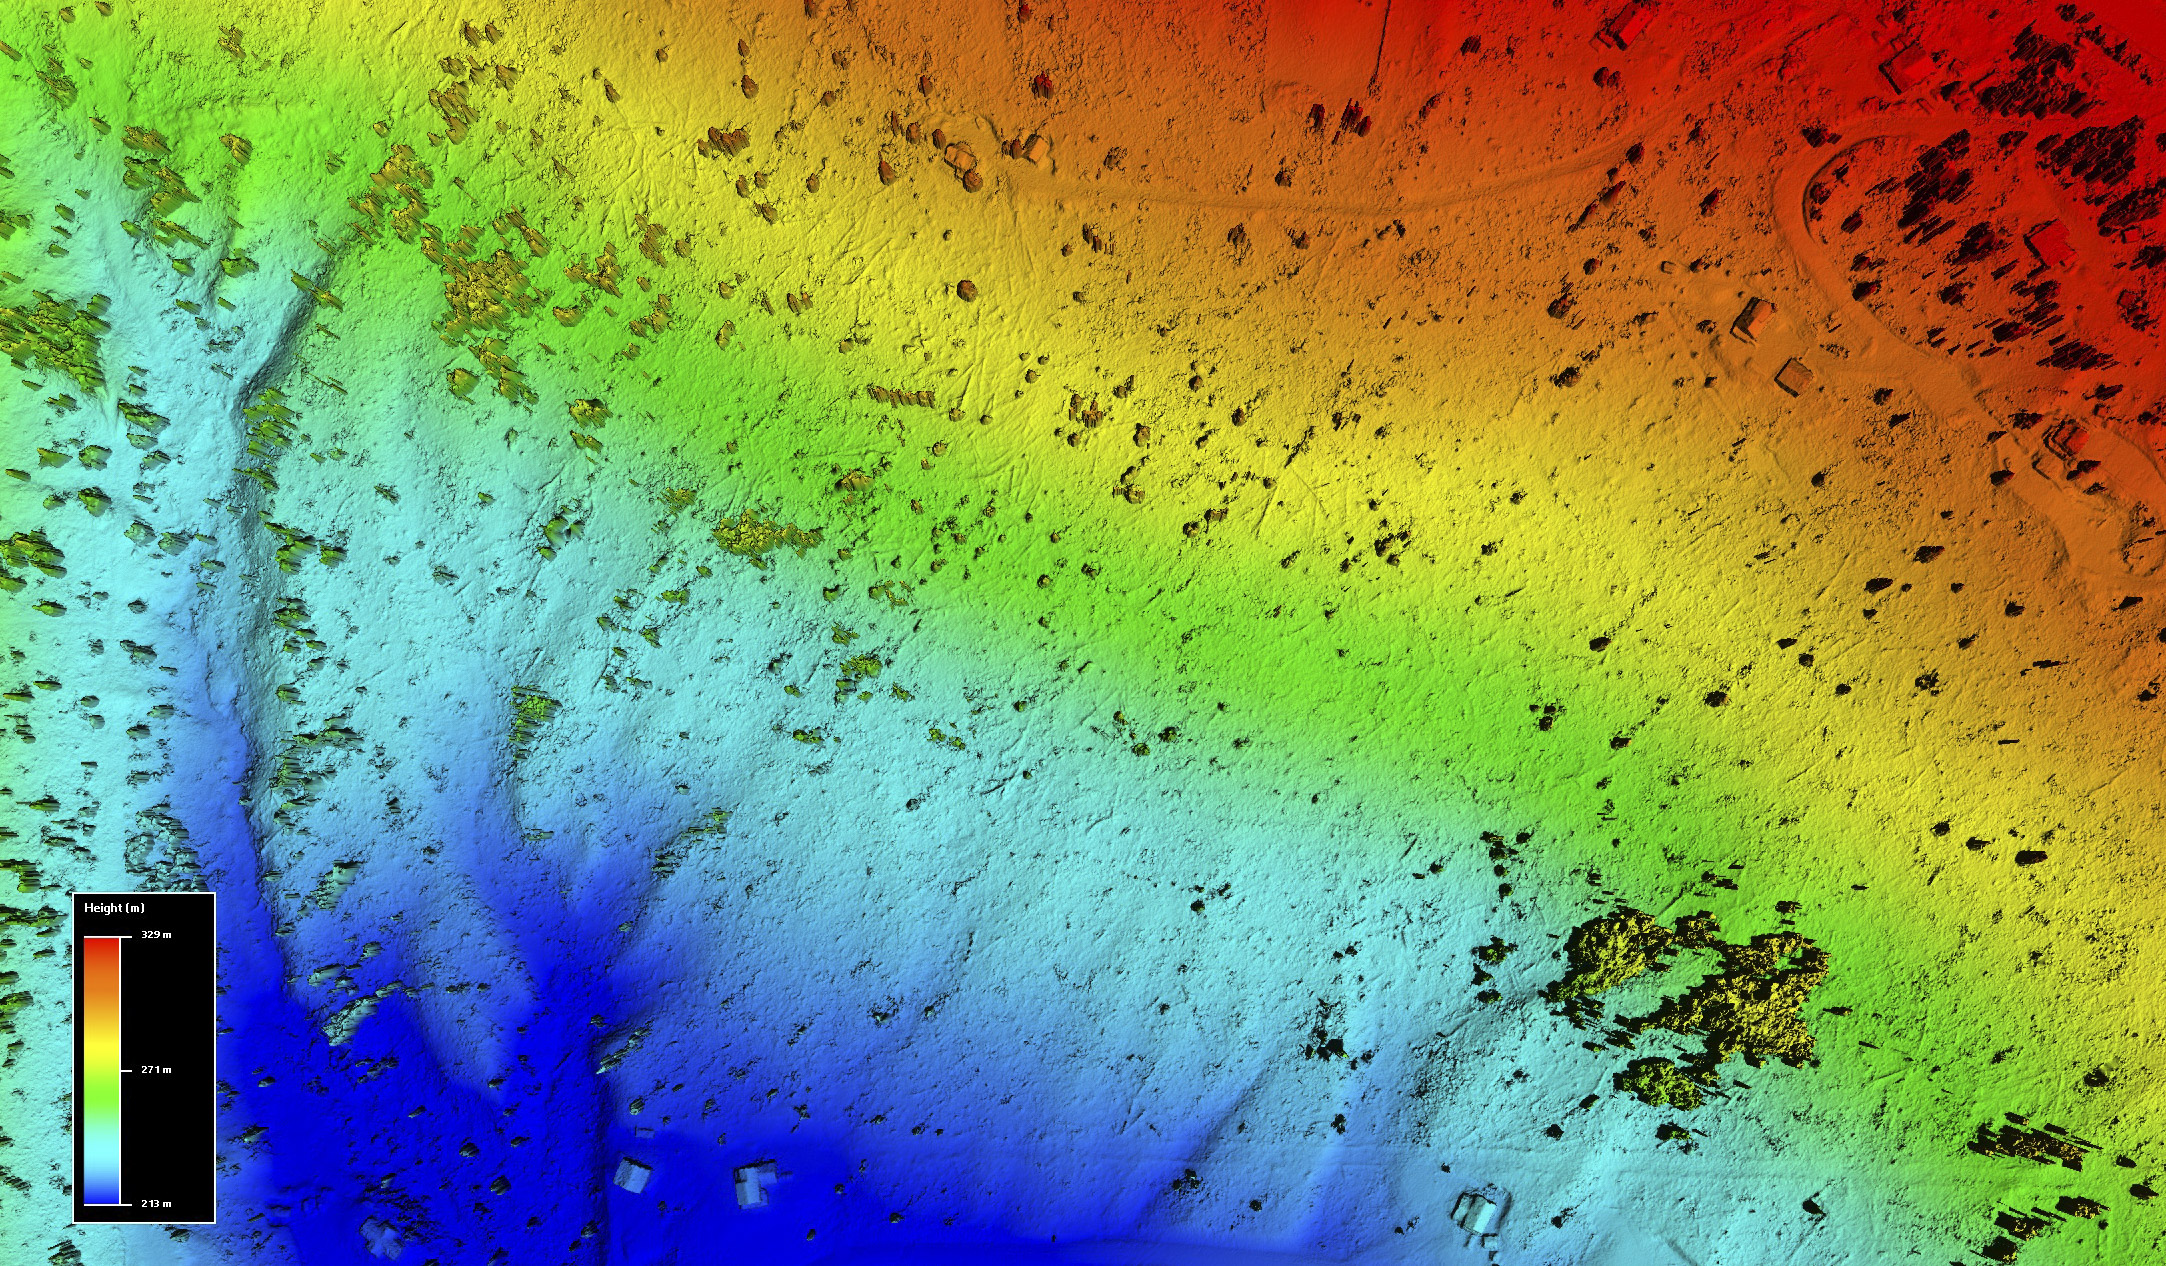
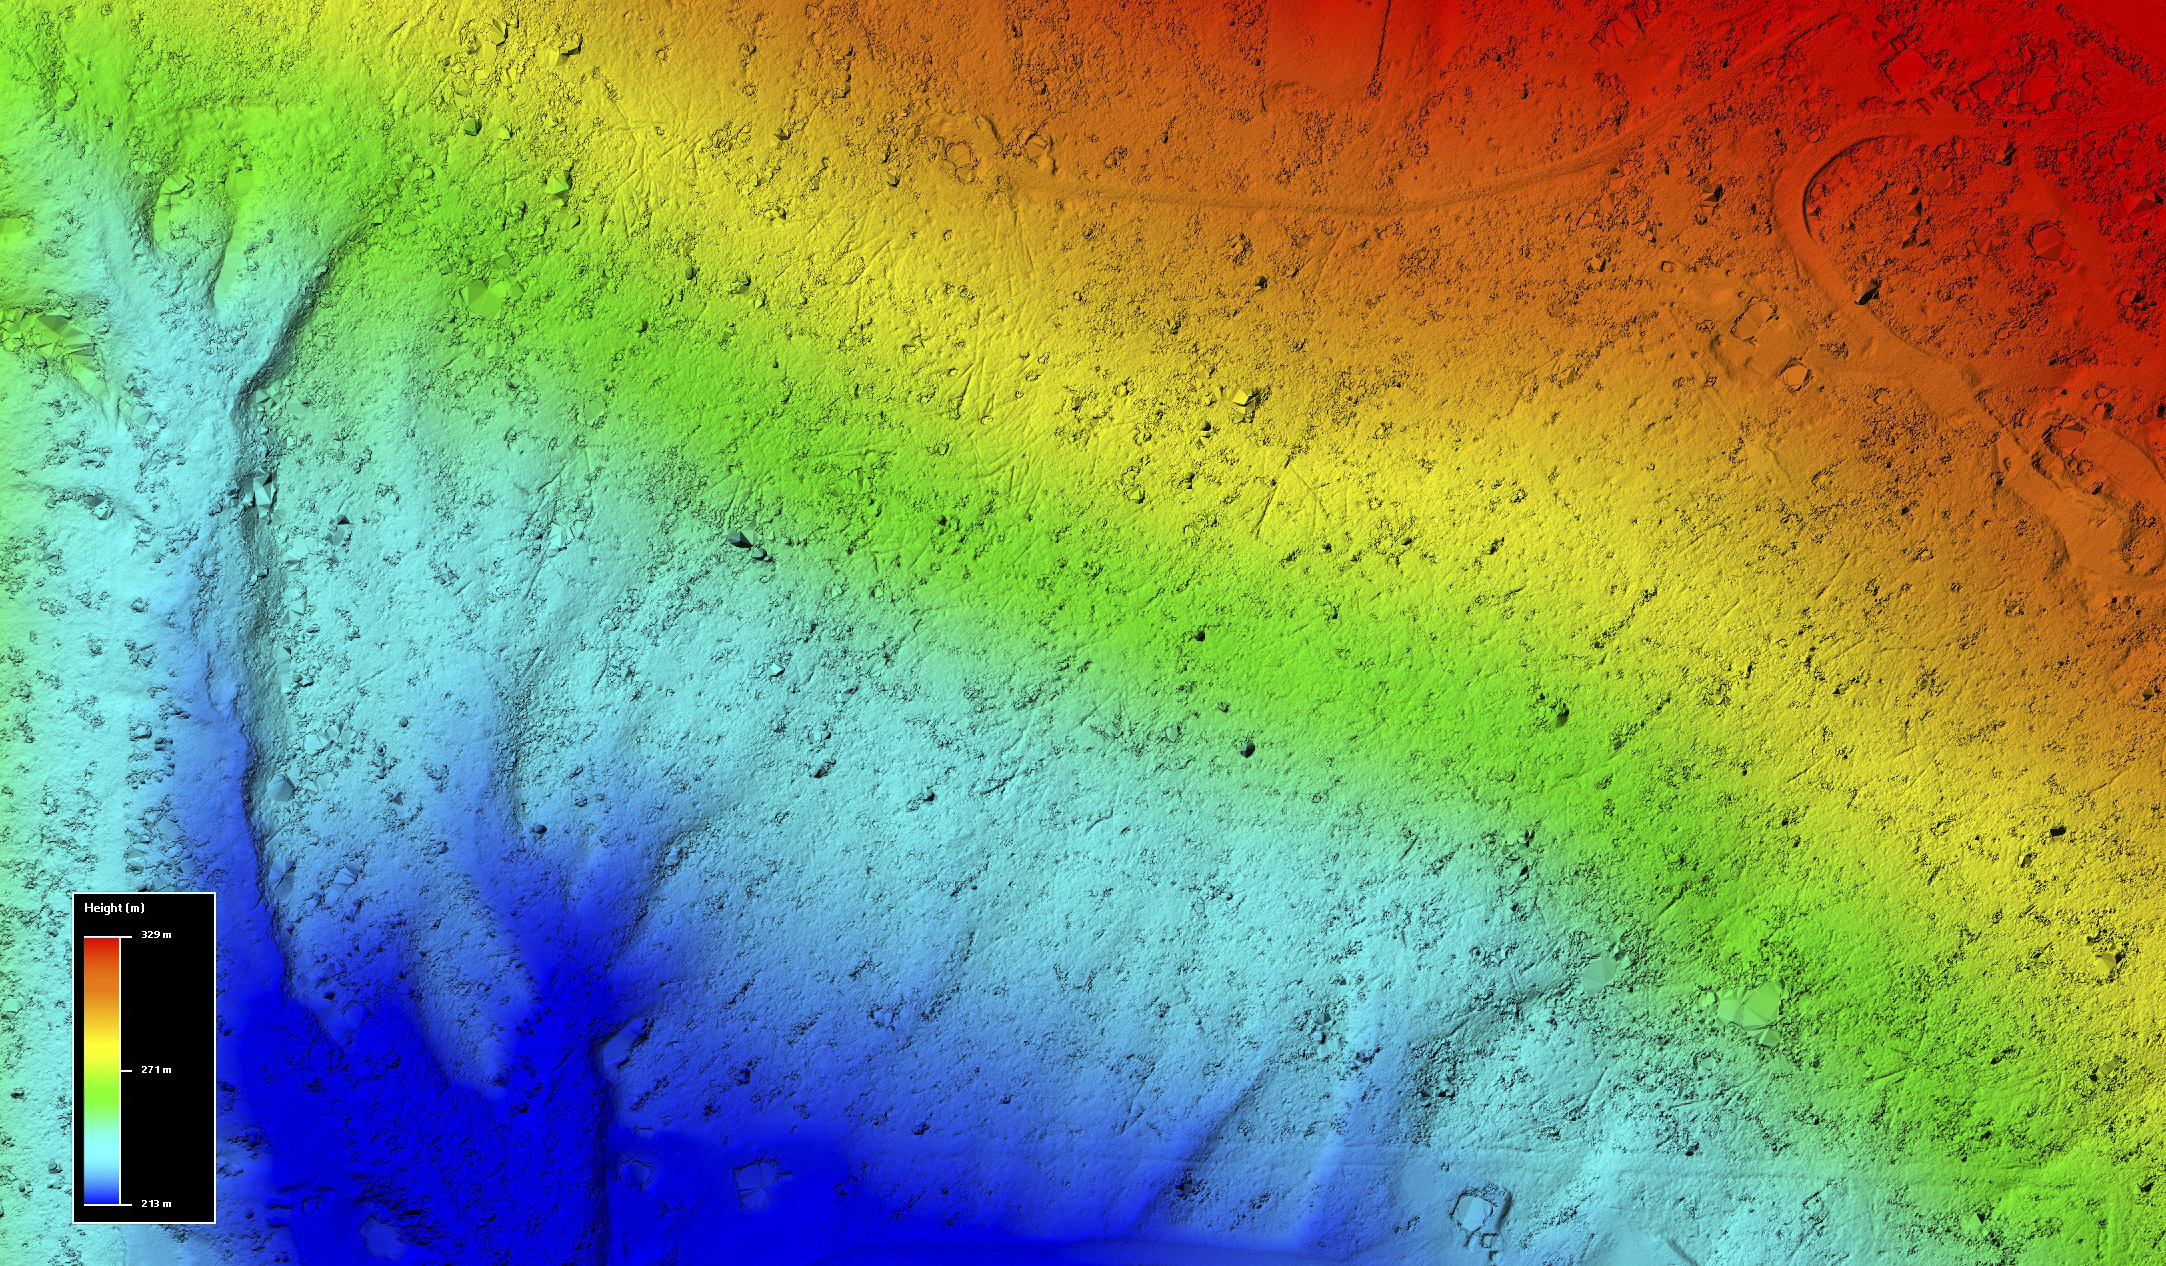
Once we’ve gotten rid of the trees, we can create a digital elevation model (DEM). Imagine a DEM as something like an excel spreadsheet — the rows and columns are latitude and longitude and each cell has a single elevation. It’s more efficient to work with a DEM than a point cloud in many applications because all of the points are on an even grid, not scattered about like a cloud with some parts of the map having higher density than others. As a simple example, imagine we created a DEM with 1 meter posting from this point cloud — the 30 to 130 points within each square meter of the point cloud would have to be reduced to a single, uniform number for each of the 1 m x 1 m DEM cells, which only has 1 point per square meter in this case. The point cloud shown above could support a DEM at a resolution of 10-20 cm, depending on purpose. I created the one below at 10 cm, which also included filling some of the holes left by the trees which were plucked out.

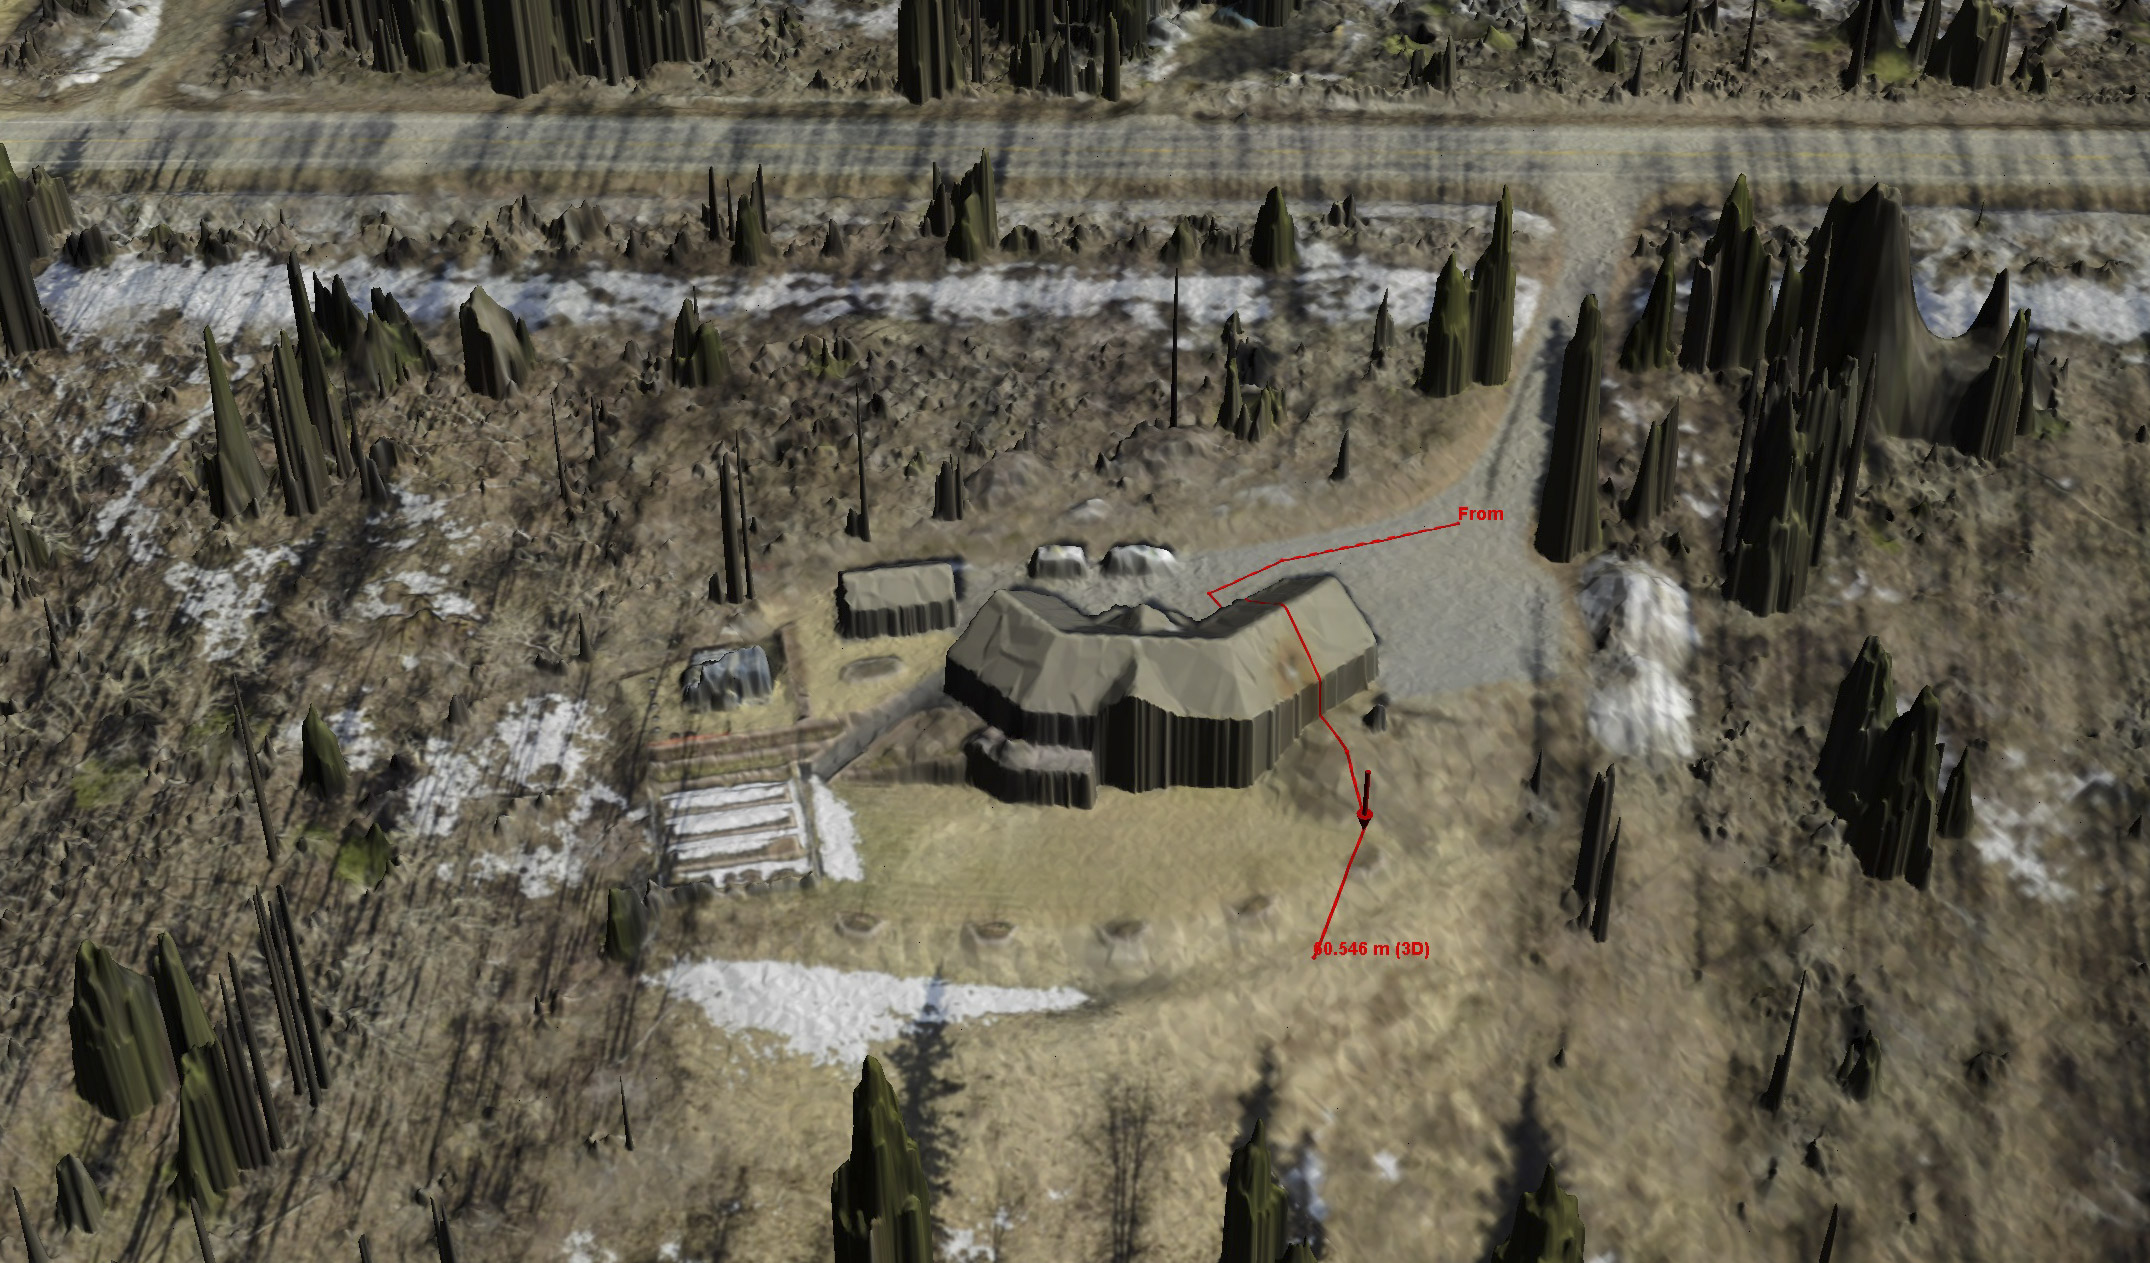
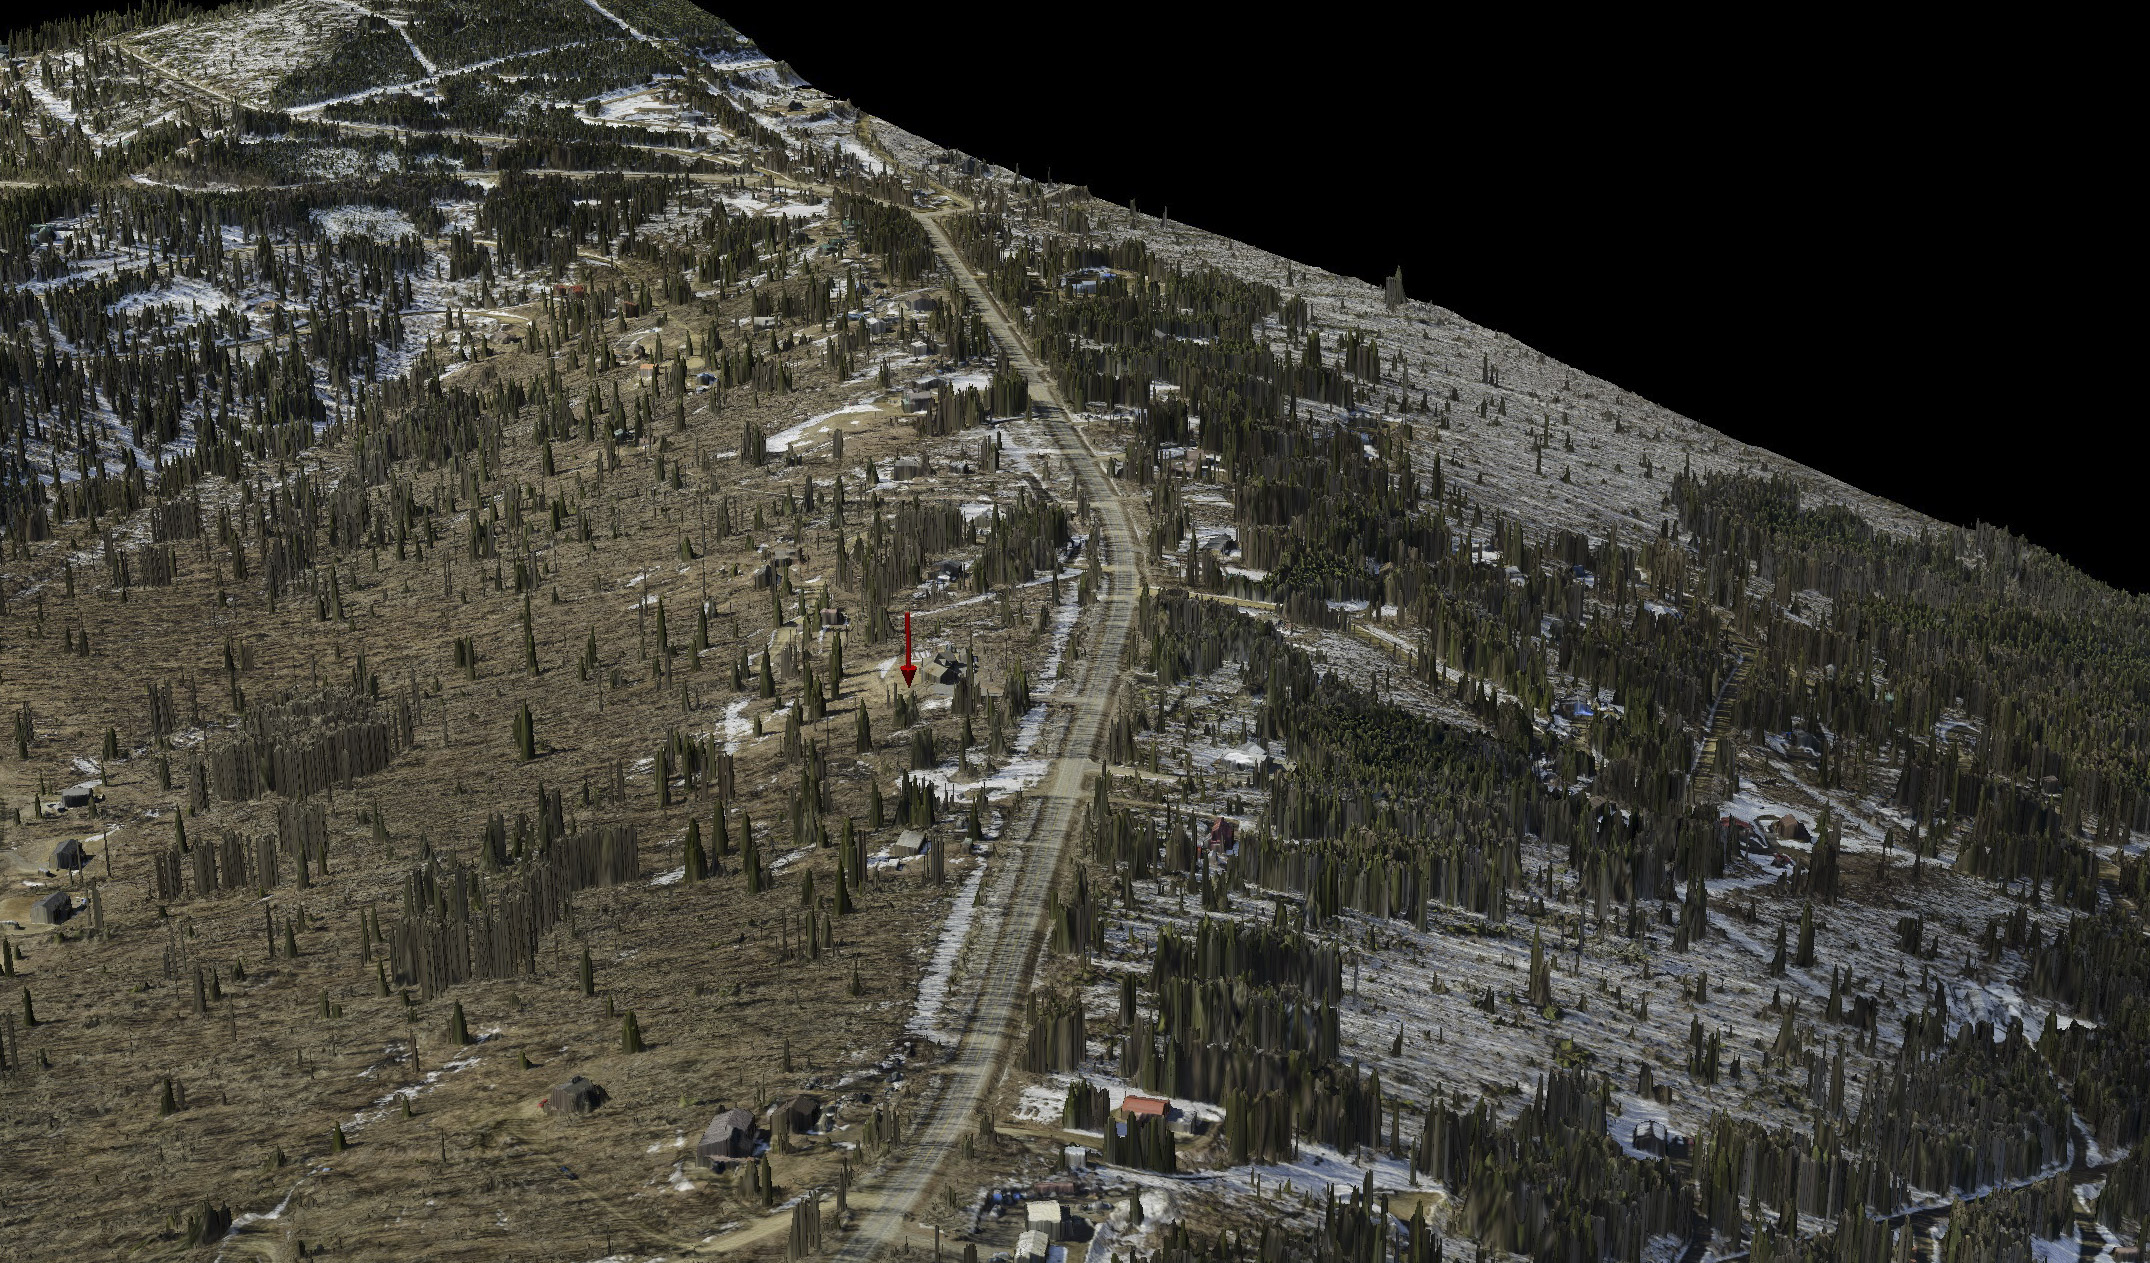
Of course with digital data it is almost effortless to extract elevation profiles, or any one of a hundred useful quantitative analyses. Here is an example of extracting drainage slopes for terrain and roof tops of a house.
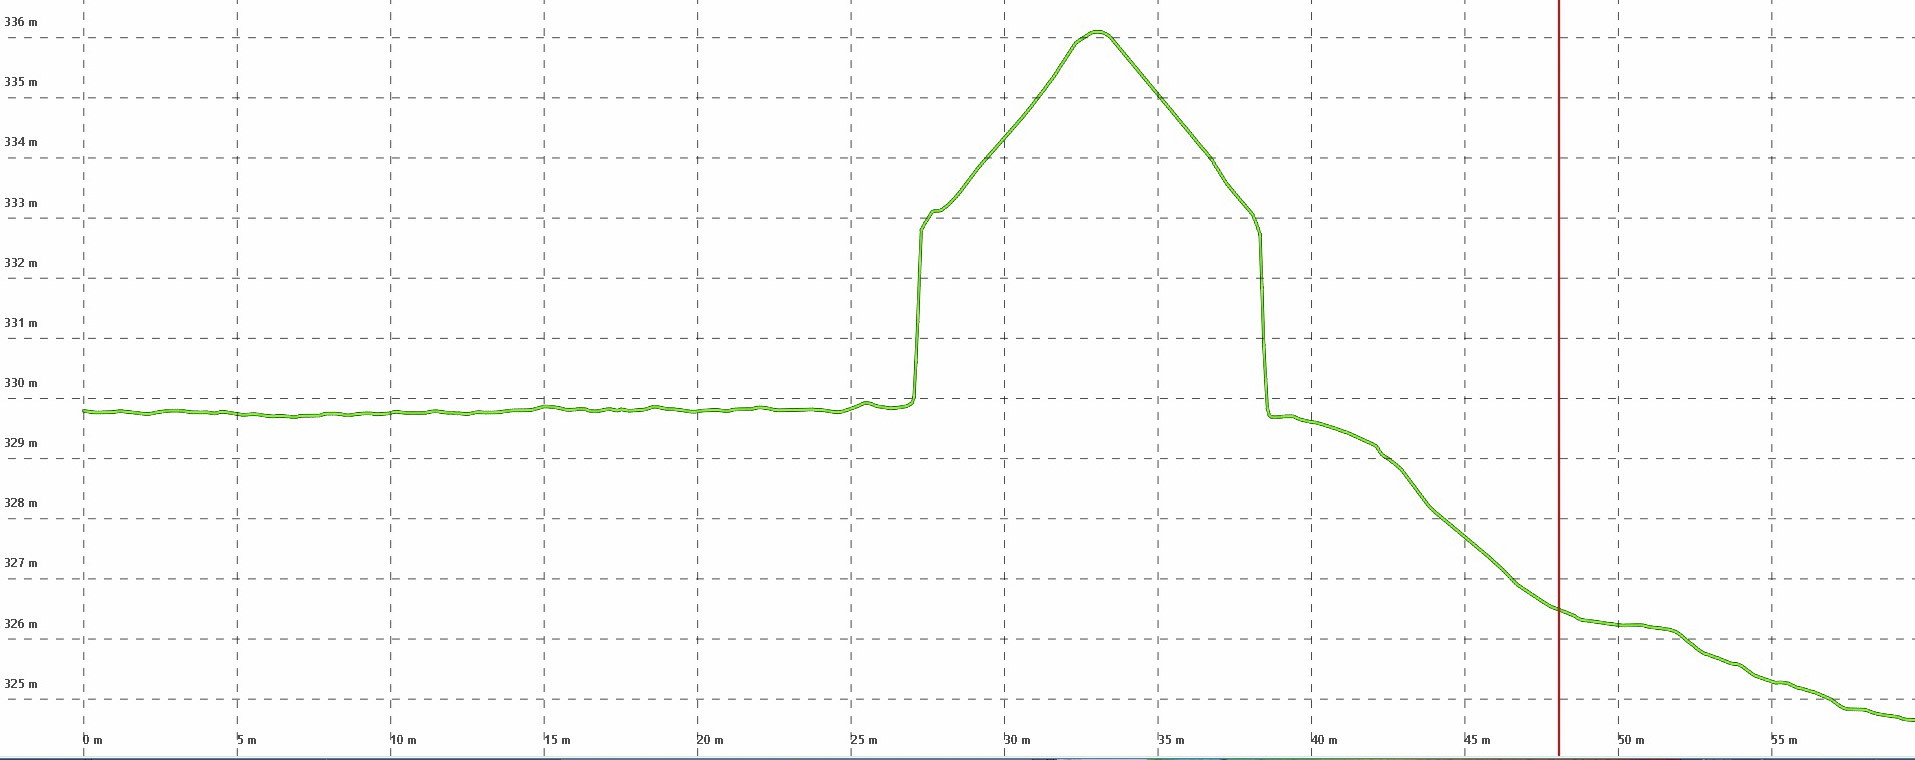 Here are the elevation values extracted from the red line in the image above. The horizontal tick marks are 1 meter apart. The vertical red line corresponds with the red arrow in the previous image.
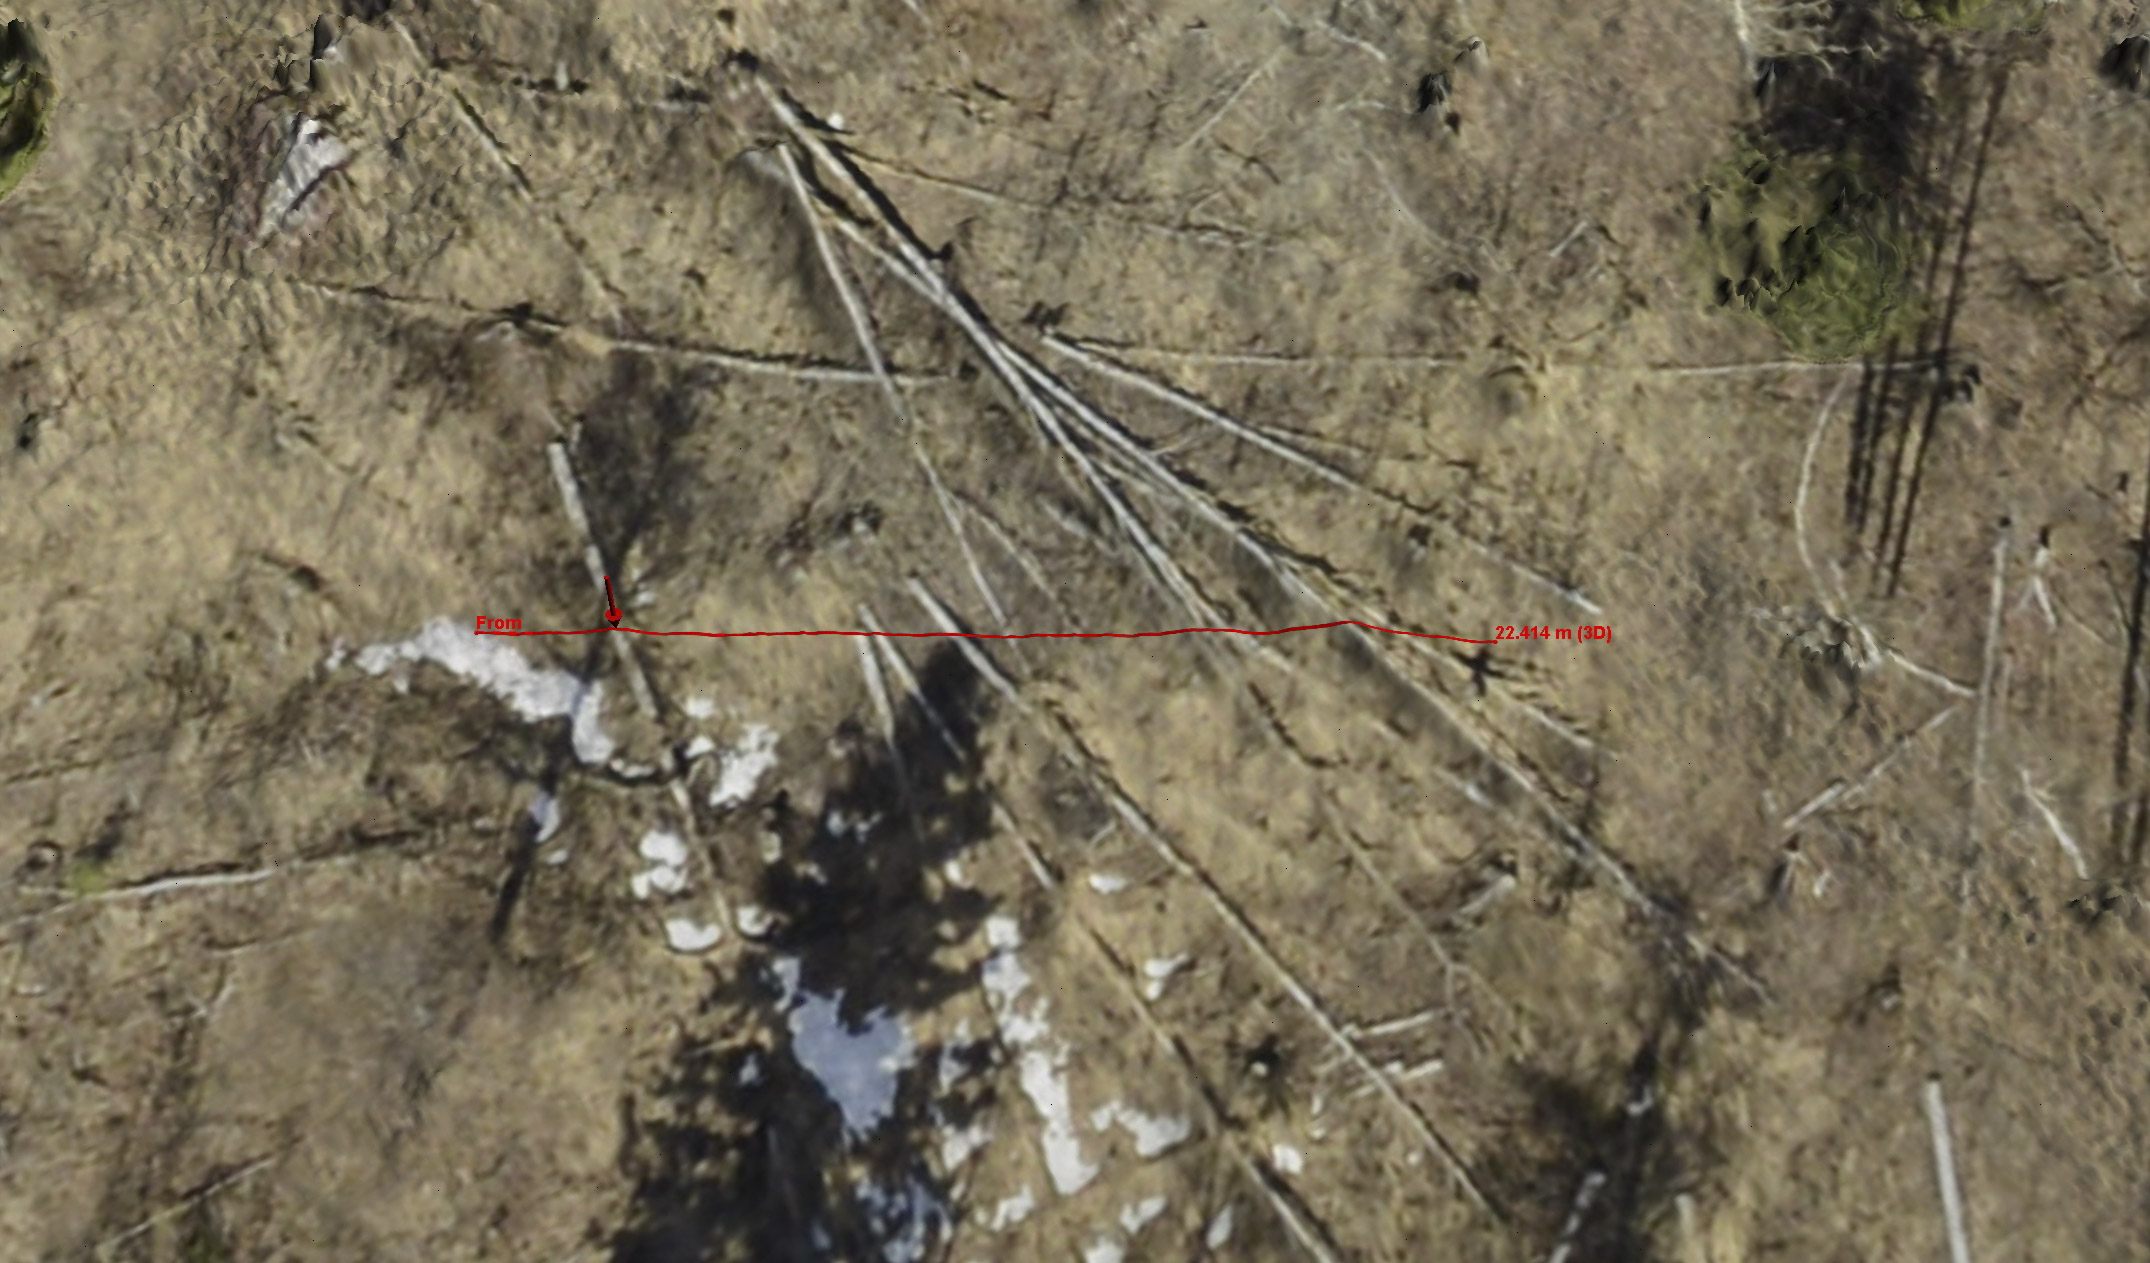 It’s not just big things that can be measured from these data. Here are some downed logs. The image below shows how we can see them topographically.
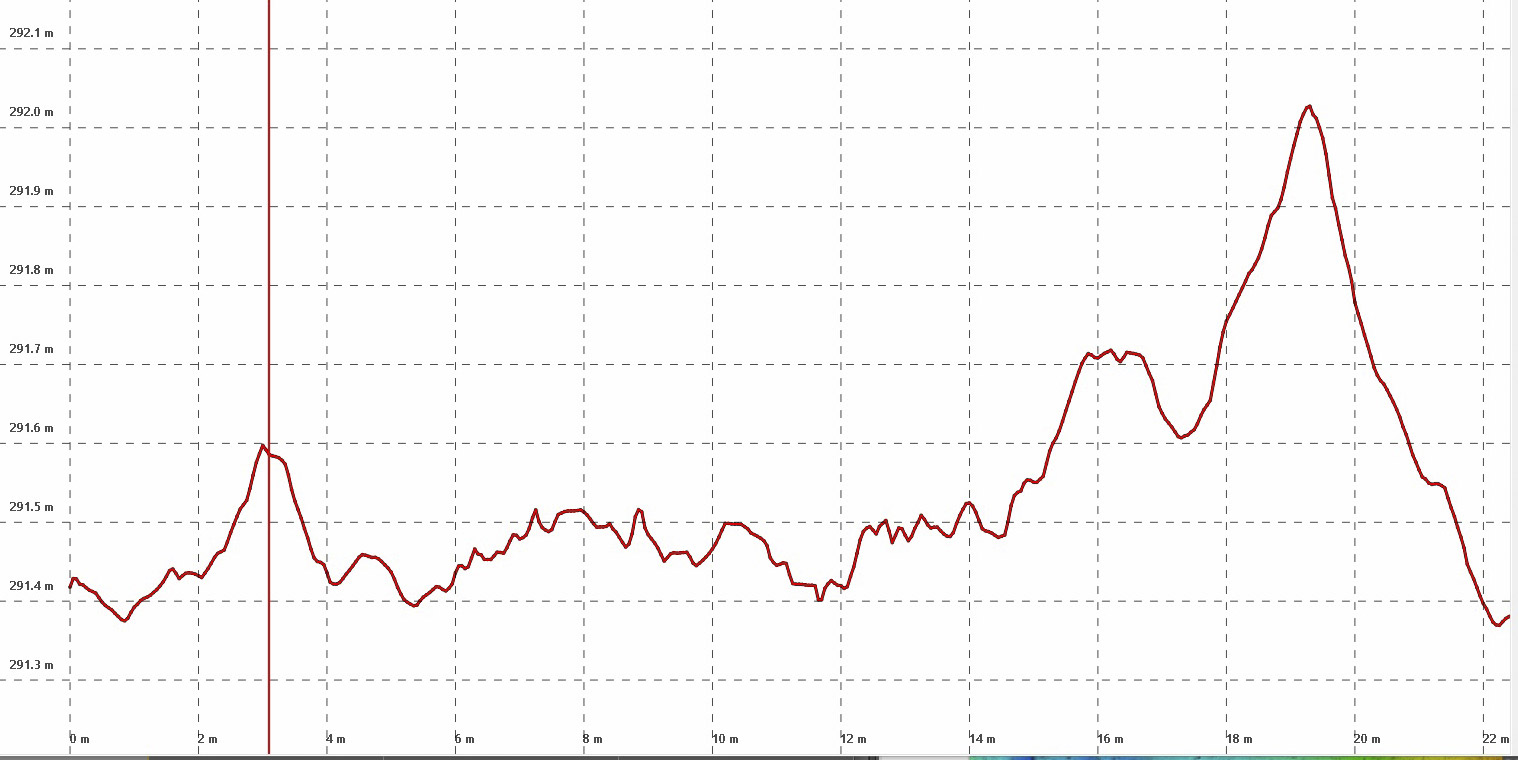 Here is the elevation profile of those logs. The horizontal grid lines are only 10 cm apart, showing that we are clearly resolving the shape of these logs on the order of single centimeters. The accuracy and precision of these particular data remain unvalidated, but in nearly every other fodar project I have done it is always better than 30 cm and often better than 10 cm, and I see no reason why these data should be any different.
So far I’ve been comparing fodar to lidar, but what about drones? Drones are all the rage these days and they are certainly cool– anyone with a thousand bucks can buy a drone that can make maps similar to these. The technique is basically the same, it’s a form of airborne photogrammetry that I call fodar. The major difference is the skill of the operator and the type of equipment on board — most drones do not have the same level of photo positioning accuracy that I have in my plane. I know where my photos are to within 10 cm, drones are more like 1-2 meters. Thus to achieve the level of accuracy of my fodar, drones require extensive use of high-quality ground control. That means running around with a survey-grade GPS on the ground, measuring a bunch of natural or artifical targets, then manually hunting through hundreds of photographs to find those targets and tell the software their coordinates. All of this adds cost and hassle, and for remote locations this can be a tremendous cost and hassle. So again in terms of what’s ‘best’ for an application, consider that mapping an area this large (2-3 square kilometers) by drone would take 2-3 people all day at best and would require substantial ground control. In my airplane it took about 30 minutes. Plus this particular location is within 5 miles of an international airport that’s also home to 300 small aircraft, so regardless the difficulties of obtaining permission to use a drone here, there is a real safety issue. Drones often boast 2-3 cm ground sample distance (the size of a camera pixels in realworld units), but who really needs this? The data I obtained were at 6 cm GSD, resulting in a point cloud with a mean density of over 100 points per meter squared (ppsm). I would guess that 99% of all surveyors using these data could not handle this density of points within their software that plans roads and plats, and that all of them would downsample it considerably. That is, my 100 ppsm from 6 cm data is way overkill already for most applications.
So all of that just to say that fodar can be an awesome tool for measuring canopy heights, ground elevation beneath the canopy, and tree or forest morphology. It’s not necessarily the best tool for every application, but for many applications, if not most, it is a worthy contender.
 Here we can clearly see the impact of solar aspect on the rate of snow melt in early spring. In Fairbanks, this aspect also seems to have a direct impact on property values…