

On the Relationship Between Oil and Snow in the Arctic National Wildlife Refuge
About a month ago I mapped snow cover of about 1/3 of the 1002 Area of the Arctic National Wildlife Refuge and here I present some initial processing results along with some thoughts on its implications for oil exploration. While there are many great reasons to measure and study snow pack in this area, in this blog I’m focusing on it’s value in conducting winter seismic measurements which measure the subsurface geology, which is funded primarily to locate oil reservoirs but also supports a better understand the fascinating geologic history and modern dynamics of this actively deforming region. In short, I measured a lot of snow-free ground at the peak of winter snow pack, raising important questions about the economic and environmental viability of the proposed overland seismic methods that require a suitable snow cover to protect the fragile tundra underneath from vehicle damage.
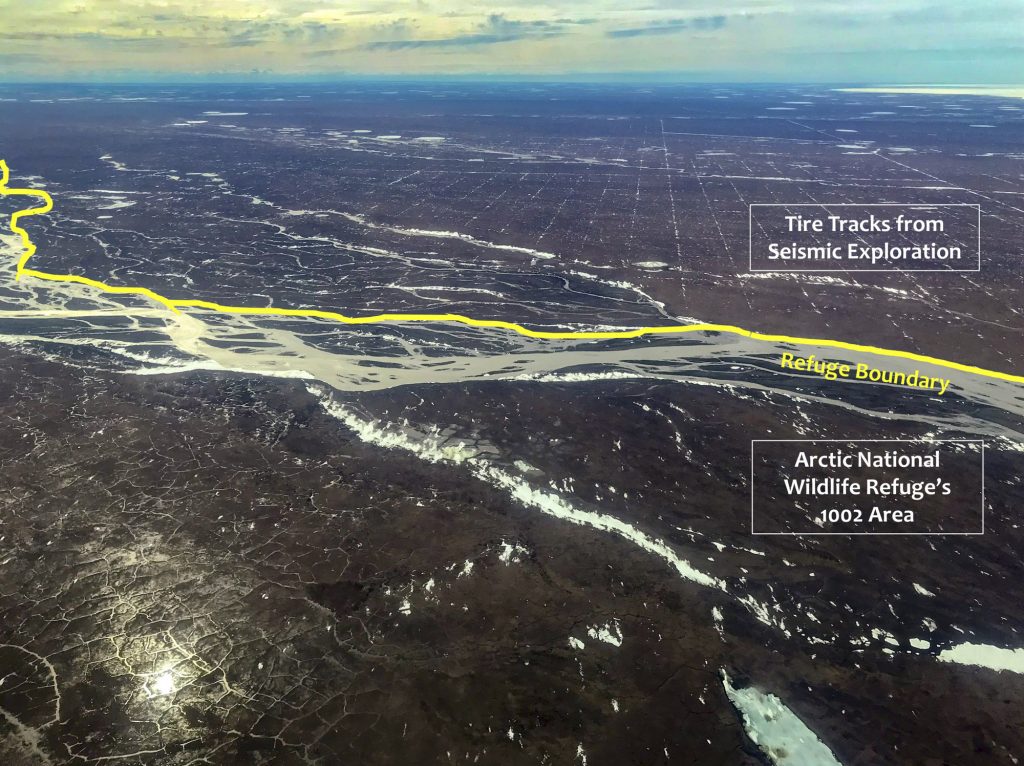
The methods proposed to conduct this seismic work are not without risk to the fragile tundra of the 1002 Area. In the oil fields to the west, the typical — but not only — method is to drive heavy vibroseis trucks (often called thumper trucks) over a grid pattern, such that the acoustic waves they send out echo off the subsurface geologic formations and then are recorded on geophones. The time it takes these echos to be recorded are then converted into depths using the speed of sound. To limit or prevent damage to the tundra, the trucks must work in winter when the tundra is frozen solid and sufficient snow cover exists which prevents direct contact with it. While most studies of the long-term impacts of these methods document enormous impacts of this method on tundra (such as this one or this summary), they are nonetheless in regular use today and apparently do not cause immediate, obvious damage when all is going as planned, though what is considered ‘damage’ seems to be poorly defined at best. The point I have been trying to make over the past year is that the 1002 Area has some important differences to the oil fields to the west — it is not flat but very lumpy and the wind regime is different here, therefore the snow pack and wetland dynamics are both qualitatively and quantitatively different and less conducive to these methods. The permafrost itself may also be different here — the signs of surficial thaw are ubiquitous, indicating that the terrain is more susceptible to disturbance than it was 30 years ago, or even 5 years ago for that matter. Thus I have been mapping it using my system in an effort to both highlight these issues and demonstrate that these tools can contribute towards responsible decision making.
The general idea behind my measurements is this: I measure the topography in summer, I measure the topography in winter, and then I subtract the two and the resulting difference in topography is snow depth. That’s an oversimplification, but the details are irrelevant to this blog. I can do this over huge areas efficiently — despite persistently poor weather in two weeks in March/April this year, I mapped well over a 1/4 of the 6000 km2 of the 1002 Area at 5″ spatial resolution. That’s an area about half the size of Rhode Island with sufficient resolution to see if you are texting while driving. I measured the entire 1002 Area last summer, so now my goal is to subtract the summer data from the winter data to determine snow depth. To my knowledge, which is reasonably good on this subject, this is the most massive snow thickness measurement ever in Alaska, and possibly the world, with some tens of billions of measurements.
The value of these measurements to the oil industry is that without suitable snow cover, seismic work cannot proceed using it’s preferred methods, and without seismic measurement oil drilling becomes a much riskier prospect, like the dry hole that has already been drilled here. While it remains unclear how thick the snow needs to be to protect the tundra from overland travel by these heavy vehicles, most permits require 6″-9″ as the minimum, though in federal lands it appears there is no actual minimum: it’s a ‘performance-based standard’ done by the operators in the field… Is the snow suitably thick here? Well, that’s the $64M question — we don’t know because there has never been a spatially-distributed, multi-annual characterization of snow pack here — my measurements are the first such measurements on this scale. However, I would not being doing it on my own unless I thought there was an issue — my 16 years experience working in this area, as well as that of others, has led me to believe that typically the snow is much thinner than this and that much of the ground is often snow-free in winter due to wind scour. As I show below, that turned out to be the case again this winter.
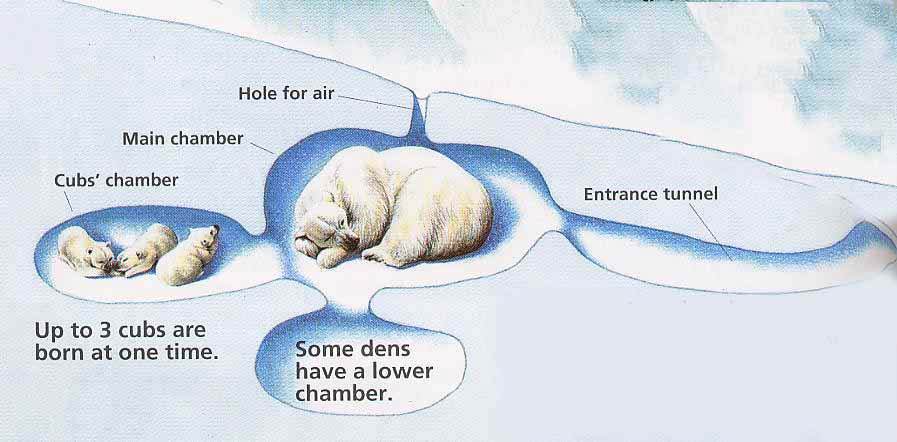
One issue with such dense lines traveled by heavy vehicles is that the probability of crushing polar bear dens increases. Here is a graphic from a website on polar bear denning that gives the general idea of how polar bears use snow drifts for their dens. Experienced polar bear scientists walking above these dens attempting to find them have collapsed through their roof — imagine what a convoy of 5 ton thumper trucks would do. You can learn more about the threats to polar bears from this method of seismic work here.
The Data
I’ve only processed about a quarter of what I mapped out there, but it was so exciting to me that I wanted to share it now because I think the stakeholders involved might appreciate having this information long before next winter, to prevent surprises and additional expense and hassle, as it will likely take a few more months to complete all of the processing in my spare time.
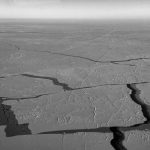
In short, I found a lot of bare ground, or barely covered ground. That is, I don’t need to do my full winter-minus-summer processing tricks to determine snow depth — I know that snow depth is zero across massive areas of this landscape because I can see the bare ground! The snow depth is zero not because it doesn’t snow here, but because the pervasive strong winds coupled with the irregular topography and lack of stabilizing vegetation simply scours the snow away. This wind blown snow either redeposits to form the deep drifts that polar bears build dens in or it simply sublimates into the atmosphere and gets carried away.
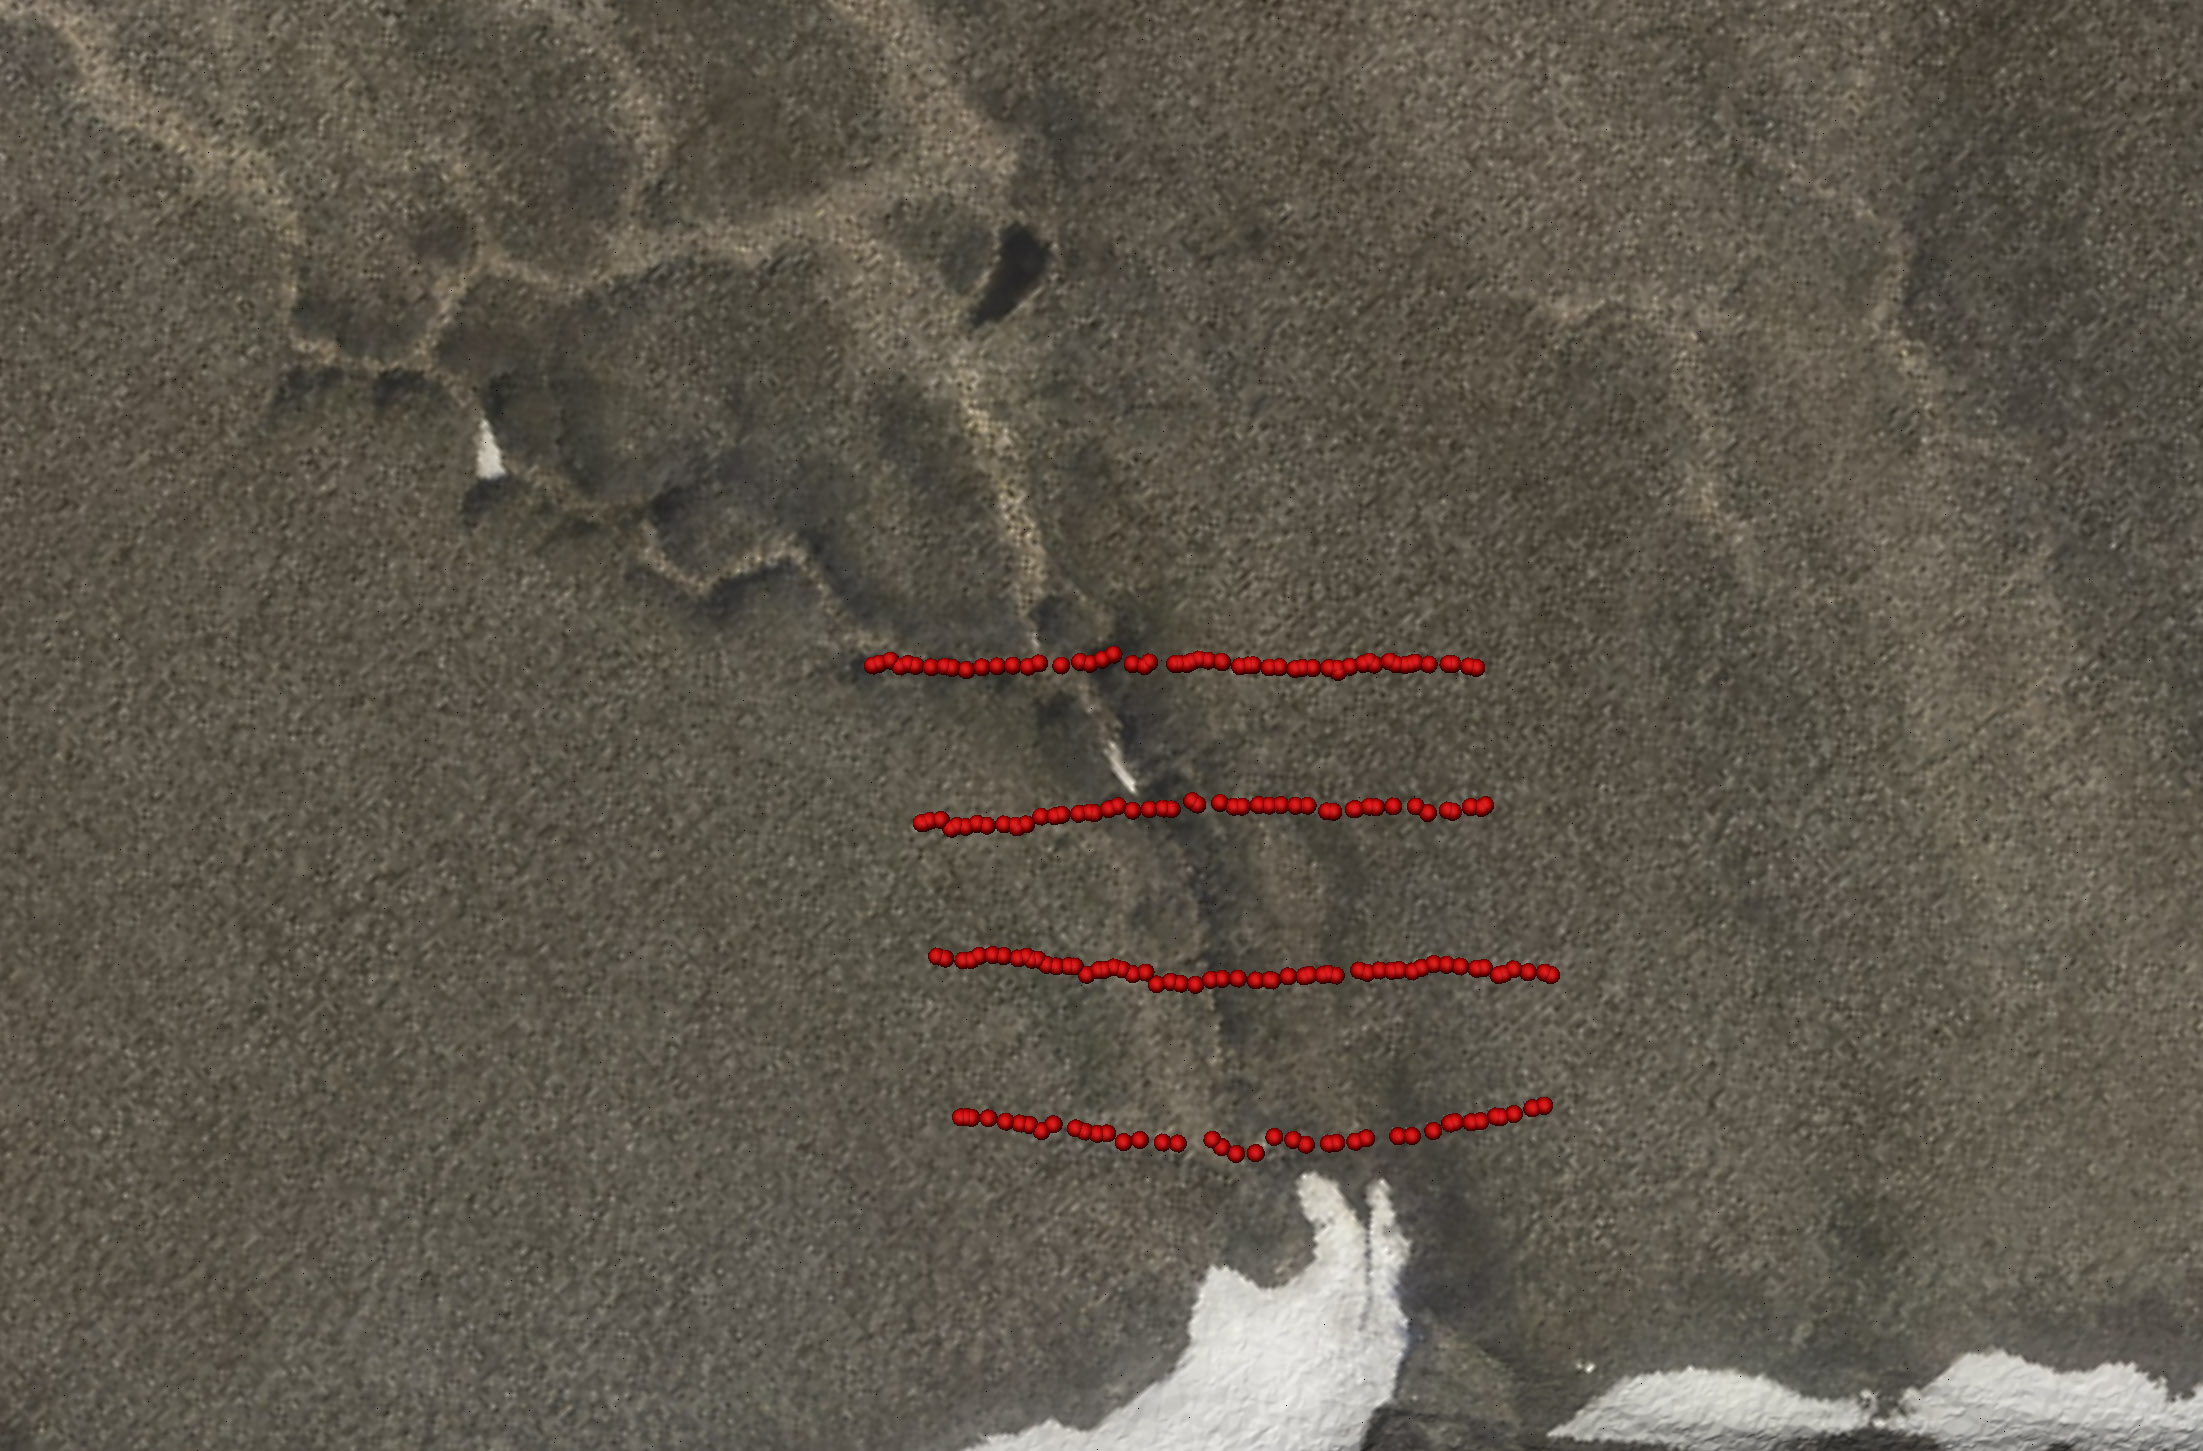
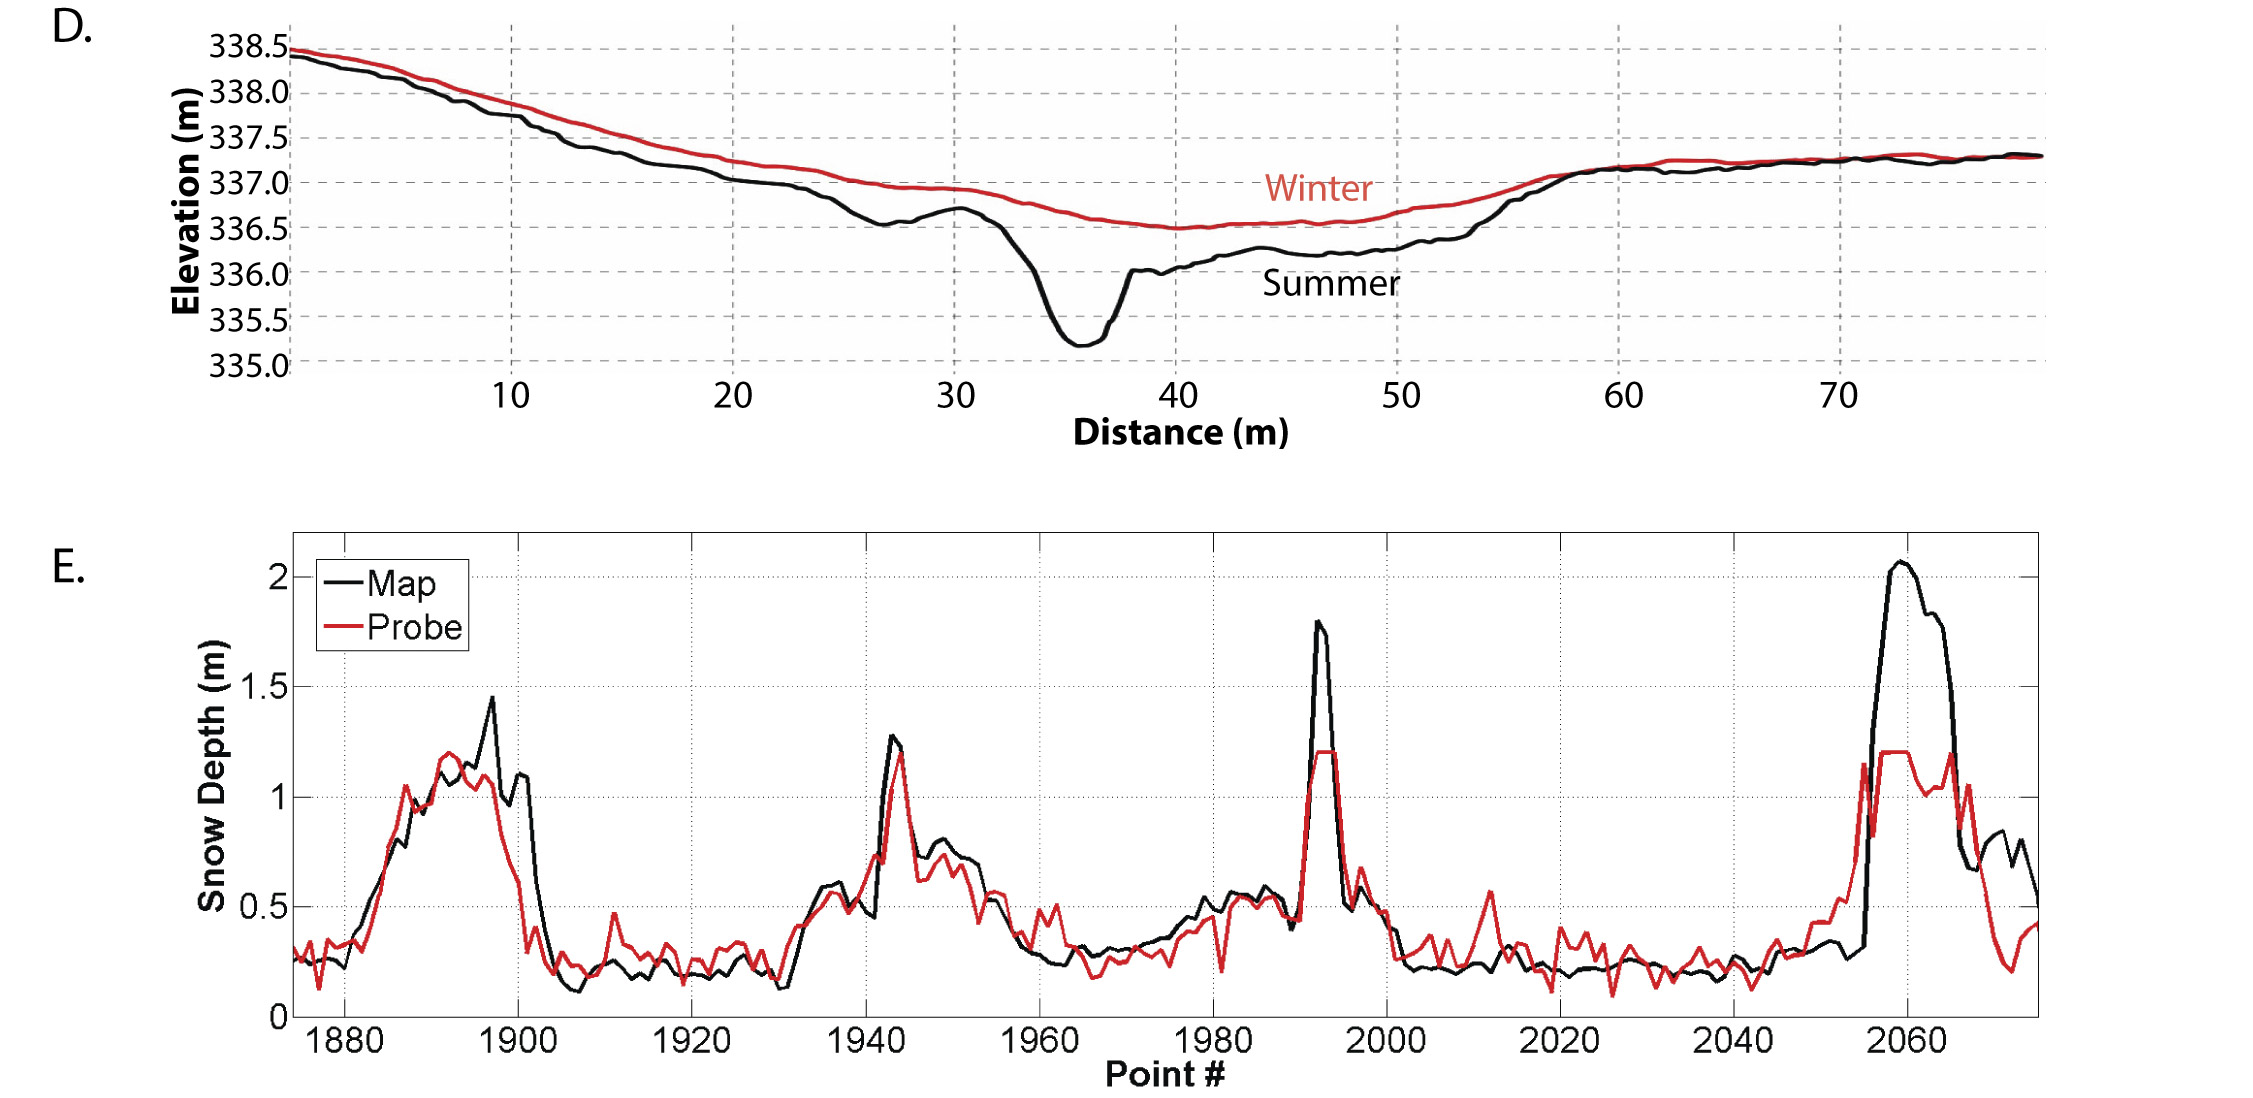
An important use for these data is to determine the suitability of this snowpack for use by convoys of large vehicles full of seismic and support gear. Given that the current State guidelines indicate that at least 9″ (23 cm) of snow cover must be present, it would be nice if my technique was accurate enough to measure snow to this level. I already know this to be the case, based on lots of prior experience; you can learn more about related snow-measurement projects in my initial paper on snow, my measurements of the tallest peaks in the US Arctic (paper, blog), and my blog on the measuring the height and glaciers of Denali, the tallest mountain in North America. But it’s always nice to validate each data set, so below I demonstrate that my April 2019 fodar maps are of sufficient quality to measure the smallest of snow drifts. I do this here in a qualitative way — I don’t have any measurements on the ground to compare to, so I try to find features in the image that I recognize and then confirm their topographic shape is as expected. That is, it is not necessary to perform a full ground validation study (like in the examples above) on every project, if the system is functioning properly and no blunders occurred in processing, then confidence is high that prior validation results apply.

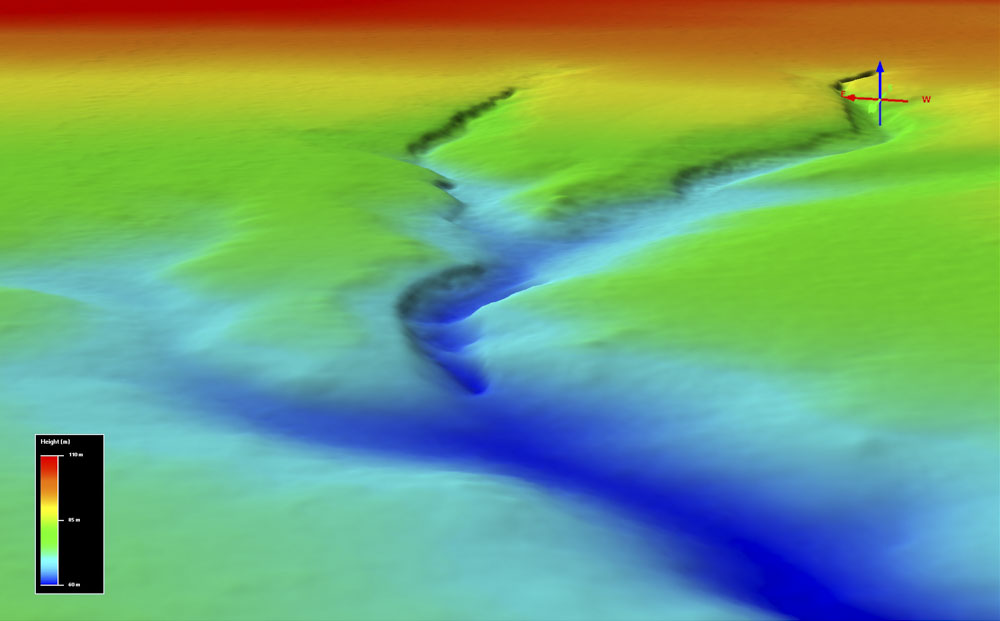
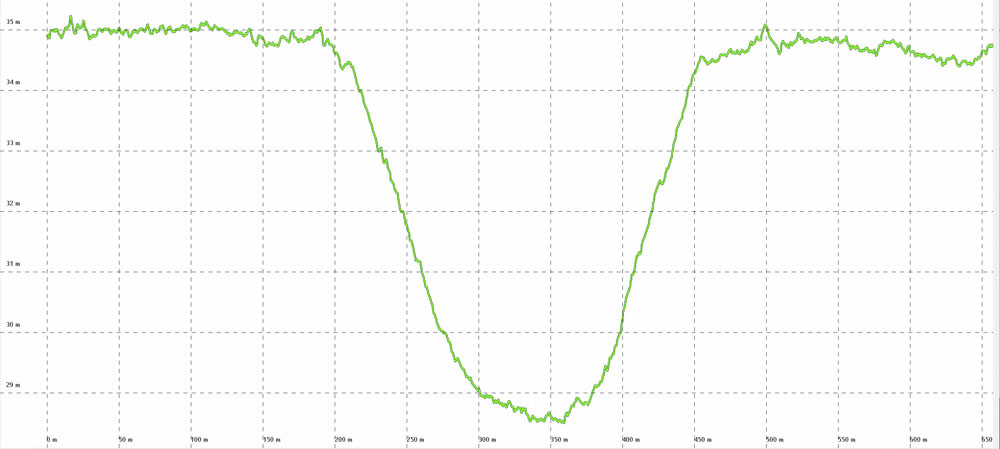
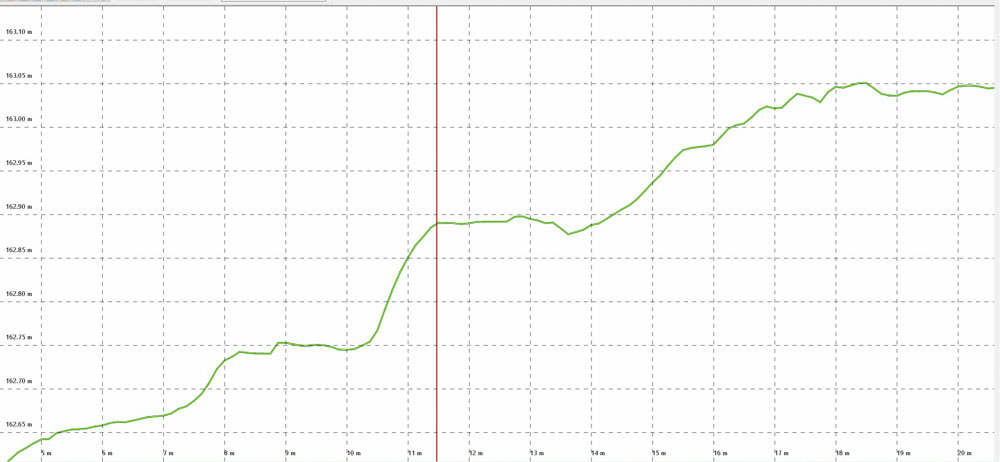
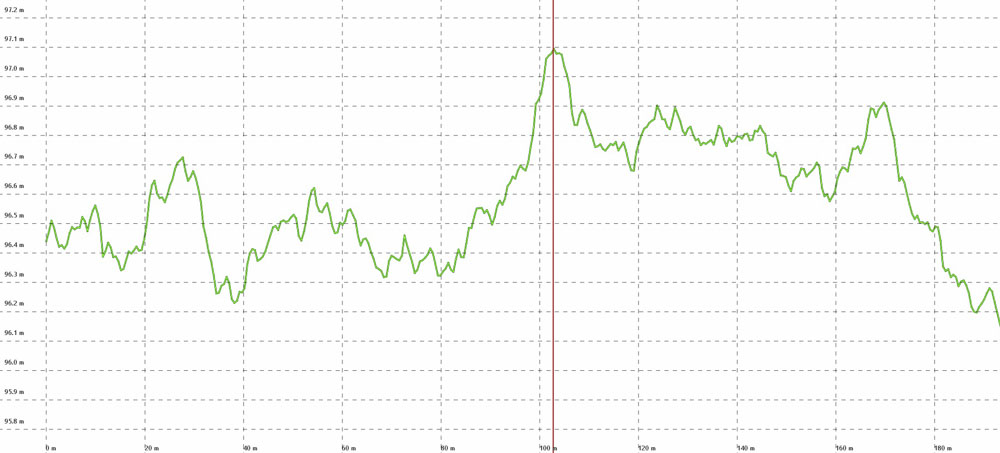
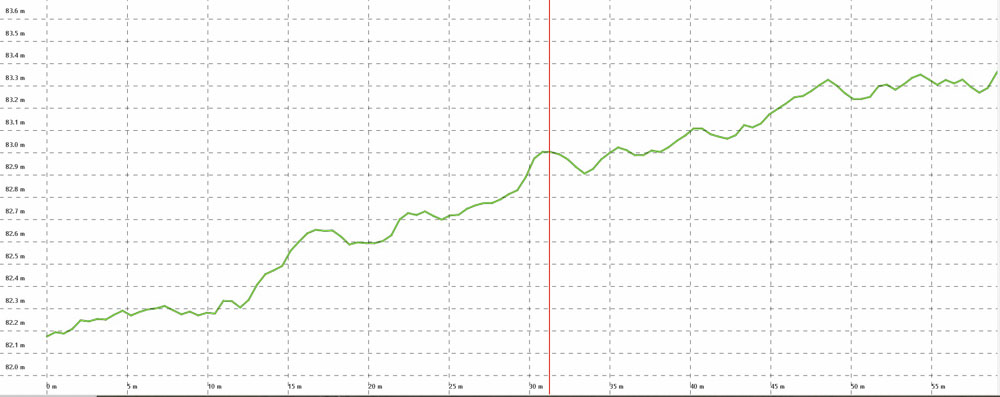
What I’ve shown here is a quick and dirty validation study indicating that 1) I did not screw up my March/April 2019 acquisitions and 2) my fodar maps can easily determine where the snow is thicker or thinner than 9″ (23 cm), the minimum amount needed to support seismic vehicle travel, just like we have found in many other studies. I did not actually measure snow depth because I have not yet finished processing the summer topography from 2018, this just demonstrates that it will work. In the meantime, below I show that we don’t need to wait until I quantitatively measure snow depth because we know the snow depth is near zero in many places because we can simply see it from the imagery.
Identifying Bare Ground Visually in the Peak of Winter Snow Pack
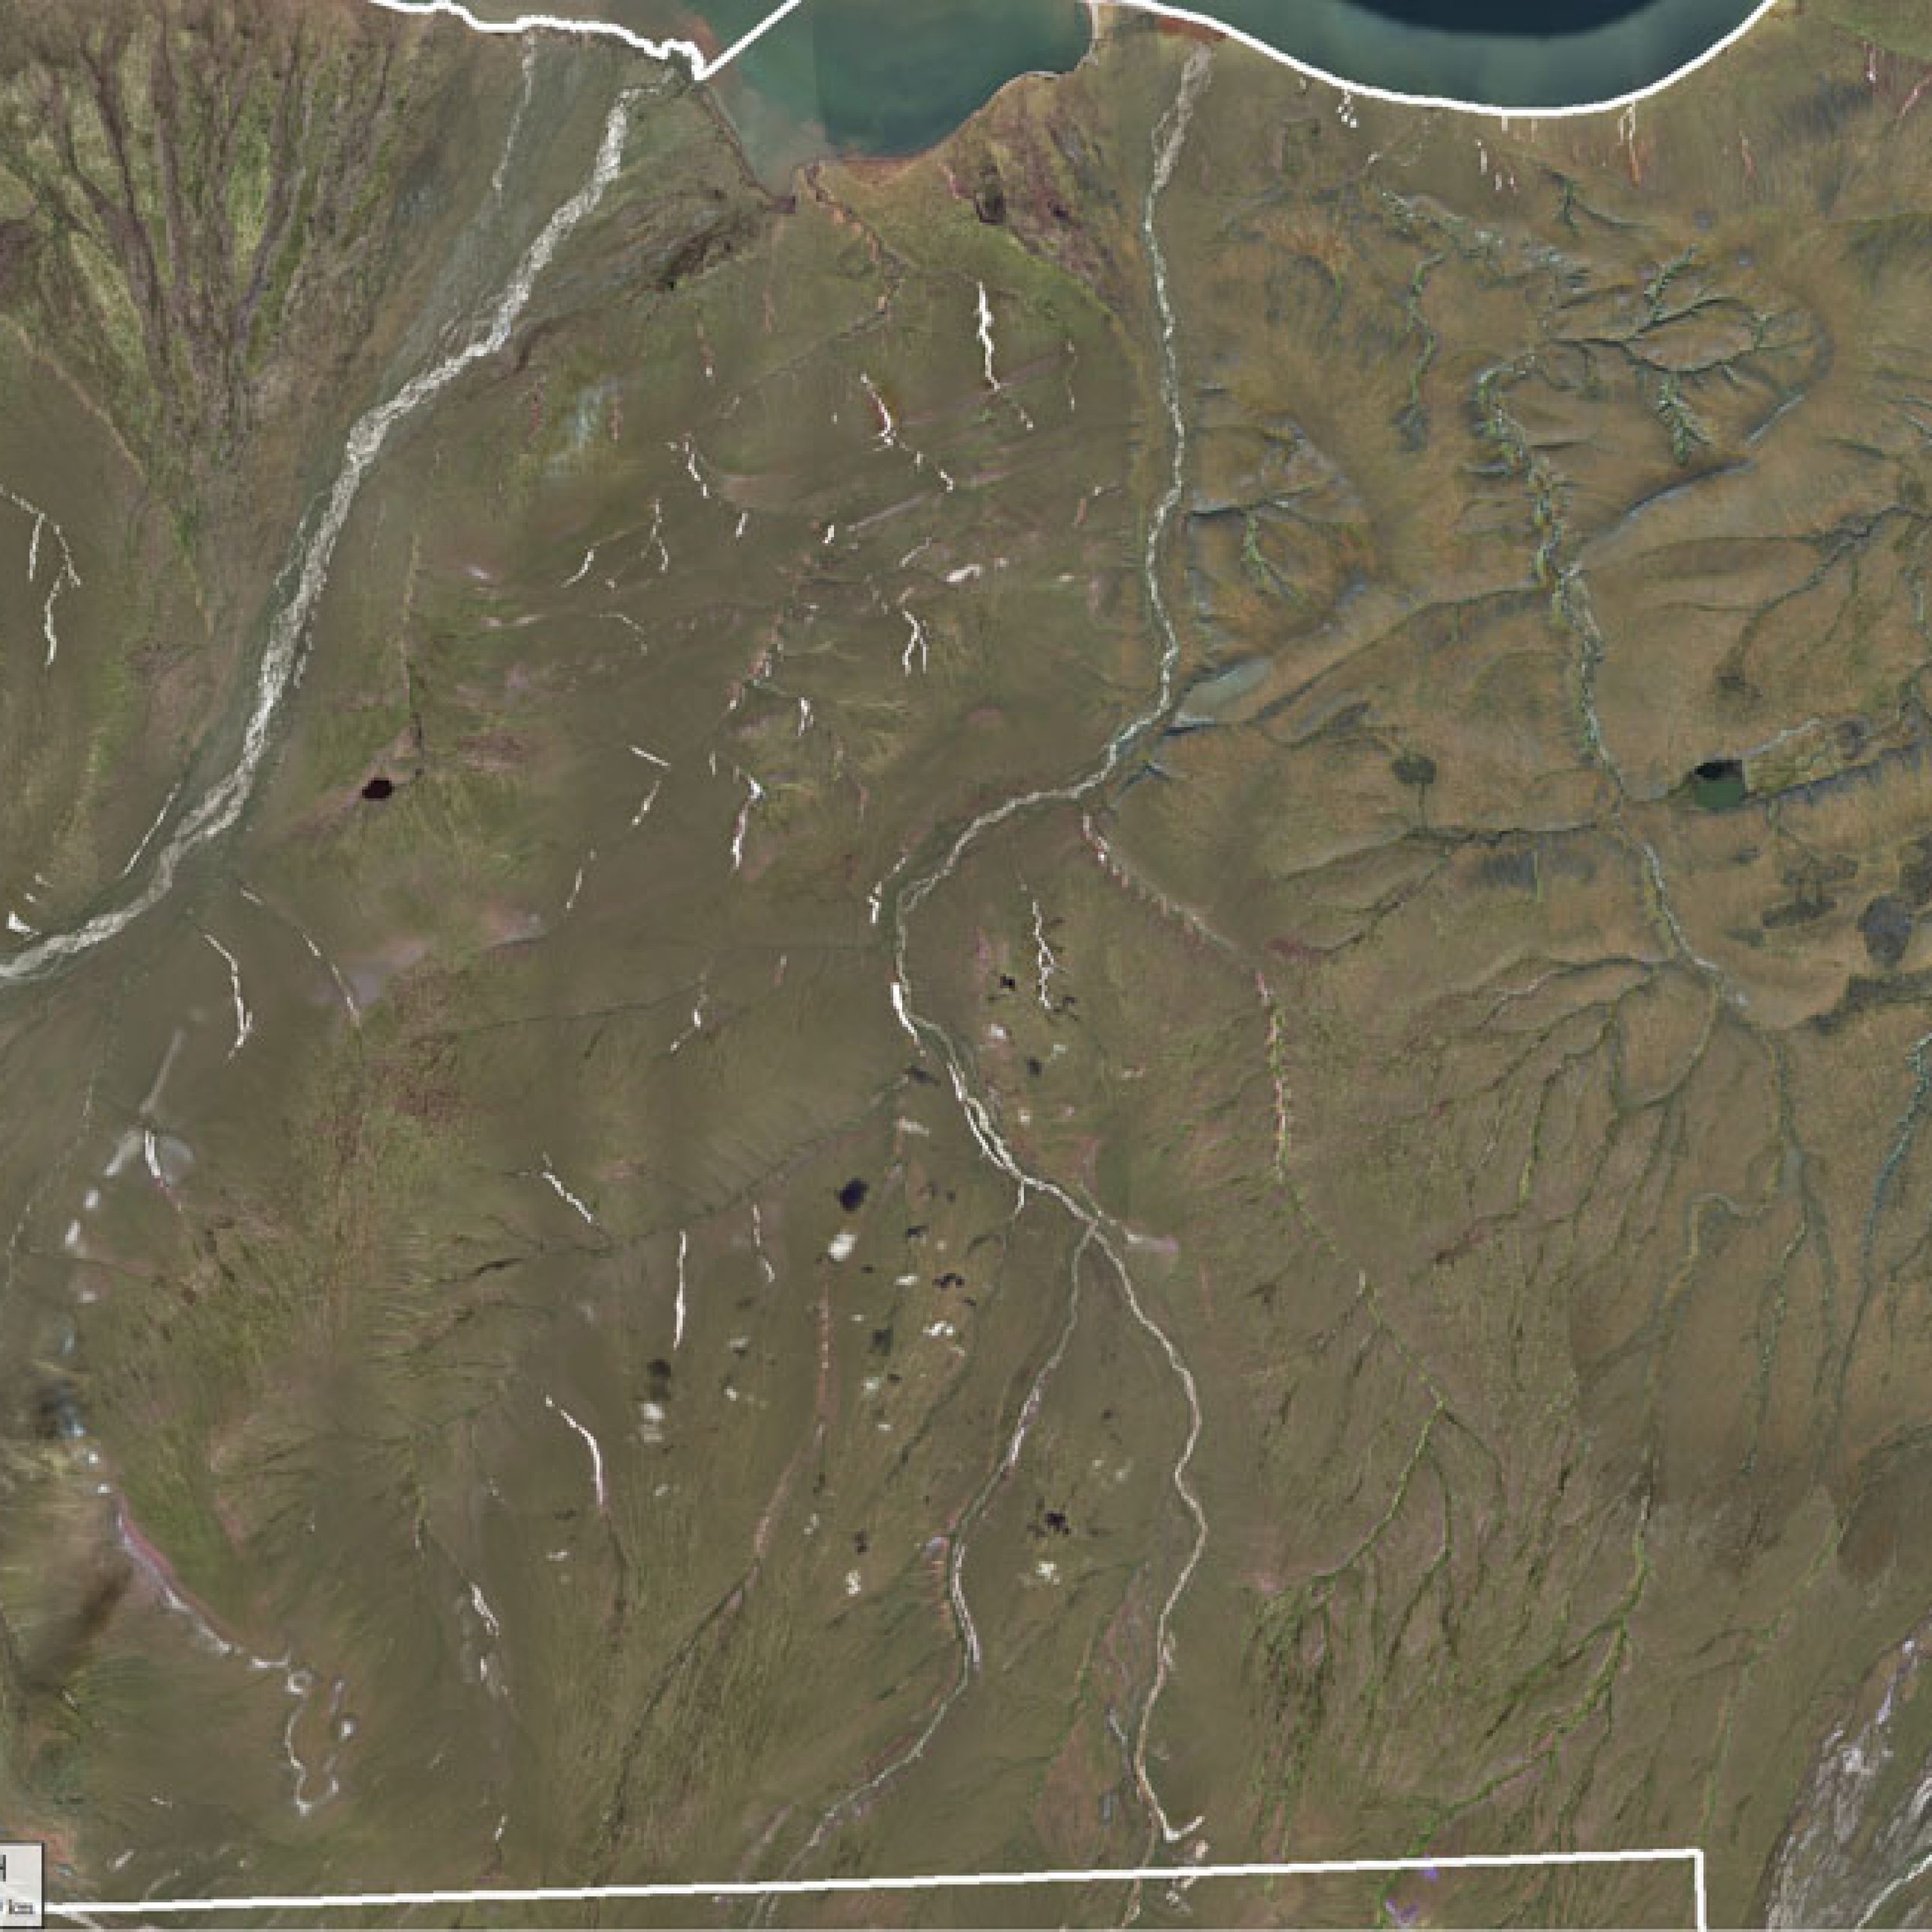
In this section I’m trying to share some sense of how much bare ground is exposed out there on a regular basis. I realize that these data are from a single year, but we have to start somewhere and that I’m doing this at all is based on over a decade of informal observations of this same situation. I could fairly be accused of cherry picking here, but that is the point really — here I’m trying to demonstrate that there are huge regions in the 1002 Area that are windswept all of the time, I’m not developing a climatology. And I don’t really have to cherry pick very much, as you will see this is the case wherever I look. Regardless, the entire set of acquisitions I made were reasonably distributed spatially and across all of the terrain types in this area, so once those are processed we can begin making more balanced generalizations.
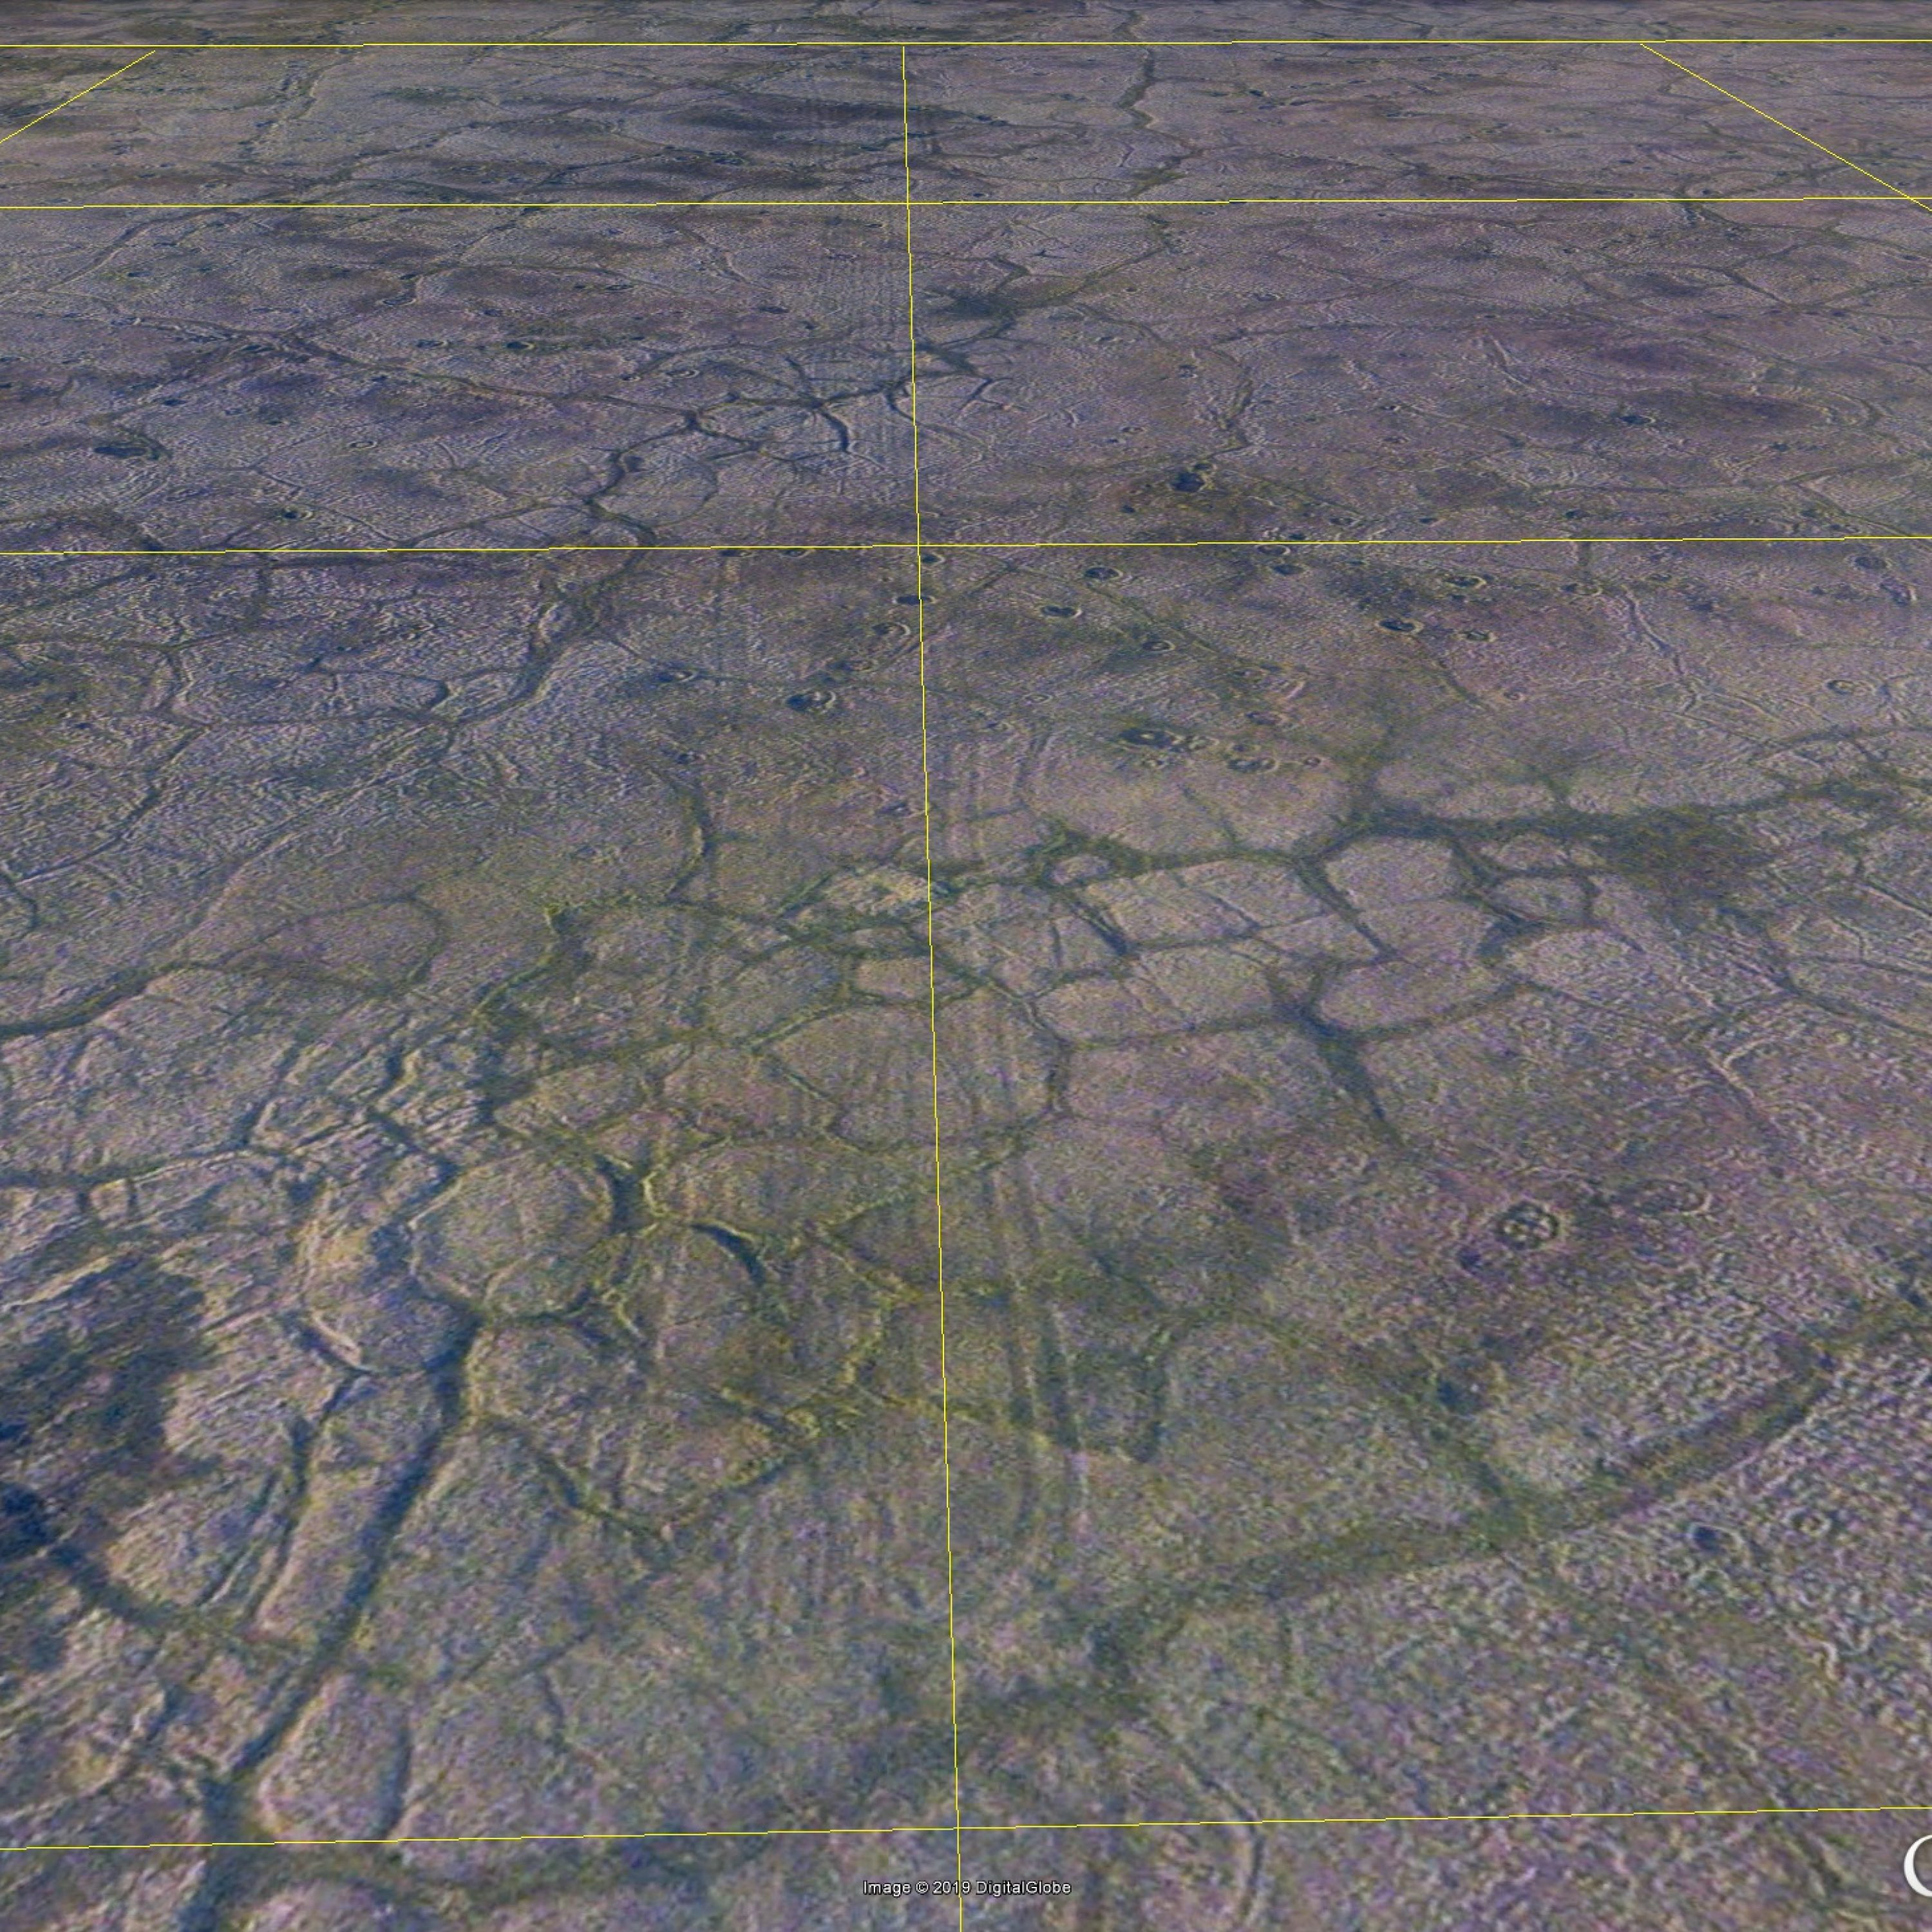
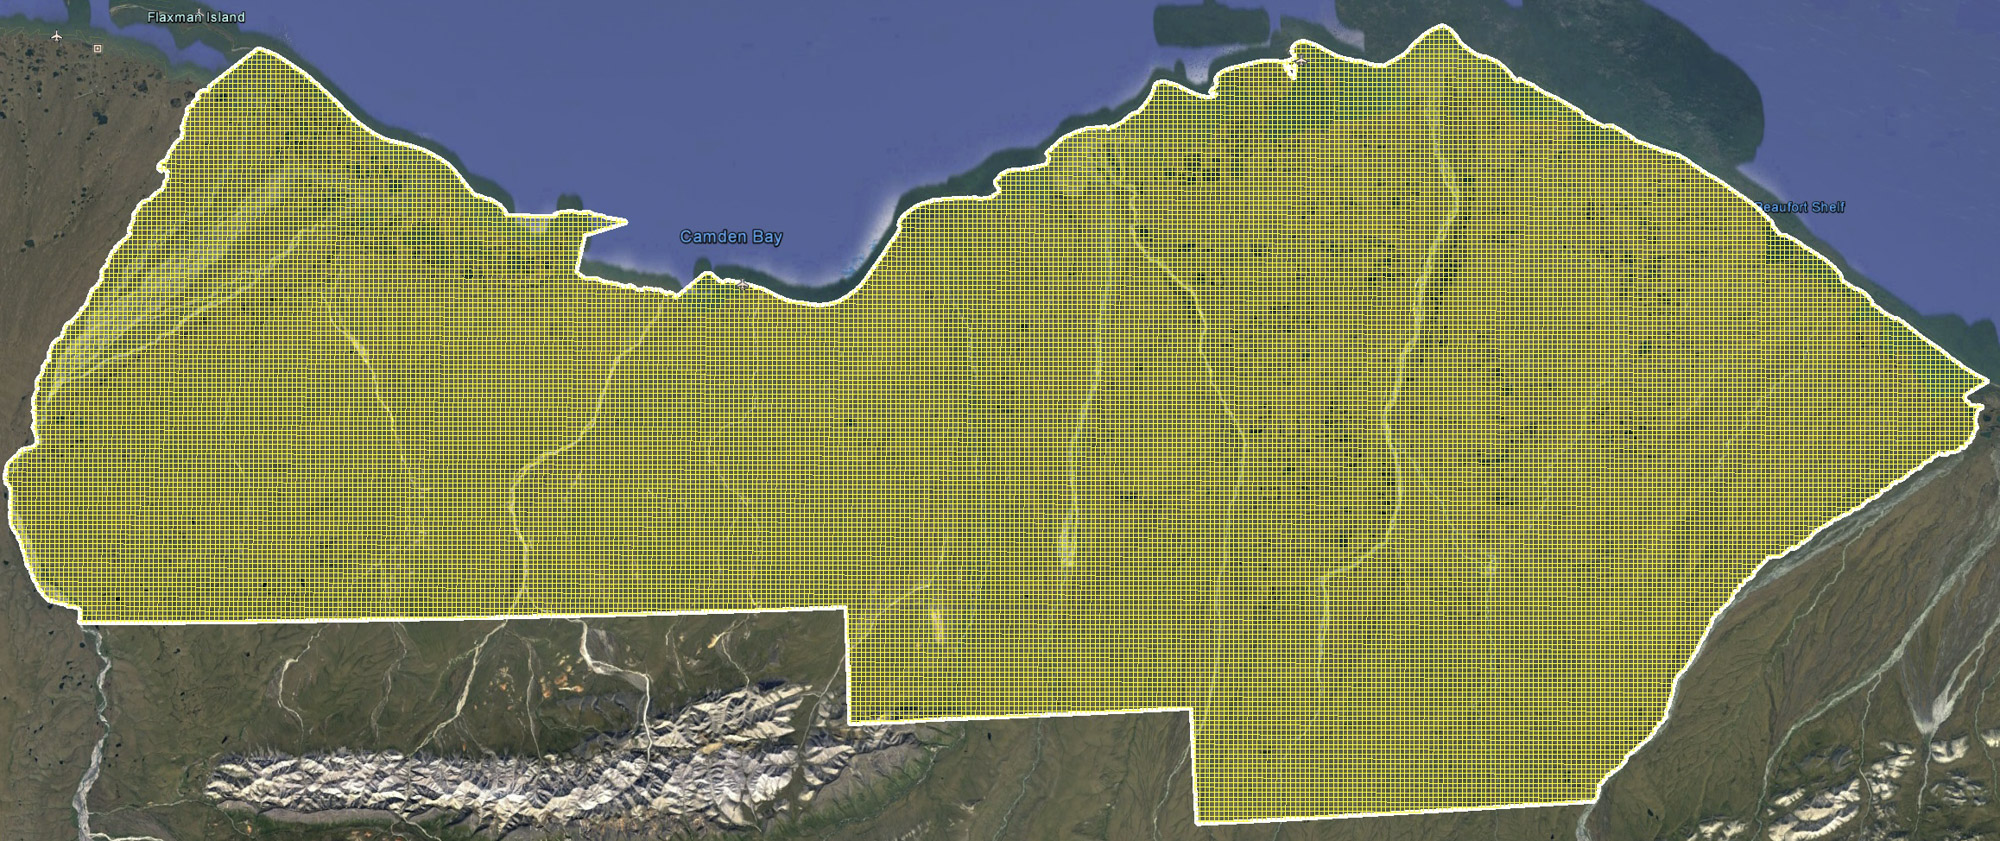
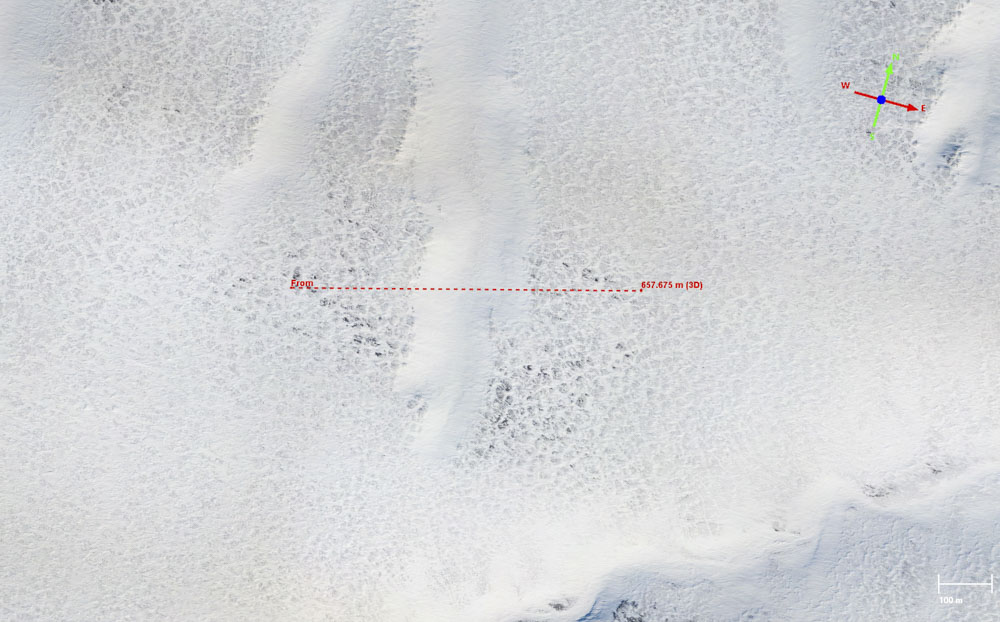
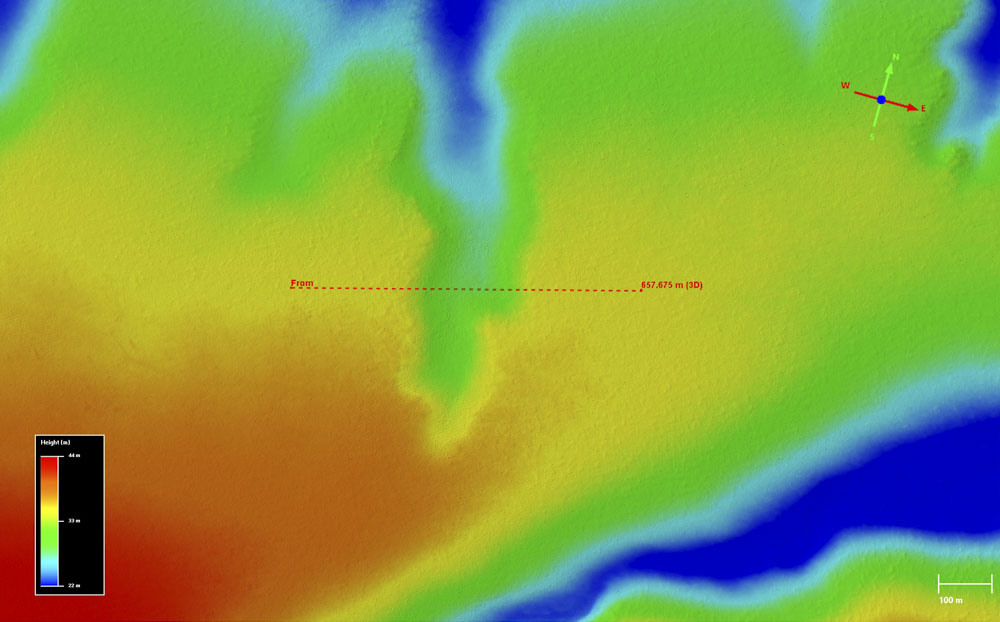
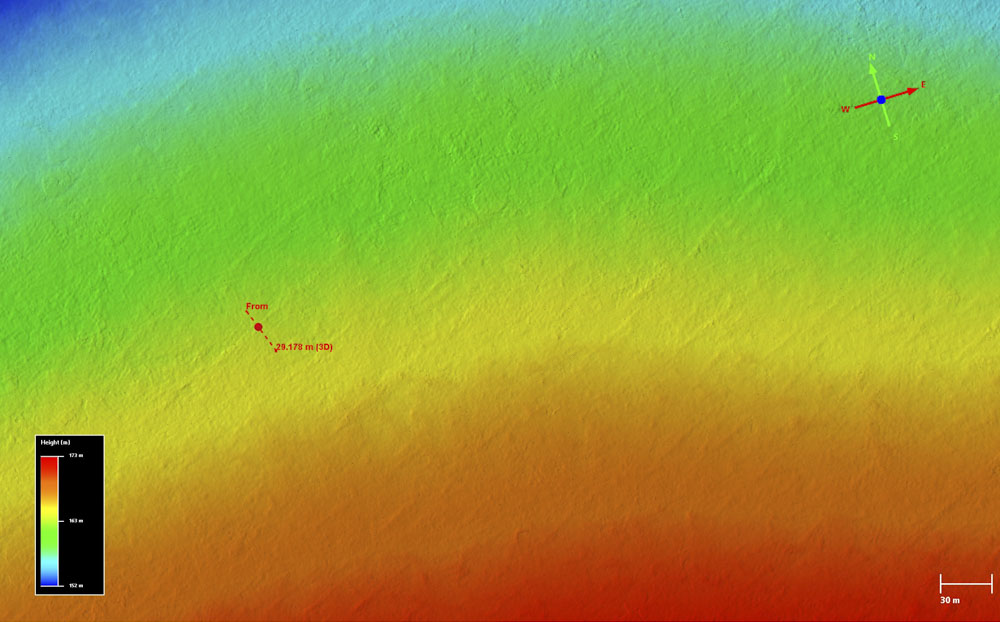
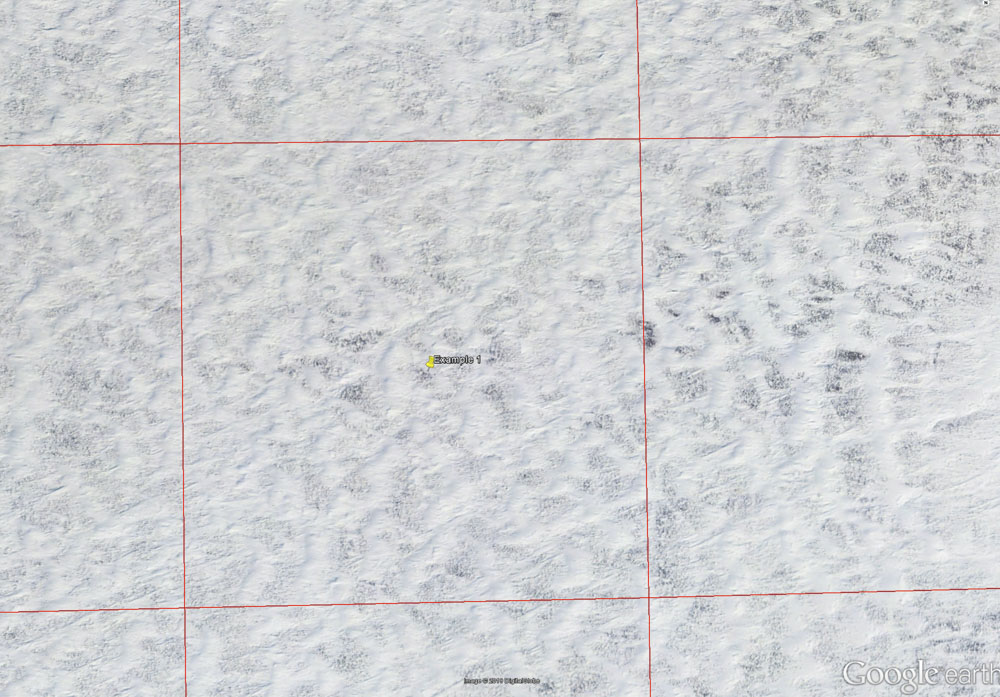
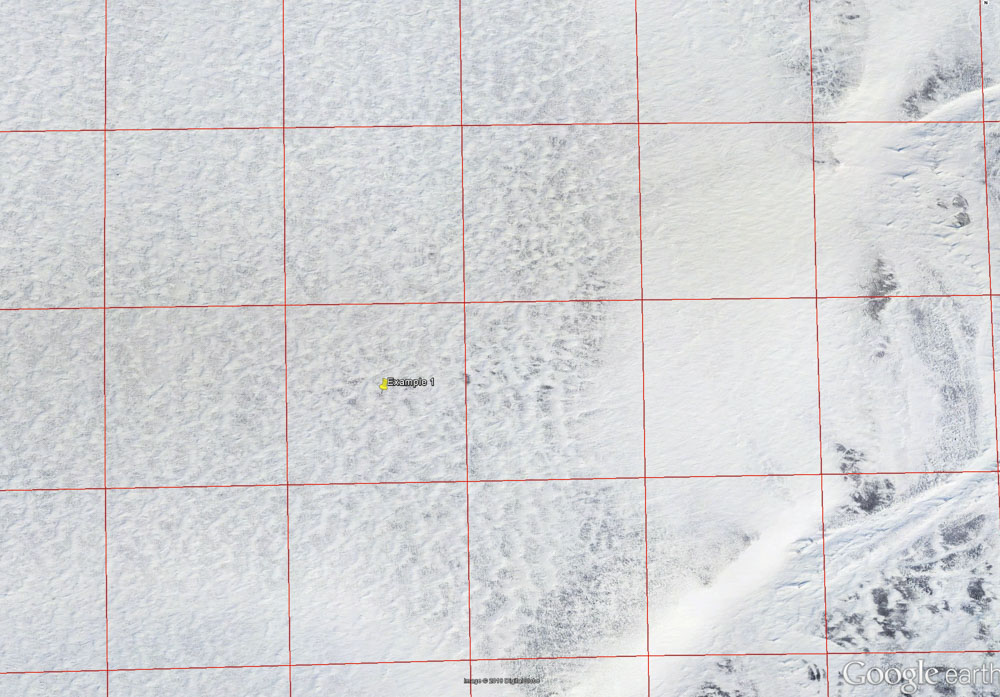
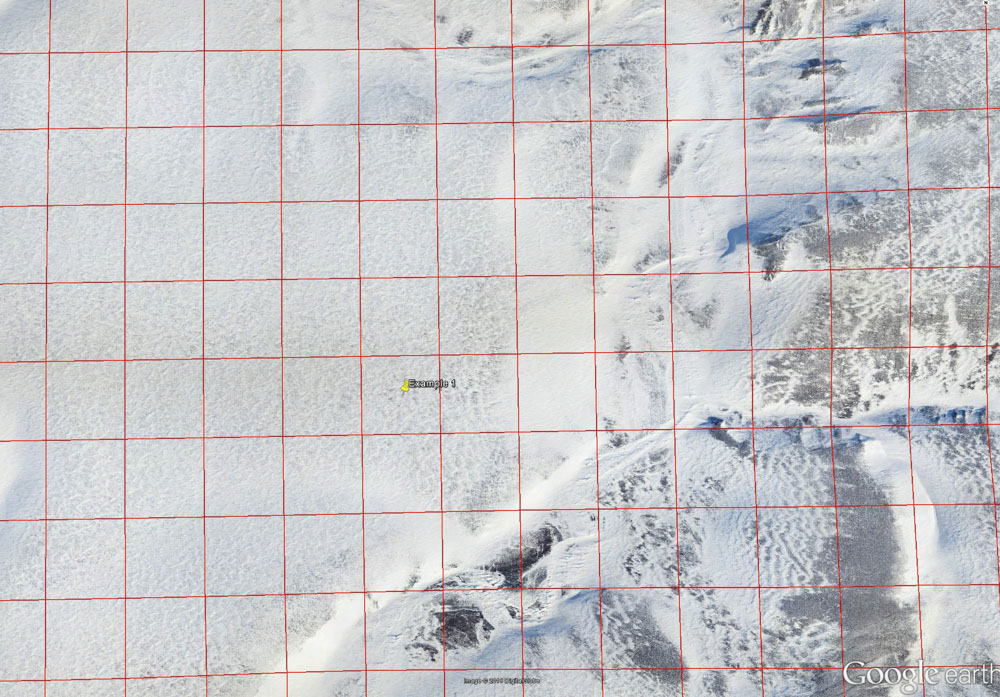
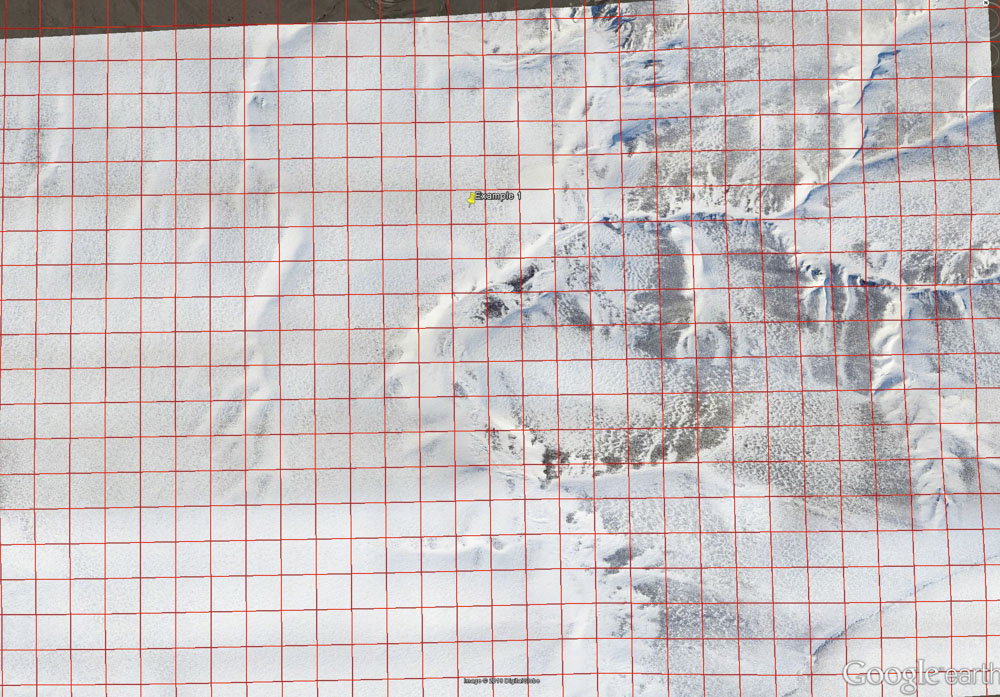
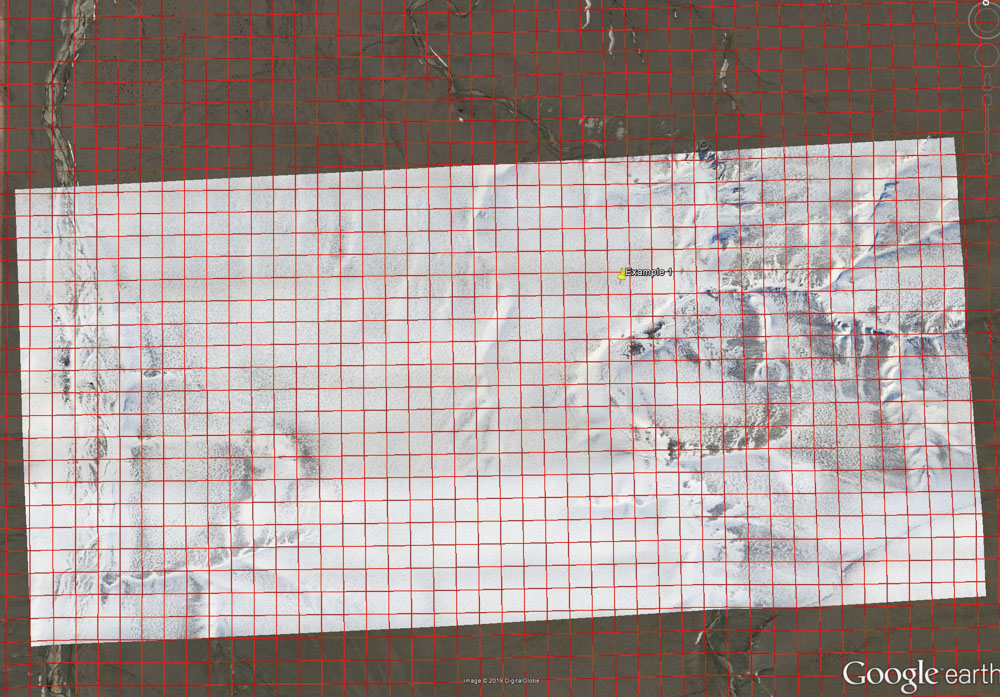
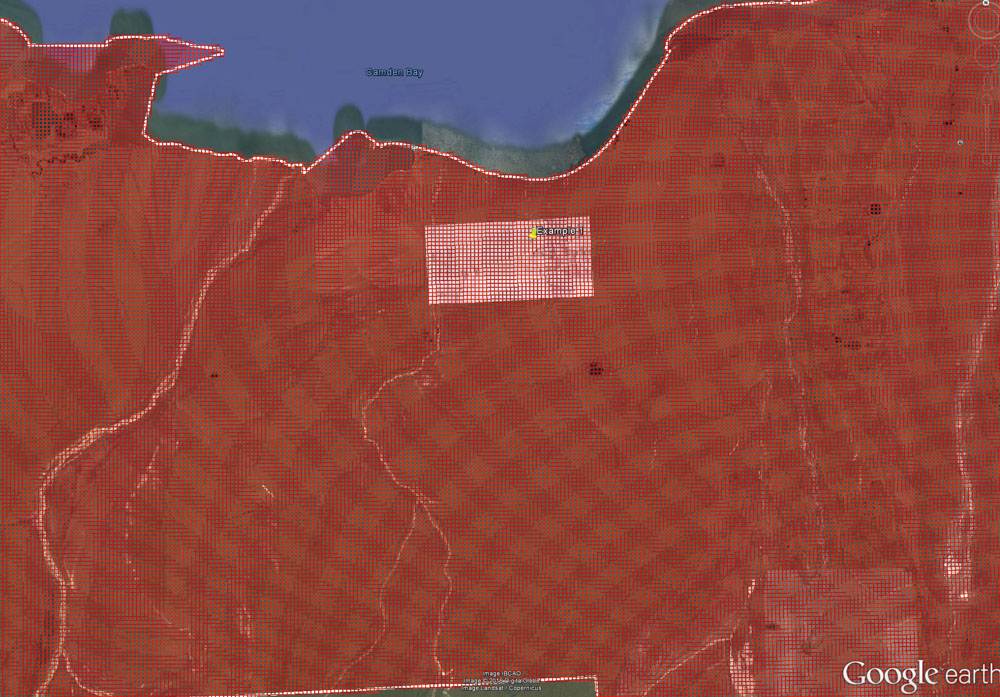
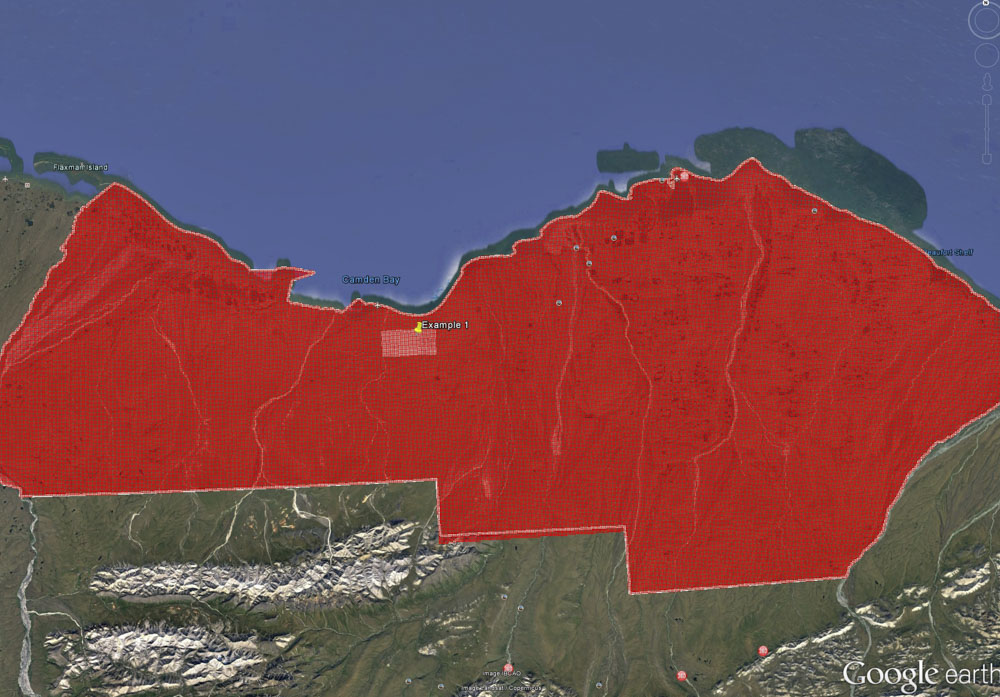
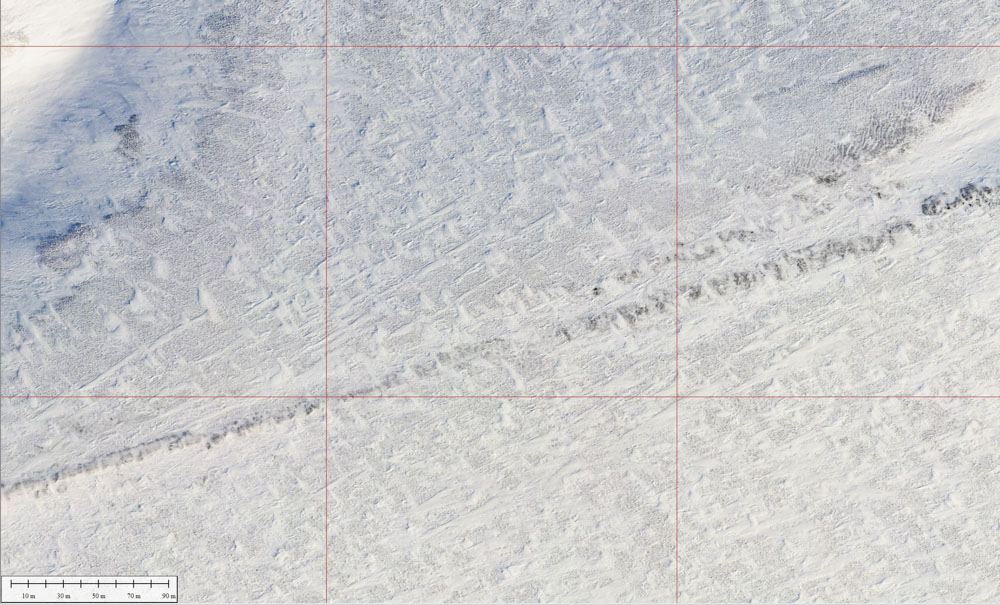
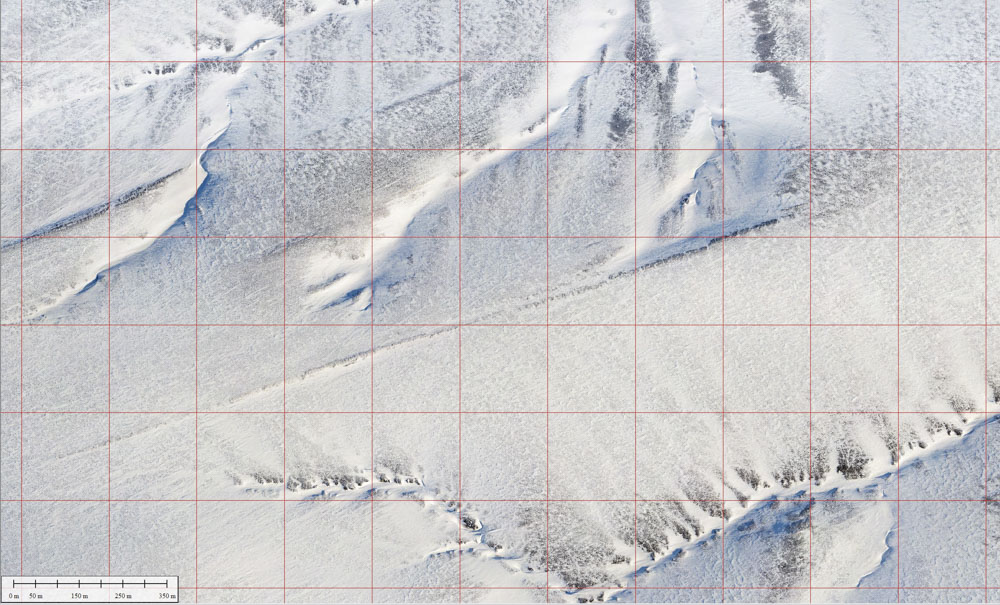
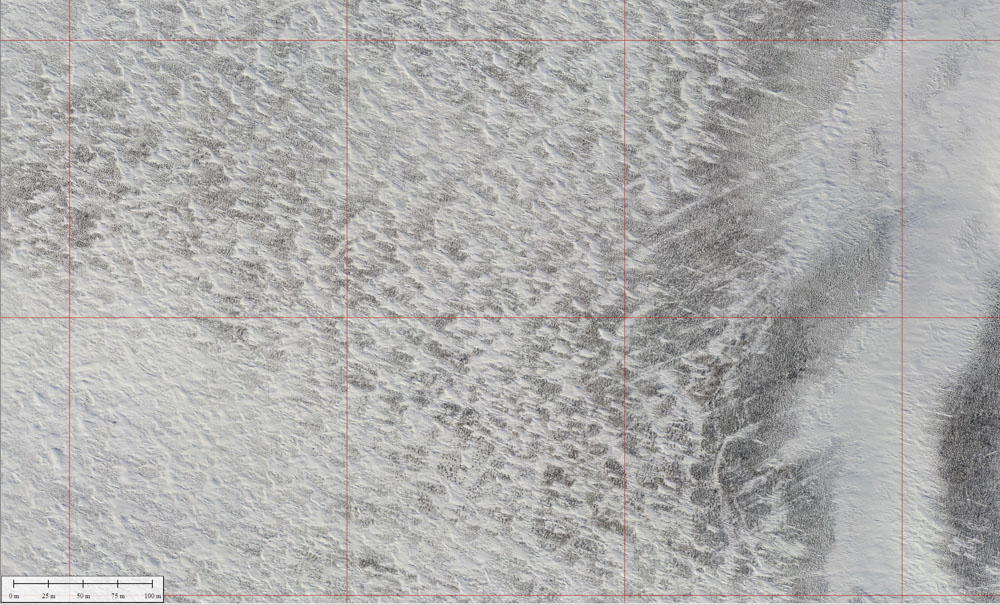
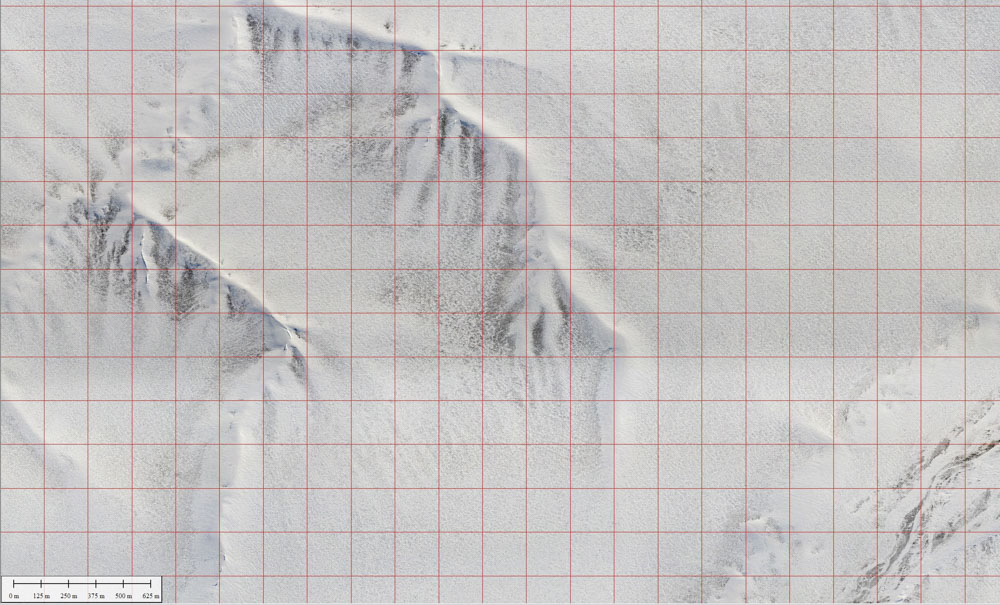
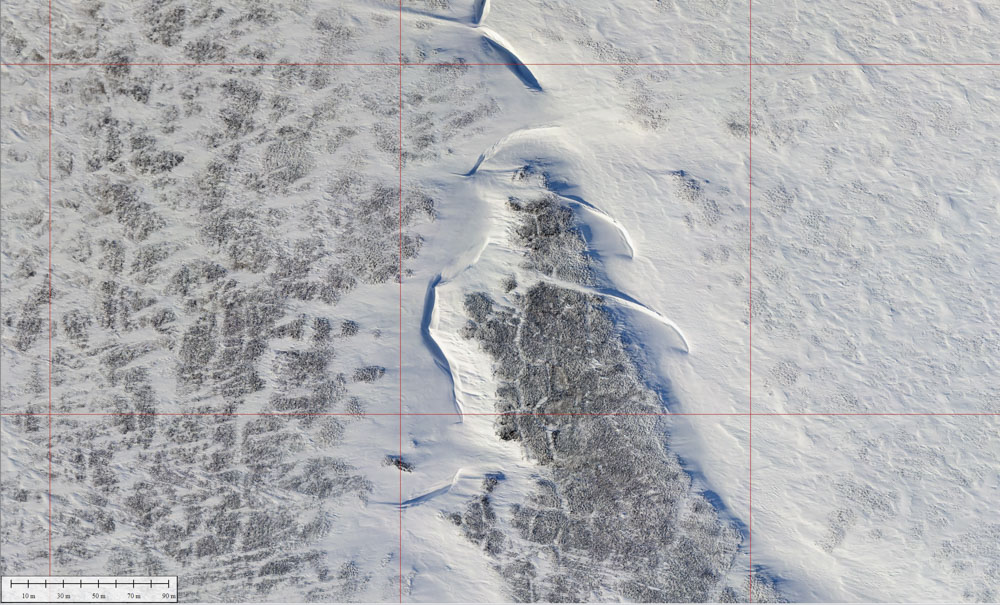
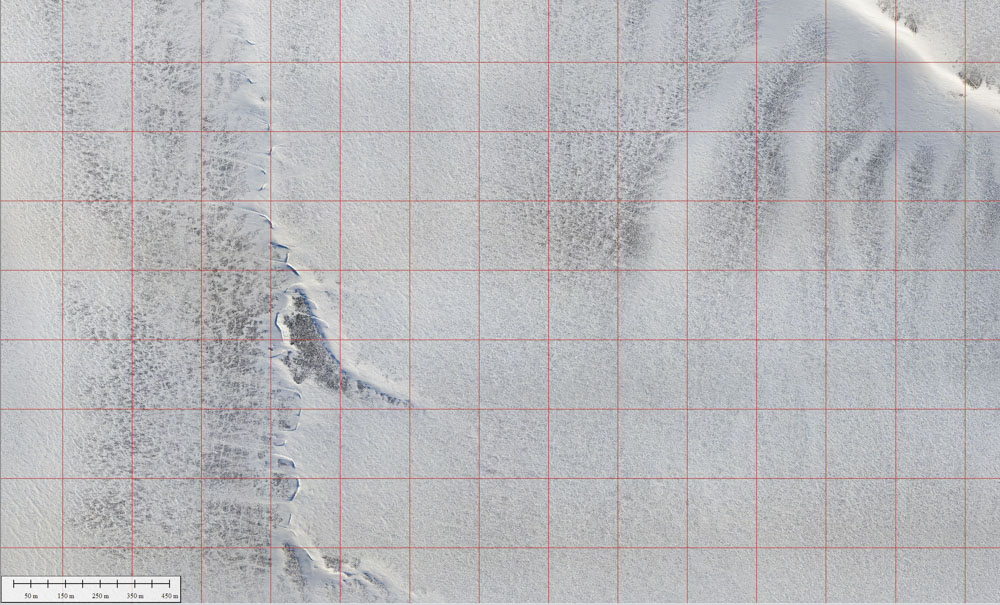
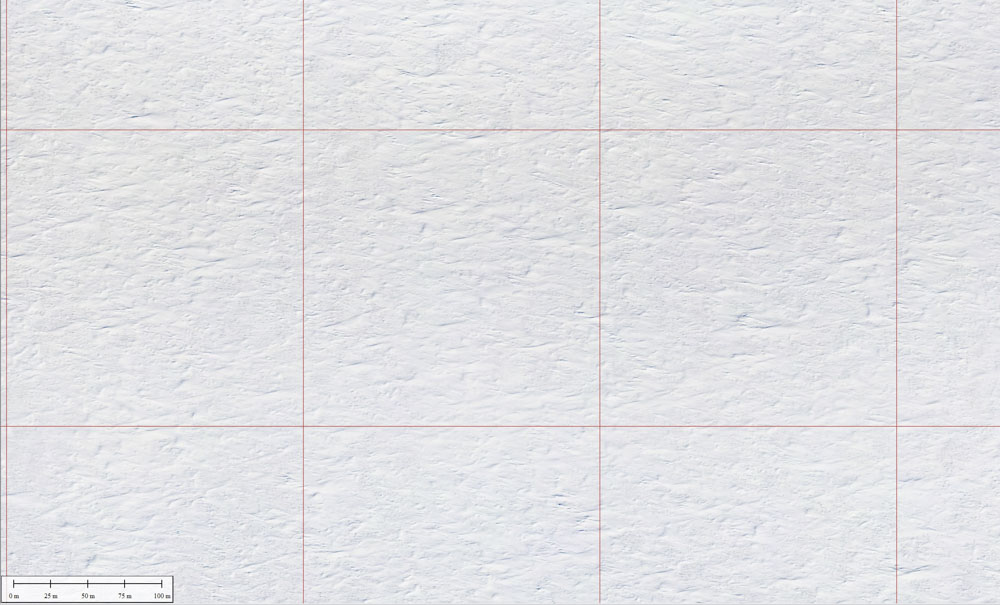
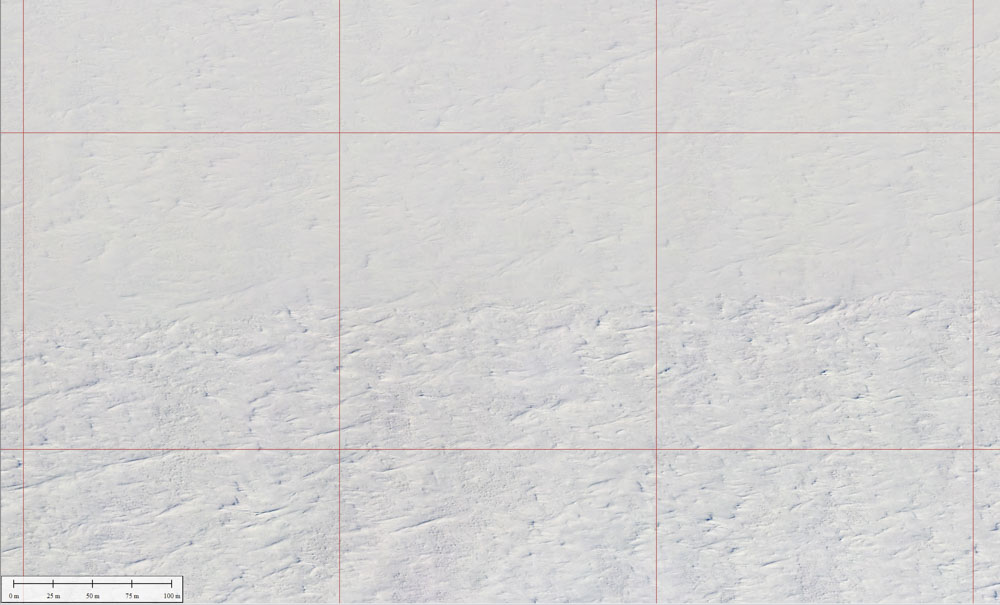
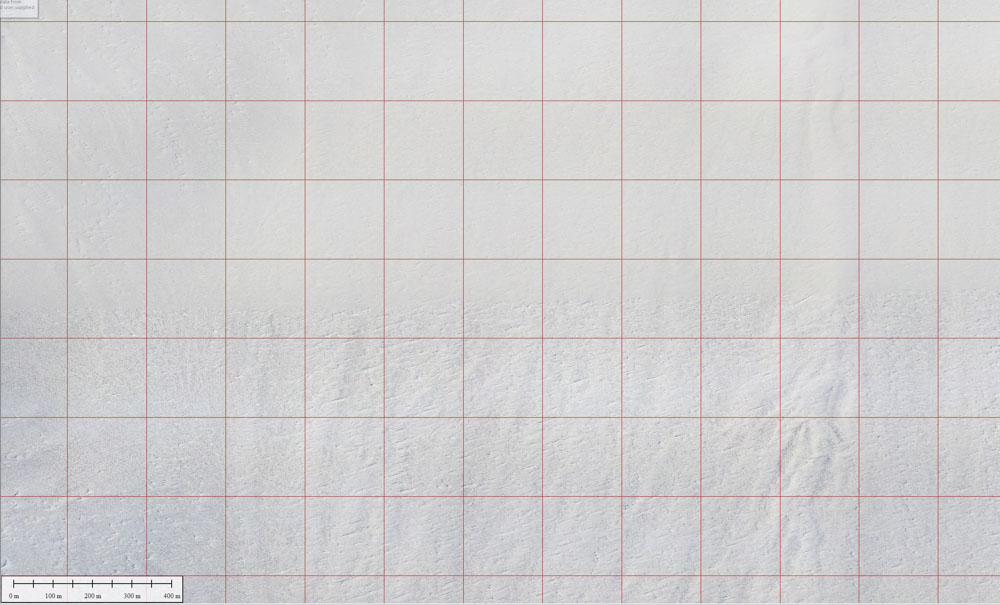
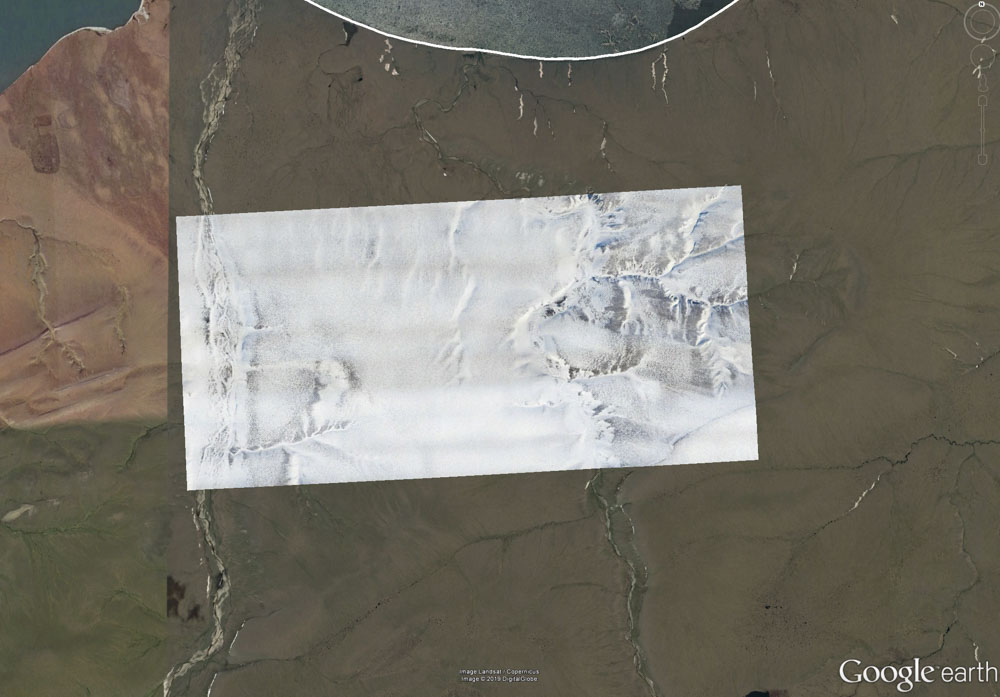
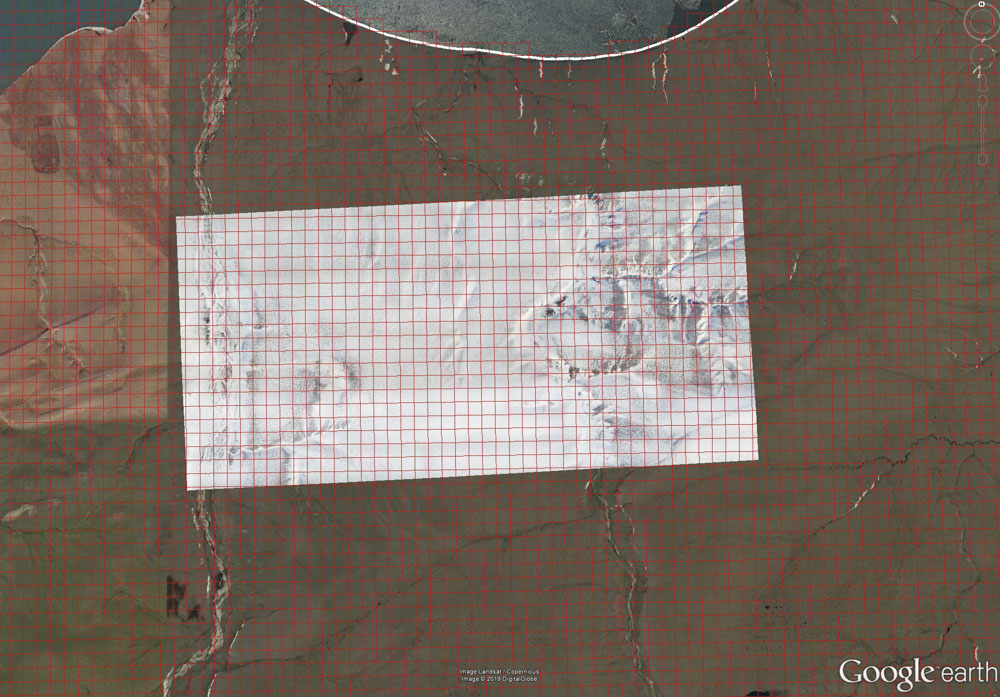
Example 1: Zooming out from tussock-scale to 1002-scale
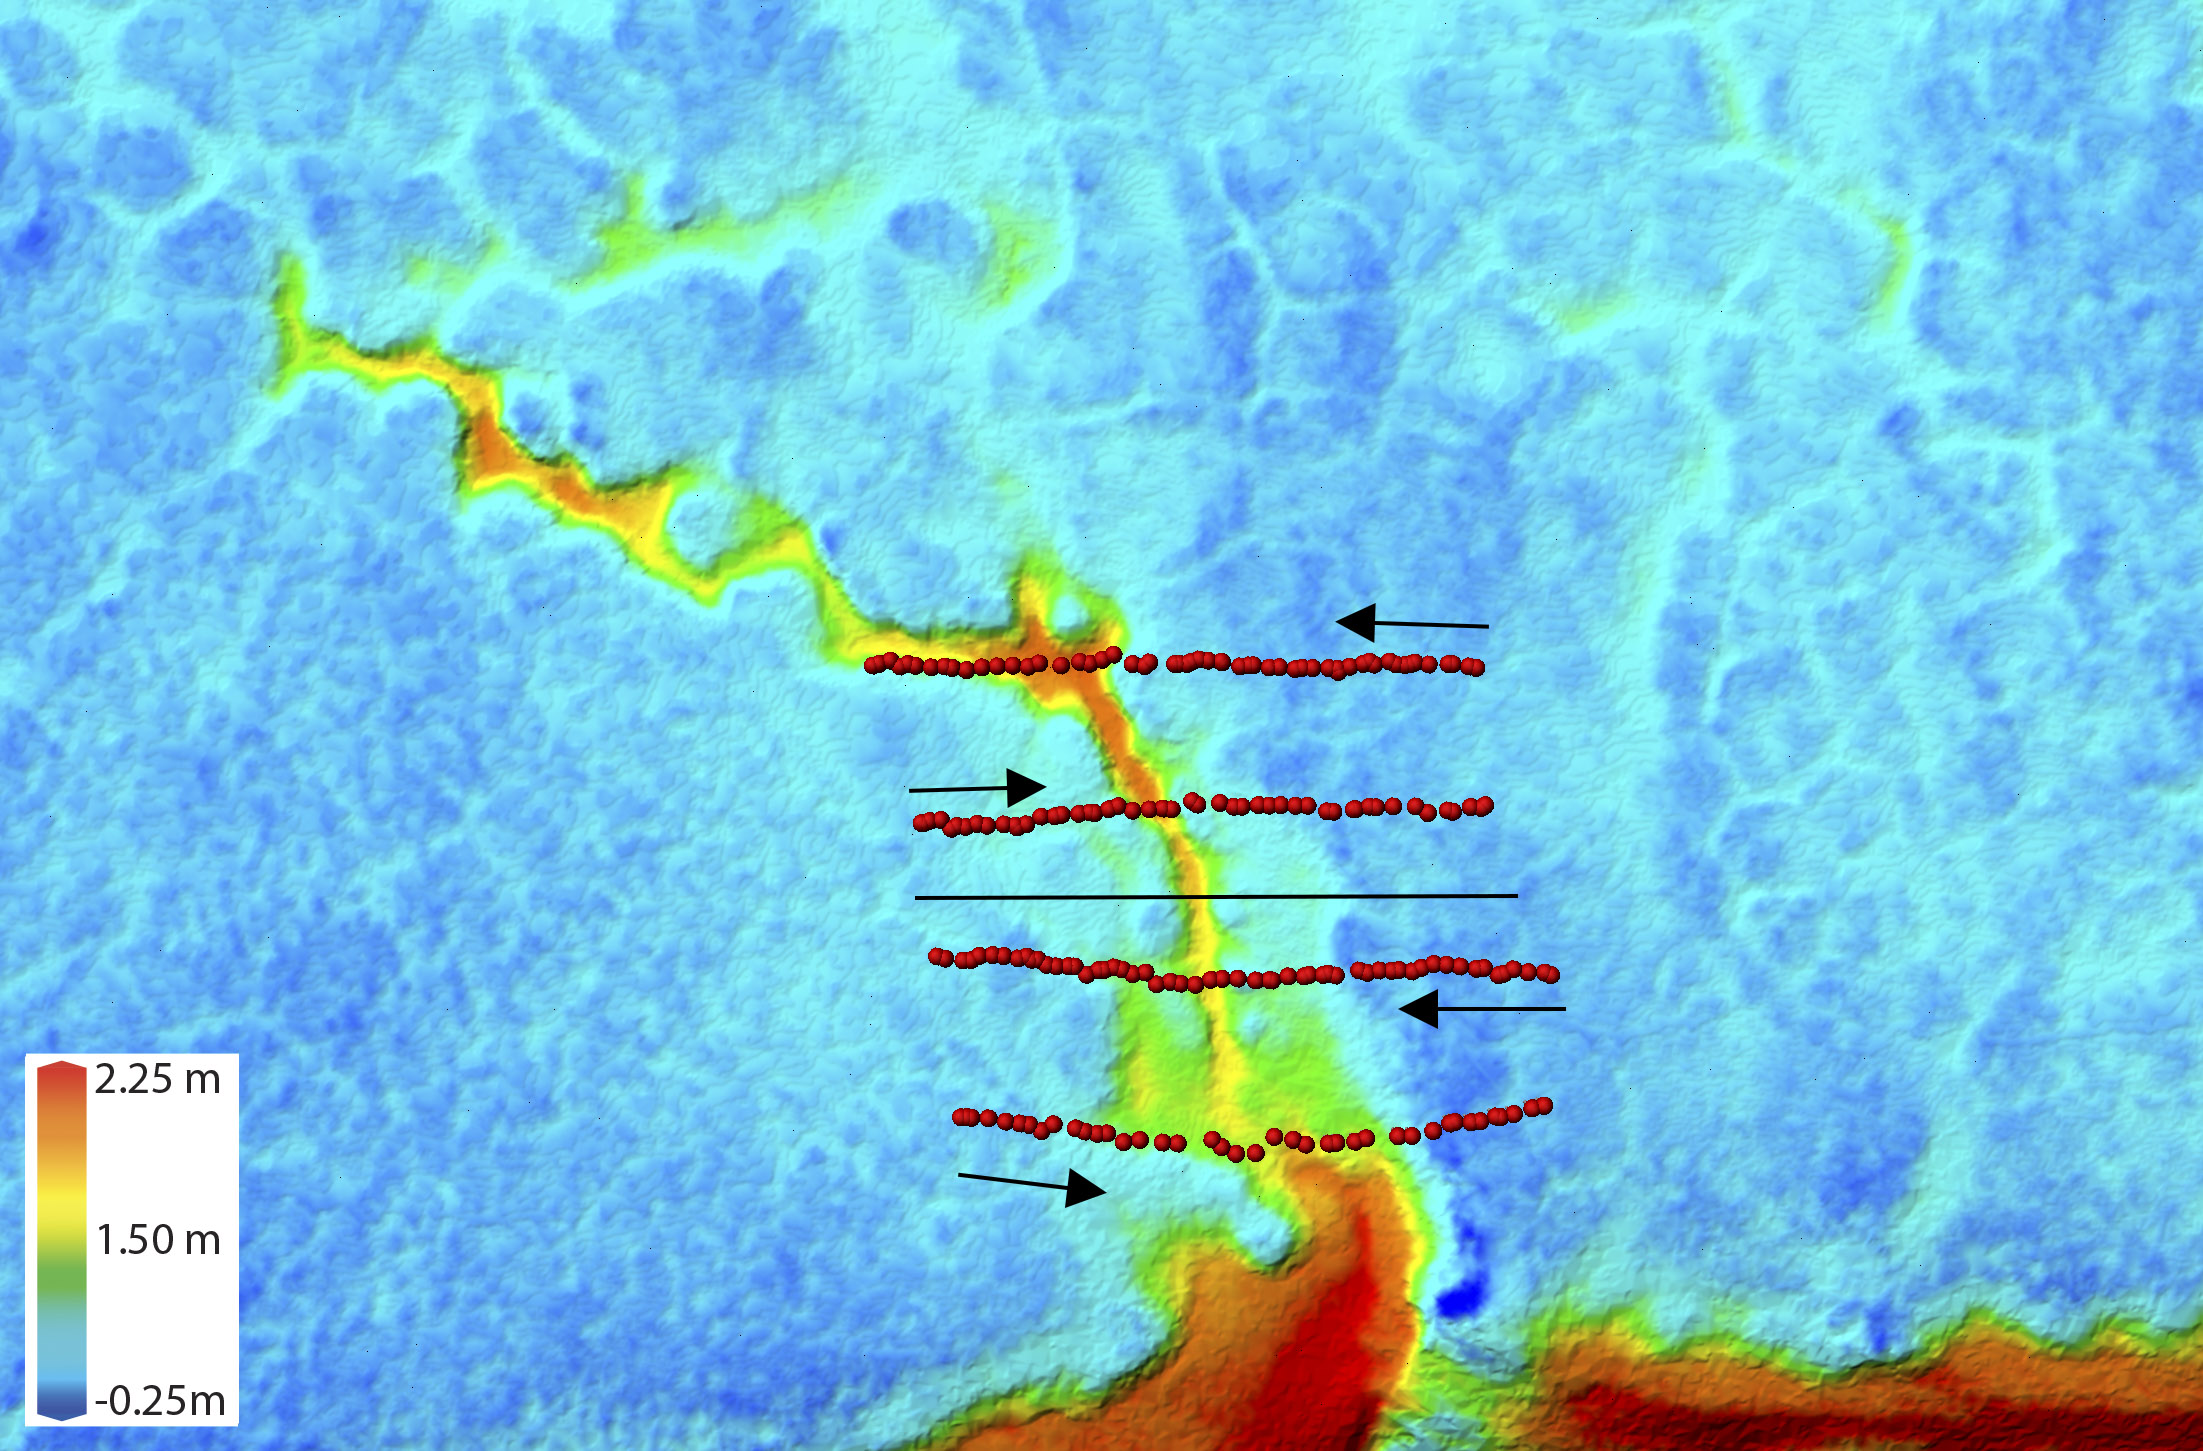
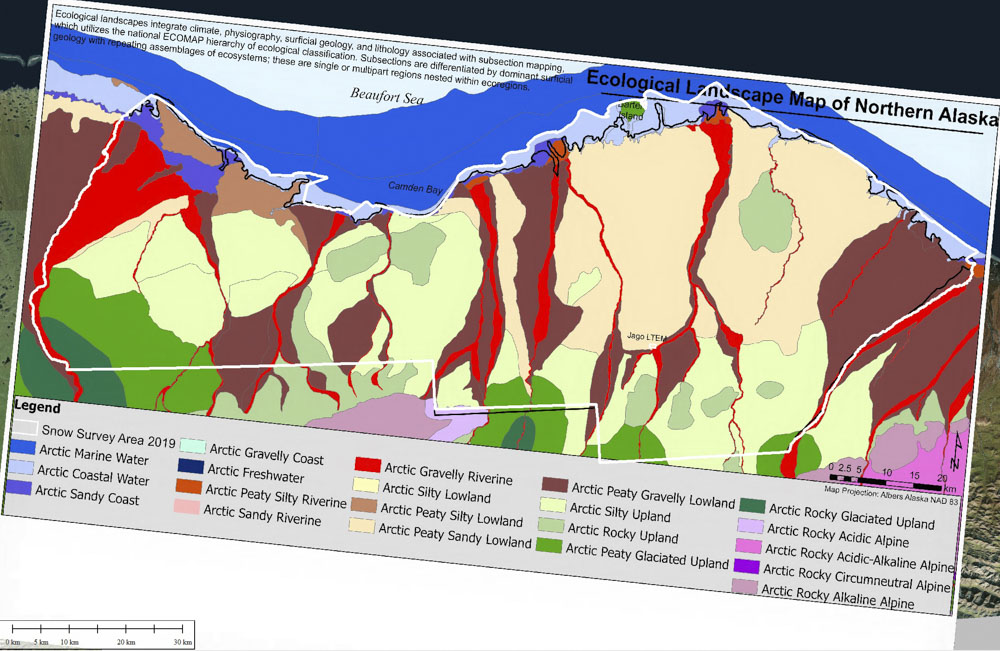
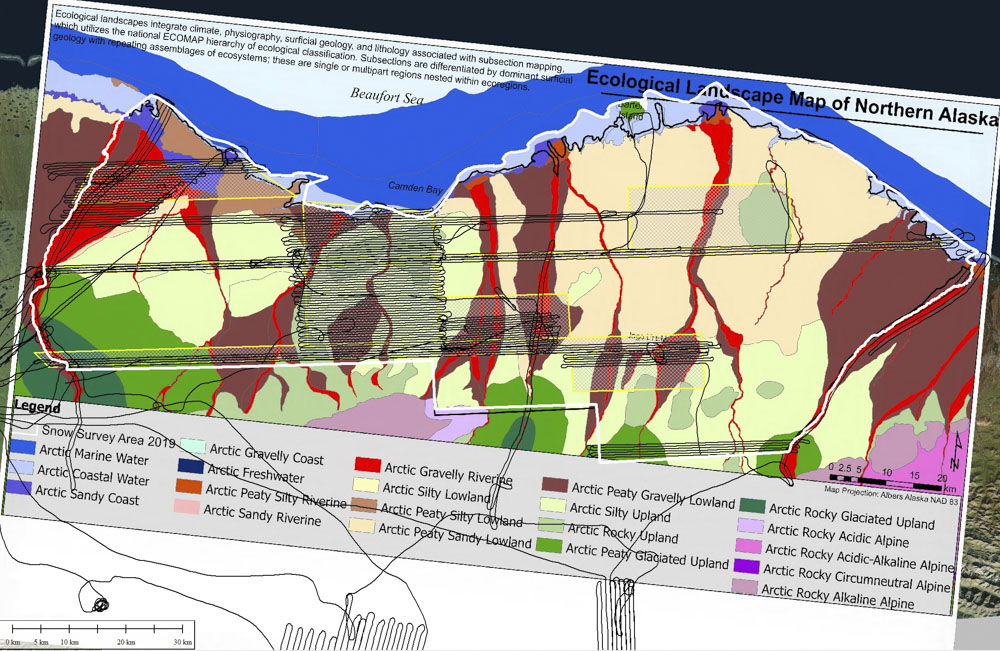
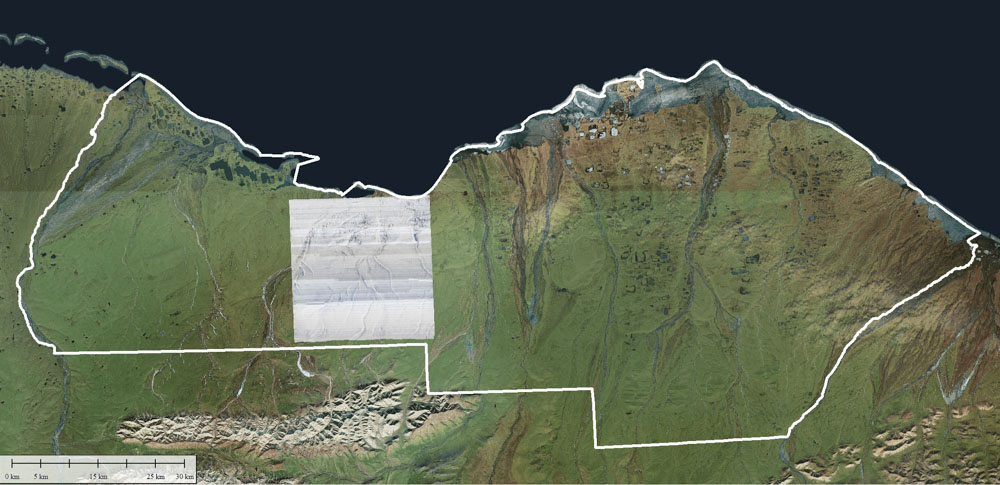
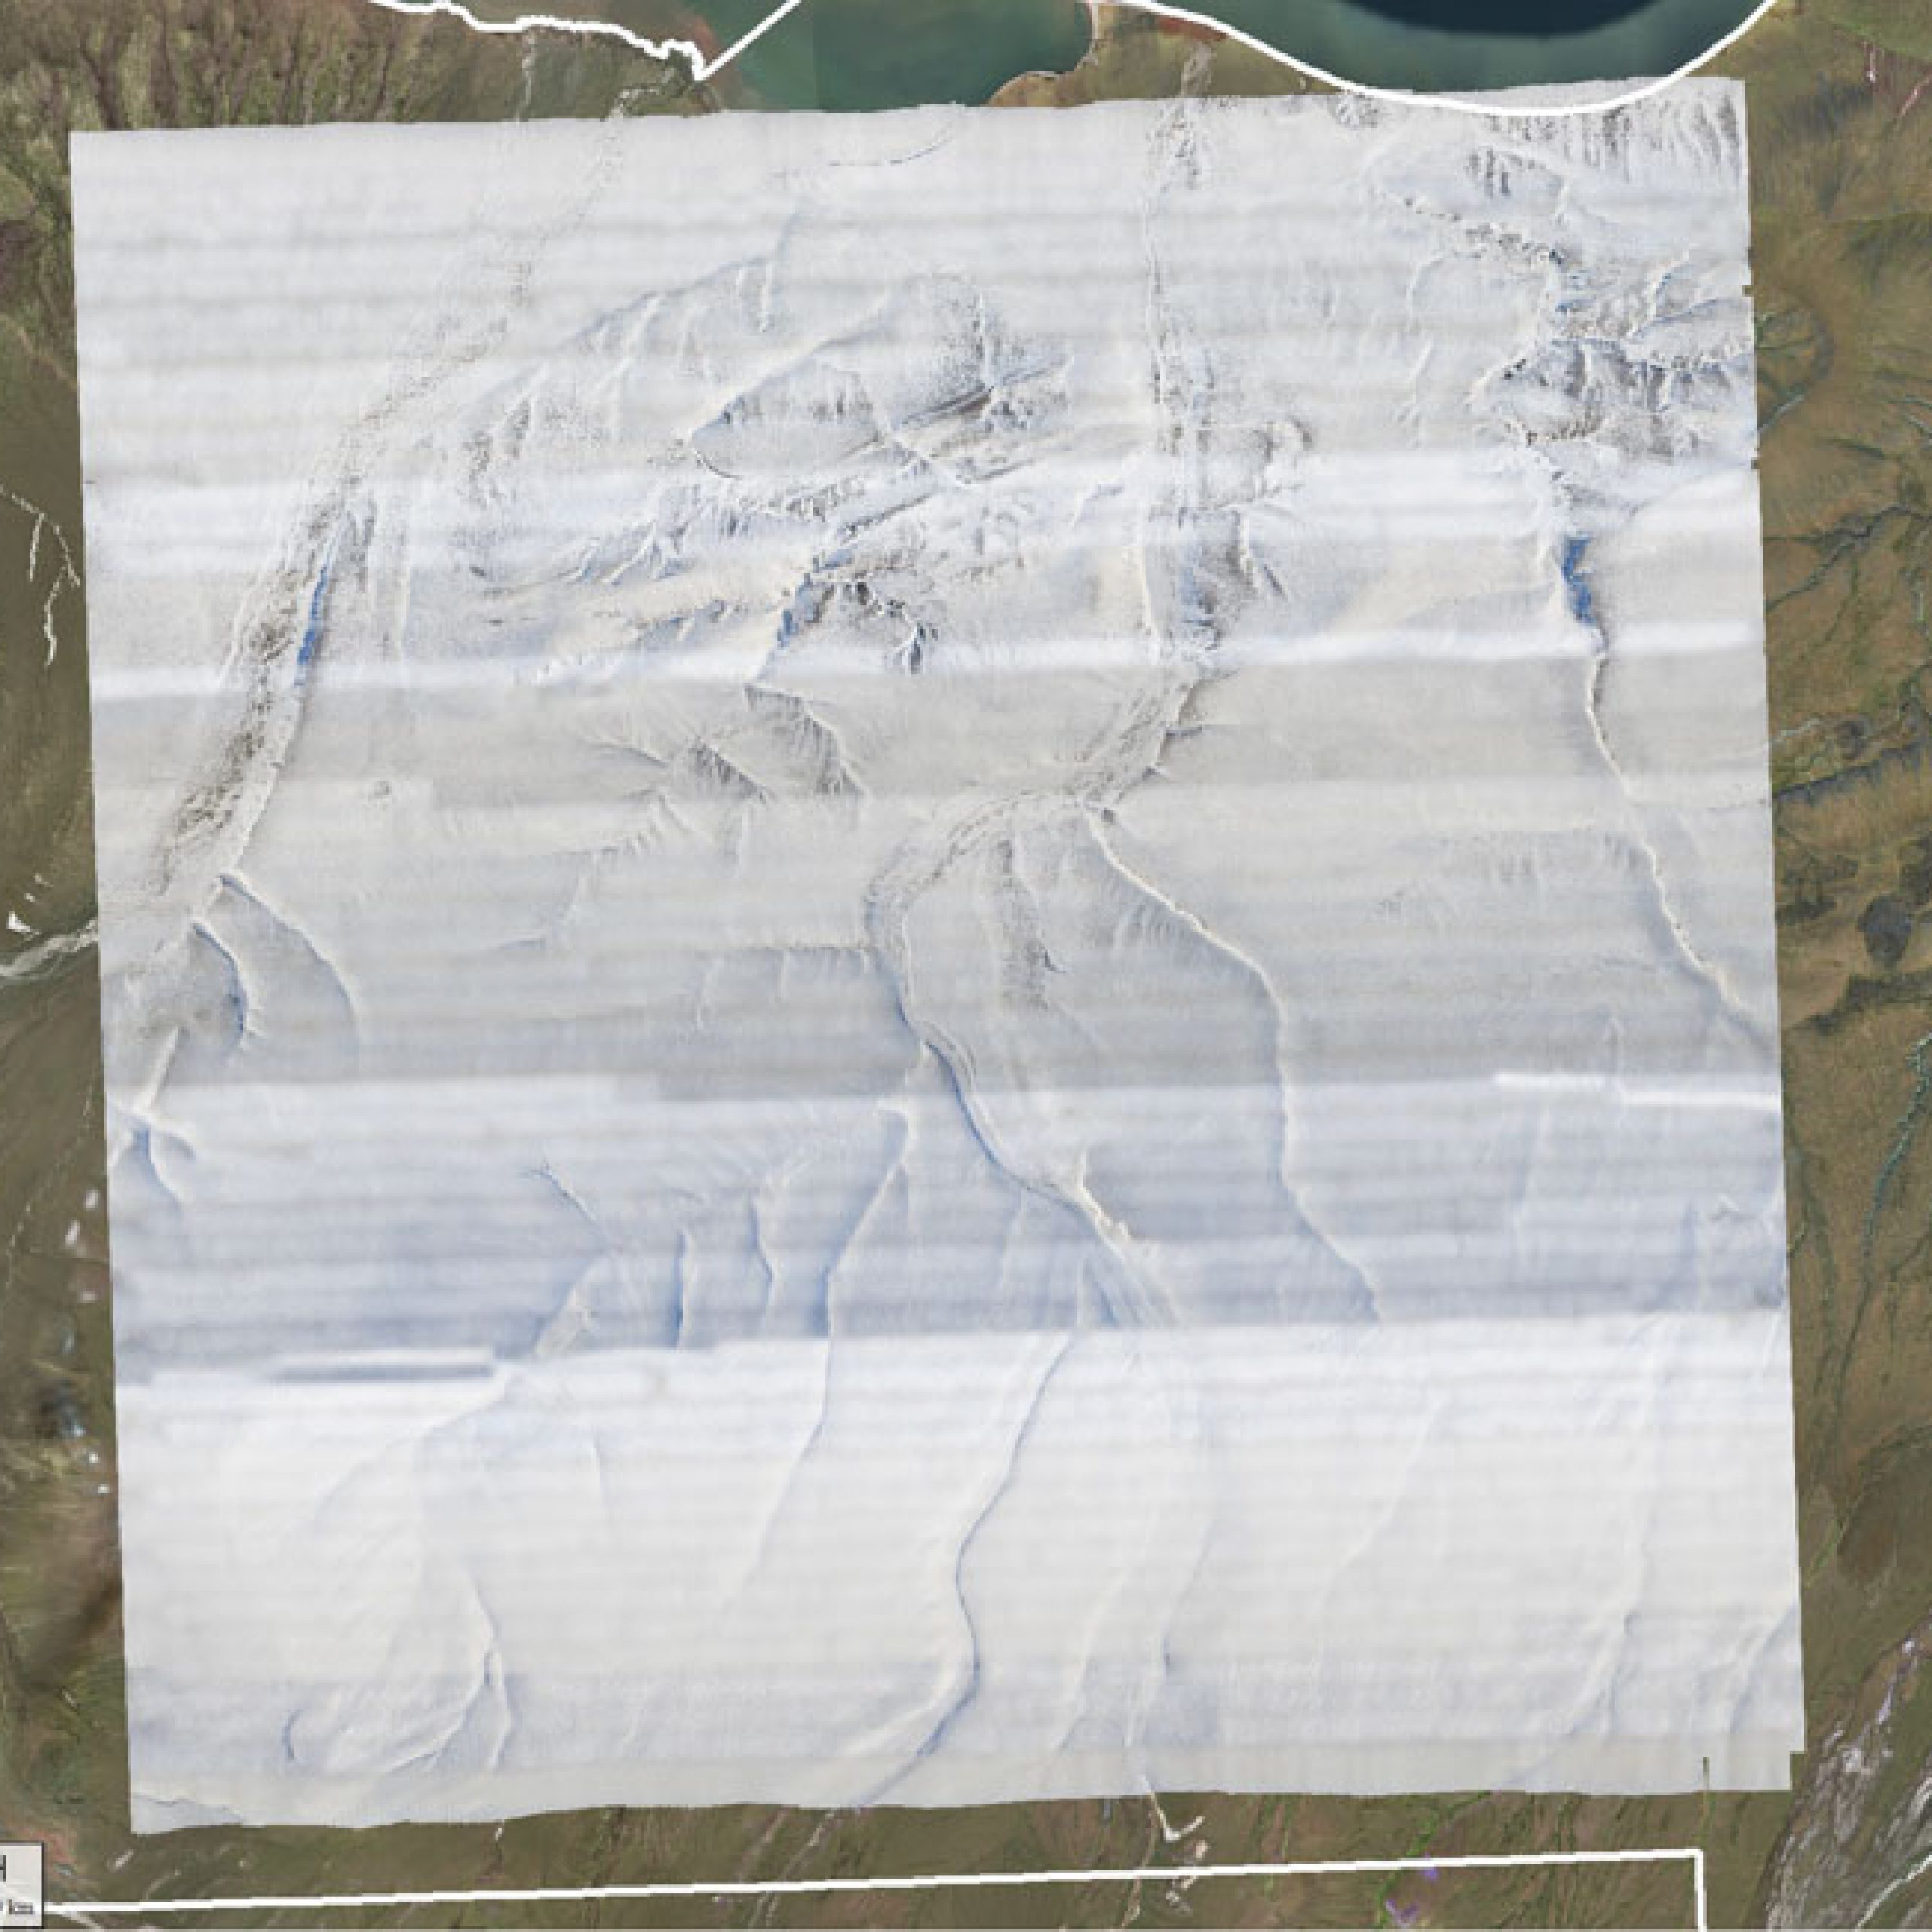
Below is sequence of screenshots starting zoomed in enough to see individual tussocks then gradually zooming out to put the entire 1002 Area in perspective. The red lines are spaced 200 m apart — this grid represents what is currently being proposed for overland travel by a convoy of dozens of heavy vehicles dragging a hotel for 300 people: some 40,000 miles of trail in total. As you can see here, most of these grid lines cross bare ground at the peak of winter snow pack. At the end of this blog, I show how you can download these data for yourself and explore them in Google Earth as I have done in this example.
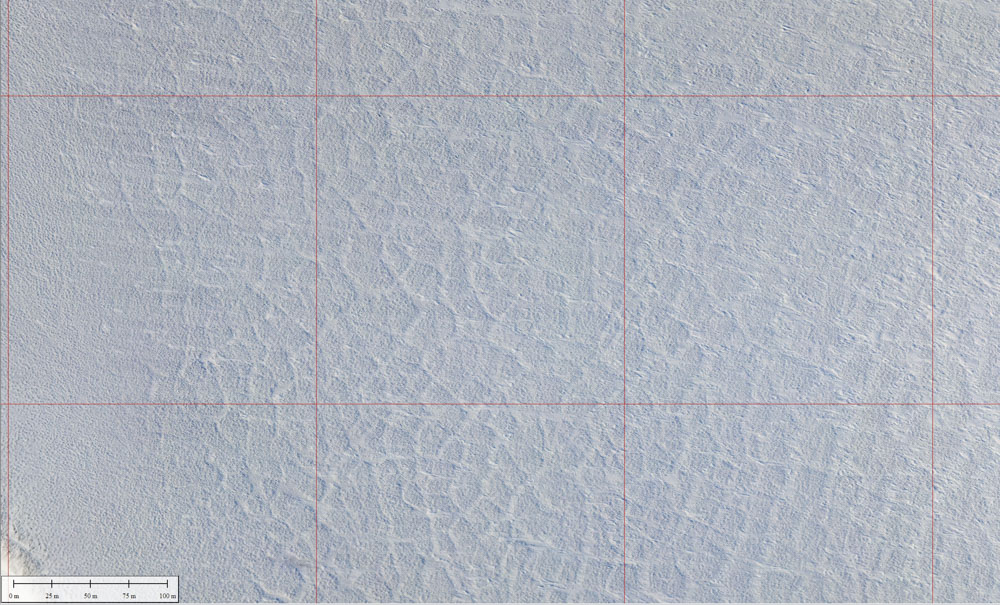
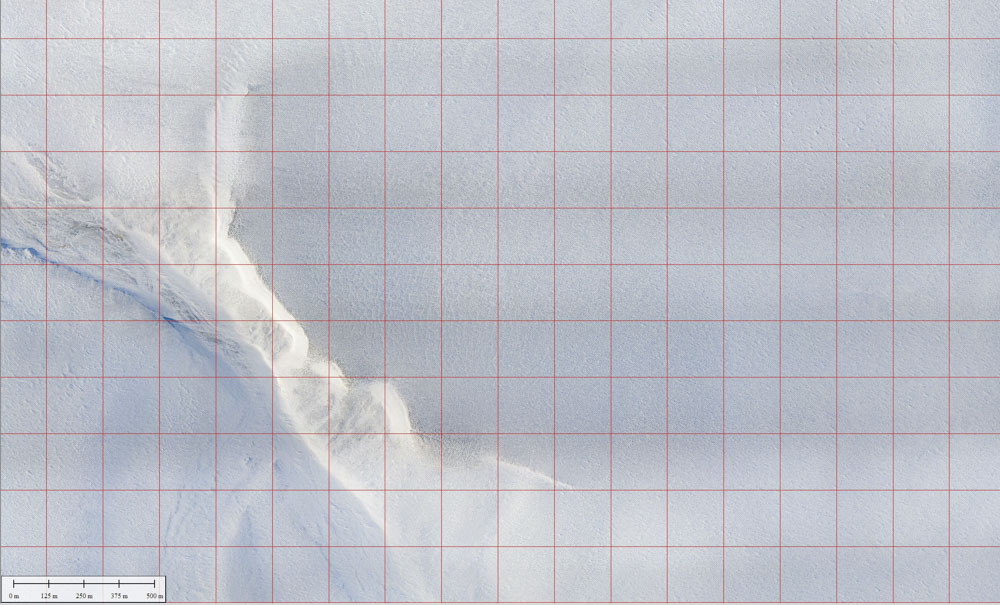
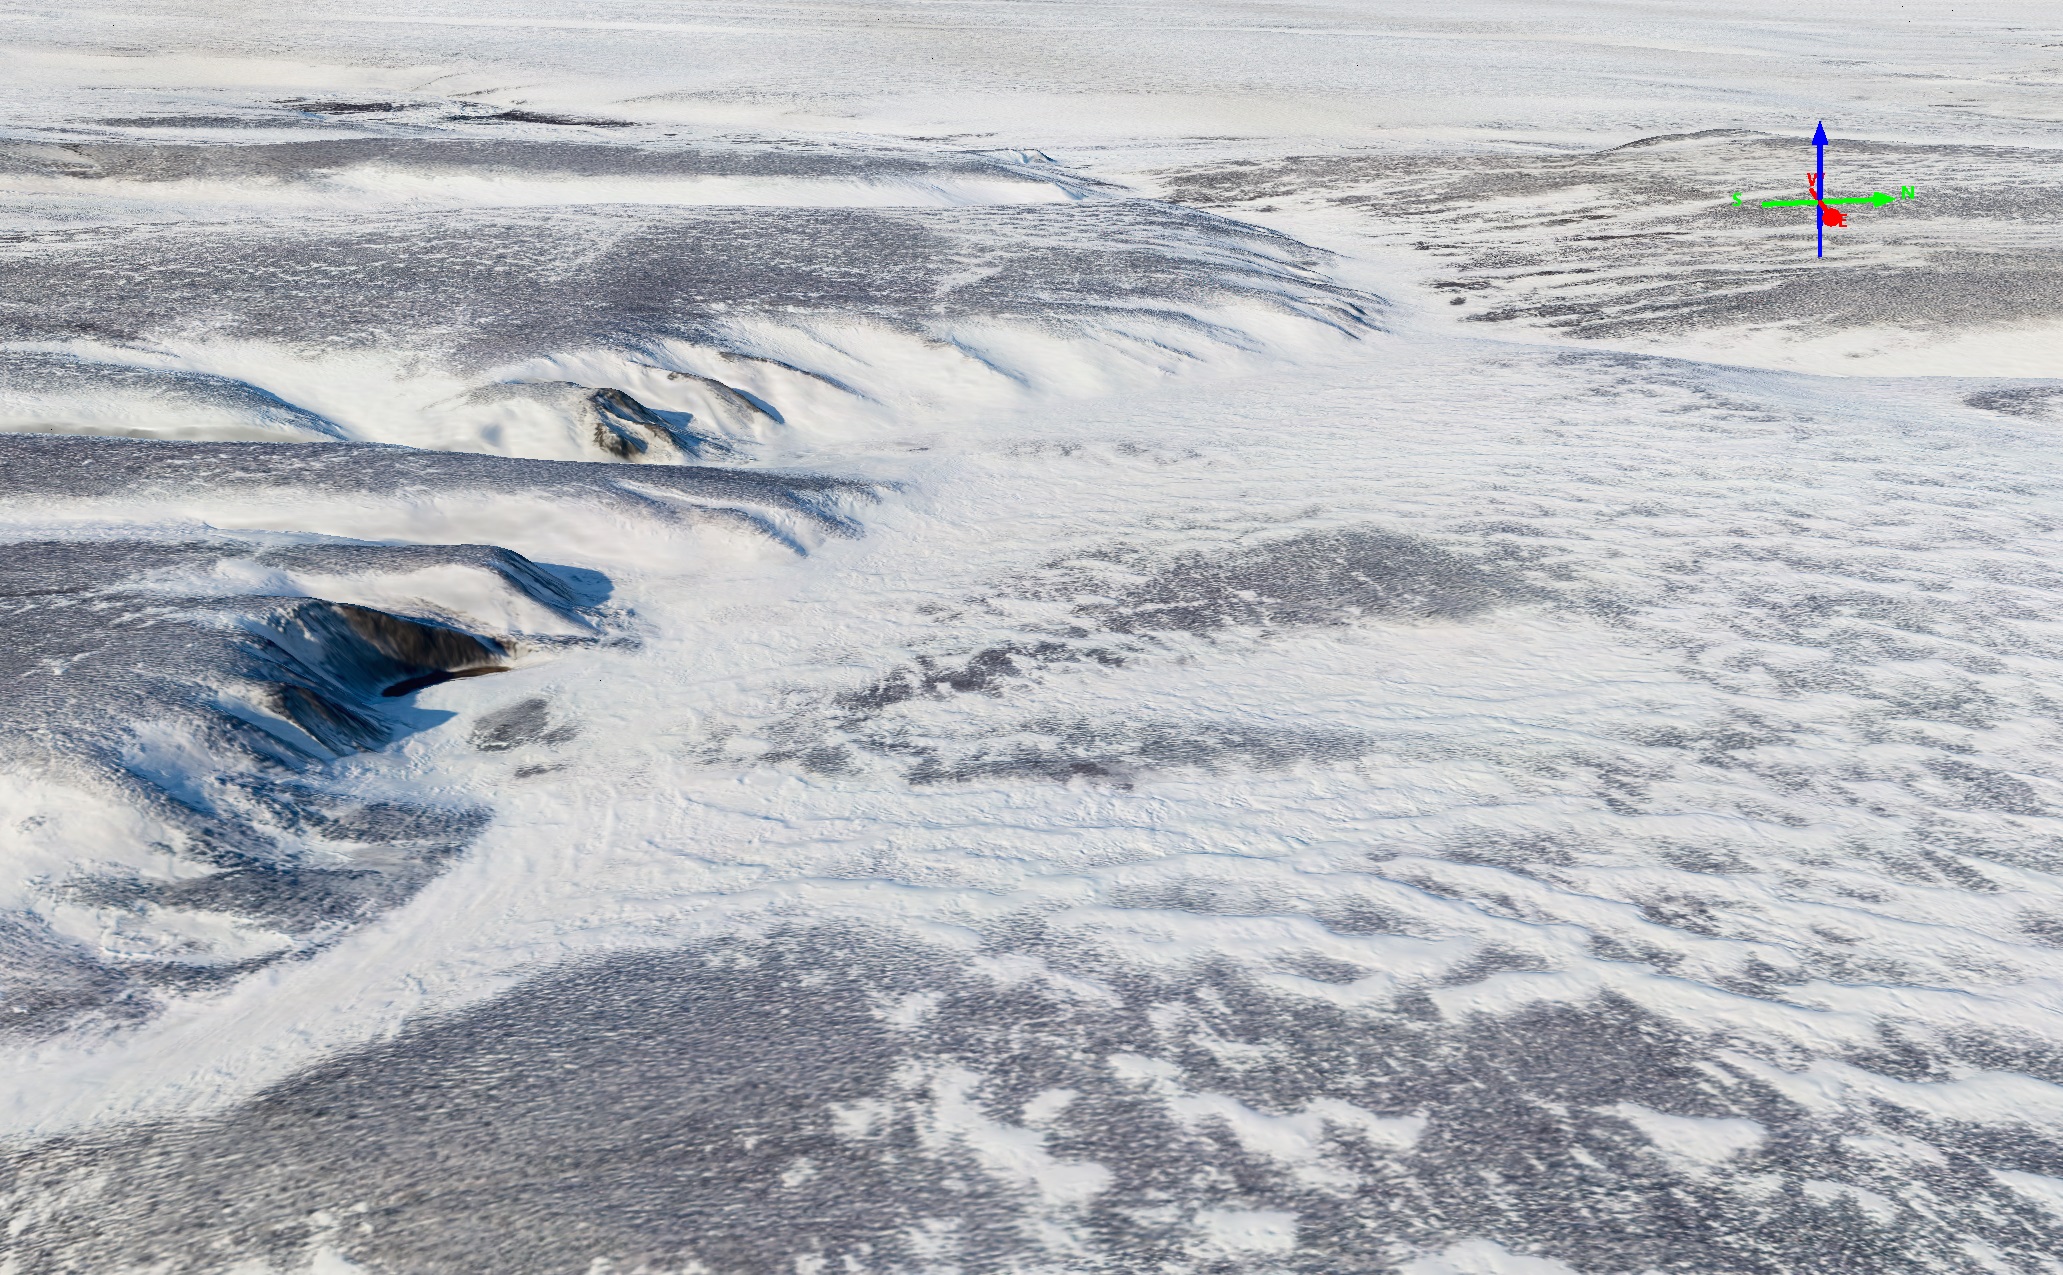
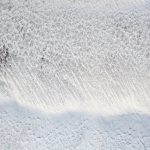
Example Pairs
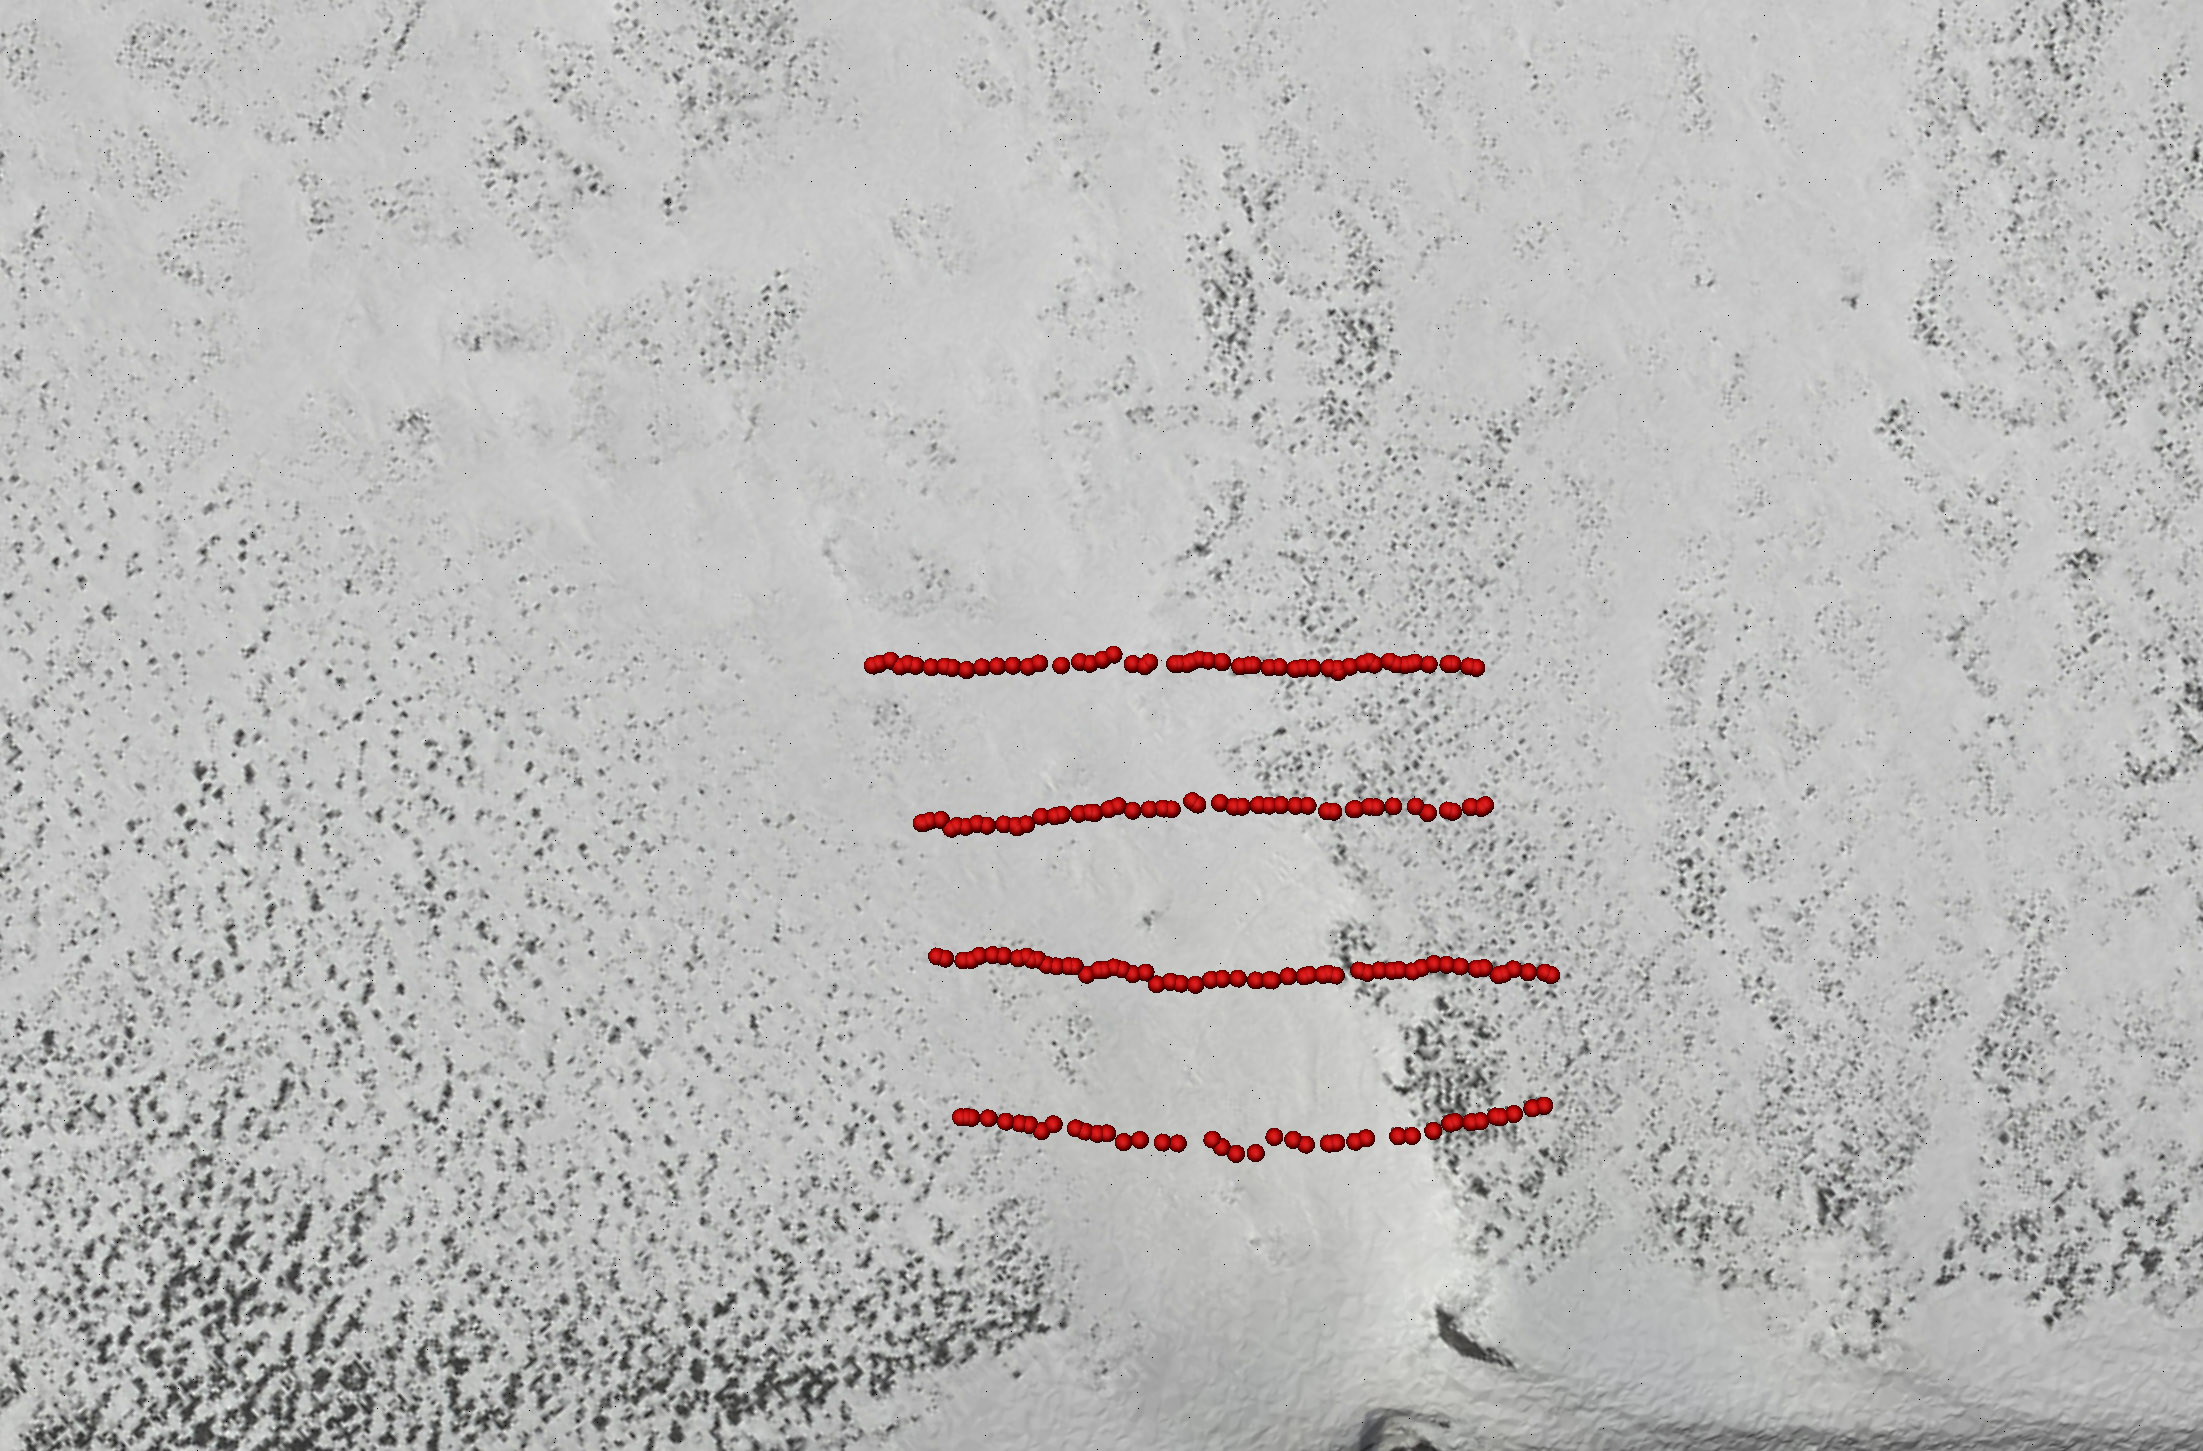
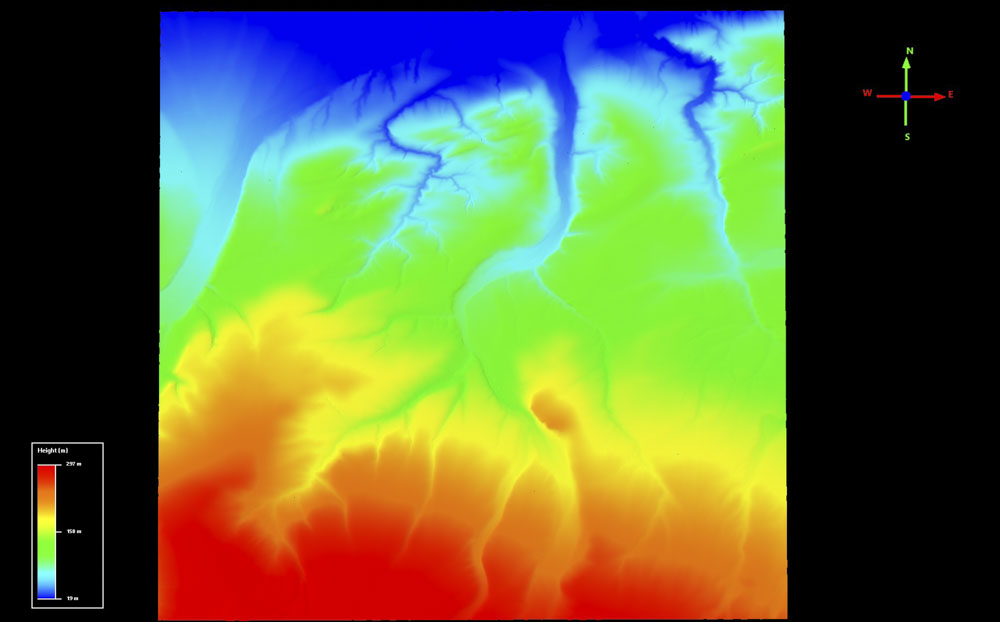
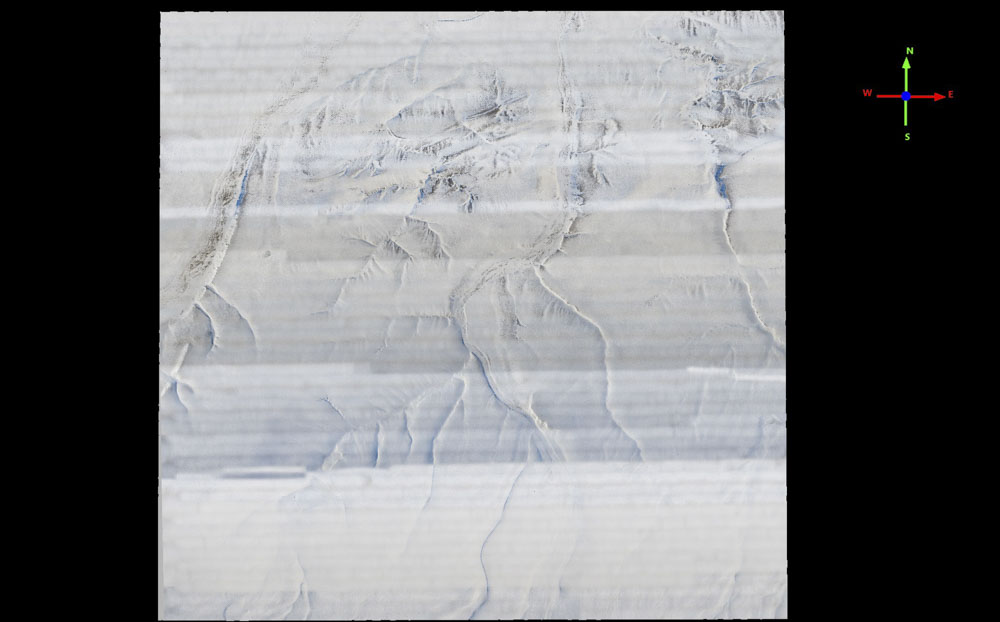
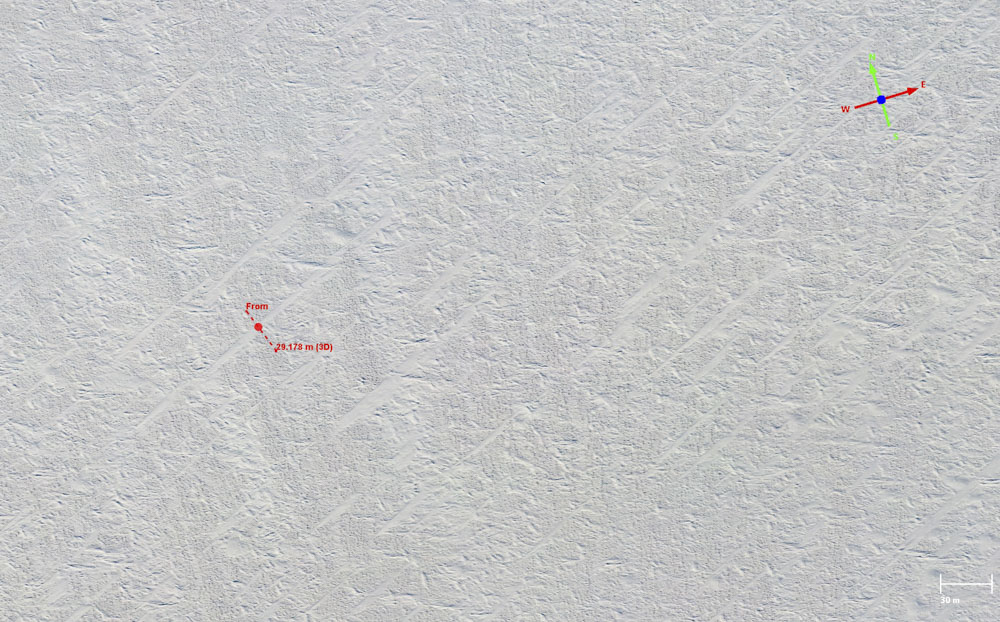
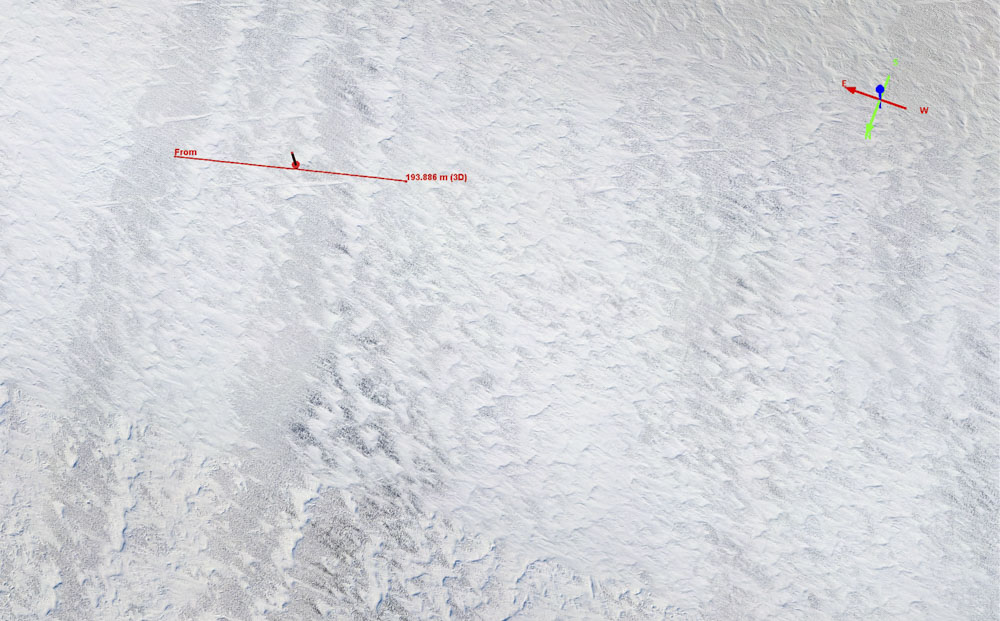
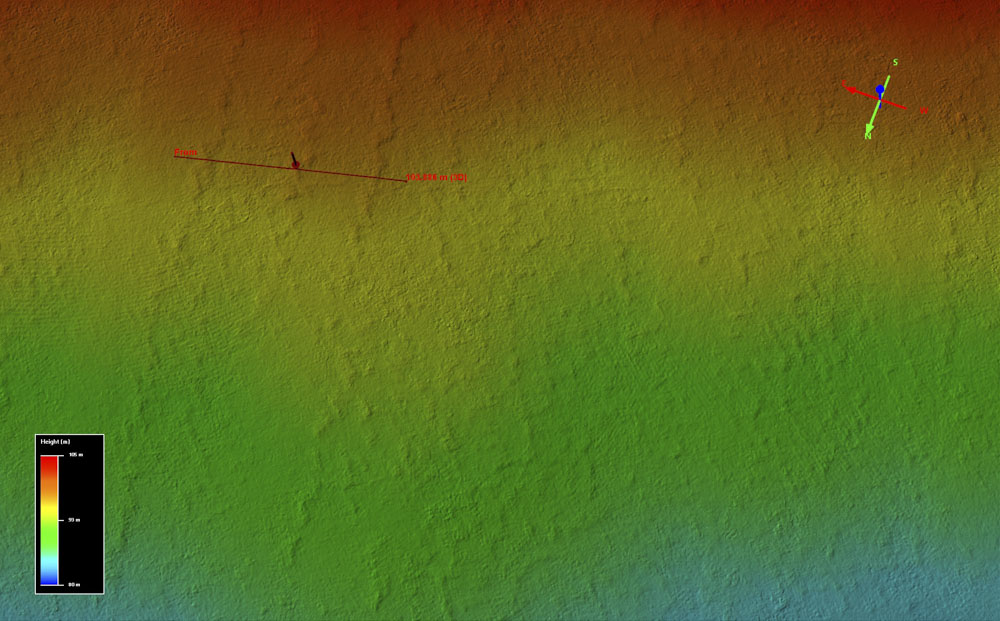
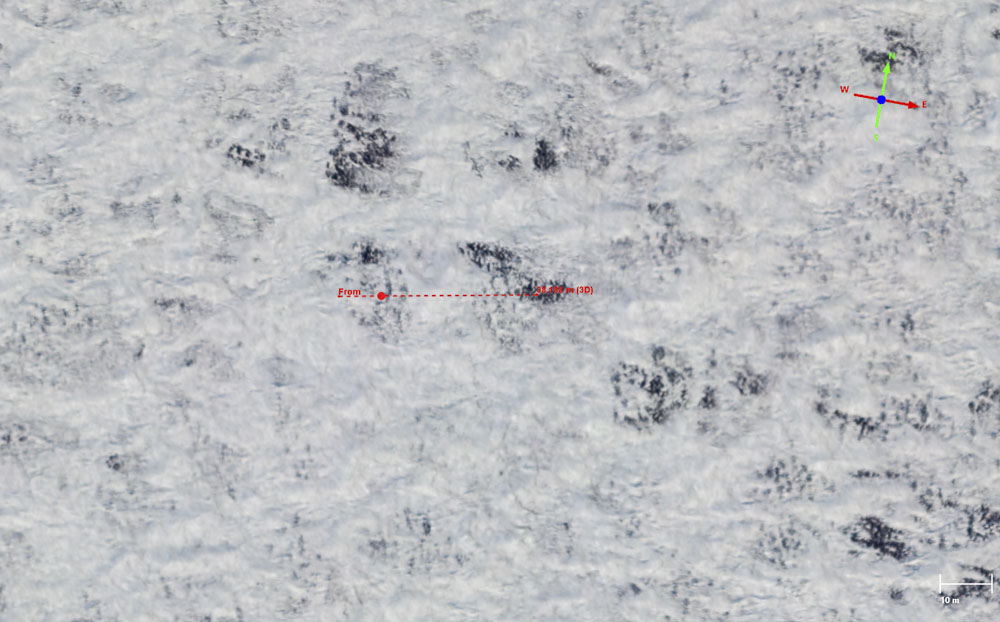
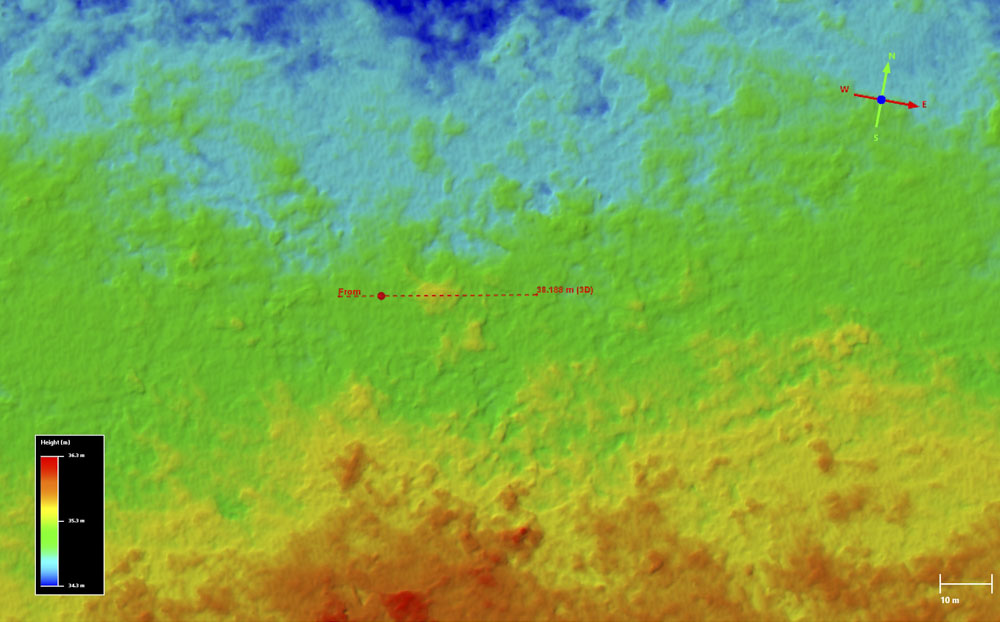
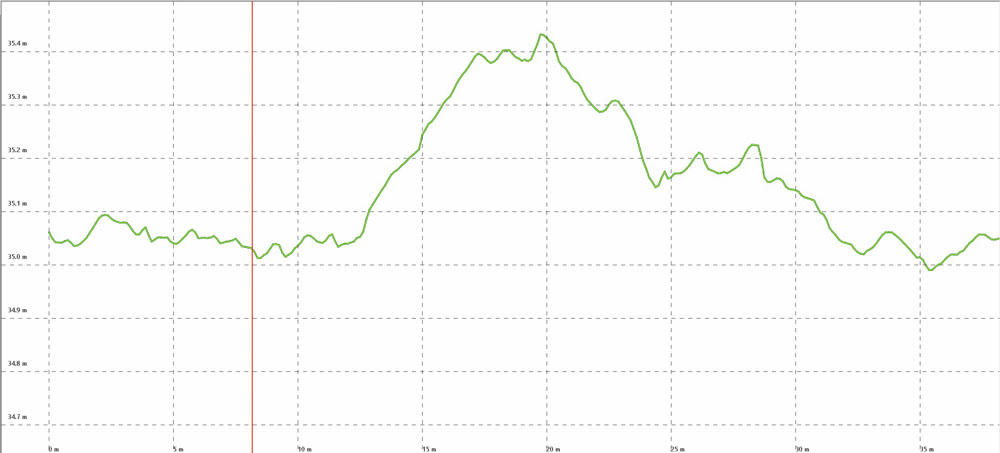
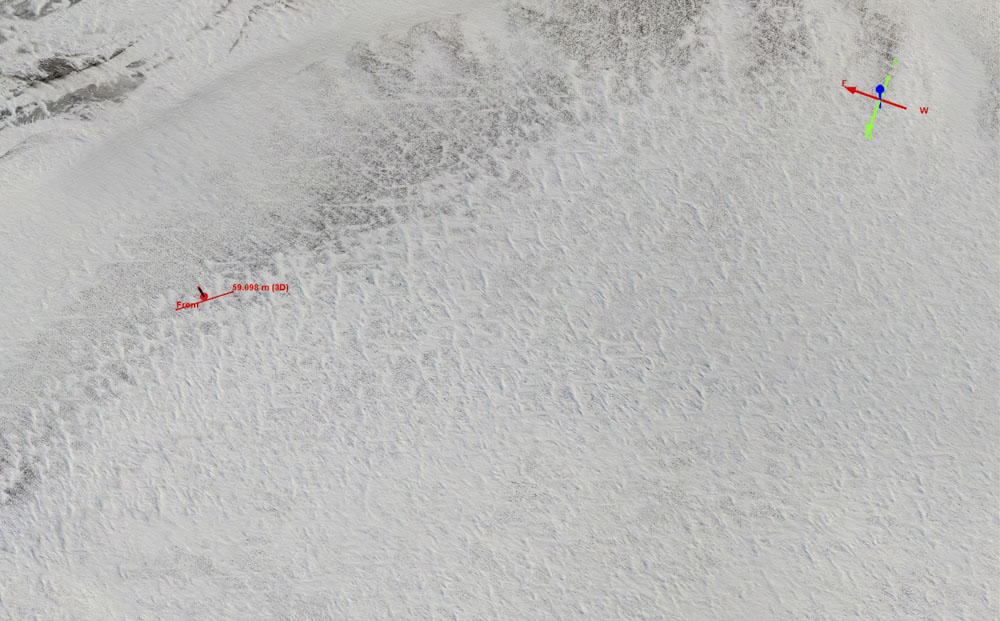
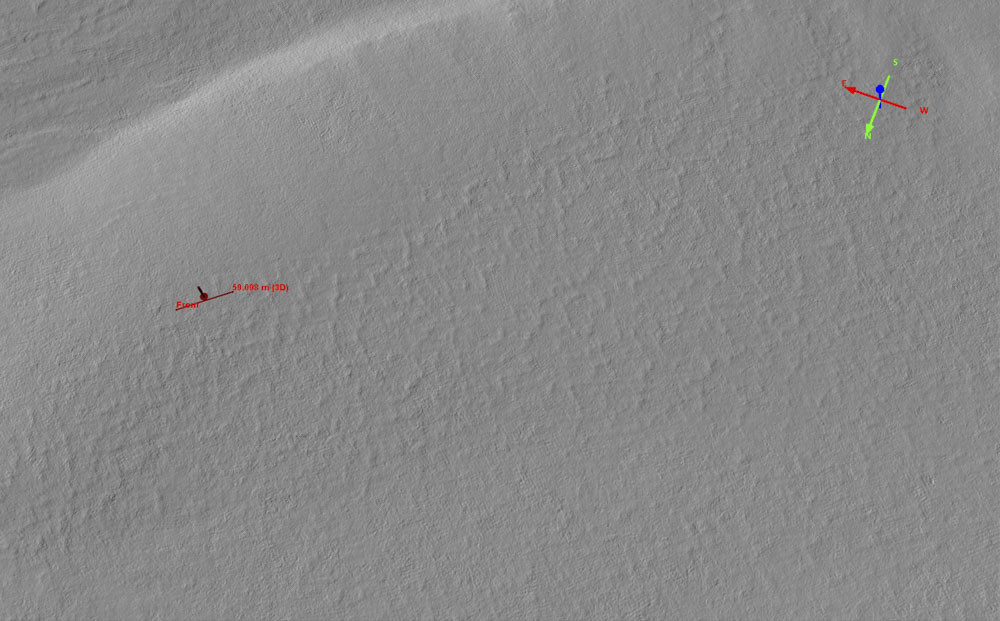
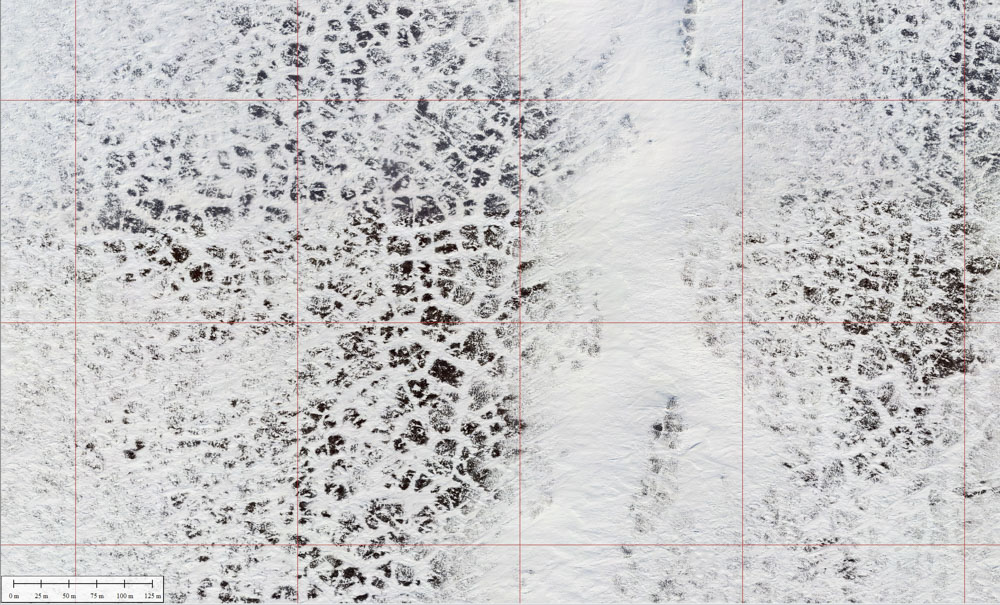
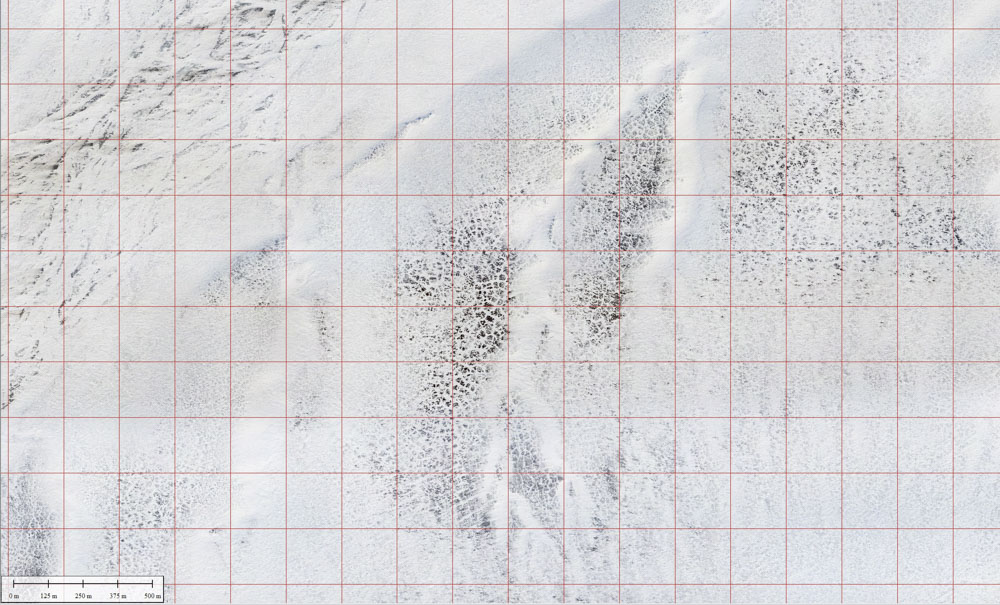
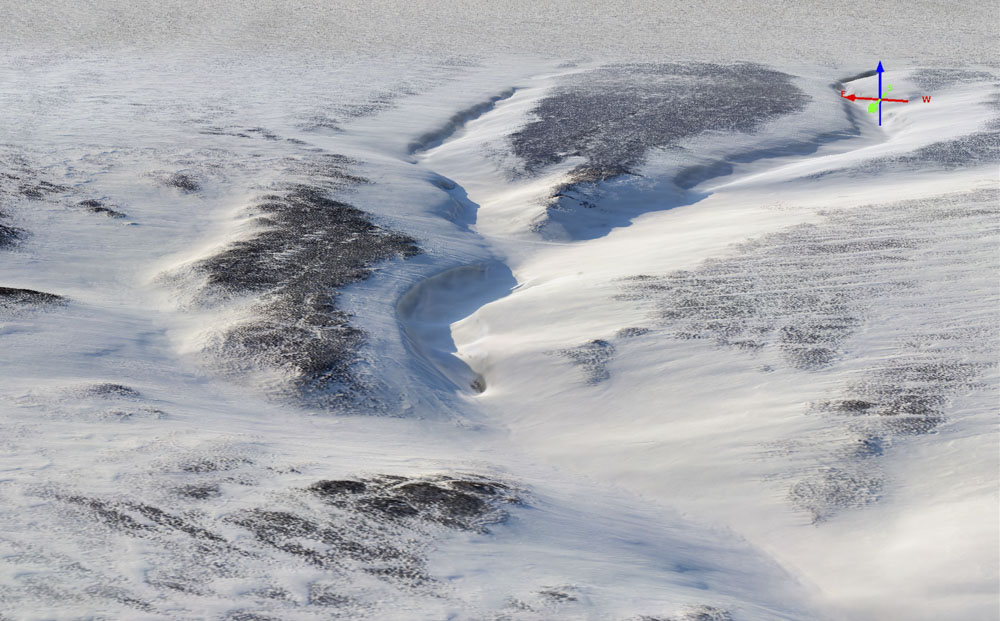
It’s difficult to show both detail and spatial extent in 2D images, which is why ultimately I hope to share the entire summer/winter data set using an online tool similar to Google Earth such that you can zoom in and out as you please. In the meantime, I’ve somewhat randomly pulled pairs screenshots below, first showing detail then showing surrounding extent, to give an impression for the nature of wind scour here. Just to repeat to emphasize the point, this blog is just showing the data qualitatively — once I fully process the data we will have actual snow thickness measurements (like 12 cm, 18 cm, etc) for each pixel you see here. The examples shown in this section are outside the data snippet I provided for downloaded, since you can look at those data on your own.

Want to Download the Data and See for Yourself?
I’ve provided two ways you can view some of the data on your own if you have Google Earth. The full block of data I’ve processed is 8 GB when compressed fairly heavily, about 150 GB uncompressed. So I cut out a snippet that I thought was of manageable size to share via Google Earth. Note too that the imagery is heavily compressed to facilitate download, such that my version is probably twice as sharp as seen here.
The first method is to download a KMZ file here, then you can fly around on it locally but you will have to download a 375 MB file. It also includes the seismic checkerboard for the 1002 Area. If you have the bandwidth and are nerdy about these things, this is the better option.
The second method is to download this network link KMZ that is only a few kB and same as above, but the imagery may be a bit sluggish in loading to your computer as it is not stored on your computer.
If you just want the 200 m x 200 m seismic checkerboard grid, you can download that here, it’s small; if you have read this far, I think you would find it jaw dropping regardless of your interest in snow or fodar.
The Implications of these Data for Overland Seismic Work
What I’ve shown in this blog is really just the quick-and-dirty tip of the iceberg in terms of what I plan to do with the data I have in hand and what is possible in the future, but it nonetheless clearly demonstrates that vast areas of the Arctic NWR were snow free this winter, confirming quantitatively what we have anecdotally observed in many previous winters.
I see the implications of these measurements for oil exploration falling into two main categories.
First, by law (and simply because it’s a good idea) we need to protect the ecosystems here from potentially massive impacts, and ensuring a minimum snow cover provides at least some hope in that direction. Perhaps as importantly, there is already a lot of momentum to reverse the laws allowing development access in this otherwise highly protected and pristine wildlife refuge, but if the first thing that occurs here is that 40,000 miles of tire ruts get left behind, the resulting public outrage will virtually guarantee that no drilling will occur out here for decades. So to prevent everyone from losing (no drilling and a devastated pristine landscape), we need to measure snow like this several times per year for many years to develop an appropriate characterization of both snow cover and snow dynamics, as well as include some field studies to measure things like density and hardness. This approach is nothing new to science. And we need to have an independent monitoring program during and after after seismic work to validate that the permitted protocols were followed, as well as a long-term monitoring program during summers to determine the long-term impacts of this overland travel along with better definitions for what is considered ‘damage’ and who is responsible for mitigating that damage.
Second, the cost of this seismic work is in the hundreds of millions of dollars — can you imagine being an investor in this work and finding out the project had to be cancelled mid-stream because no one thought to check to see if the snow was ever thick enough to meet the legal, minimum standards? It’s one thing to say in a permit application that “We will measure snow depth ahead of our trucks to ensure the legal minimums are met” and it’s quite another to say to an investor “Sorry, we just spent $50M of your money on mobilization for something that’s apparently never going to happen, so can you write us another check so we can use more appropriate methods?” So, yeah, I think there is real economic value to getting an accurate understanding of snow pack out here before committing huge resources to a plan that is likely to fail and start considering alternatives now, like eliminating the overland travel by heavy vehicles and using using point sources for acoustic energy (which has been previously demonstrated to work fine here) deployed by helicopter, allowing work to proceed in any season to eliminate many wildlife issues as well. Even simply identifying which areas are likely to be too thin for overland seismic could pay for itself 100x given the economics in play here — that’s a pretty healthy ROI in any industry!
So whether you support oil development or oppose it, I hope you agree that the implications of these data are clear — we need to make high-resolution photogrammetric mapping of snow in the 1002 Area a priority.
We are so blessed to have cool new tools like modern photogrammetry to aid us in making responsible decisions in public land management. The question is will we?