2020 Fodar Measurements of Snow Depth in the Arctic National Wildlife Refuge
I just completed making over 20 billion measurements of snow depth over about 1500 square kilometers of tundra and mountains in the Arctic National Wildlife Refuge — my third year mapping snow on the tundra and seventh year in the mountains — contributing further to the largest data set of Arctic snow depth measurements ever which will assist us in understanding the winter ecology of the local wildlife and flora, in assessing the impacts climate change has on the landscape, and in making responsible decisions regarding land use here.
What did I do?
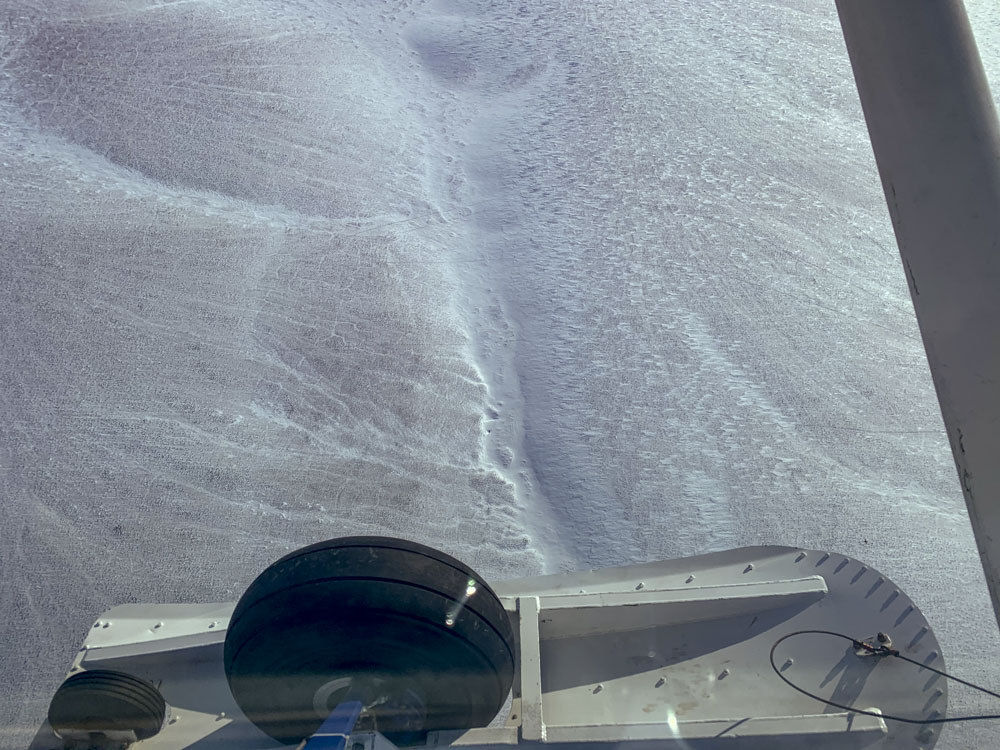
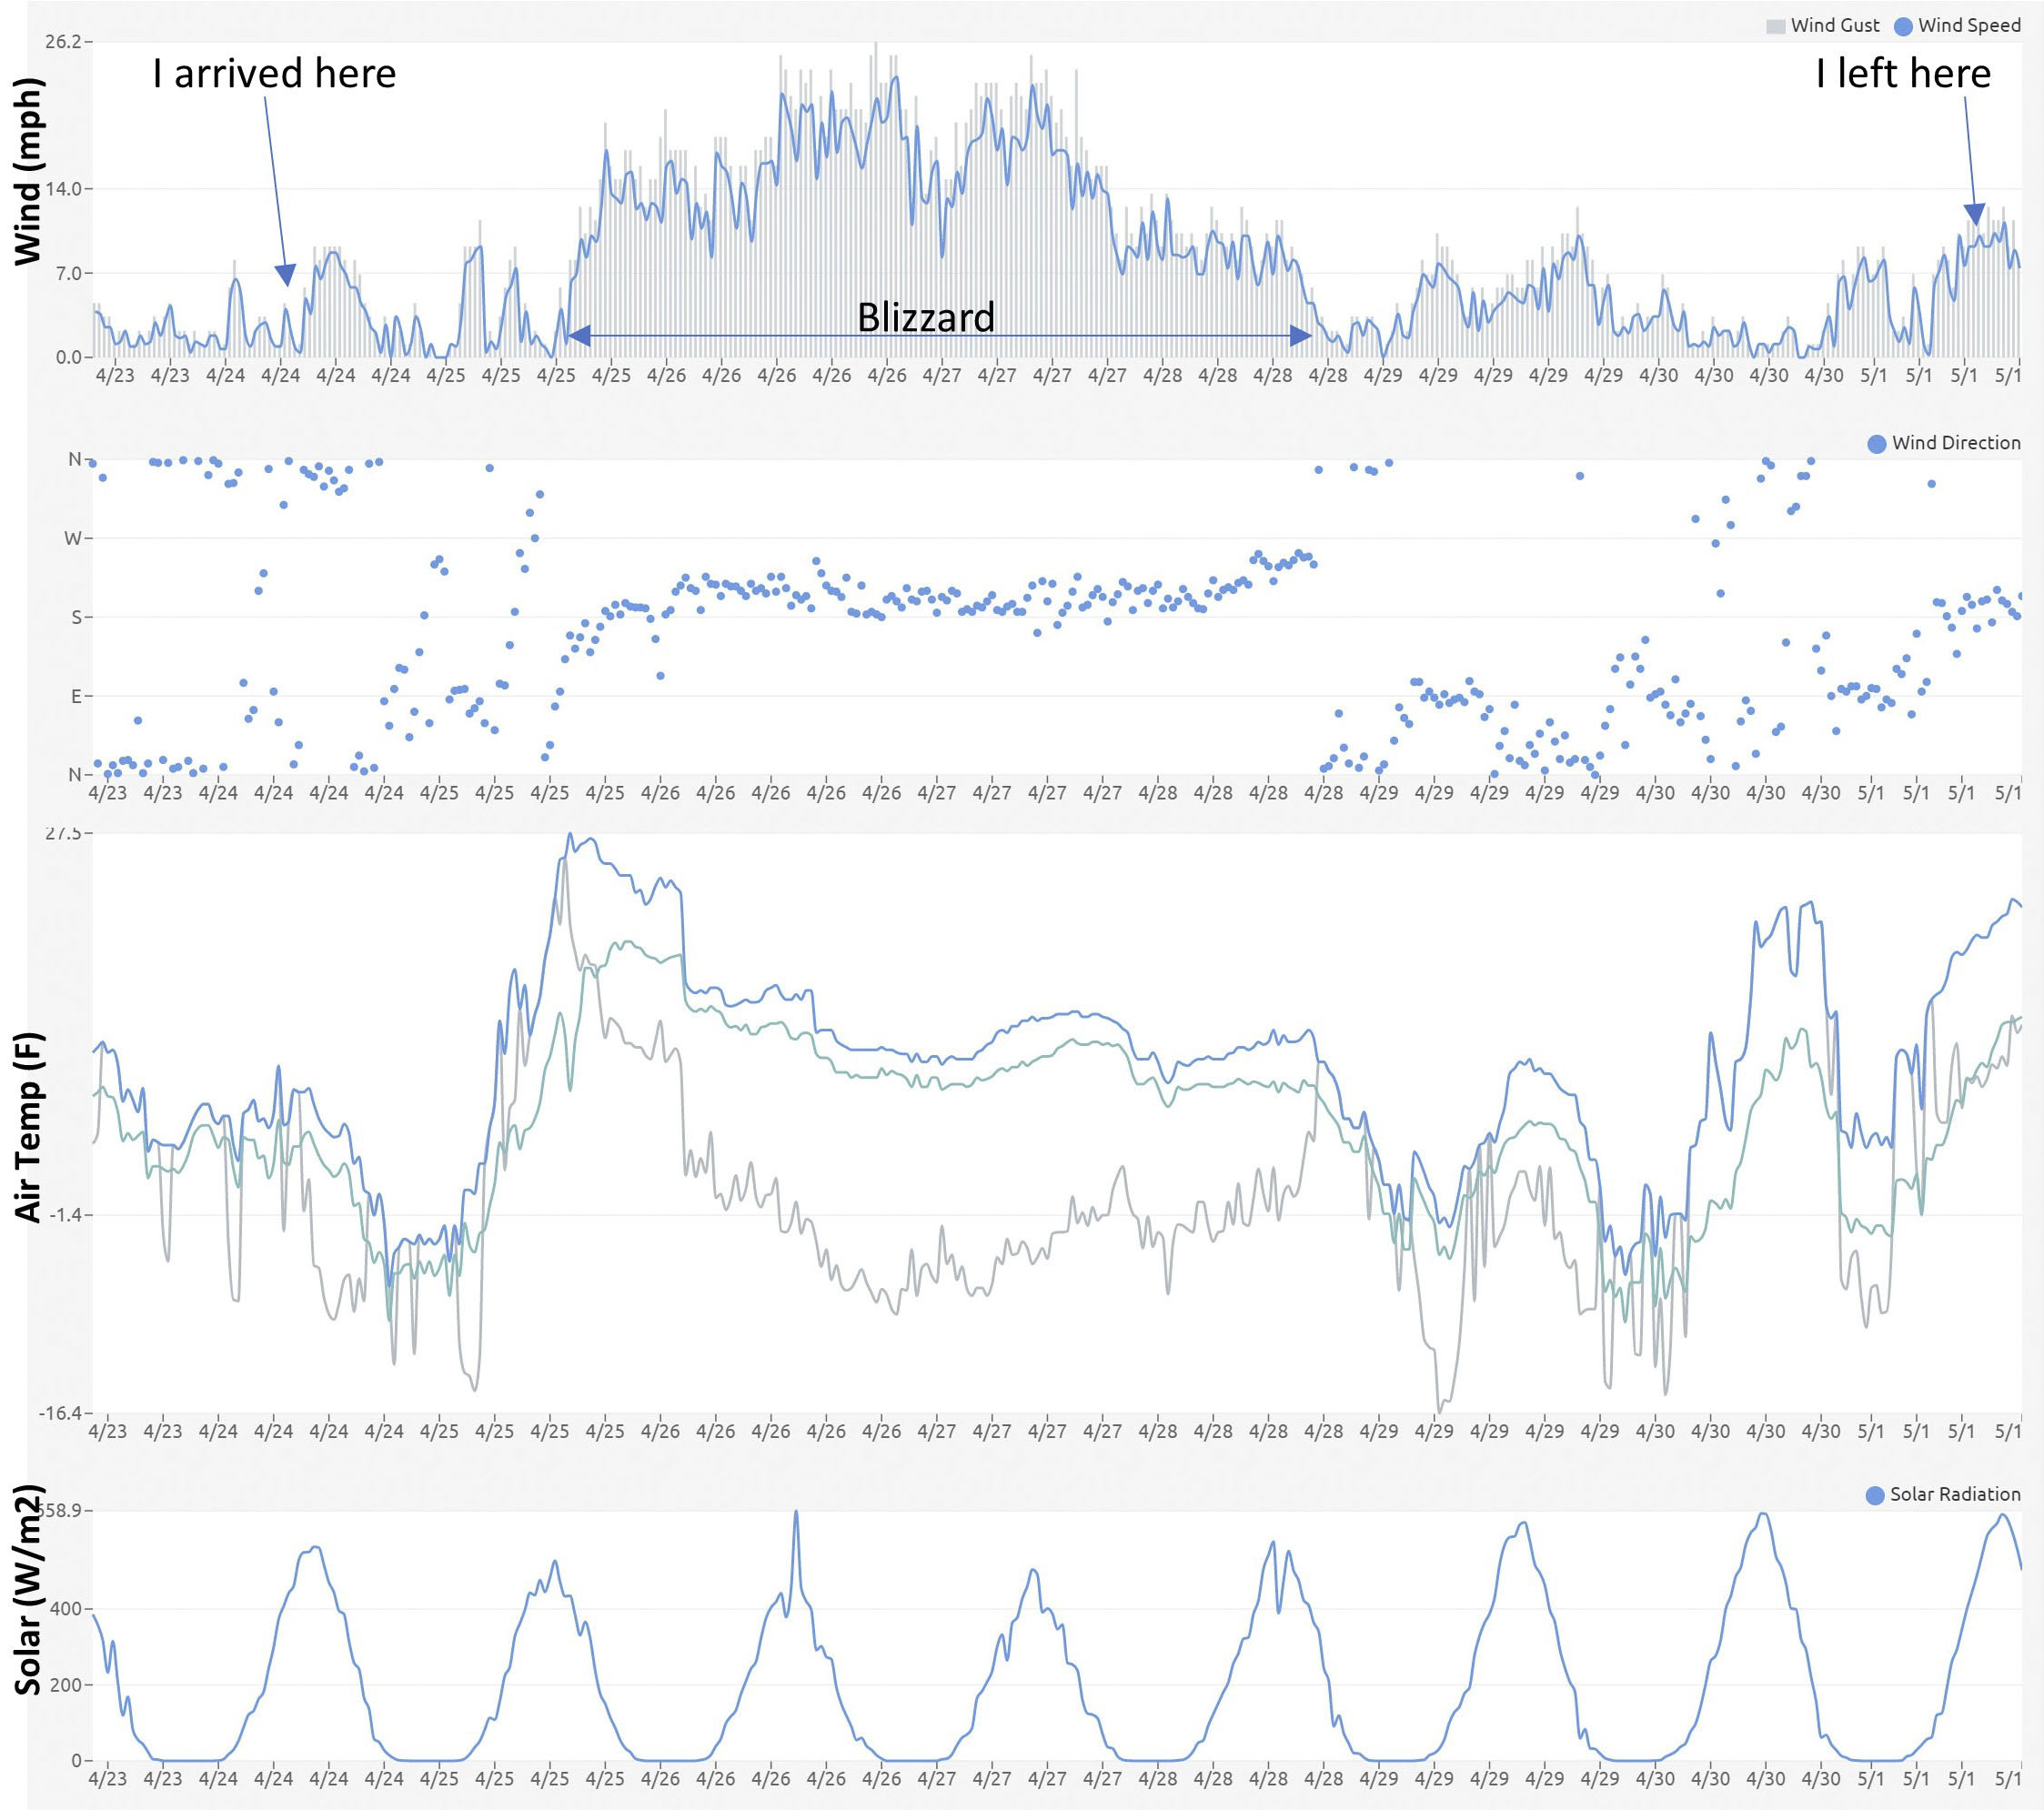
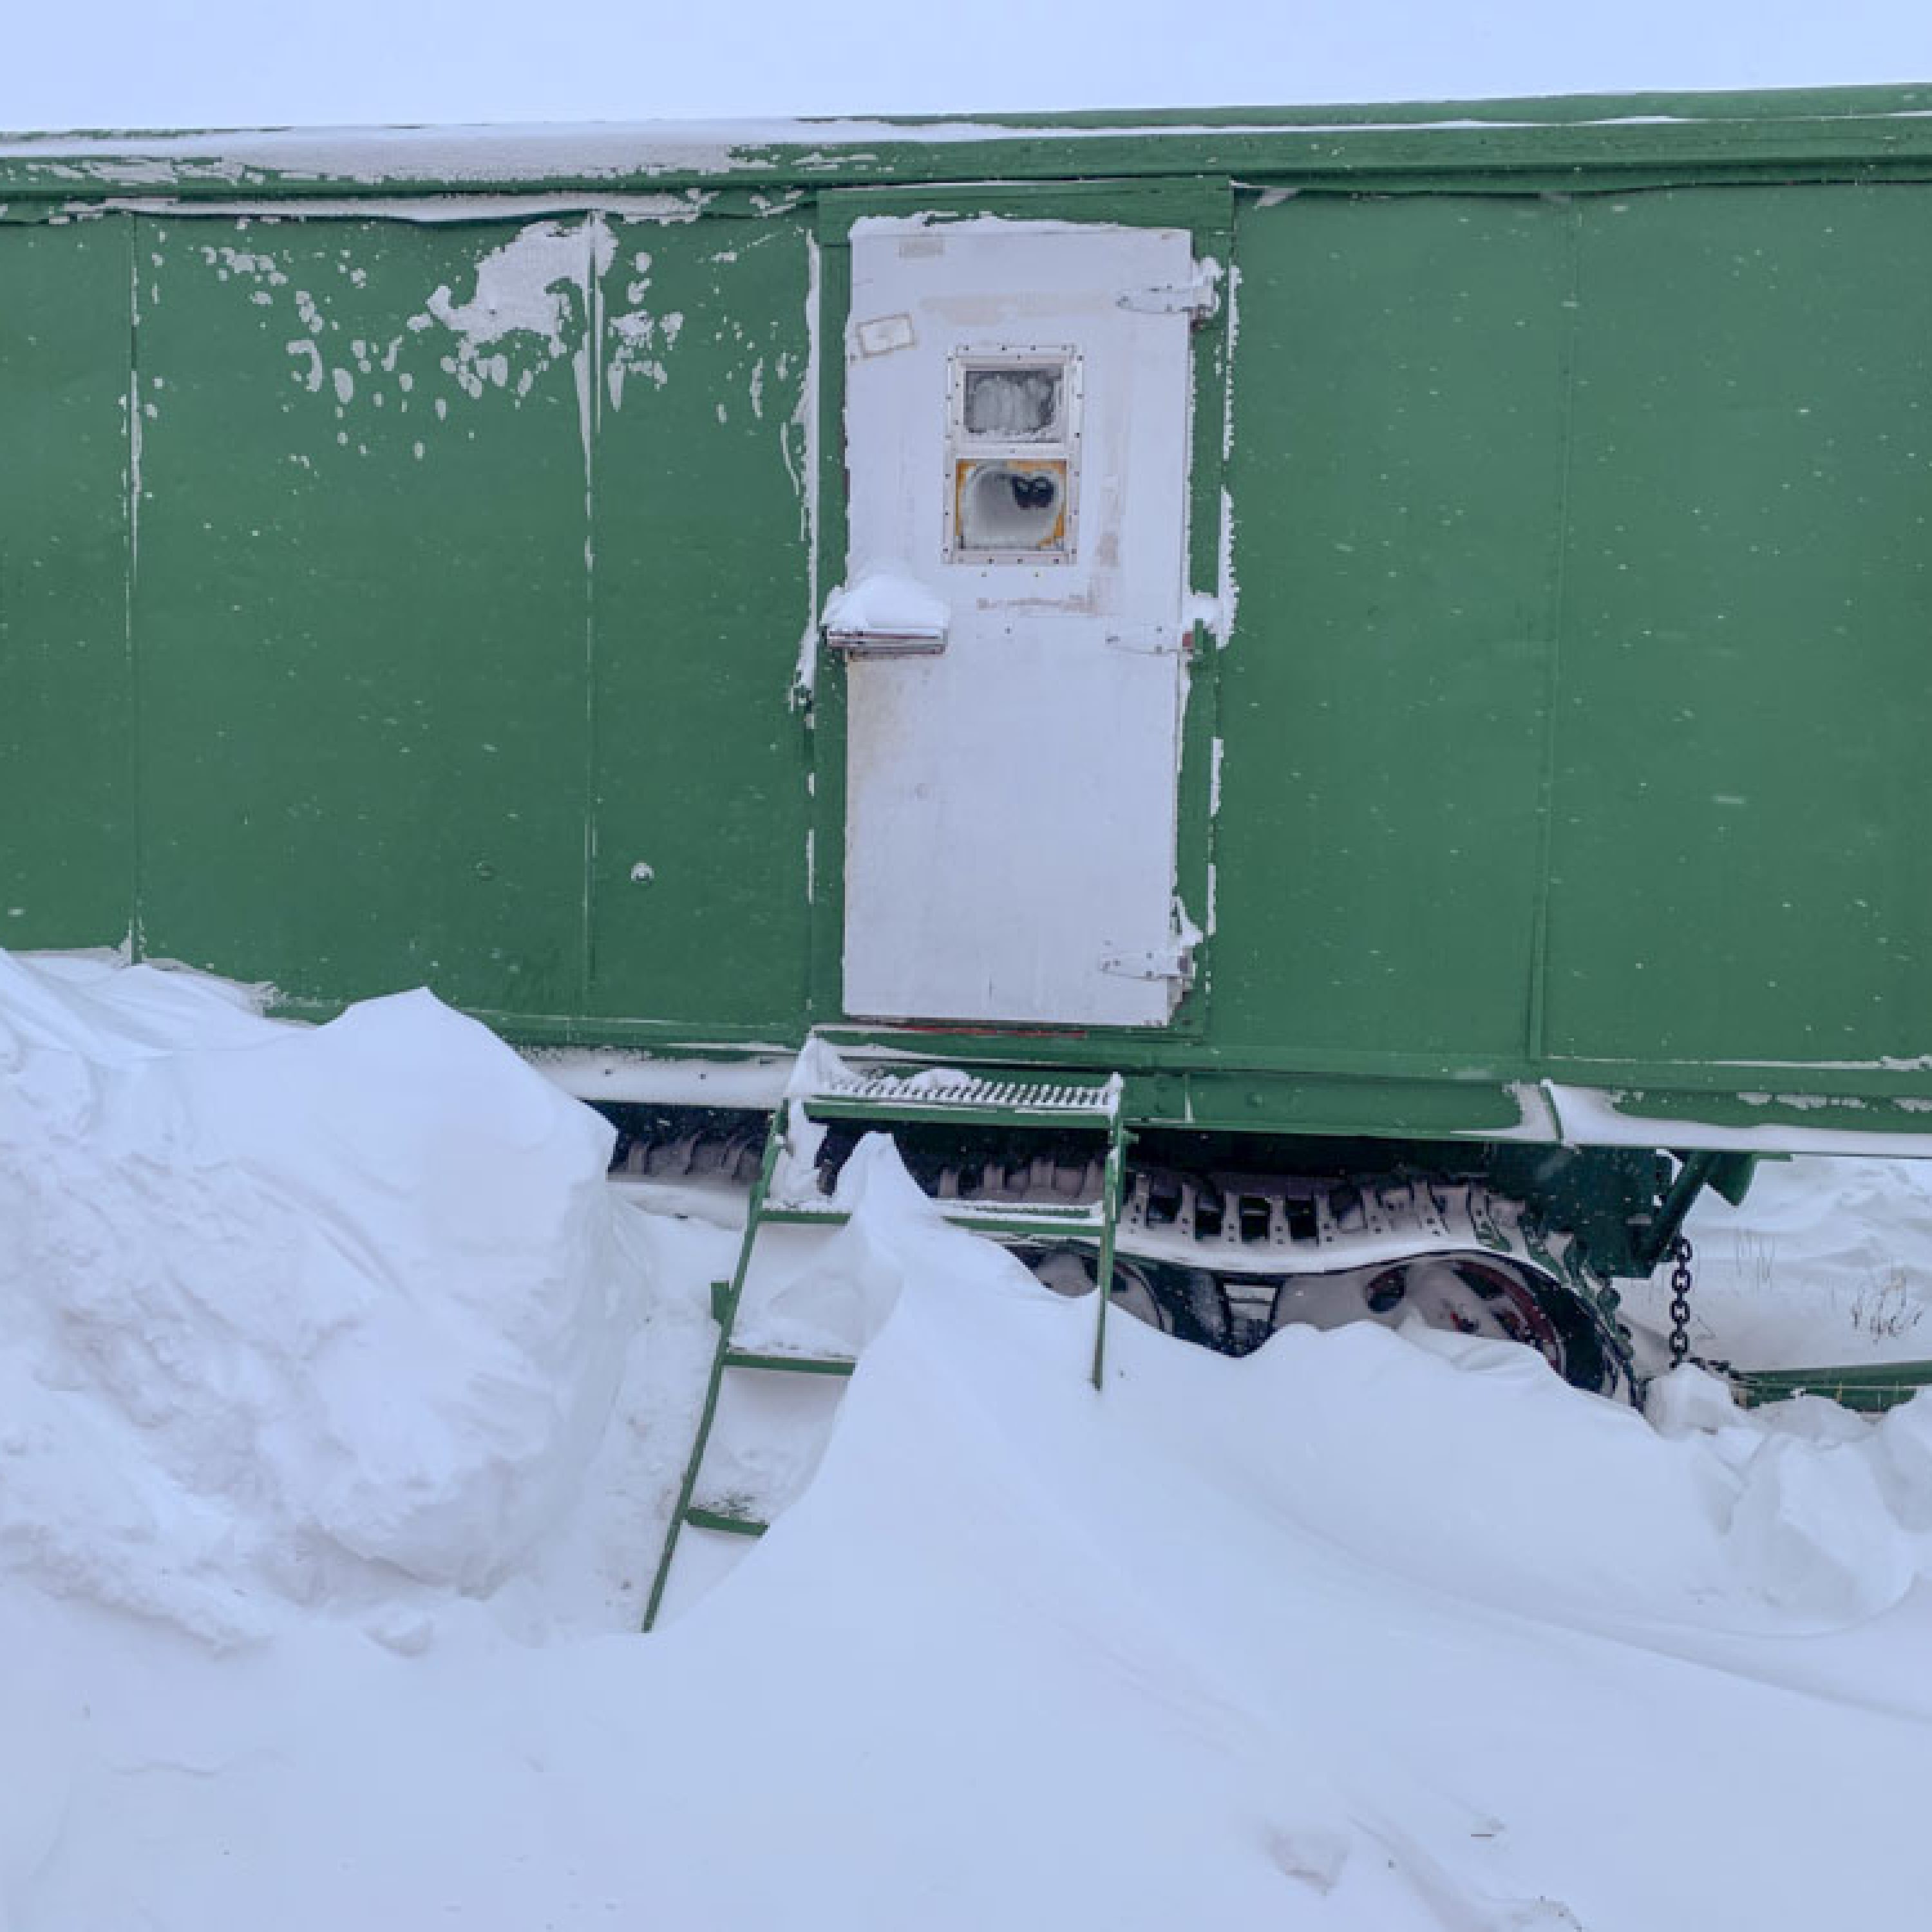
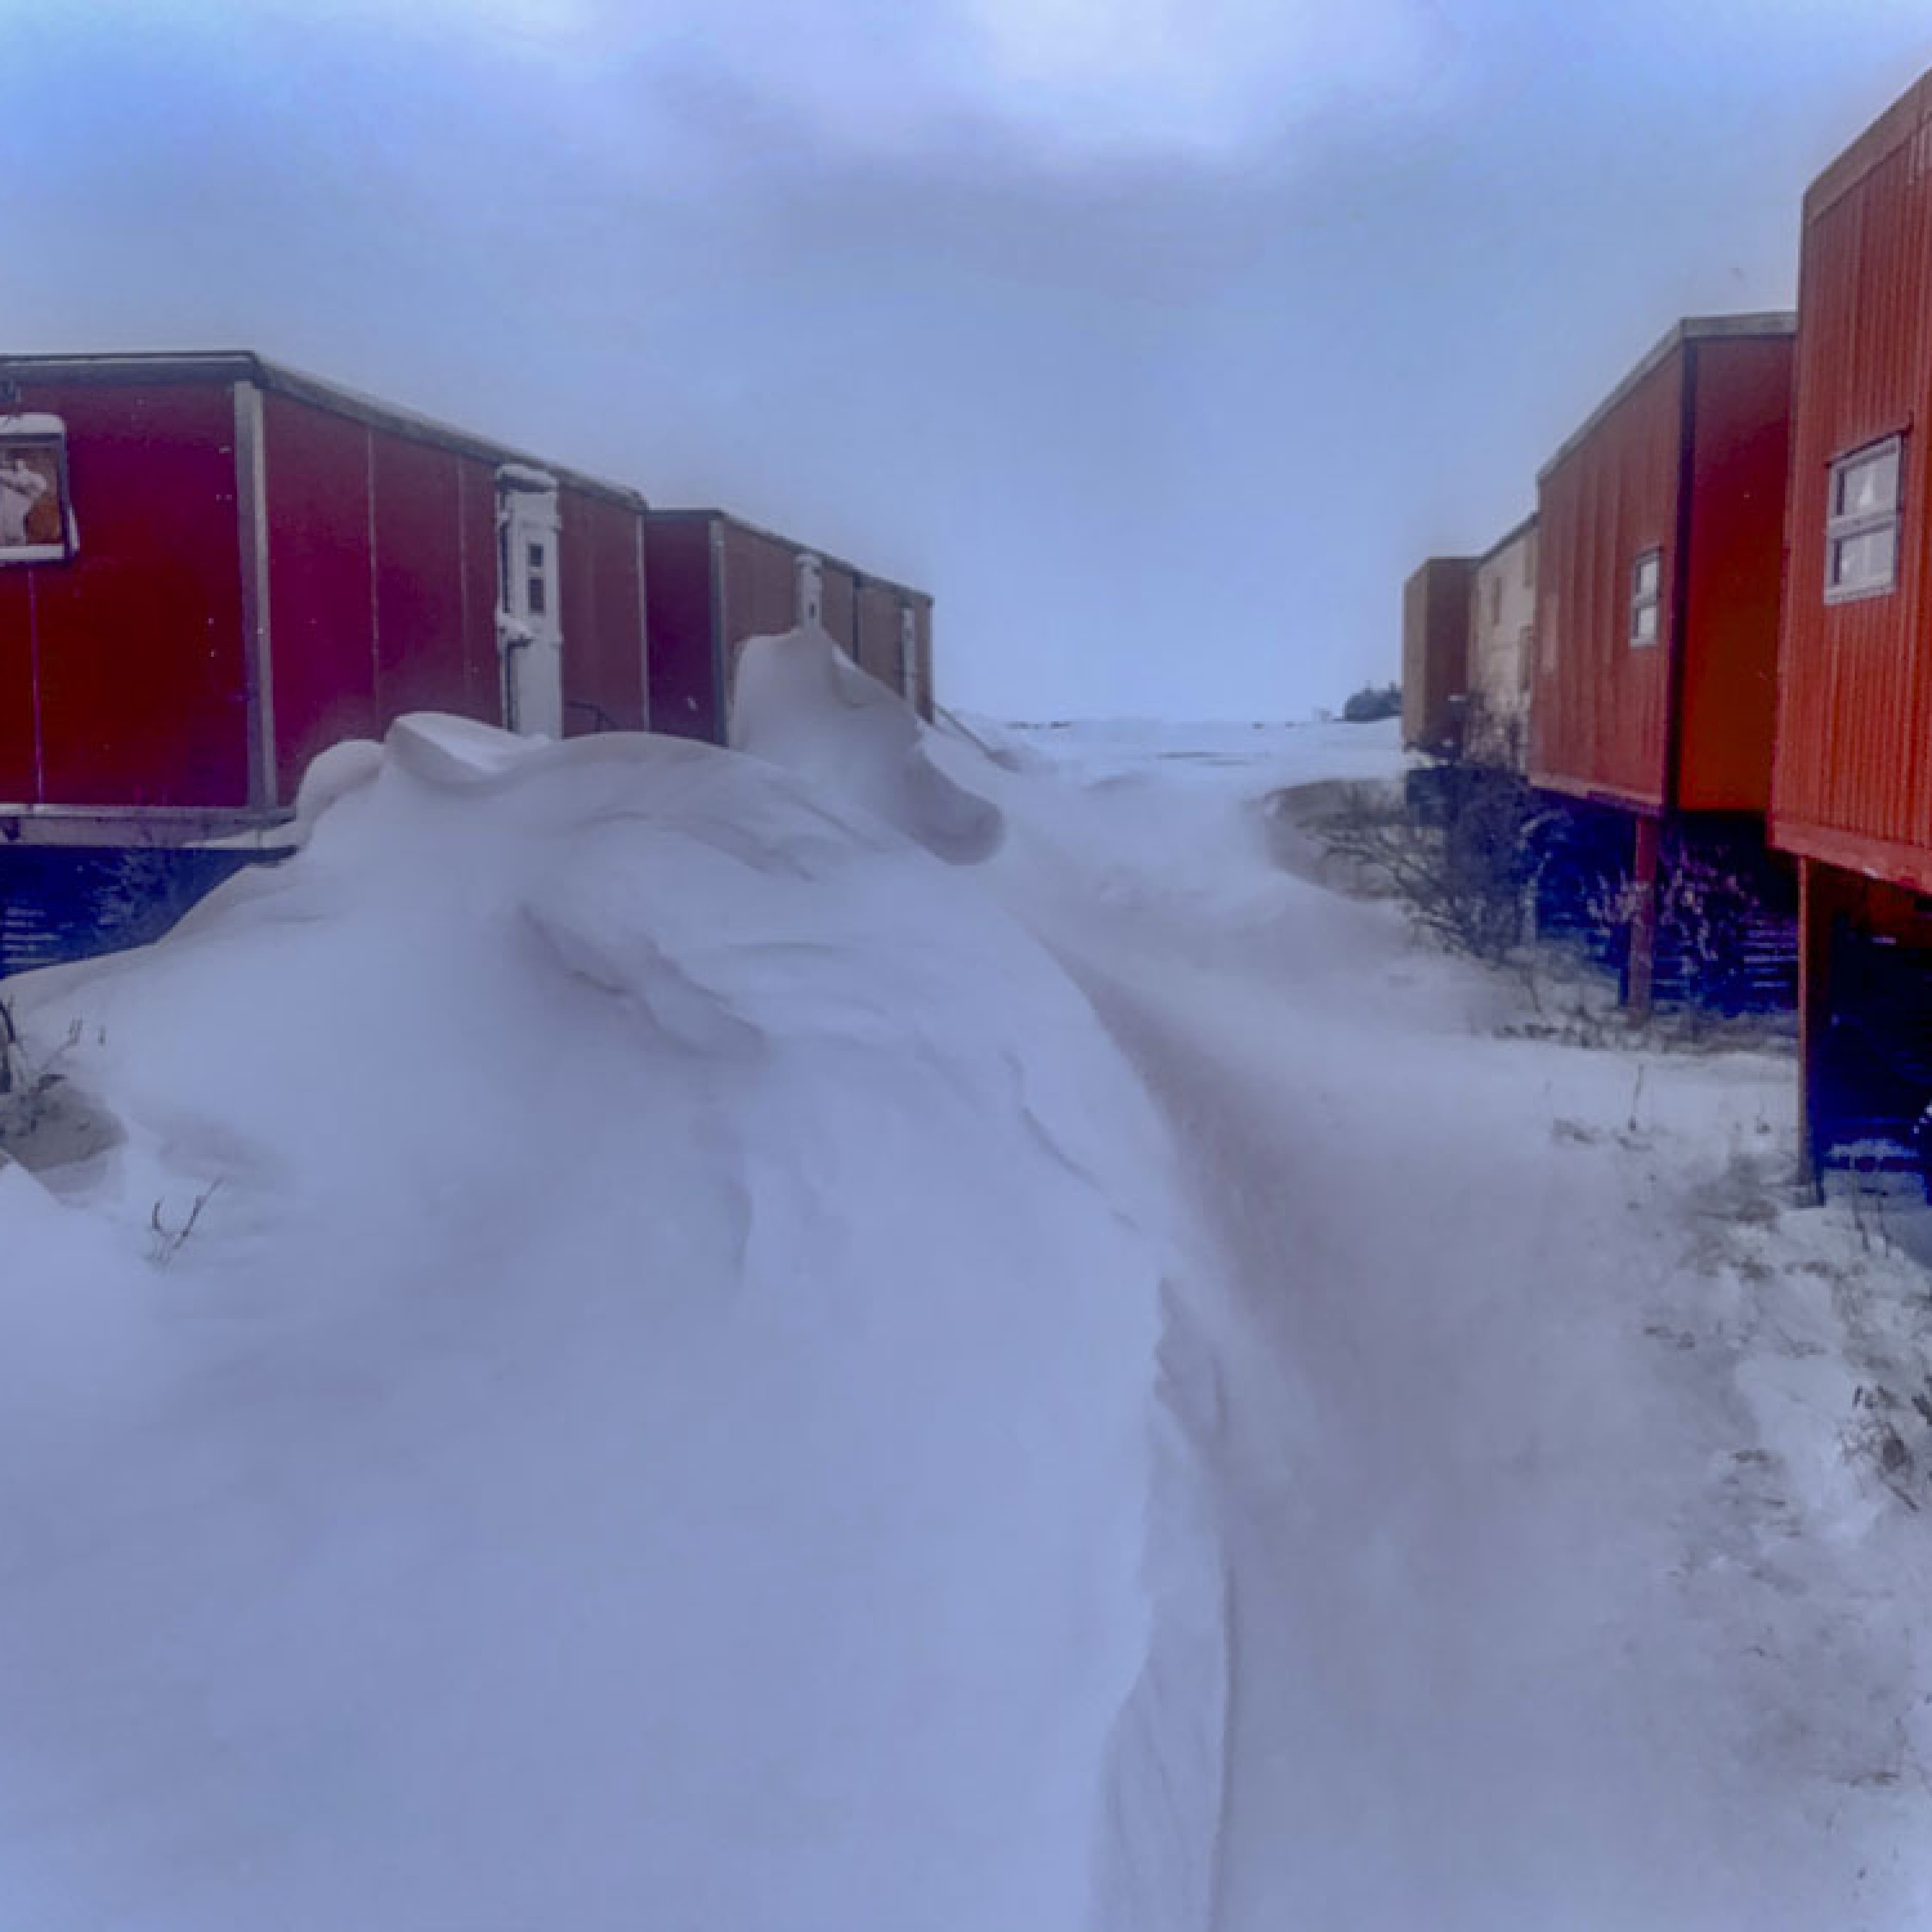
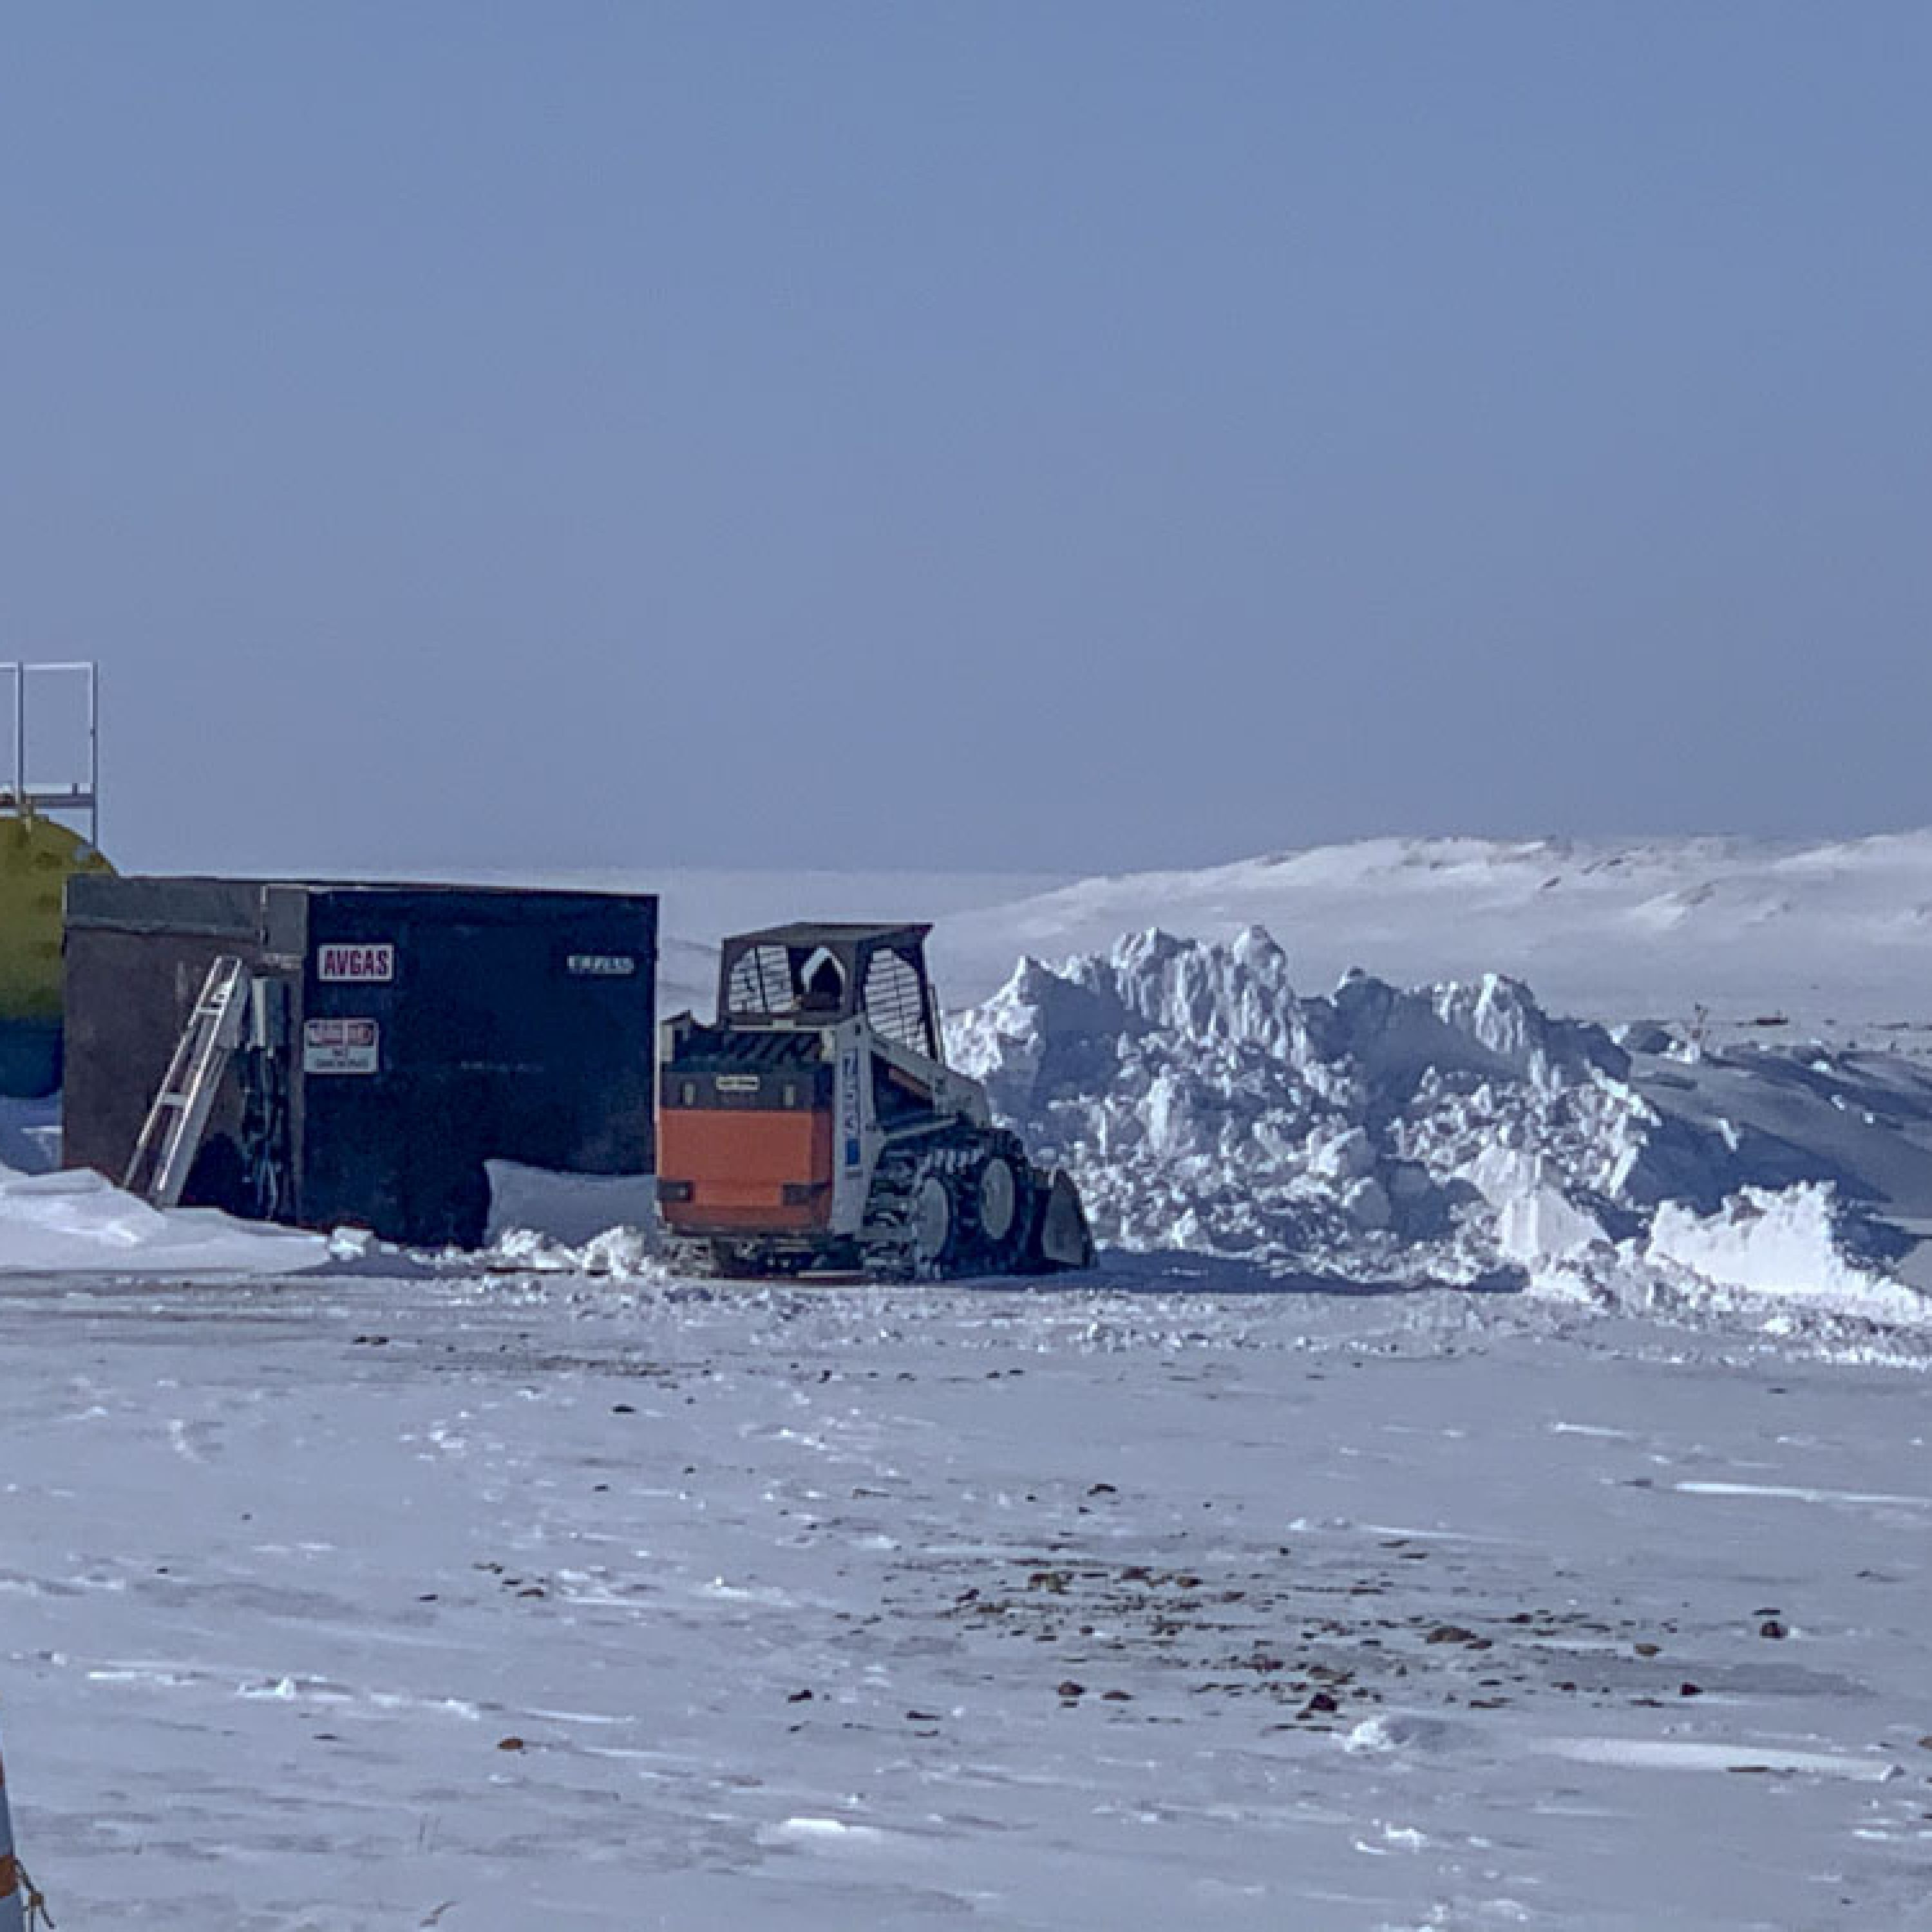
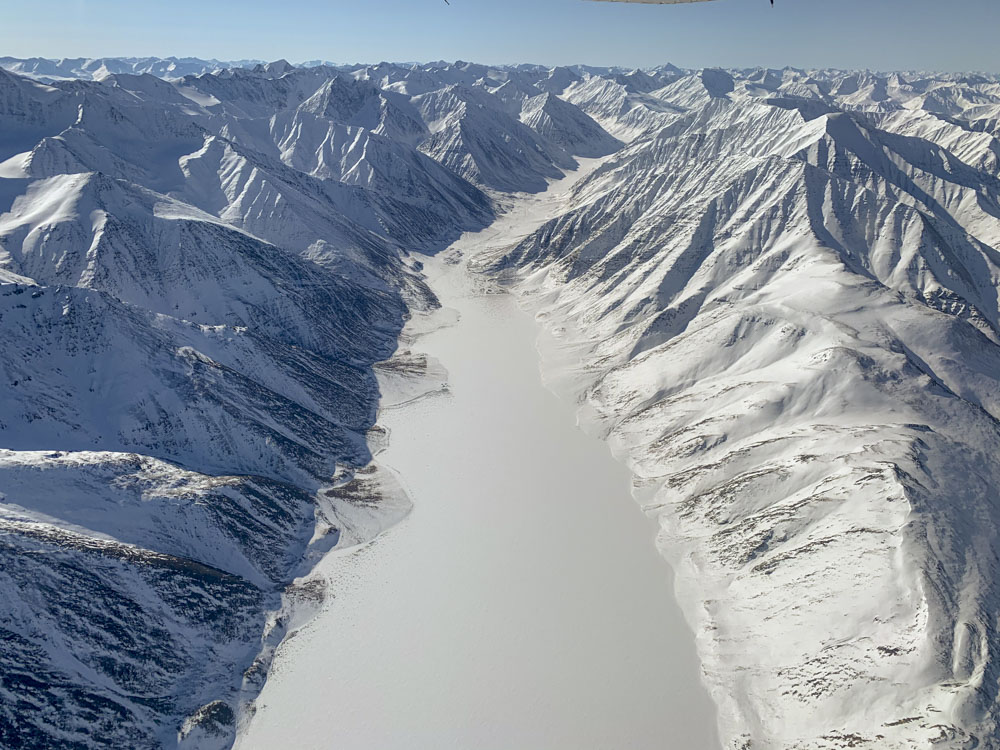
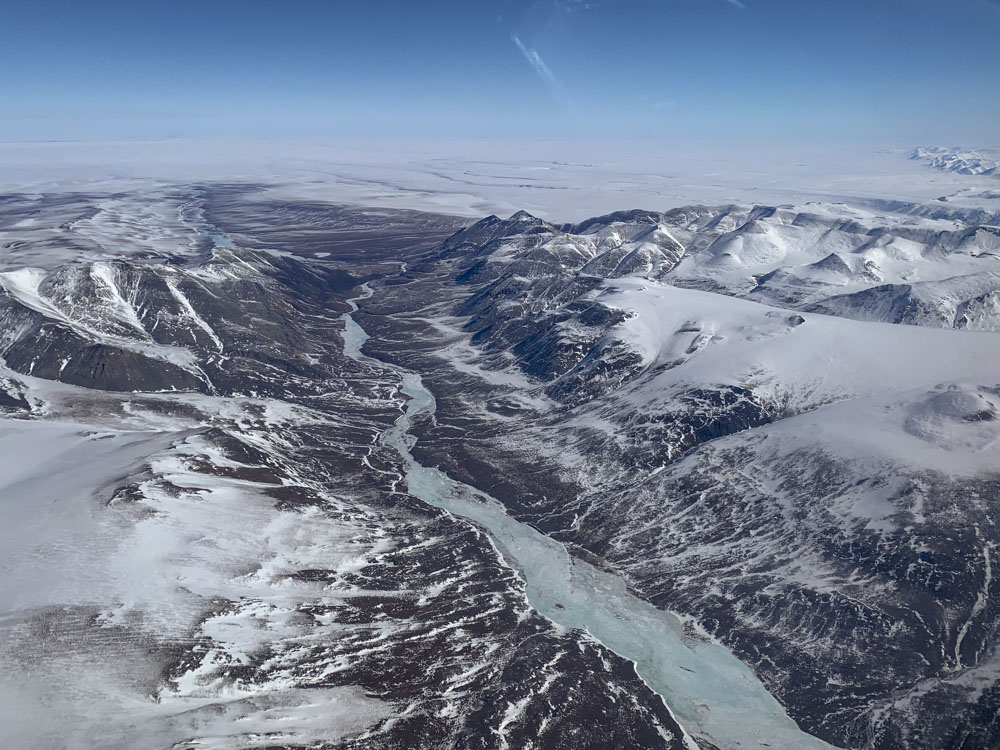
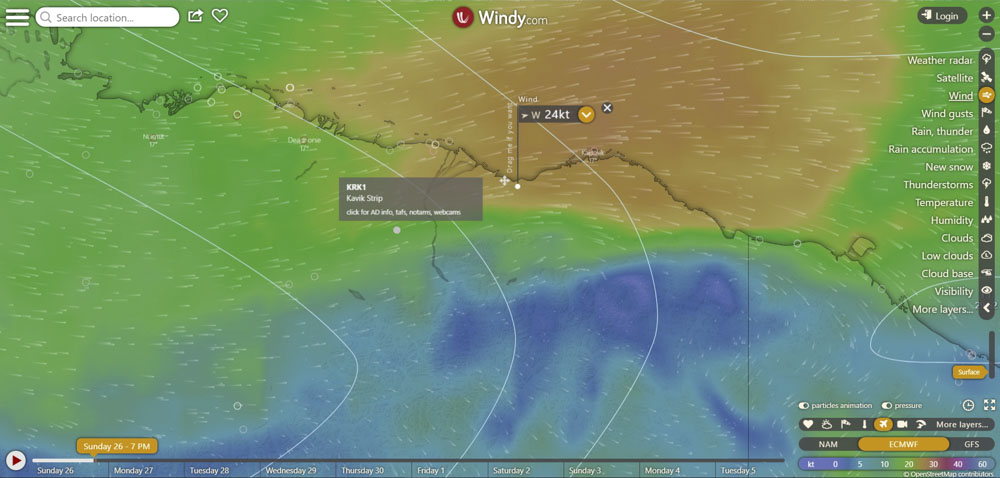
I spent the past 8 days (23 April – 1 May) based at Kavik River Camp mapping snow depths in the Arctic Refuge. Of those 8 days, 3 were in a blizzard and on only 1 did I get a full day of mapping, taking some 33 flight hours in all. Nevertheless such weather ratios are par for the course here in the Arctic and we achieved all of our major goals, returning with excellent data.
I used fodar to make the snow depth measurements. You can learn more about the technique in this paper, but in short for this project I acquired ~1.4 TB of vertical air photos which I will combine with centimeter-accuracy airborne GPS data to create a map of snow-surface elevations, from which I will subtract a snow-free surface I made in 2018 of the entire 1002 Area, and the difference between the two will be snow depth. This blog from my snow measurements here in 2019 gives the big picture for what we’re doing and why, here I’m just giving a brief overview and update on the project.
During this past week:
- I mapped over 1000 square kilometers of tundra snow depths at about 12.5 cm GSD, most of which are repeat snow measurements from 2019, with maybe 10-15% covering new area this year.
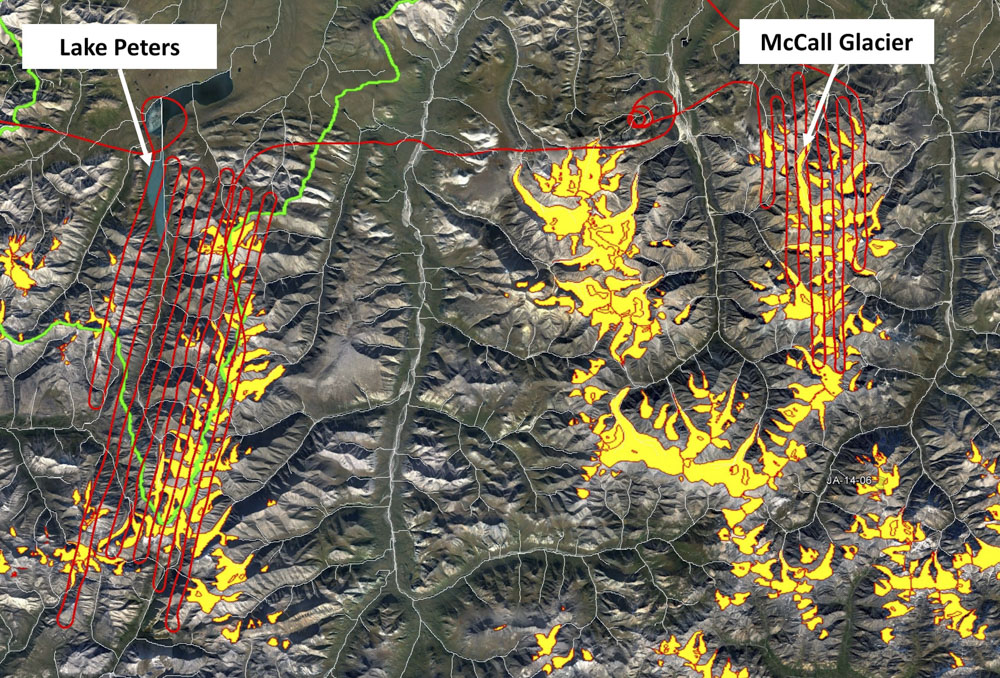
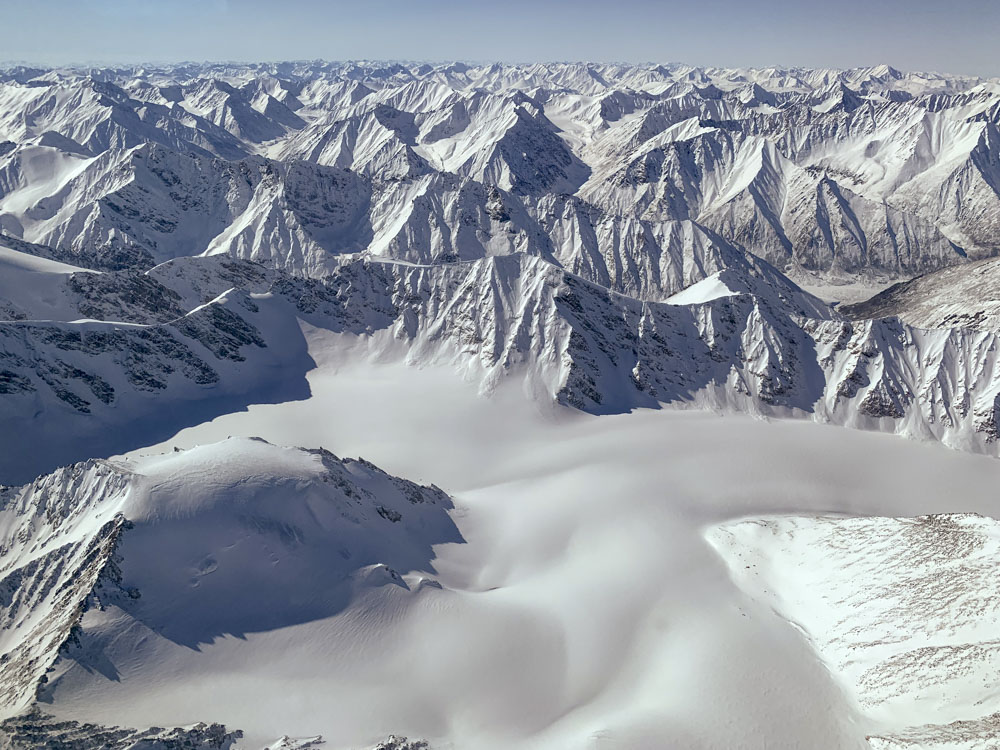
- I mapped over 350 square kilometers of mountain snow depths at about 25 cm GSD, covering the entire Lake Peters watershed, extending the record since 2015 and the entire McCall Glacier watershed, extending the record since 2014. I also mapped surface elevations of a few dozen glaciers in those watersheds, as I have 1-2 times per year since 2008.
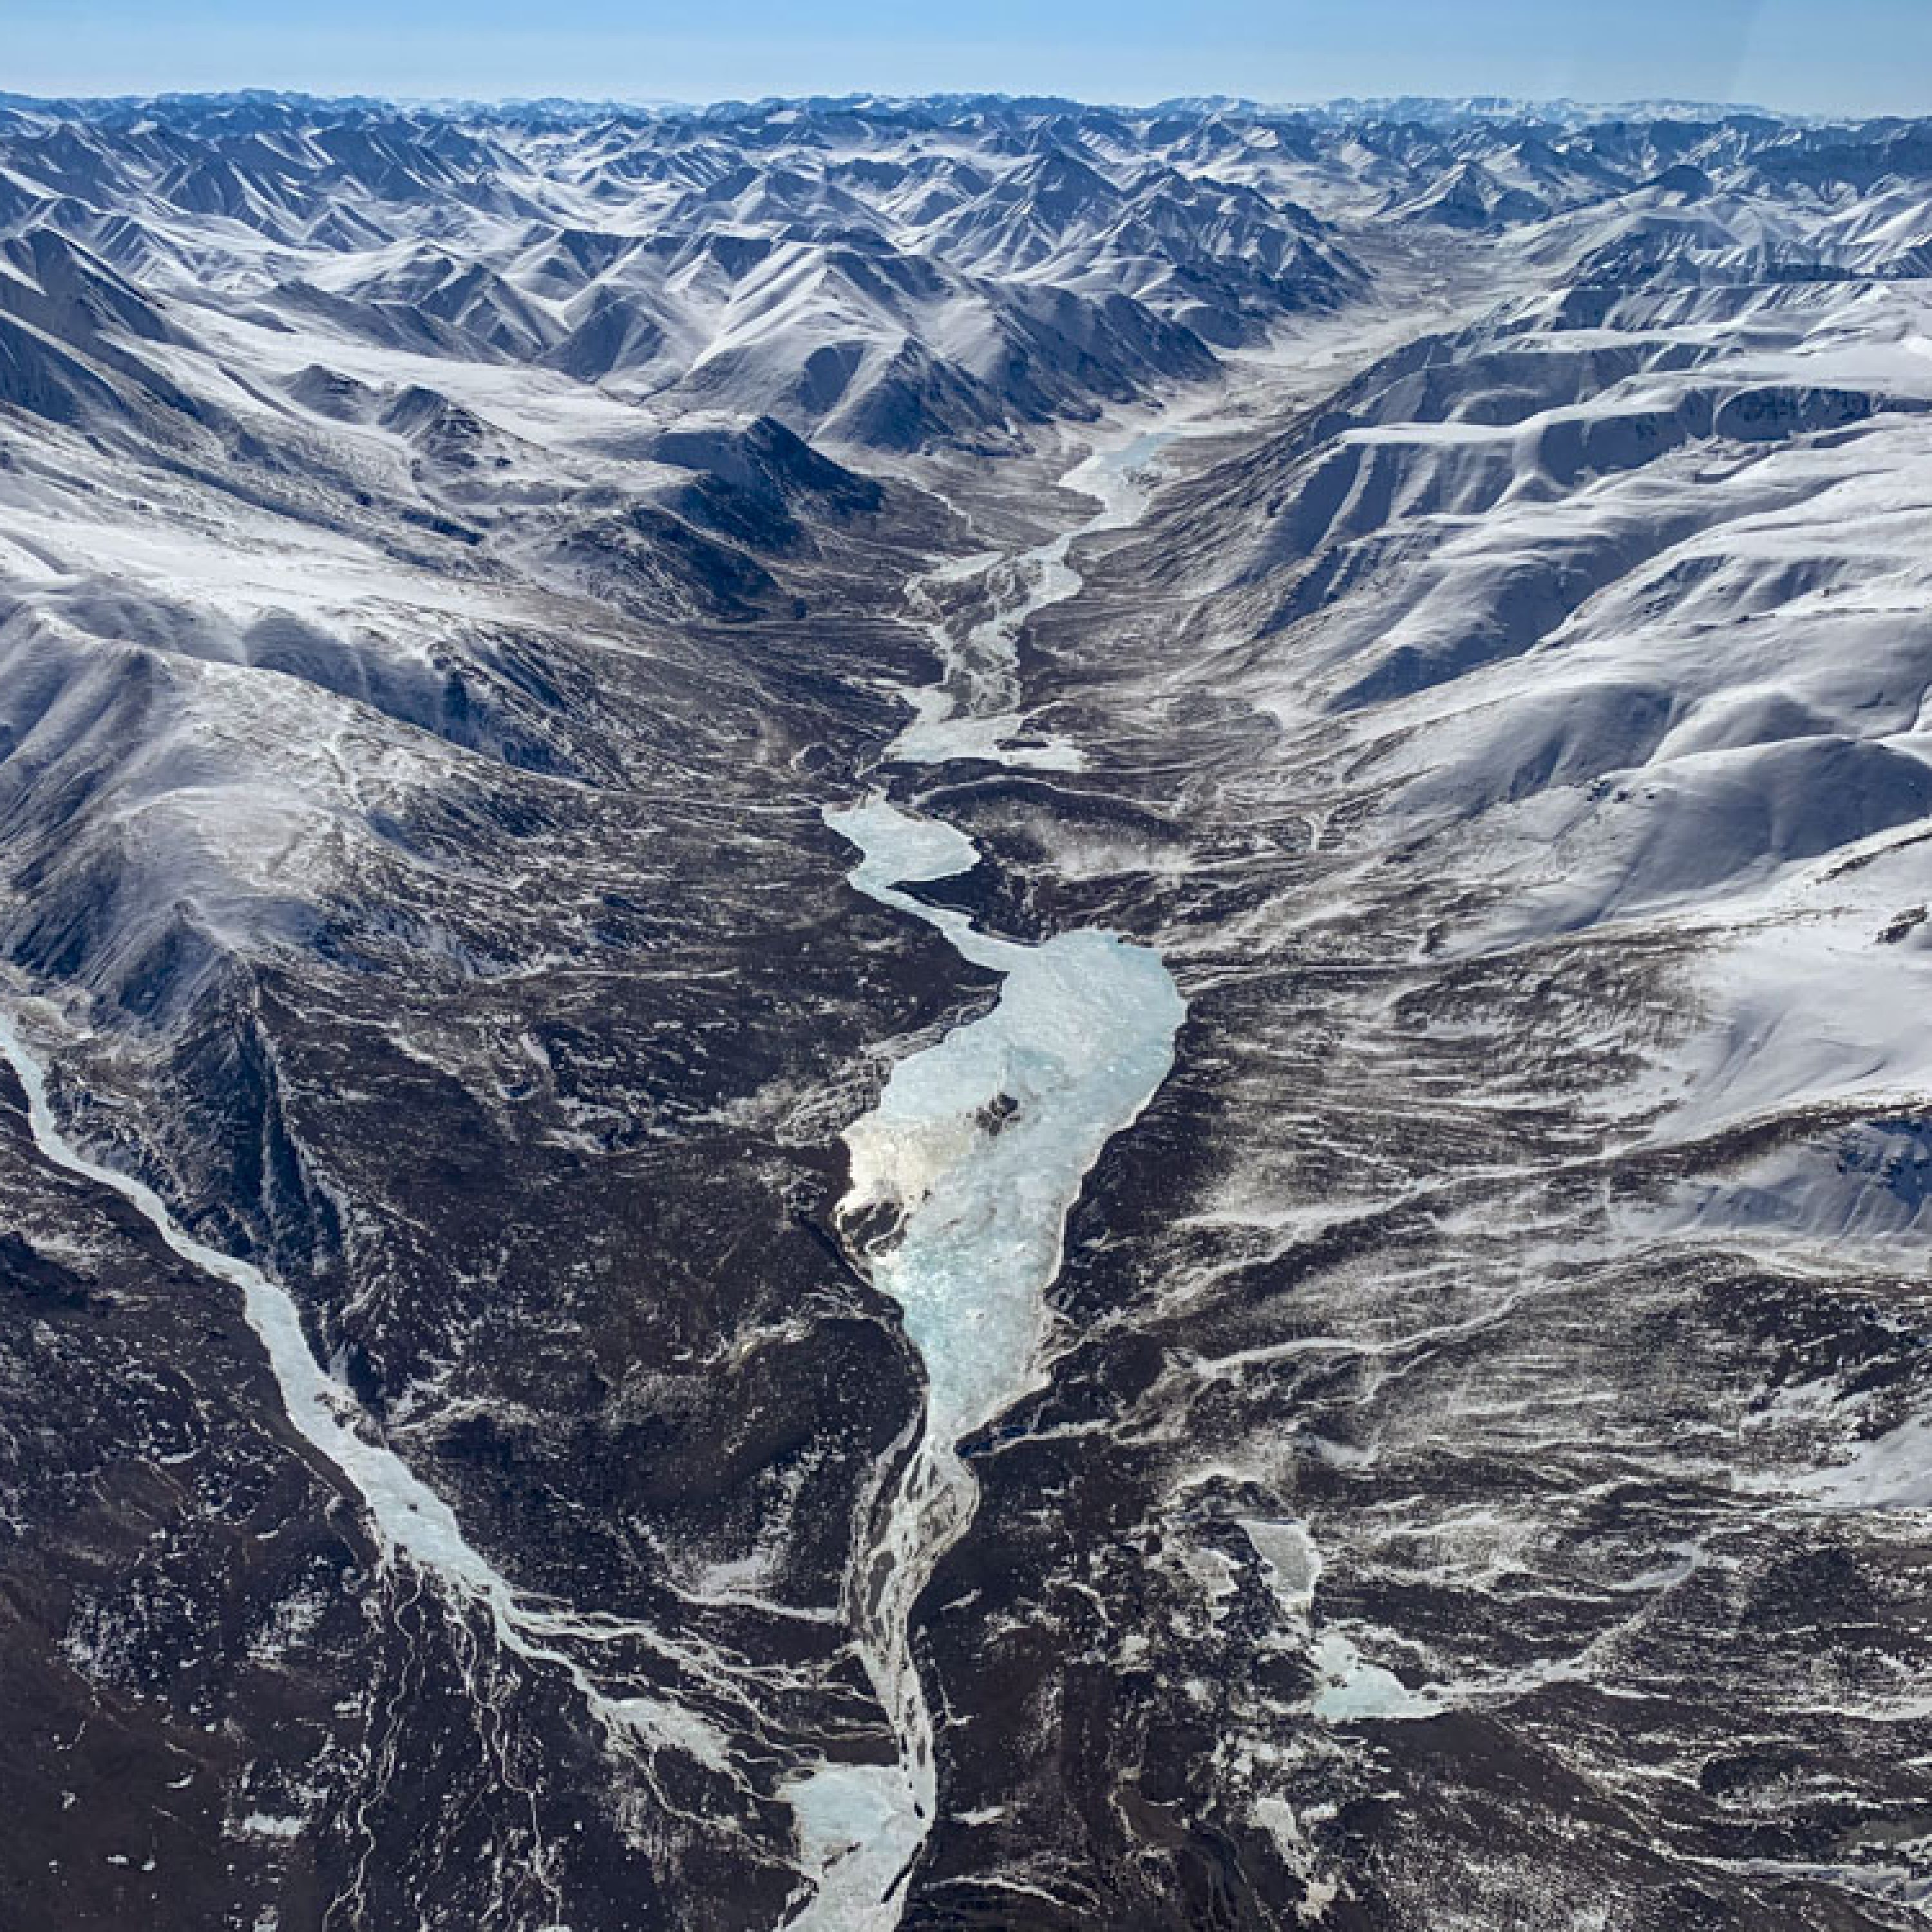
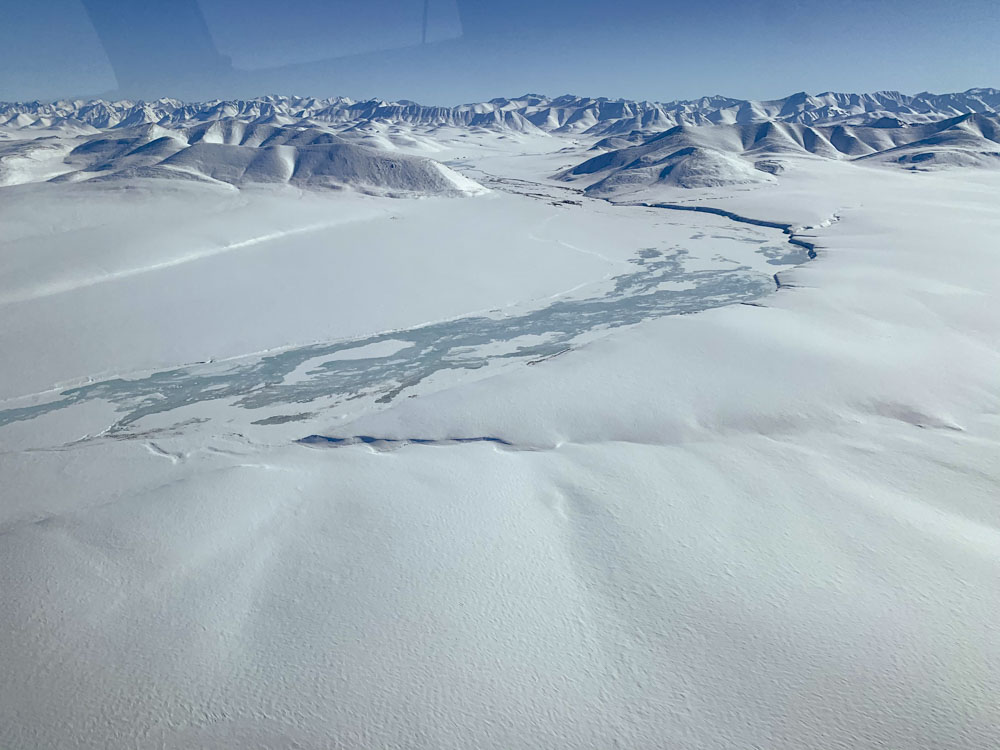
- I mapped the Canning and Hulahula Rivers snow and aufeis depths at about 25 cm GSD.
- I mapped at least a hundred square kilometers of tundra before and after a blizzard, allowing us to analyze snow redistribution with unprecedented detail.
What Will We Learn?
Here I’m just giving a brief overview of our anticipated results, and I encourage you to read this blog for further background, these page on snow to learn more, and this excellent book to dive deeper. Qualitatively it appeared to me that there was more snow here this year than last, I saw fewer tussock tops than previously and less bare ground overall, with the region east of the Jago and Niguanak Rivers showing the most bare ground. That being said, despite my best intentions the Covid-19 dynamics pushed my efforts to nearly a month later than last year – still before snow melt started but after many more late-winter storms than in 2019. For example, I flew over Kavik’s runway in early March when I hoped to do this work and found the runway clear of snow then, but 6 weeks later it was fully covered by snow and drifts. The data itself will tell us the full story, but seasonal dynamics will need to be part of it.
Inter-annual Variability in Snow Depth on the Tundra
Perhaps the most important goal of this snow research is to understand how the snow’s thickness varies from year to year – for example, what is the minimum, maximum, and mean snow depths that we should expect – so that we can answer questions like: Is this sufficient to protect the tundra from the seismic exploration proposed here? Is the snow providing more or less insulation to the thermally-sensitive tundra? What weather causes higher or lower snow depths? Towards that end, we need to build time-series of such measurements, something I started doing in 2014 with small blocks of fodar on the tundra followed by comprehensive fodar measurements there since 2019.
[/before-after ]
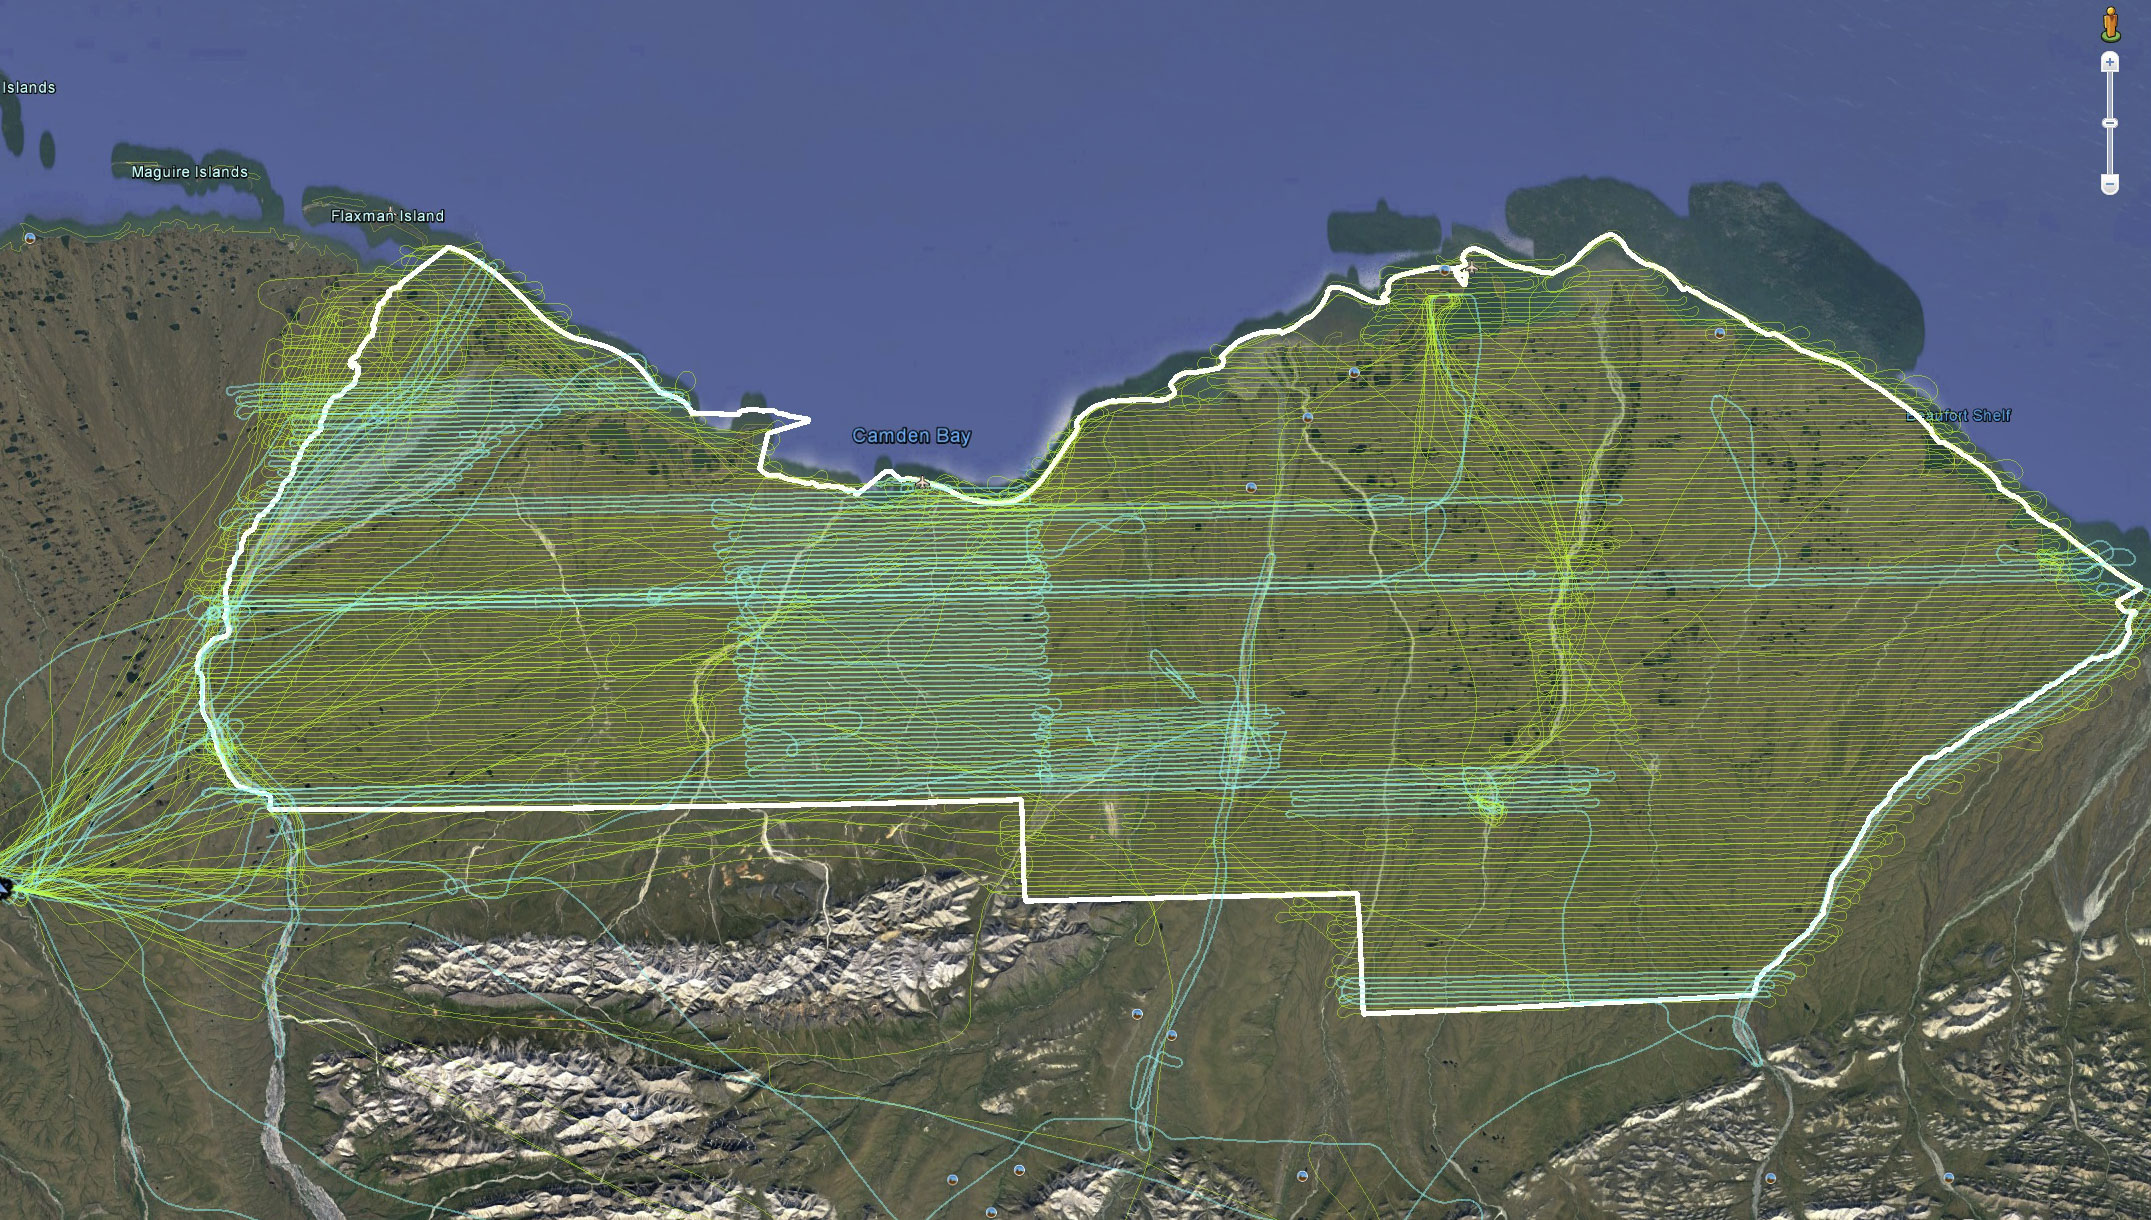
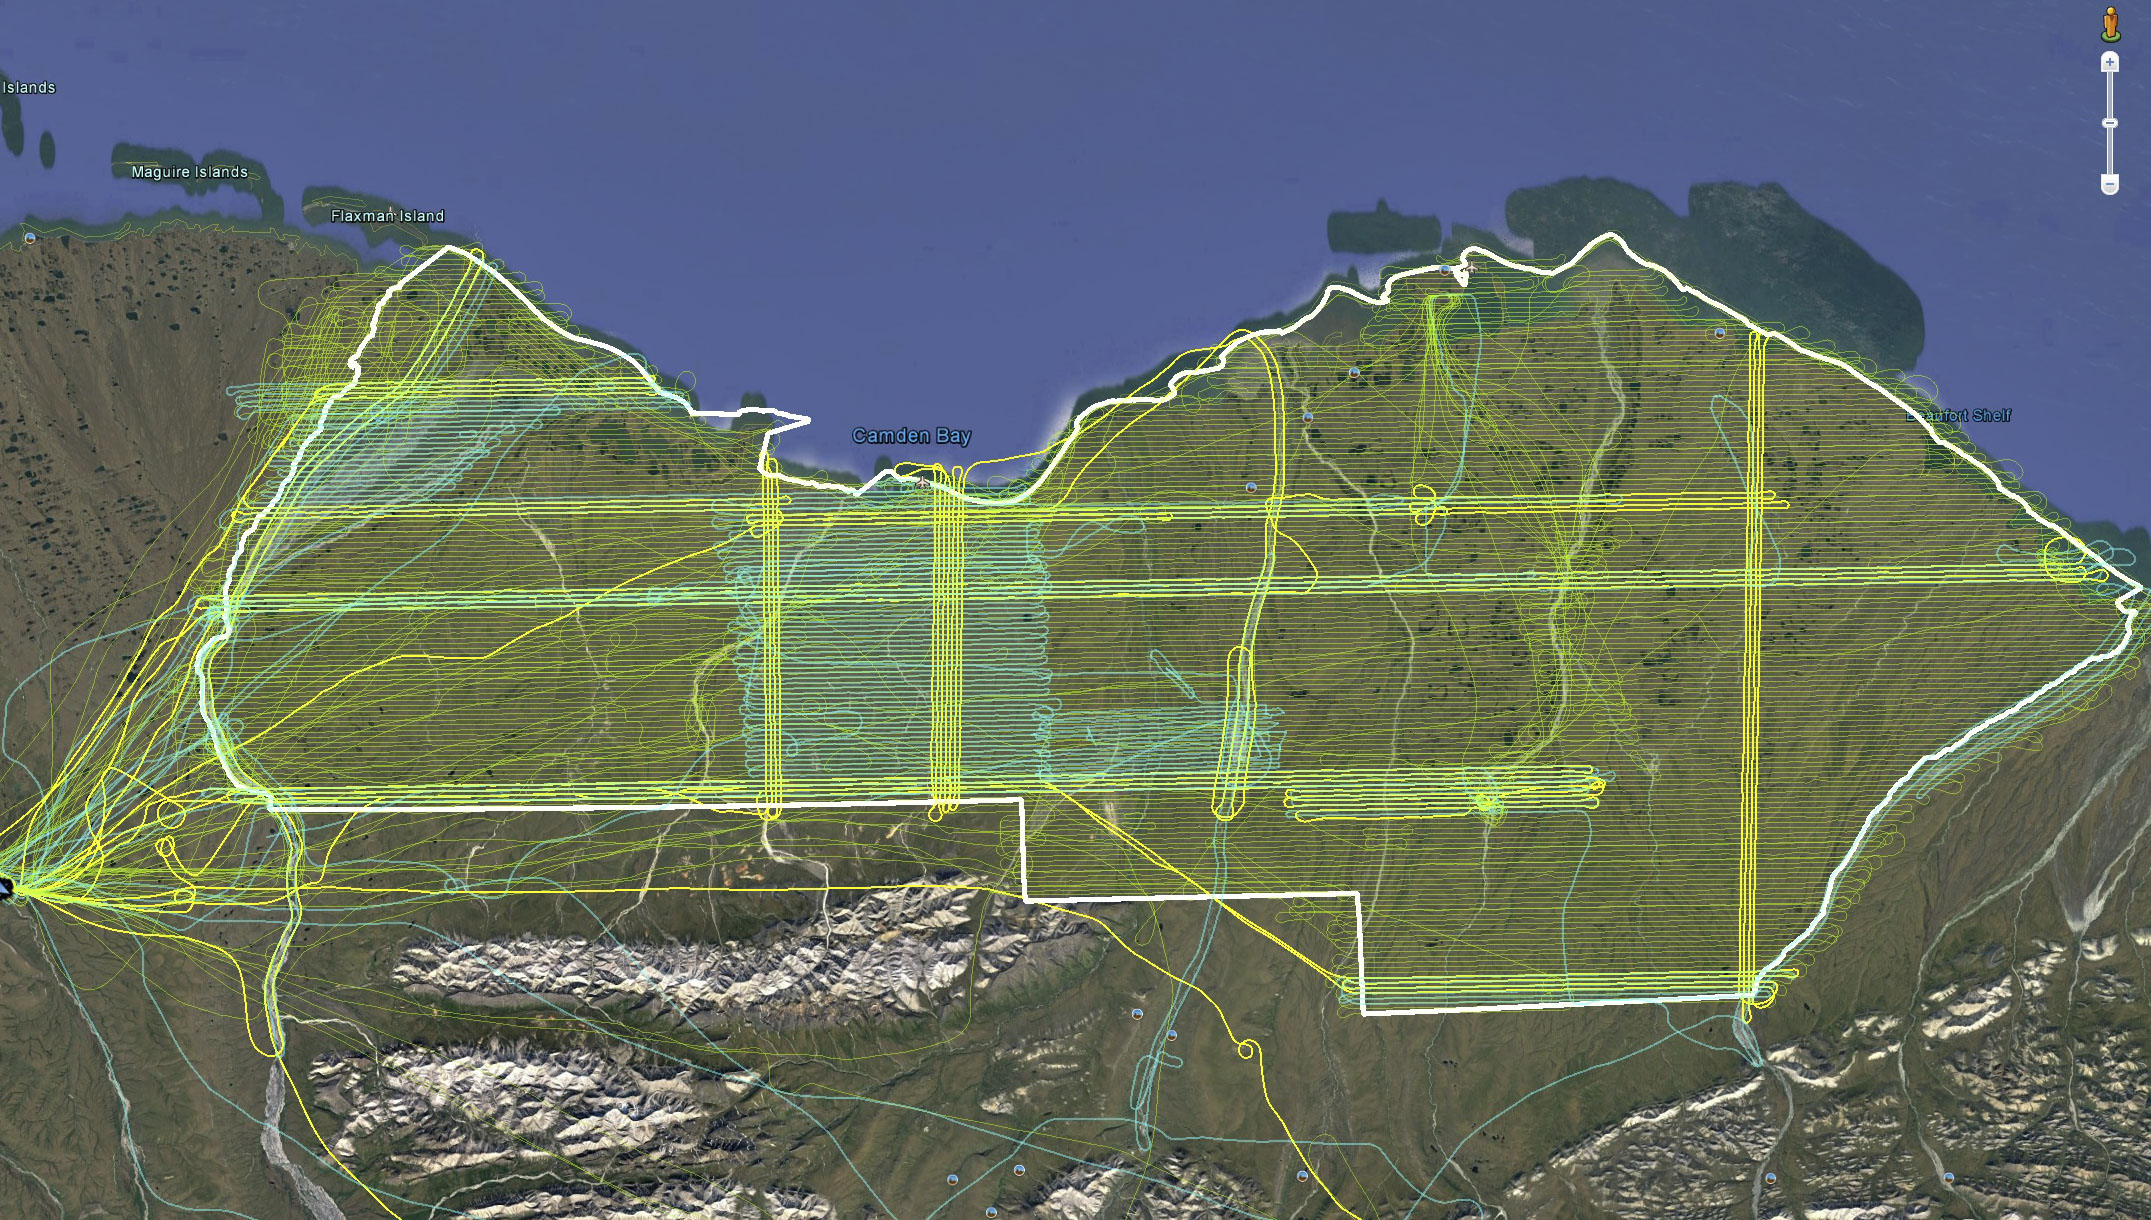
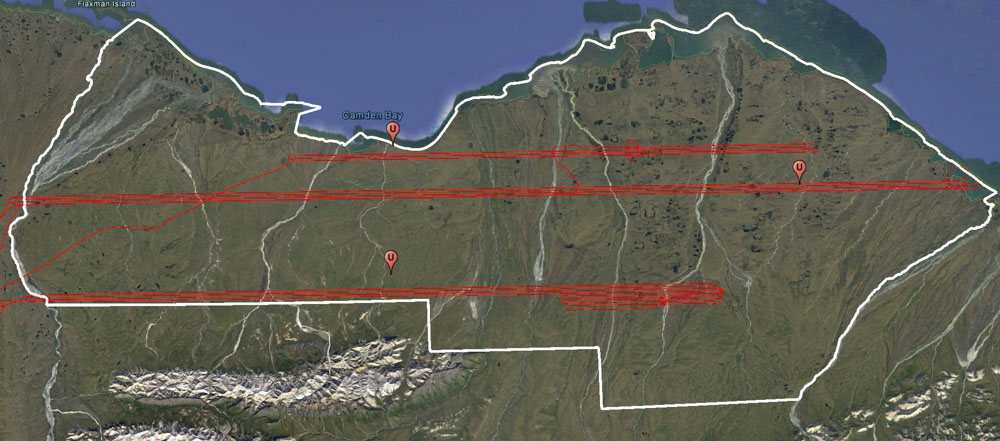
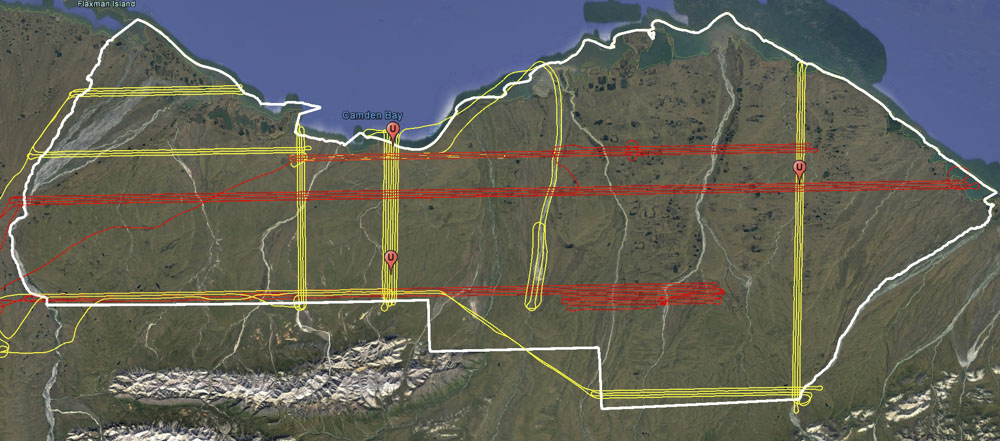
My 2019 snow measurements are shown in turquoise over my 2018 snow-free measurements in light green, and my 2020 snow measurements are shown in yellow at right; move the slider left-to-right to see the overlap in interannual snow measurements. I didn’t get to map quite as much as I wanted to this year, but still captured a comprehensive view of the spatial distribution of snow. Because I mapped the entire 1002 Area in summer 2018, I can map snow anywhere I want in the future and have a summer surface to subtract from it to get snow depth, but repeating measurements in the same locations over time eliminates uncertainties when comparing one year to the next.
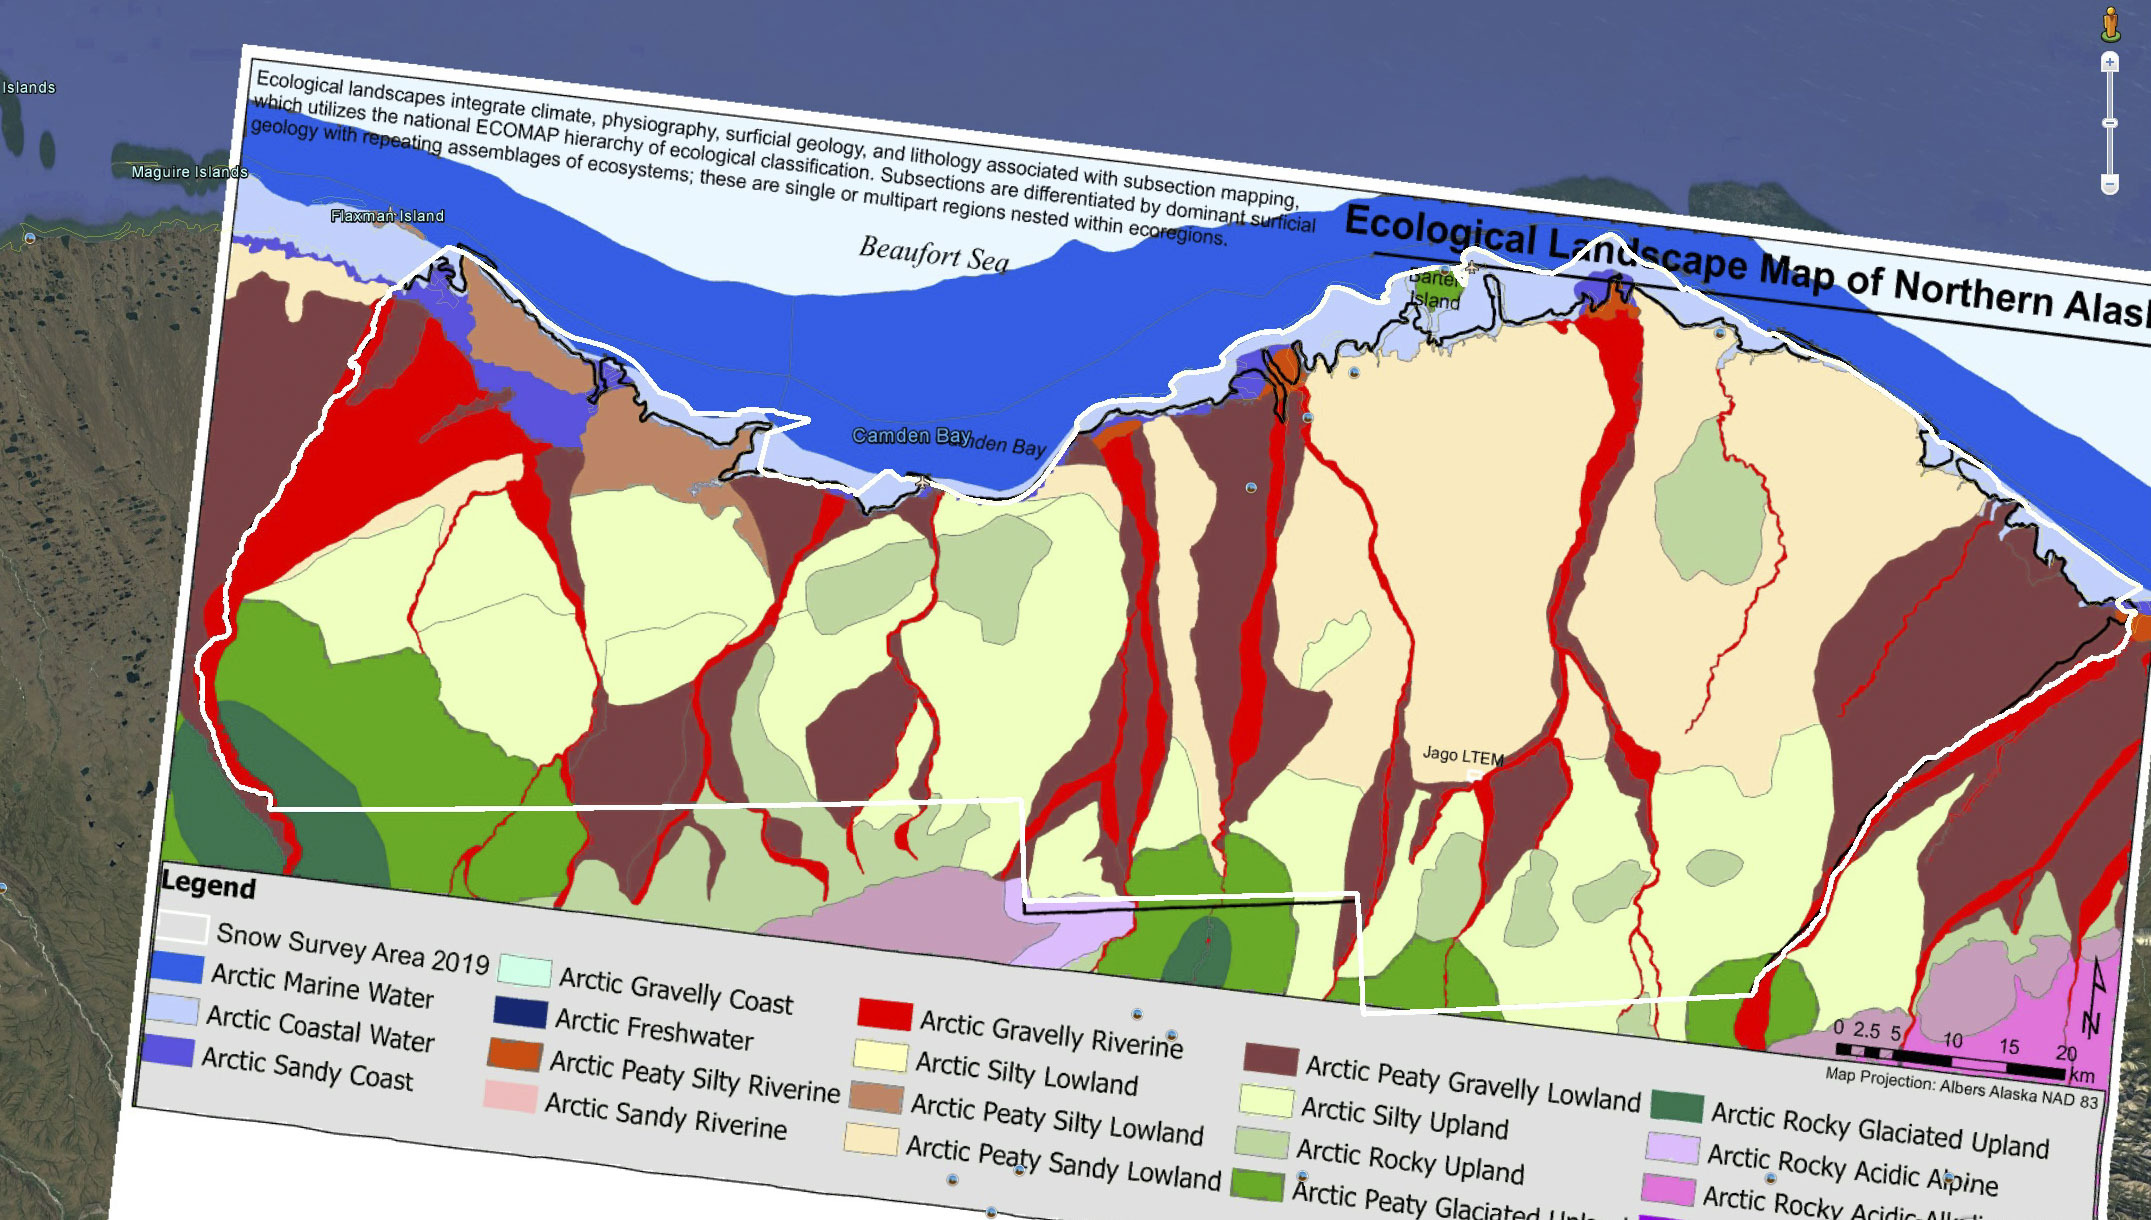
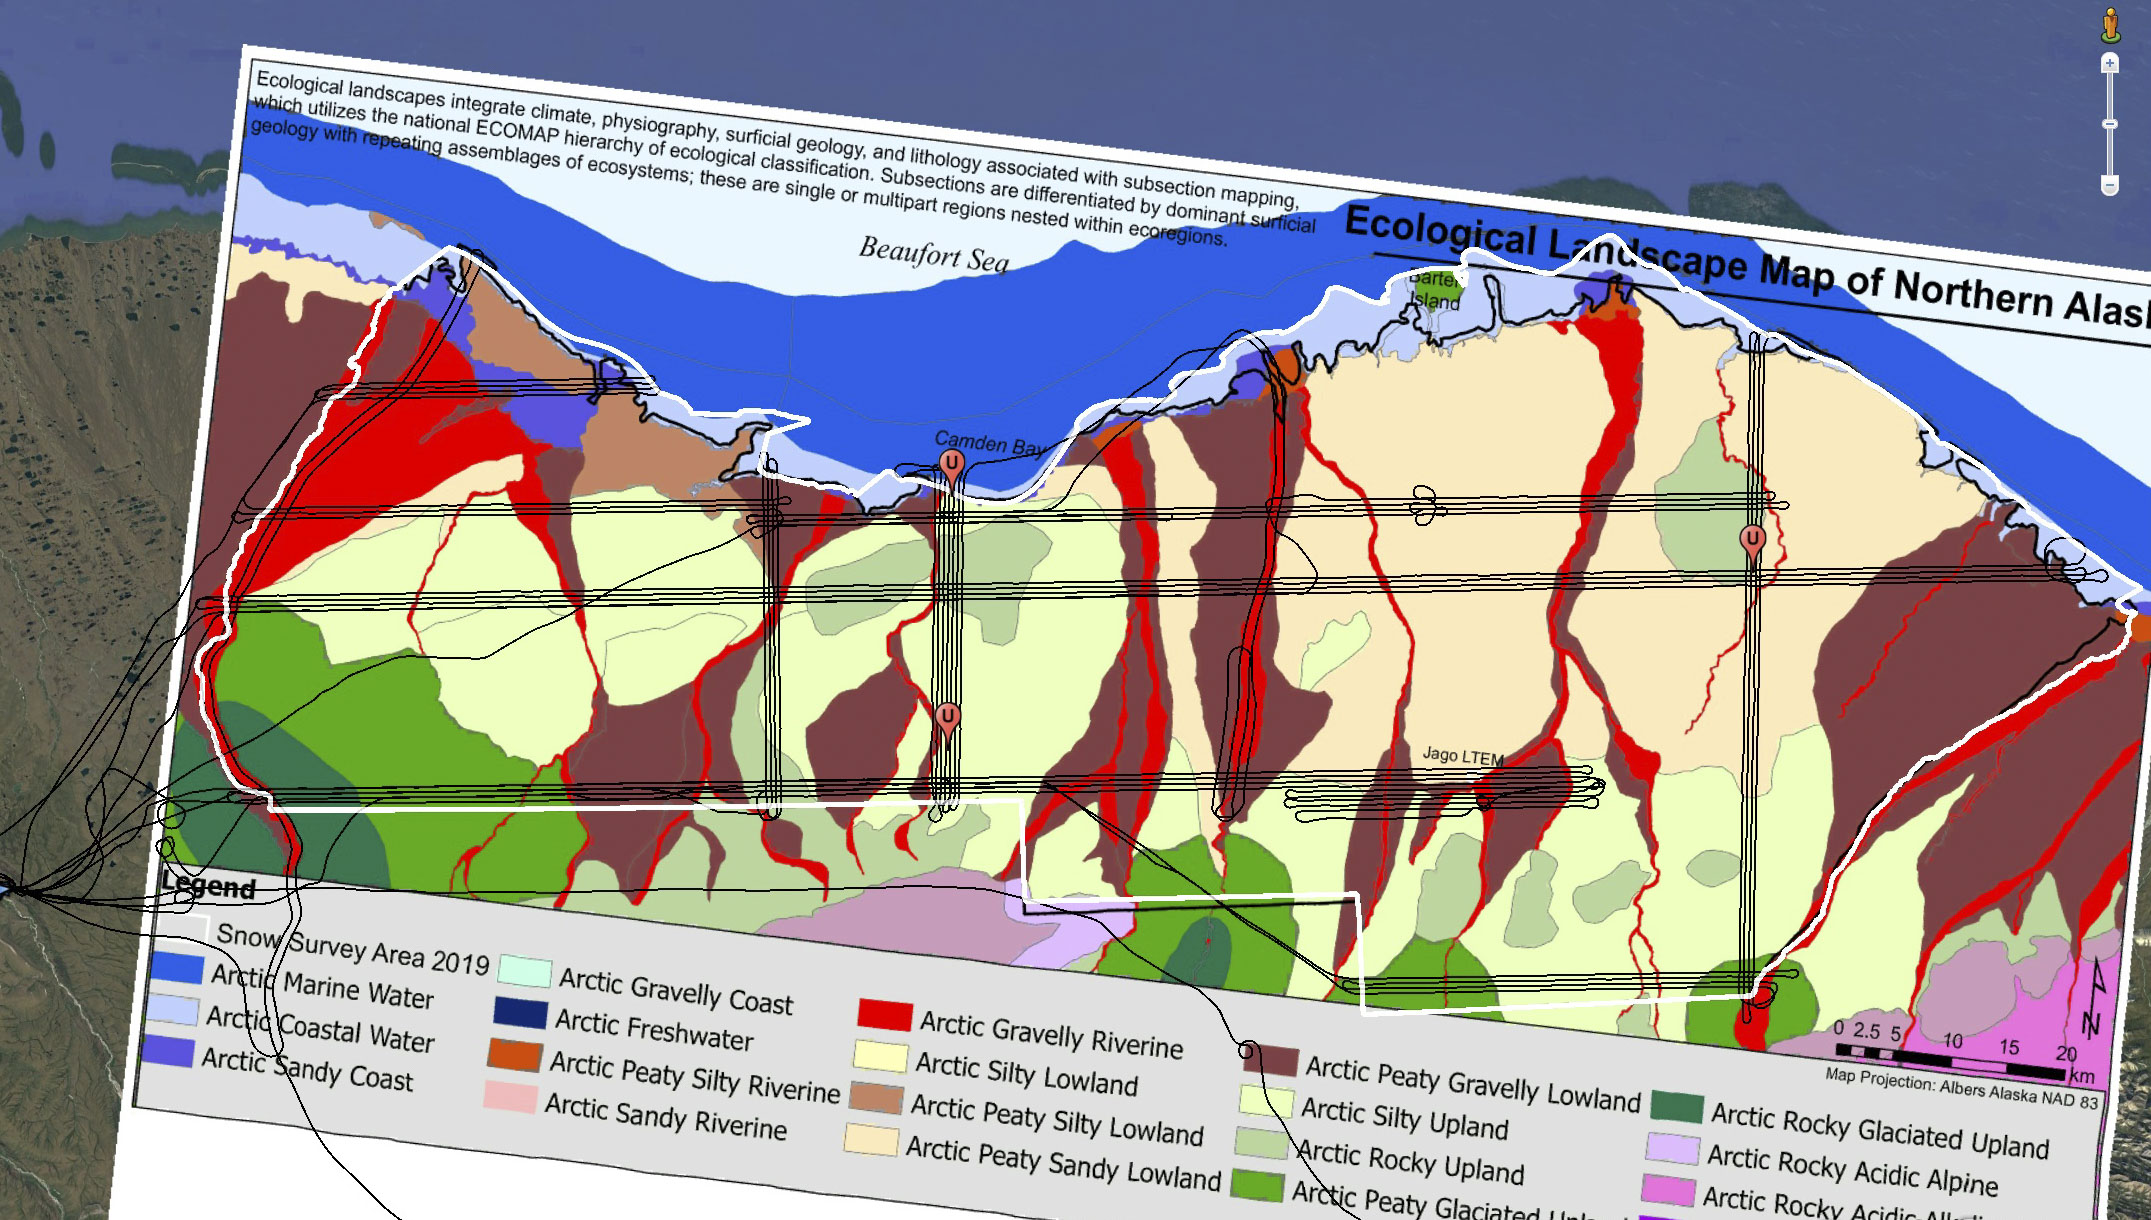
The distribution of my flight lines is not random or based purely on spatial coverage. This blog gives more detail, but here you can see Torre Jorgenson’s map of ecological landscape units with my 2020 flight lines superimposed — I tried to capture as much variability as I could. Also notice the three red balloons with “U” in them — these are weather stations installed by Frank Urban of the USGS over 10 years ago which measure snow depth continuously; by mapping over them, we can both ground truth our results and improve extrapolations. I first mapped the north-south set of lines at Camden Bay covering the two weather stations in 2014. The smaller East-West block to the lower-right of center captures Torre’s Jago Long Term Ecological Monitoring site.
Inter-annual Variability in Snow Depth in the Mountains
Just like on the tundra, mountain snow packs are an important to the ecology of the 1002 Area so we also need time-series of measurements here to understand how snow packs vary from year to year. For example, is mountain snow pack thickness correlated with tundra snow pack thickness? Is the trend in winter snow depths in the mountains conducive to glacier growth or glacier demise? I’ve been mapping snow depths on McCall Glacier since 2003 by hand probing and maintaining a mass balance stake network in April/May and August of each year. I began annual mapping snow depths in it’s entire valley using fodar in 2014 and beginning in 2015 I began annual mapping snow depths in the entire Lake Peters watershed. This is the most comprehensive data set of mountain snow pack anywhere in the US Arctic. See this paper and this associated blog, as well as this blog on mapping Denali, to see how well fodar works on steep terrain!
Improvements to Snow Modeling
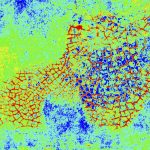
Several excellent physically-based models of blowing snow exist out there that allow one to ingest topography, snow fall, wind fields and much more to model snow thickness over time on that synthetic topography. These models are valuable for a variety of reasons, not the least of which that we cannot measure tomorrow’s snow pack today or fill in the measurement gaps of yesterday with new measurements, so models are our only hope for that. A limitation of these models, however, is that they rarely have sufficient validation data such that every model pixel has a corresponding measurement pixel in the real world. Both this winter and last winter, I was not only able to map snow depth over enormous areas but also do so over quite large areas both before and after individual storms. So now we have the capacity to evaluate these blowing snow models by isolating their performance at the level of an individual storm rather than an entire winter by validating them on a pixel-by-pixel level to both understand the misfits and potentially improve the models.
Snow ecology
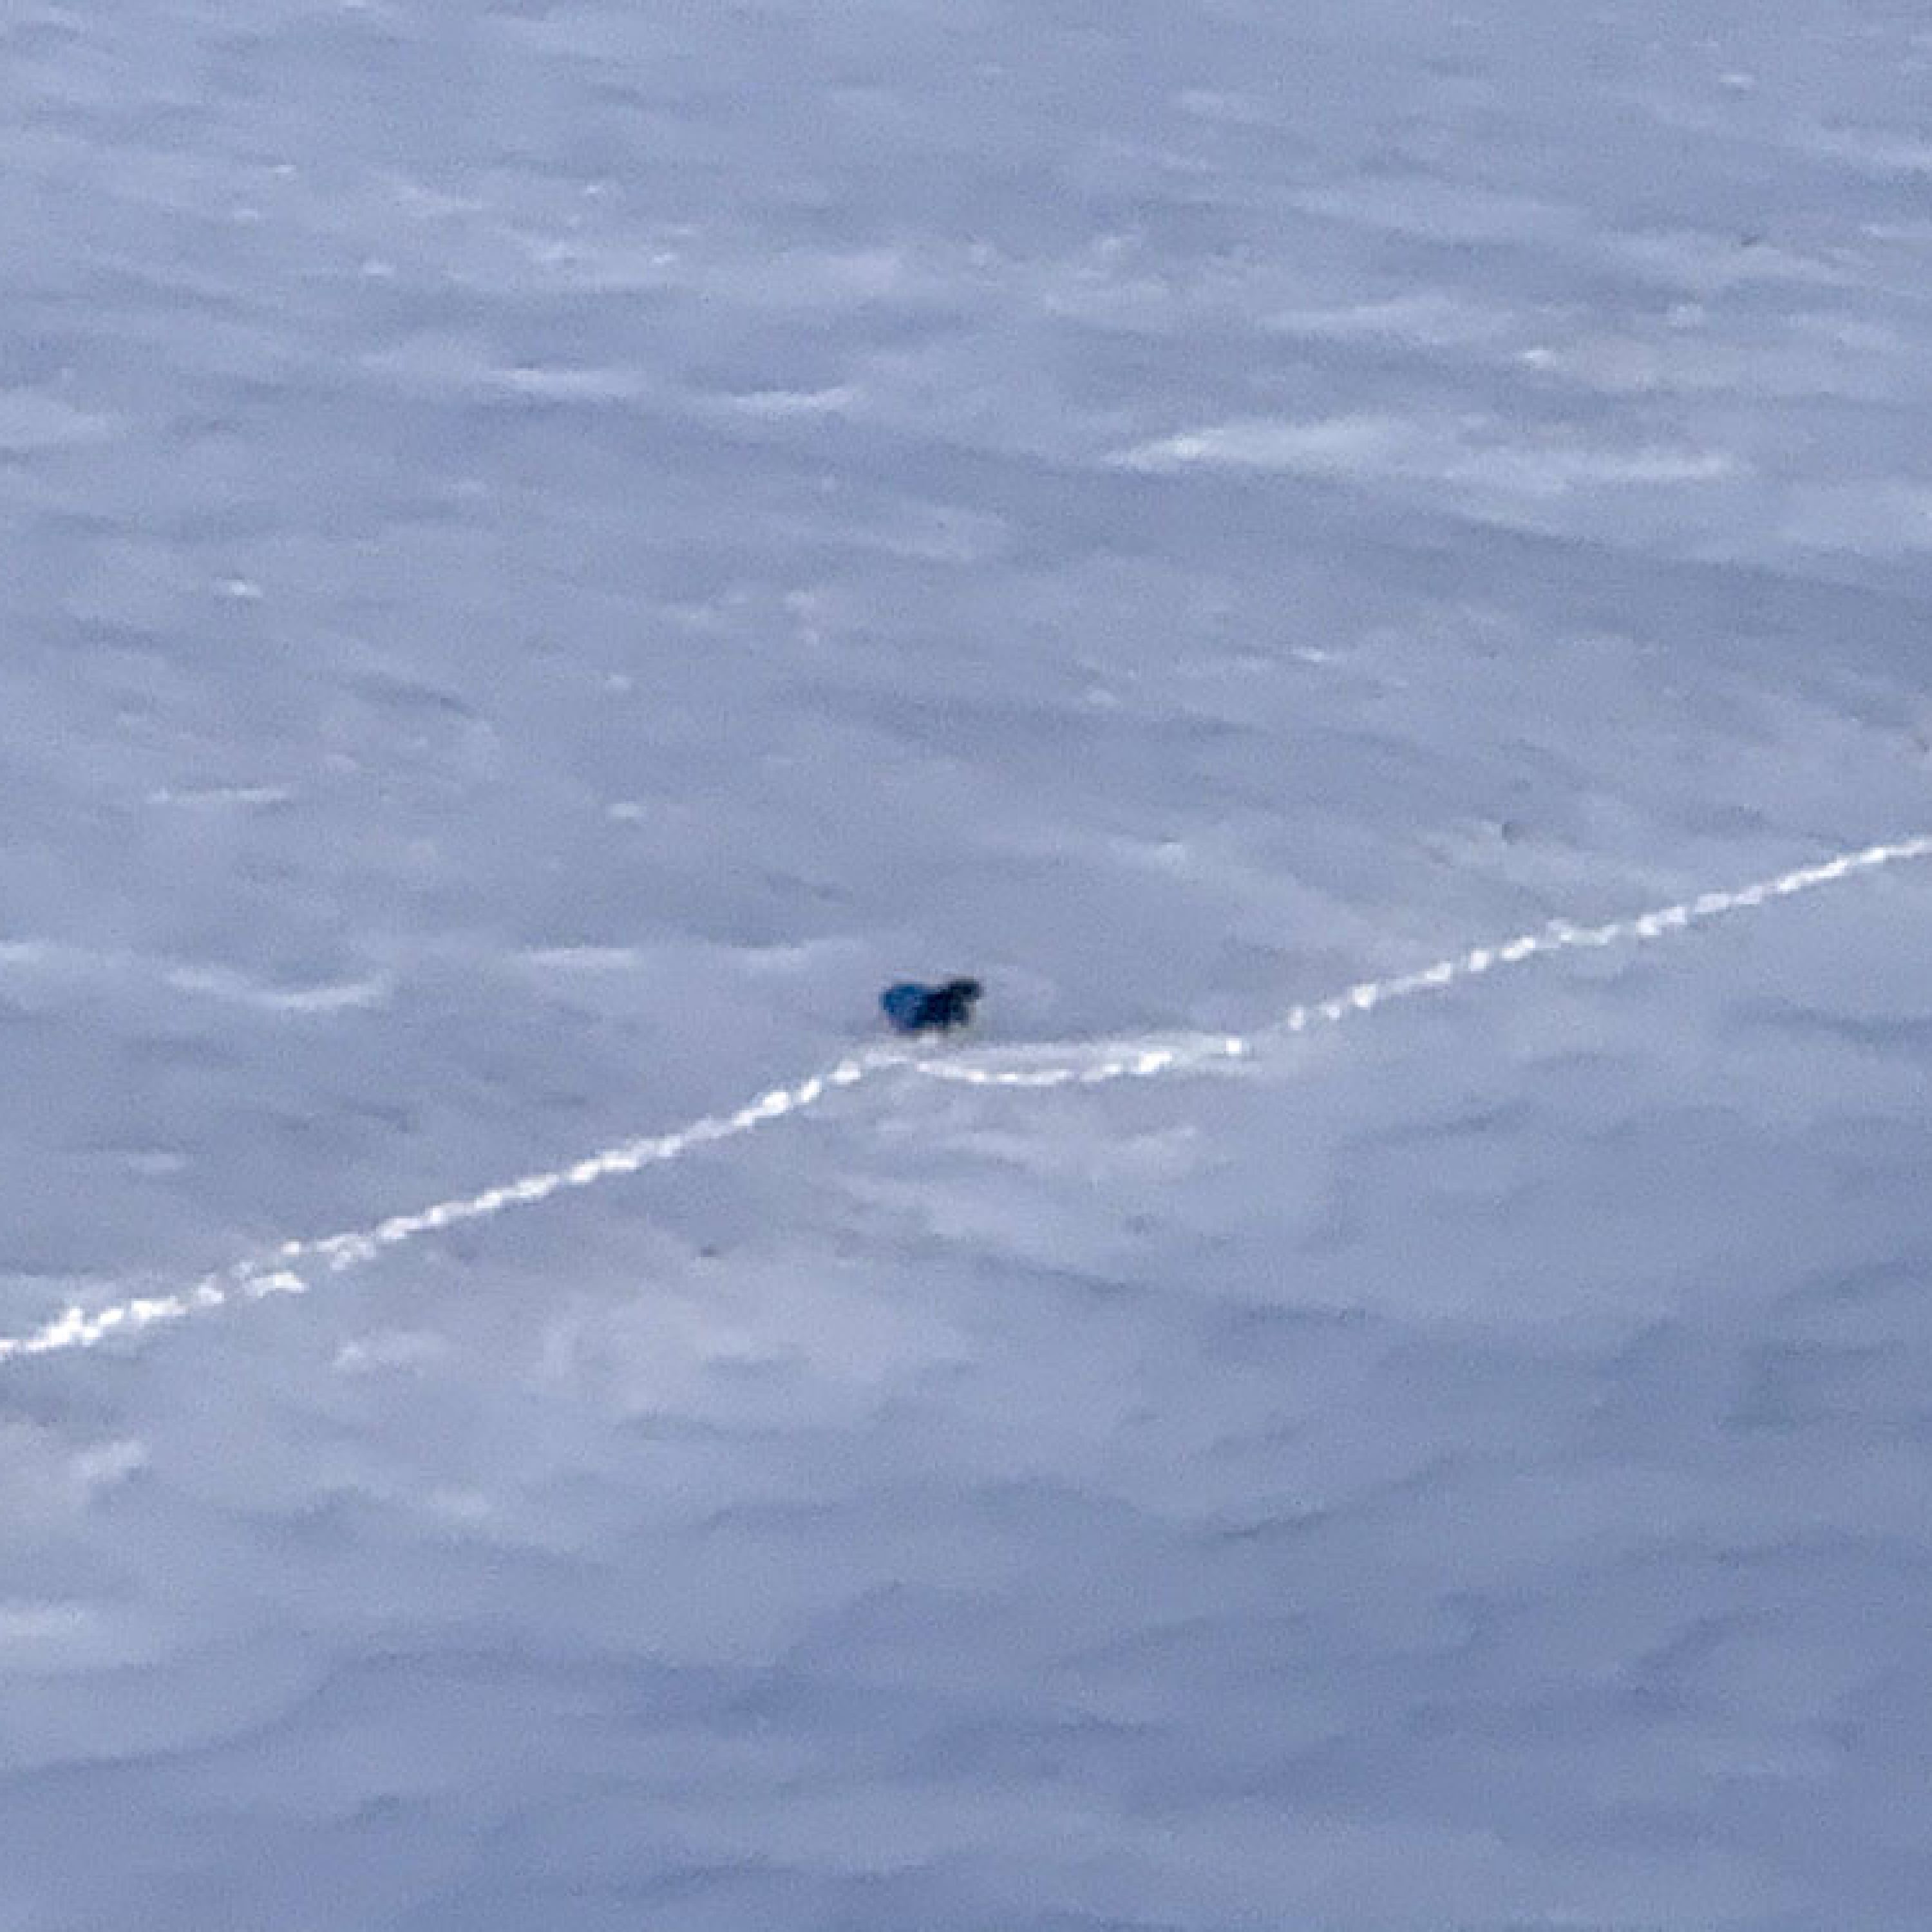
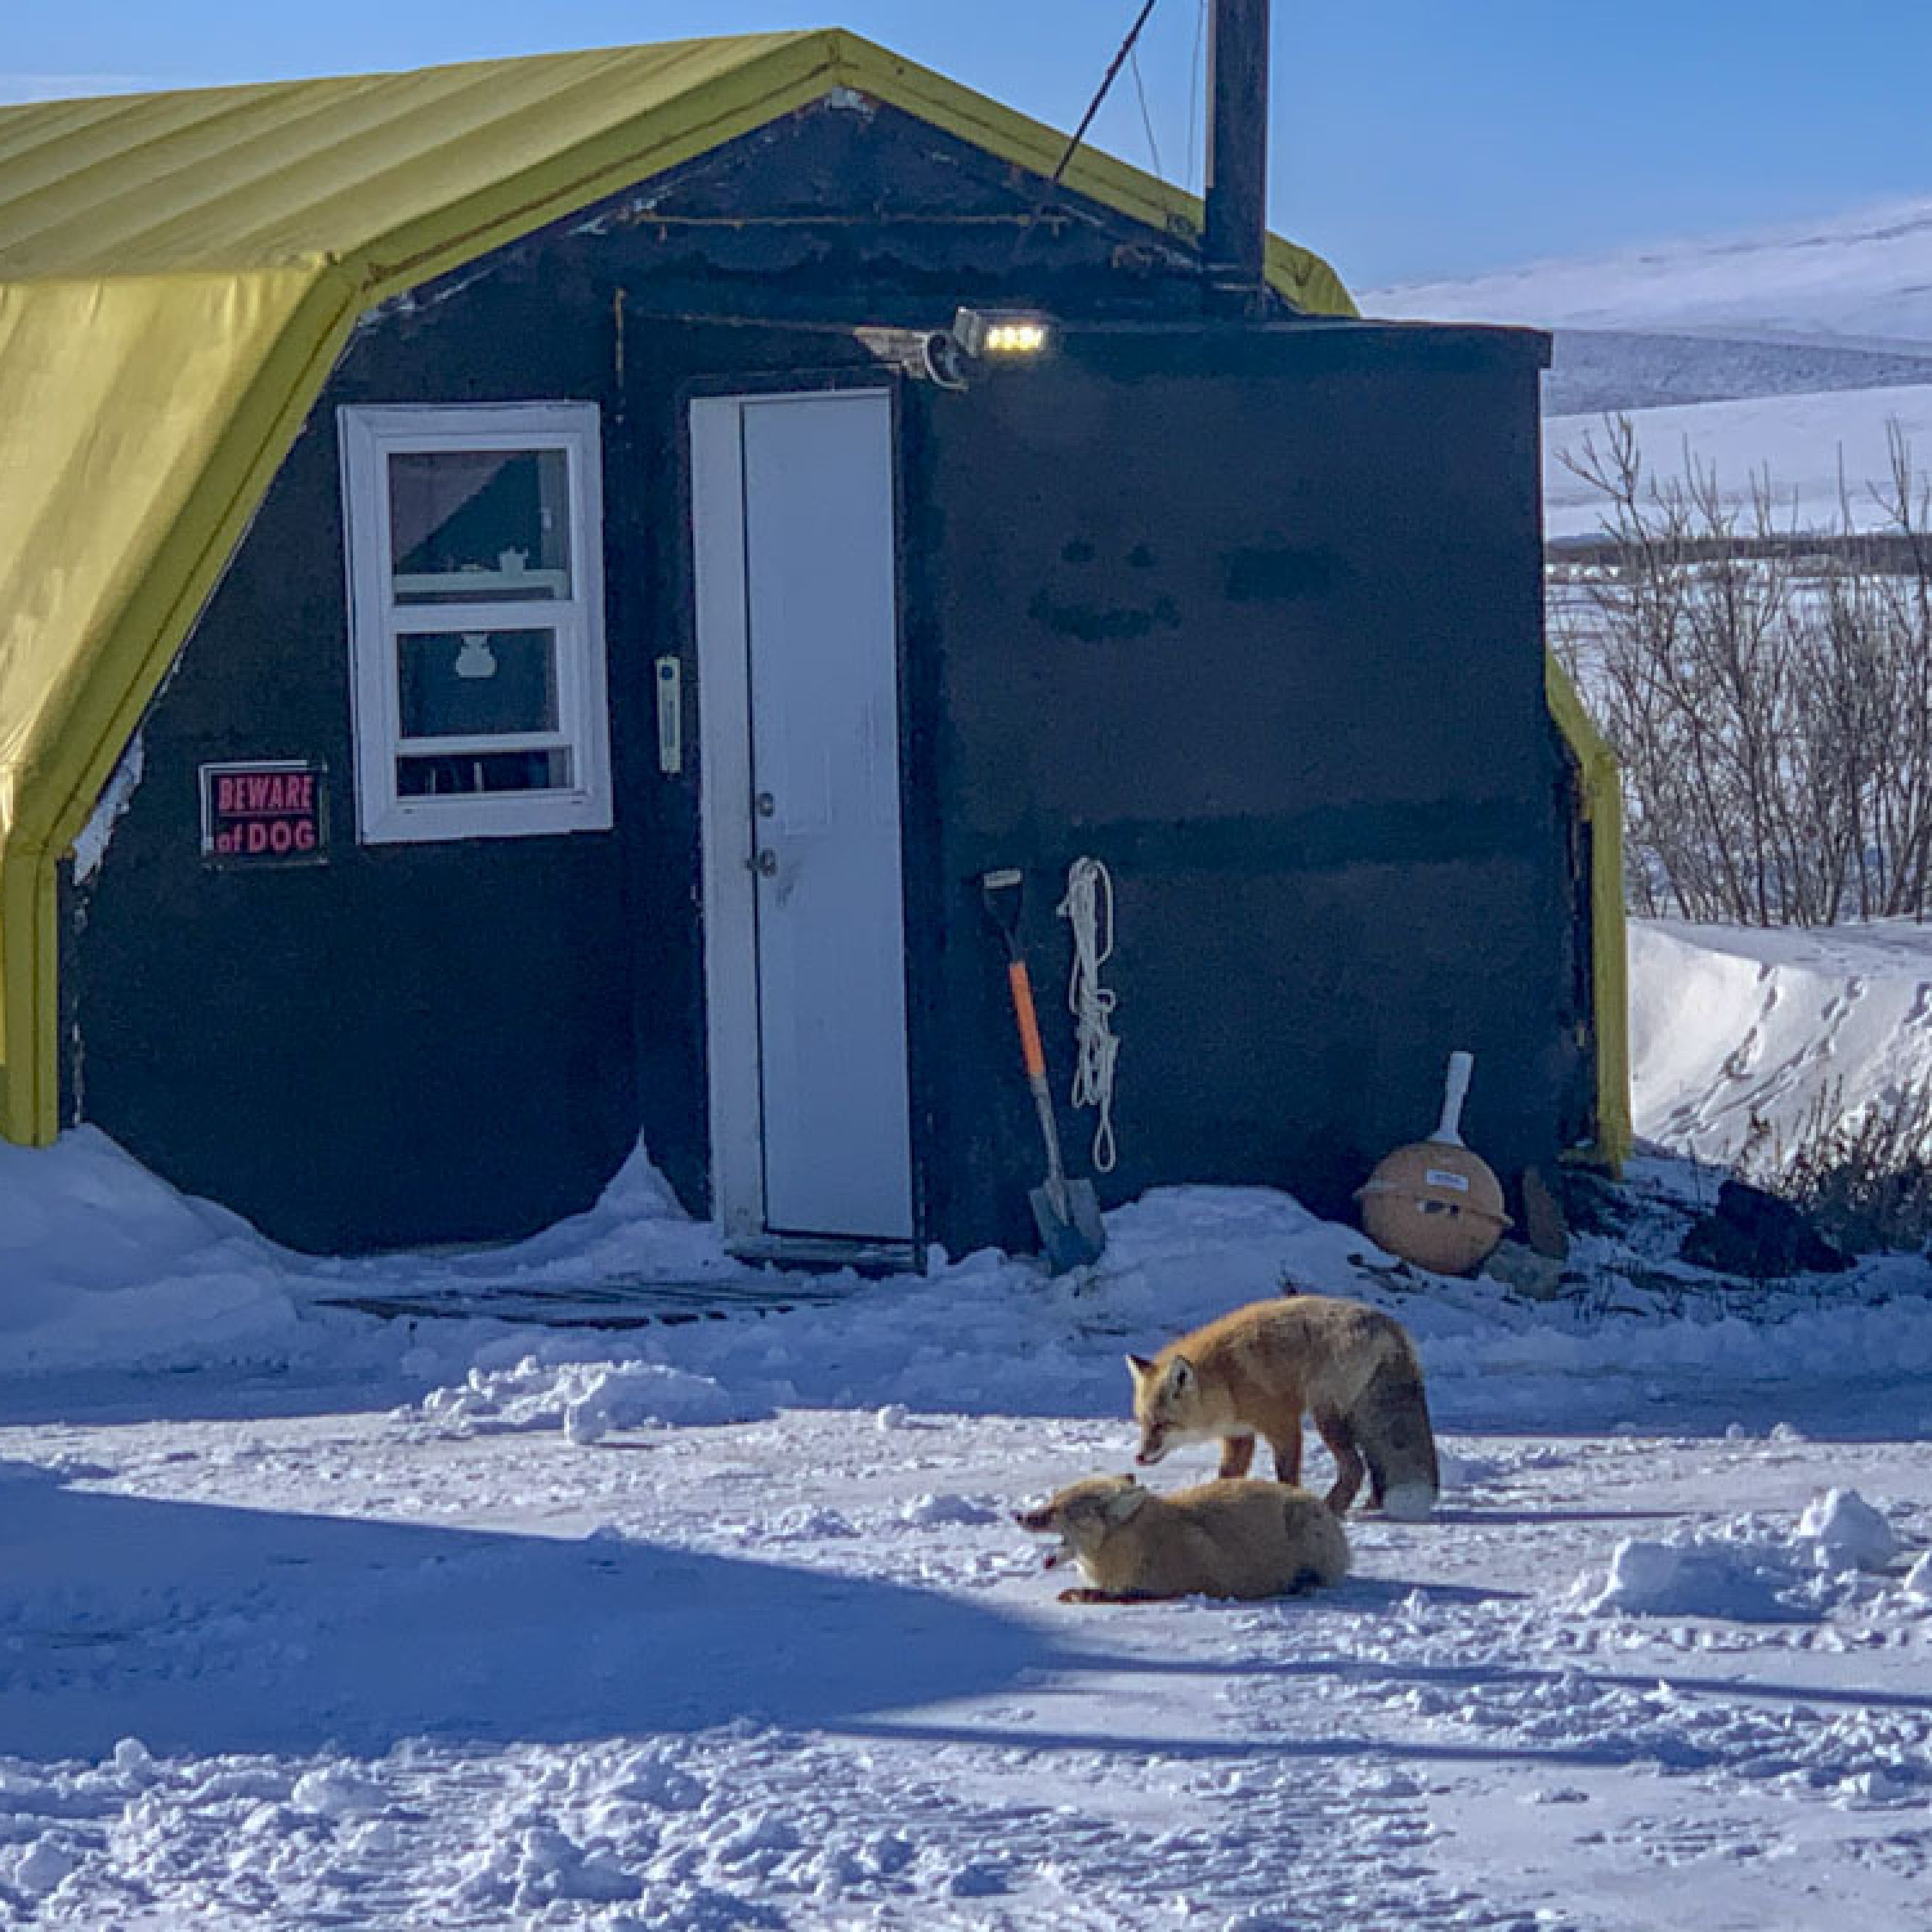
Polar bears, caribou, musk ox, fox and wolves – all of these charismatic arctic mammals eek out the majority of their lives on or under a snow pack, so we cannot hope to understand their ecology unless we understand their winter environment. Similarly, because it’s so windy here, the snow thickness is largely controlled by the size of things that can block the wind and slow it down, like shrubbery. But snow thickness largely controls the warmth of the ground because the snow acts like an insulating blanket, and the warmer the ground is the more likely the shrubs are to grow larger, creating a shrub-snow growth feedback. And with more woody vegetation like this, moose and beavers are sure to follow, changing the overall ecosystem’s structure and composition. By measuring snow depth over such large areas over many years, we will gain unprecedented insights into the role that snow thickness plays in arctic ecology.
Impacts of Climate Change on Glaciers
I’ve been studying the impacts of climate change on the glaciers in this area since 2003, trying to understand what glaciers can tell us about climate that no other resources can in this data spare region. For example, we have been able to accurately track the rise of the late summer snow line over the past 50 years simply by analyzing ice temperatures, among the many things that weather stations alone cannot answer for us even if they had existed here. My first comprehensive map of all the glaciers in the Arctic NWR was in 2008, made commercially with lidar. Since then I’ve made a new map of some or all of them every year, often several times per year. Using the data we’ve collected on McCall Glacier 1-2 times annually since 2003 (except 2015-2016) including over two dozen weather stations, up to 60 mass balance and surface velocity poles, and lots of process studies including ice coring, deep ice temperatures, thermo-mechanical modeling, etc, we can paint an accurate picture of climate dynamics here over the past century and likely the next. In short, even if climate got no worse for glacier health, these glaciers will continue to waste away before end of this century because the late summer snow line has moved higher than the ice. But surprises can happen – the past three years have shown the highest mountain snowfalls on record and a new trend could be starting, we won’t know unless we keep measuring…
Inter-annual Variability in River Aufeis
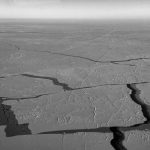
Though it does not rain or melt much in winter in the Arctic, the rivers still transport a lot of liquid water through springs and subsurface flow that percolates to the surface and refreezes, forming vast fields of aufeis several meters thick that can extend for many miles. These fields of ice persist well into the summer, providing a source of river water even in droughts and thereby affecting the local ecosystems which have adapted to their presence over the millennia. More recently, oil development interests have proposed harvesting this ice for use in the construction of ice roads, since unlike the flat areas to the west which have plenty of lakes (because it’s flat!) the steeper, lumpier 1002 Area has almost no lakes (because it’s NOT flat!) so sources of fresh water for the construction of ice roads is in short supply here. I’ve been mapping some of the larger aufeis fields the past 2 years, and occasionally over the past 7. I think it important to map them before the end of winter as that’s when they are at their maximum and that’s when developers are most interested in using them.
What’s next?
We’ve come a long way in 20 years. In my first arctic snow mapping expedition in 2000, the state of the art in characterizing annual arctic snow depths was measuring on a 1 square kilometer grid every 100 meters (100 measurements) and then going on a somewhat random 3 day snow machine trip to measure snow depths in a variety of terrain types for another few hundred measurements in total. With the advent of the awesome magnaprobe, automatically recording depth and position, productivity improved 10x – 100x but still even as of 2018 only about a million measurements had been made from all ~50 of the units produced over ~20 years. These past two years I’ve been mapping tundra snow depths here at a rate of roughly 1 BILLION measurements per HOUR, and doing so with an accuracy that meets or exceeds that which can be done on the ground with a probe while covering spatial extents that are inconceivable for field teams. And though I can’t measure snow density from the air (yet!), density can be reliably estimated and it is not a regulatory measure when it comes to seismic vehicle trafficability. Personally I doubt whether satellites will ever be able to match what we can do in a plane for thin Arctic snow packs, but in any case if we want to know what the snow depths here are now in support of answering our questions on basic science or resource development, we need to map them now. Towards that end, there’s no reason why we can’t map snow depths for the entire 1002 Area at 12.5 cm resolution to eliminate extrapolations completely, I did it completely in summer 2018 and I know at this point I could do it all again in winter in 4 days or so, that’s just a question of interest and funding. That is, technology is no longer a barrier, it’s just more than I can support out-of-pocket like I’ve been doing these past several years. Regardless, with a third year of these data in 2021 combined with a decade or so of local weather stations supplemented by the several field probing campaigns plus the airborne measurements of snow density and soil depth-of-freeze I hope to make next winter, I think by summer 2021 we will have enough data to responsibly address some interesting and important decisions over the breadth and width of the 1002 Area. And ensuring that sufficient data exist for that purpose was my goal, so I’m glad to be well on my way to finishing this project.