A Beautiful Start to our 2018 Field Season in the Arctic National Wildlife Refuge
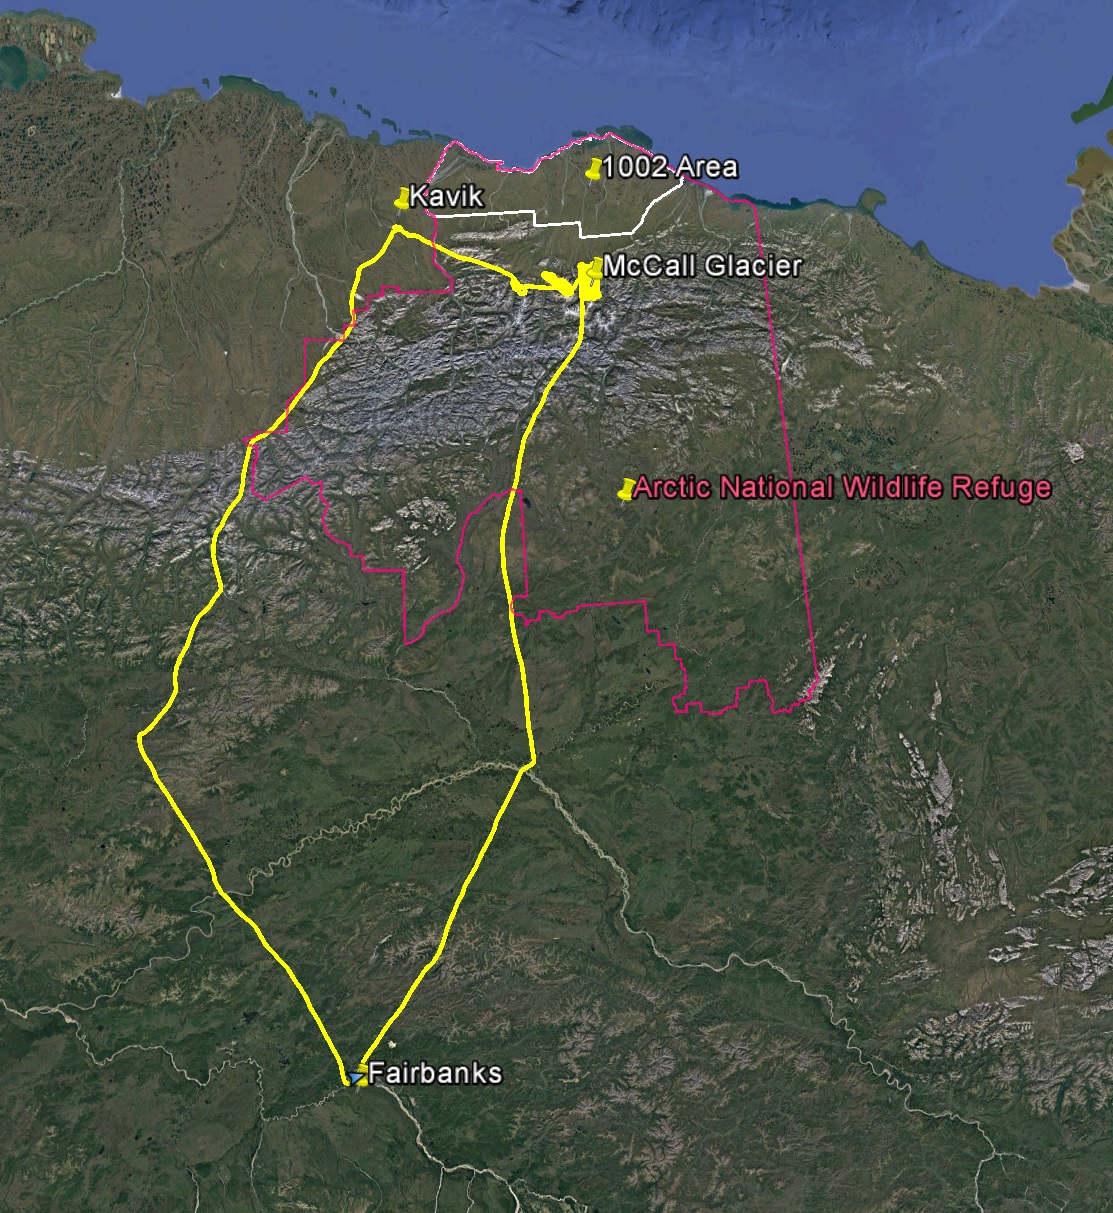
Last week Turner and I began our 2018 field season in the Arctic National Wildlife Refuge by mapping about 20 glaciers there on a beautiful, sunny day. Our hope for the rest of the season is to not only map all of the glaciers in the Arctic Refuge, but the entire 1002 area where oil drilling has now been opened by Congress.
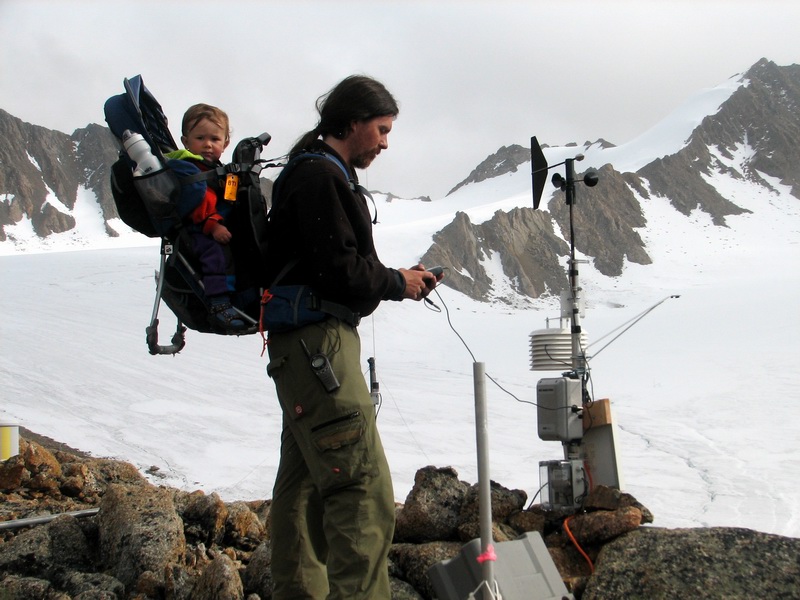
I’ve been working in and mapping the Arctic Refuge for 15 years, and Turner has been joining me since he was an infant 12 years ago. Most of our field work has centered around McCall Glacier, where I have conducted over 30 expeditions over that time, accumulating into over 36 months of my life. I think for much of his young life, Turner had spent more time in the mountains of the Arctic Refuge as a percentage of his life than any human at the time, including his first 7 birthdays. Field work on the glacier has slowed down substantially the past few years as I have been running the project on my own, including personally purchasing and flying the airplanes needed to access the glacier. But this summer I hope to get back up on step and resume our normal schedule of spring and fall expeditions, scheduled around measuring the end-of-winter snowpack and end-of-summer ice melt.
On McCall Glacier, in the middle of the Arctic National Wildlife Refuge, with Turner on his first birthday in August 2006.
Flying over McCall Glacier with Turner last week, about 12 years later. Airplanes aren’t the only things that fly…
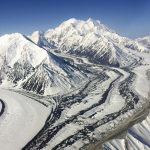
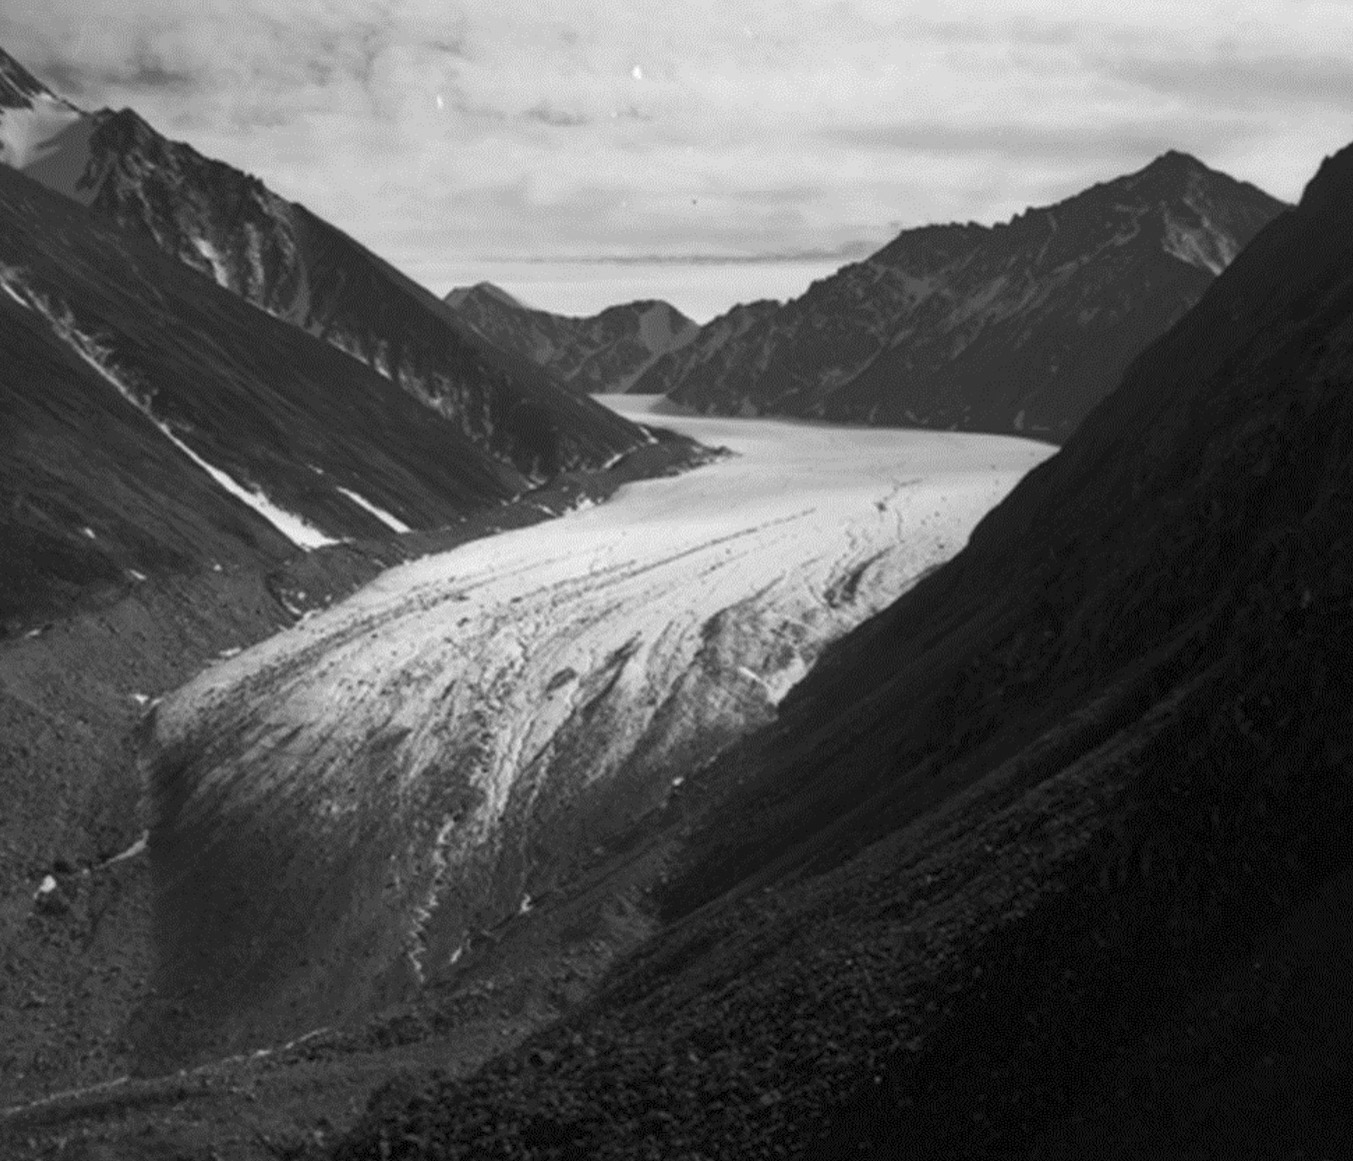
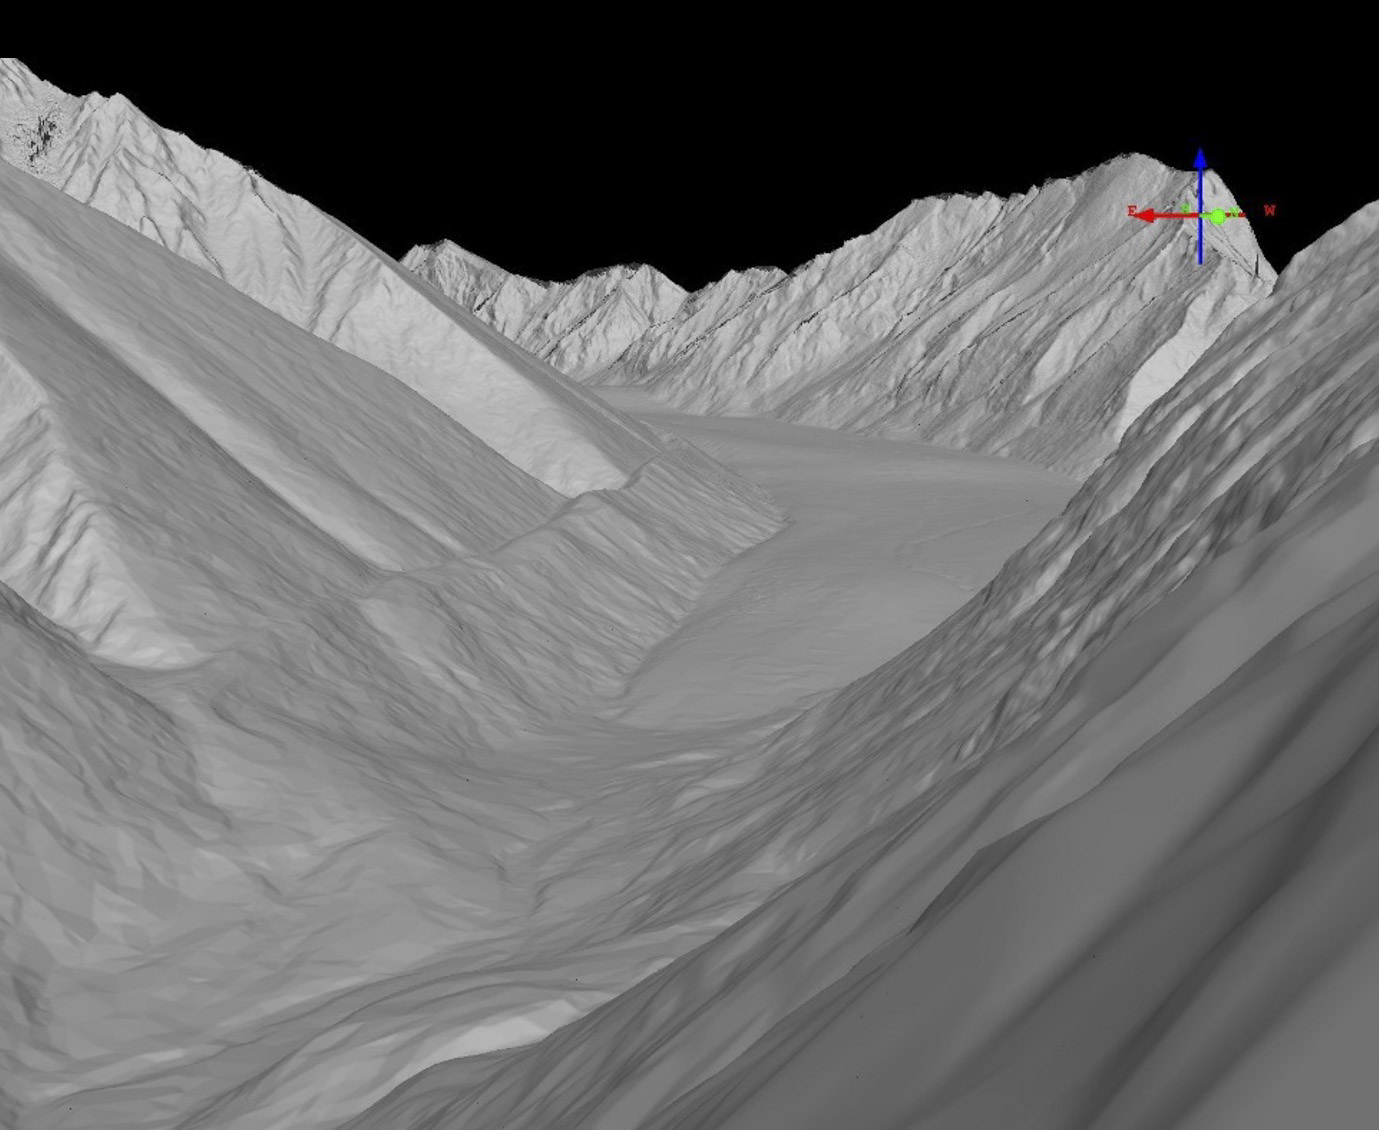
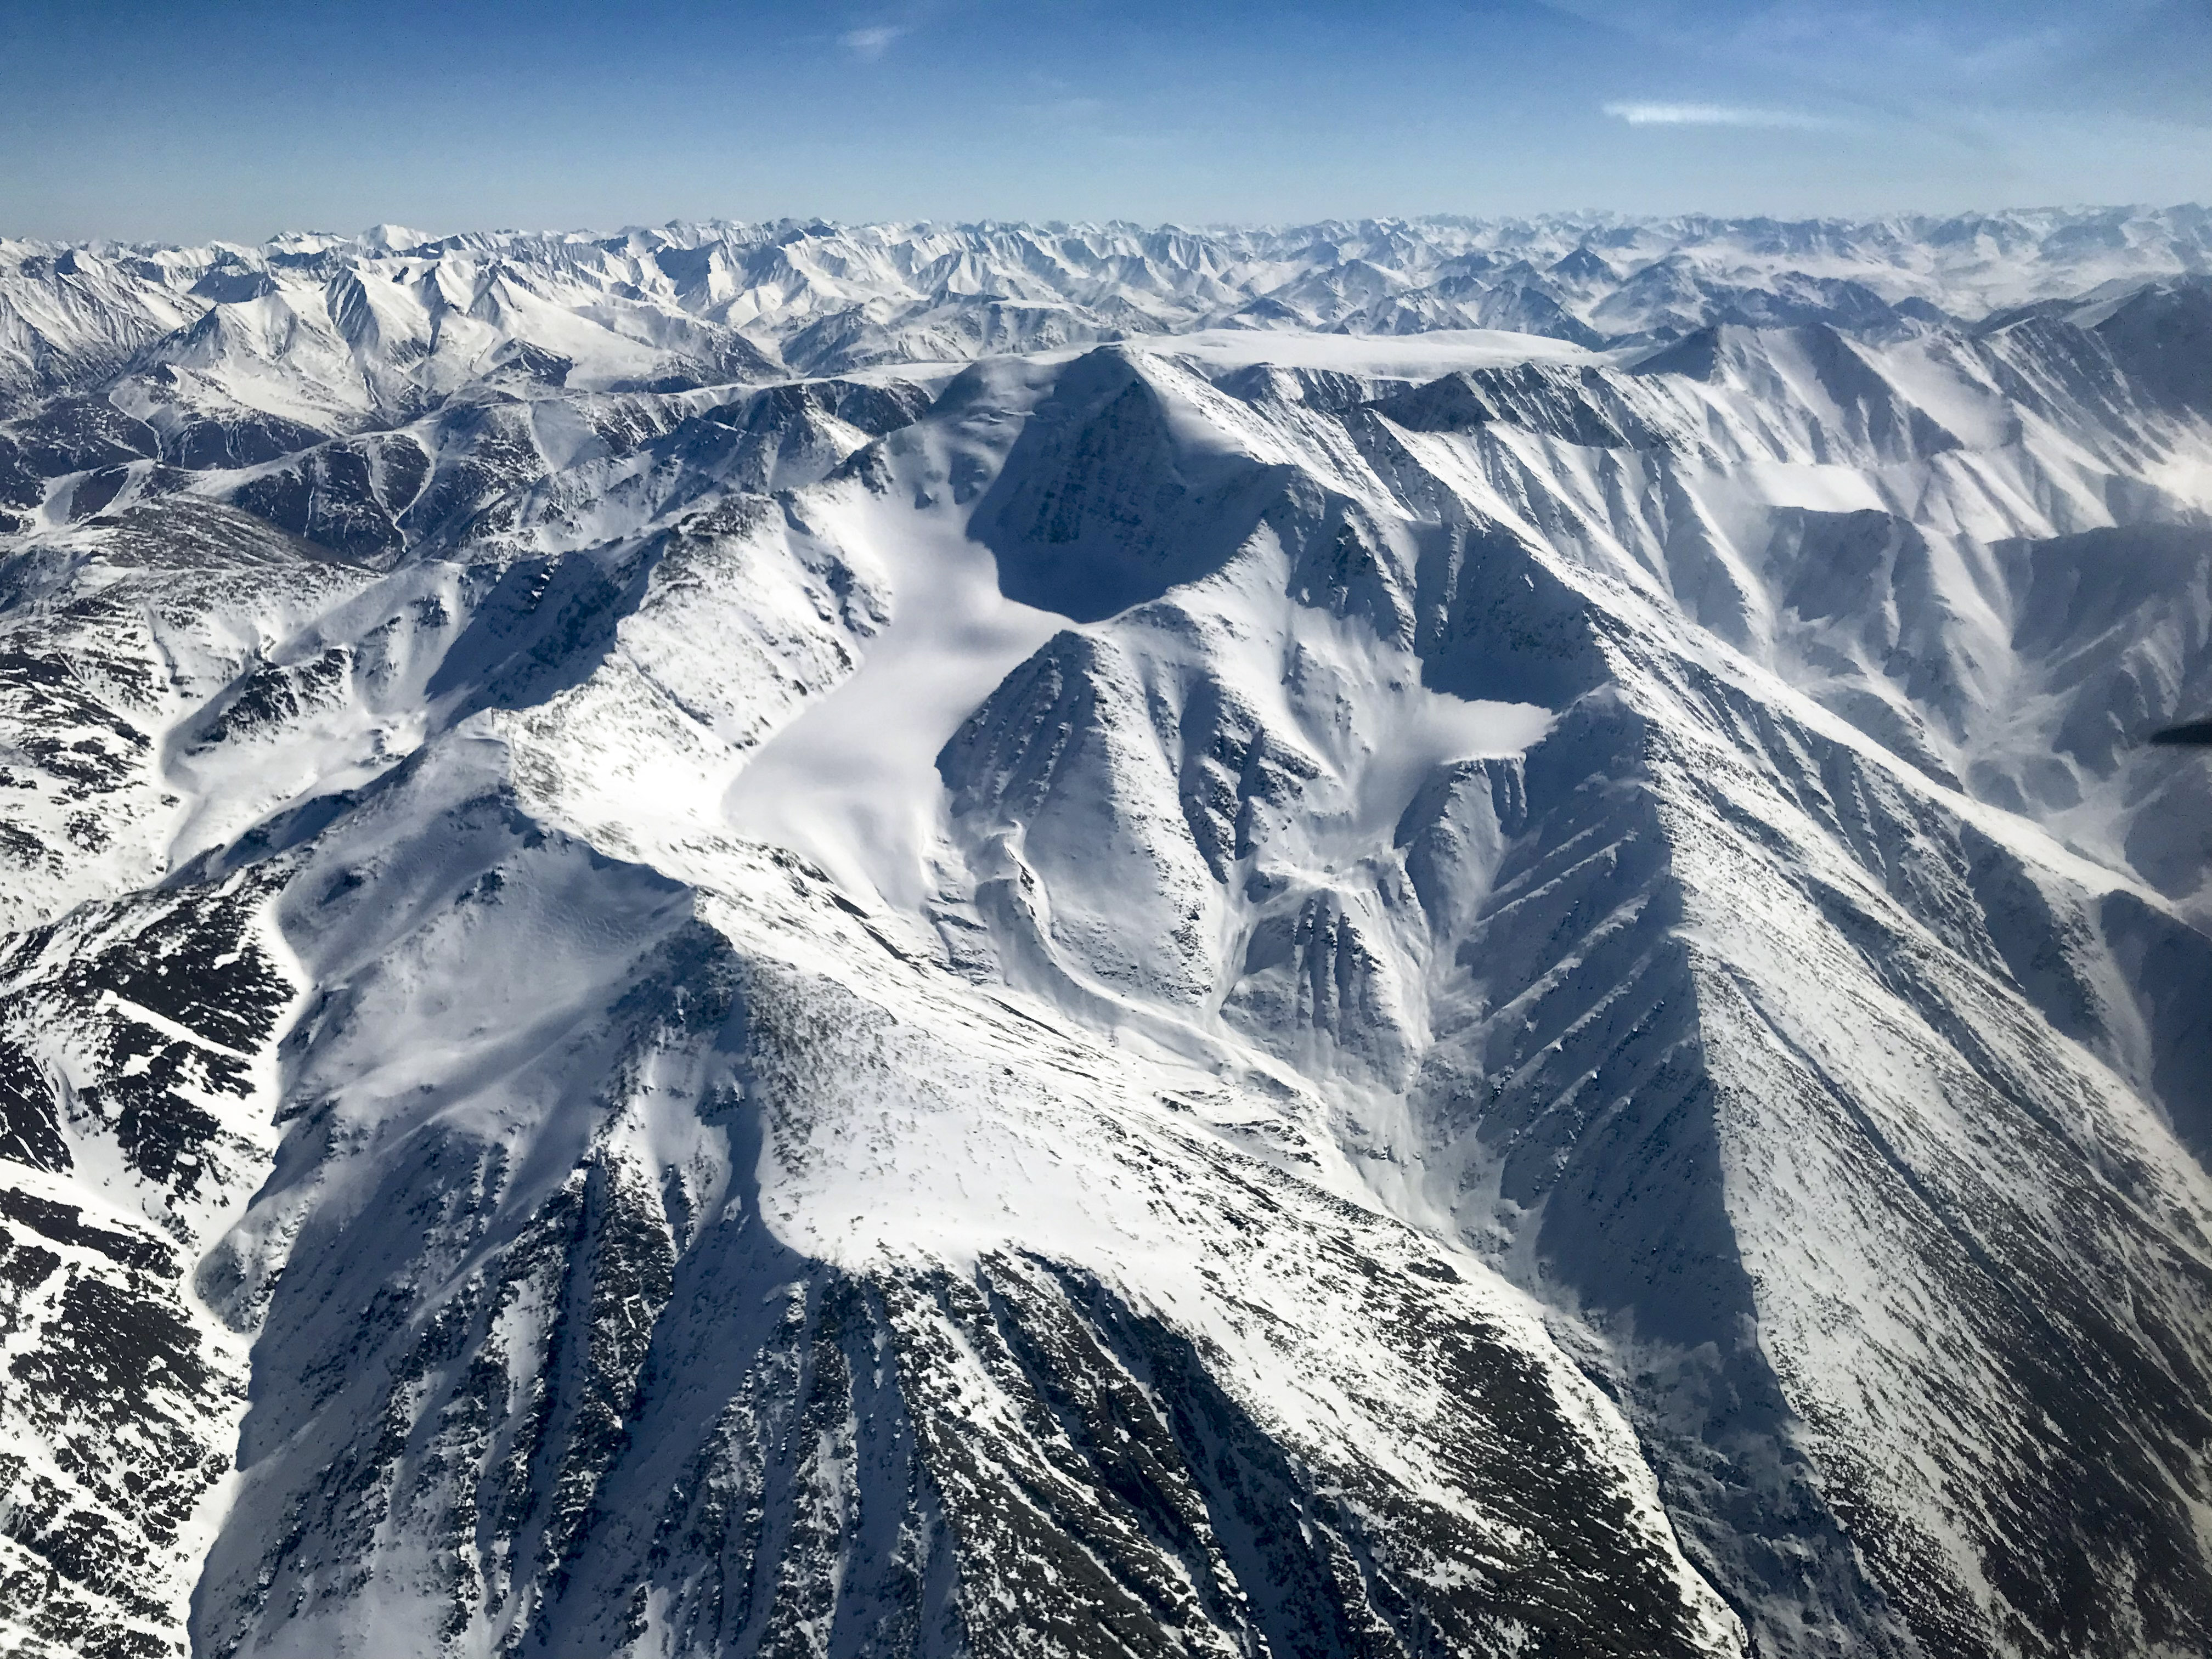
McCall Glacier, last week. McCall is running diagonally through the center of the frame. A hundred years ago, probably half of the snow seen here would have turned into glacier ice. Today none of it does. Even if climate stops changing, these glaciers will all largely disappear in Turner’s lifetime. The loss of the glaciers will have considerable impact on migratory bird impacts, as these glaciers create the deltas they live on, as well as migrating fish whose rivers only stay open during migration season due to glacier melt, among other ecological impacts.
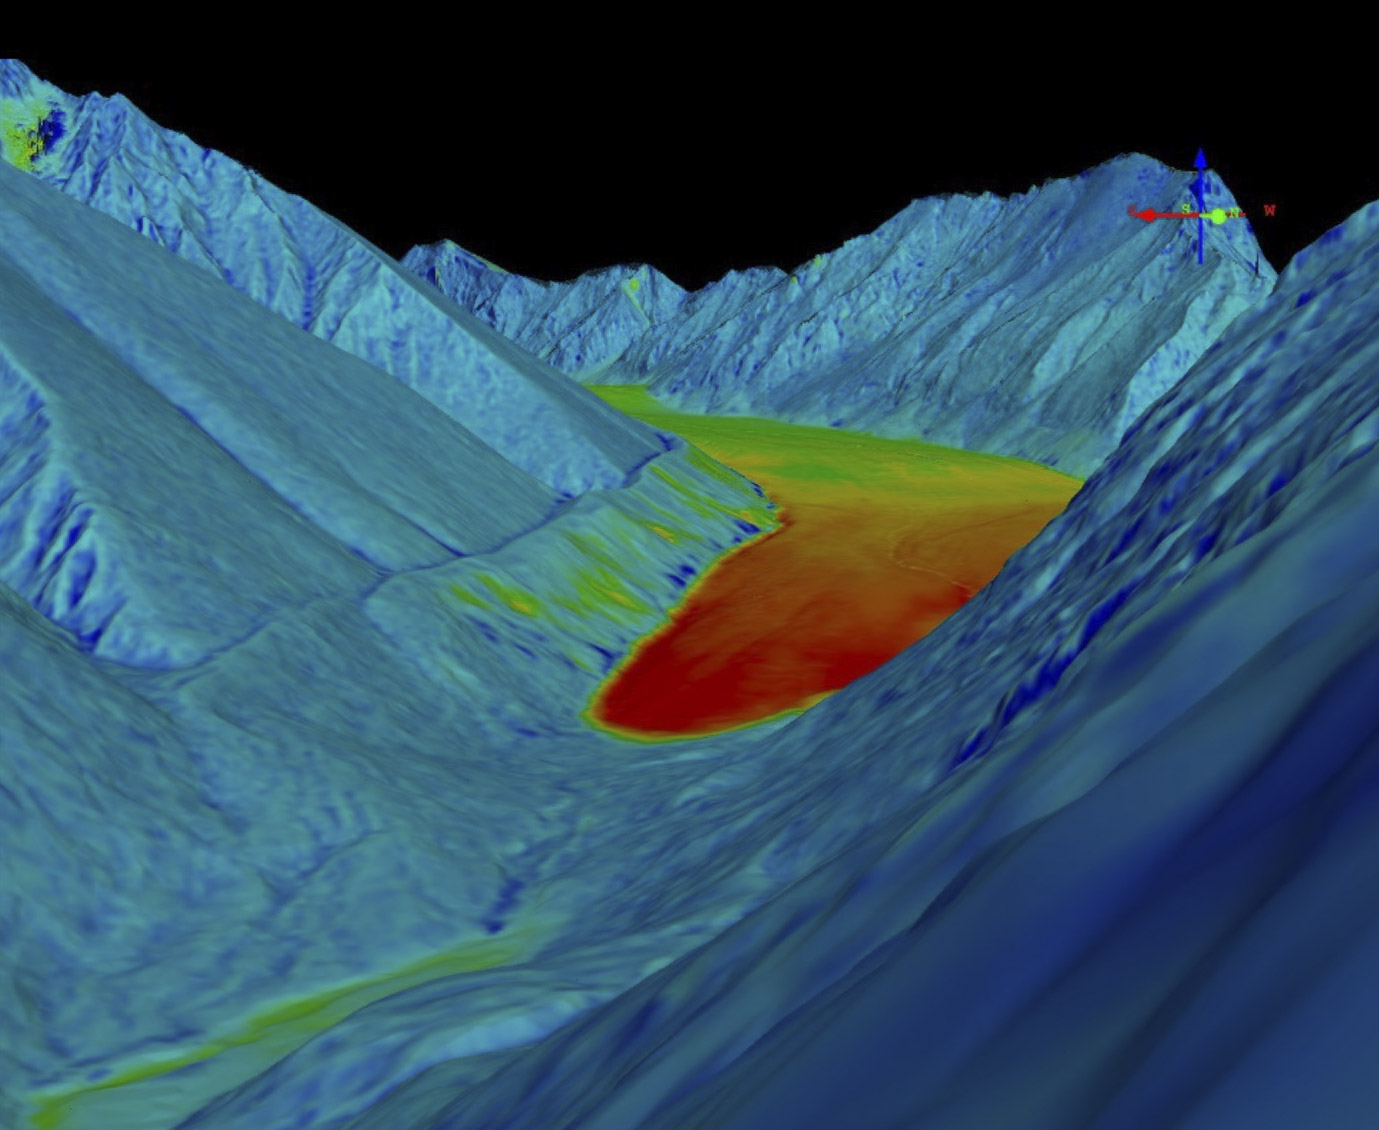
Our overall goal there is to understand the impact of climate change on these glaciers and the downstream ecosystems they support (fish, birds, shrubs, etc), as described in part by this paper. I do this by by intensively studying McCall Glacier in the field, because it’s all we have time or money to do (and often not even), and hoping what is happening there is representative of the region’s 400+ glaciers. I test that hope by topographically mapping all of the glaciers periodically to determine their ice loss or gain over time. Practically speaking it has been only ice loss for decades, and we measure this by subtracting one map from another to see how they have changed.
I have mapped McCall Glacier personally from the ground twice per year since 2003 and from the air 2-3 times per year since 2013, and I hired commercial outfits to map it from the air annually from 2008-2011. Our trip last Wednesday was the first in 2018 of that long string of maps. On this trip we not only mapped McCall Glacier, but about a dozen surrounding it. We also mapped Esetuk Glacier, as well as several around that. I’ve mapped Esetuk a bunch in the past as well, partly because it is pretty but also because it is one of the largest and is adjacent to Mt Michelson, one of the 5 tallest peaks in the US Arctic that I studied to determine that it is the 4th tallest.
It was a beautiful day for a flight to the Arctic. Unlike the past 10 days which had been scuzzy or windy and largely prevented me from landing on the glacier thus far to conduct the spring field work, this day was clear and calm for nearly the entire flight. I woke at 4 AM to check weather, prepped a bit, got Turner awake, and by 7AM or so we were airborne. We stopped in Fort Yukon to splash in some fuel we were carrying to extend our range, and then continued North. It was after 11AM by the time we reached the glacier, over 300 miles from Fairbanks. This distance is about the same distance as taking off in New Jersey to map something in Ohio, except that there are only 3 weather stations here instead of 300 there to aid in flight planning, and there is no fuel or service available here compared to hundreds of options in the States. Heading North like this, we are essentially on our own!
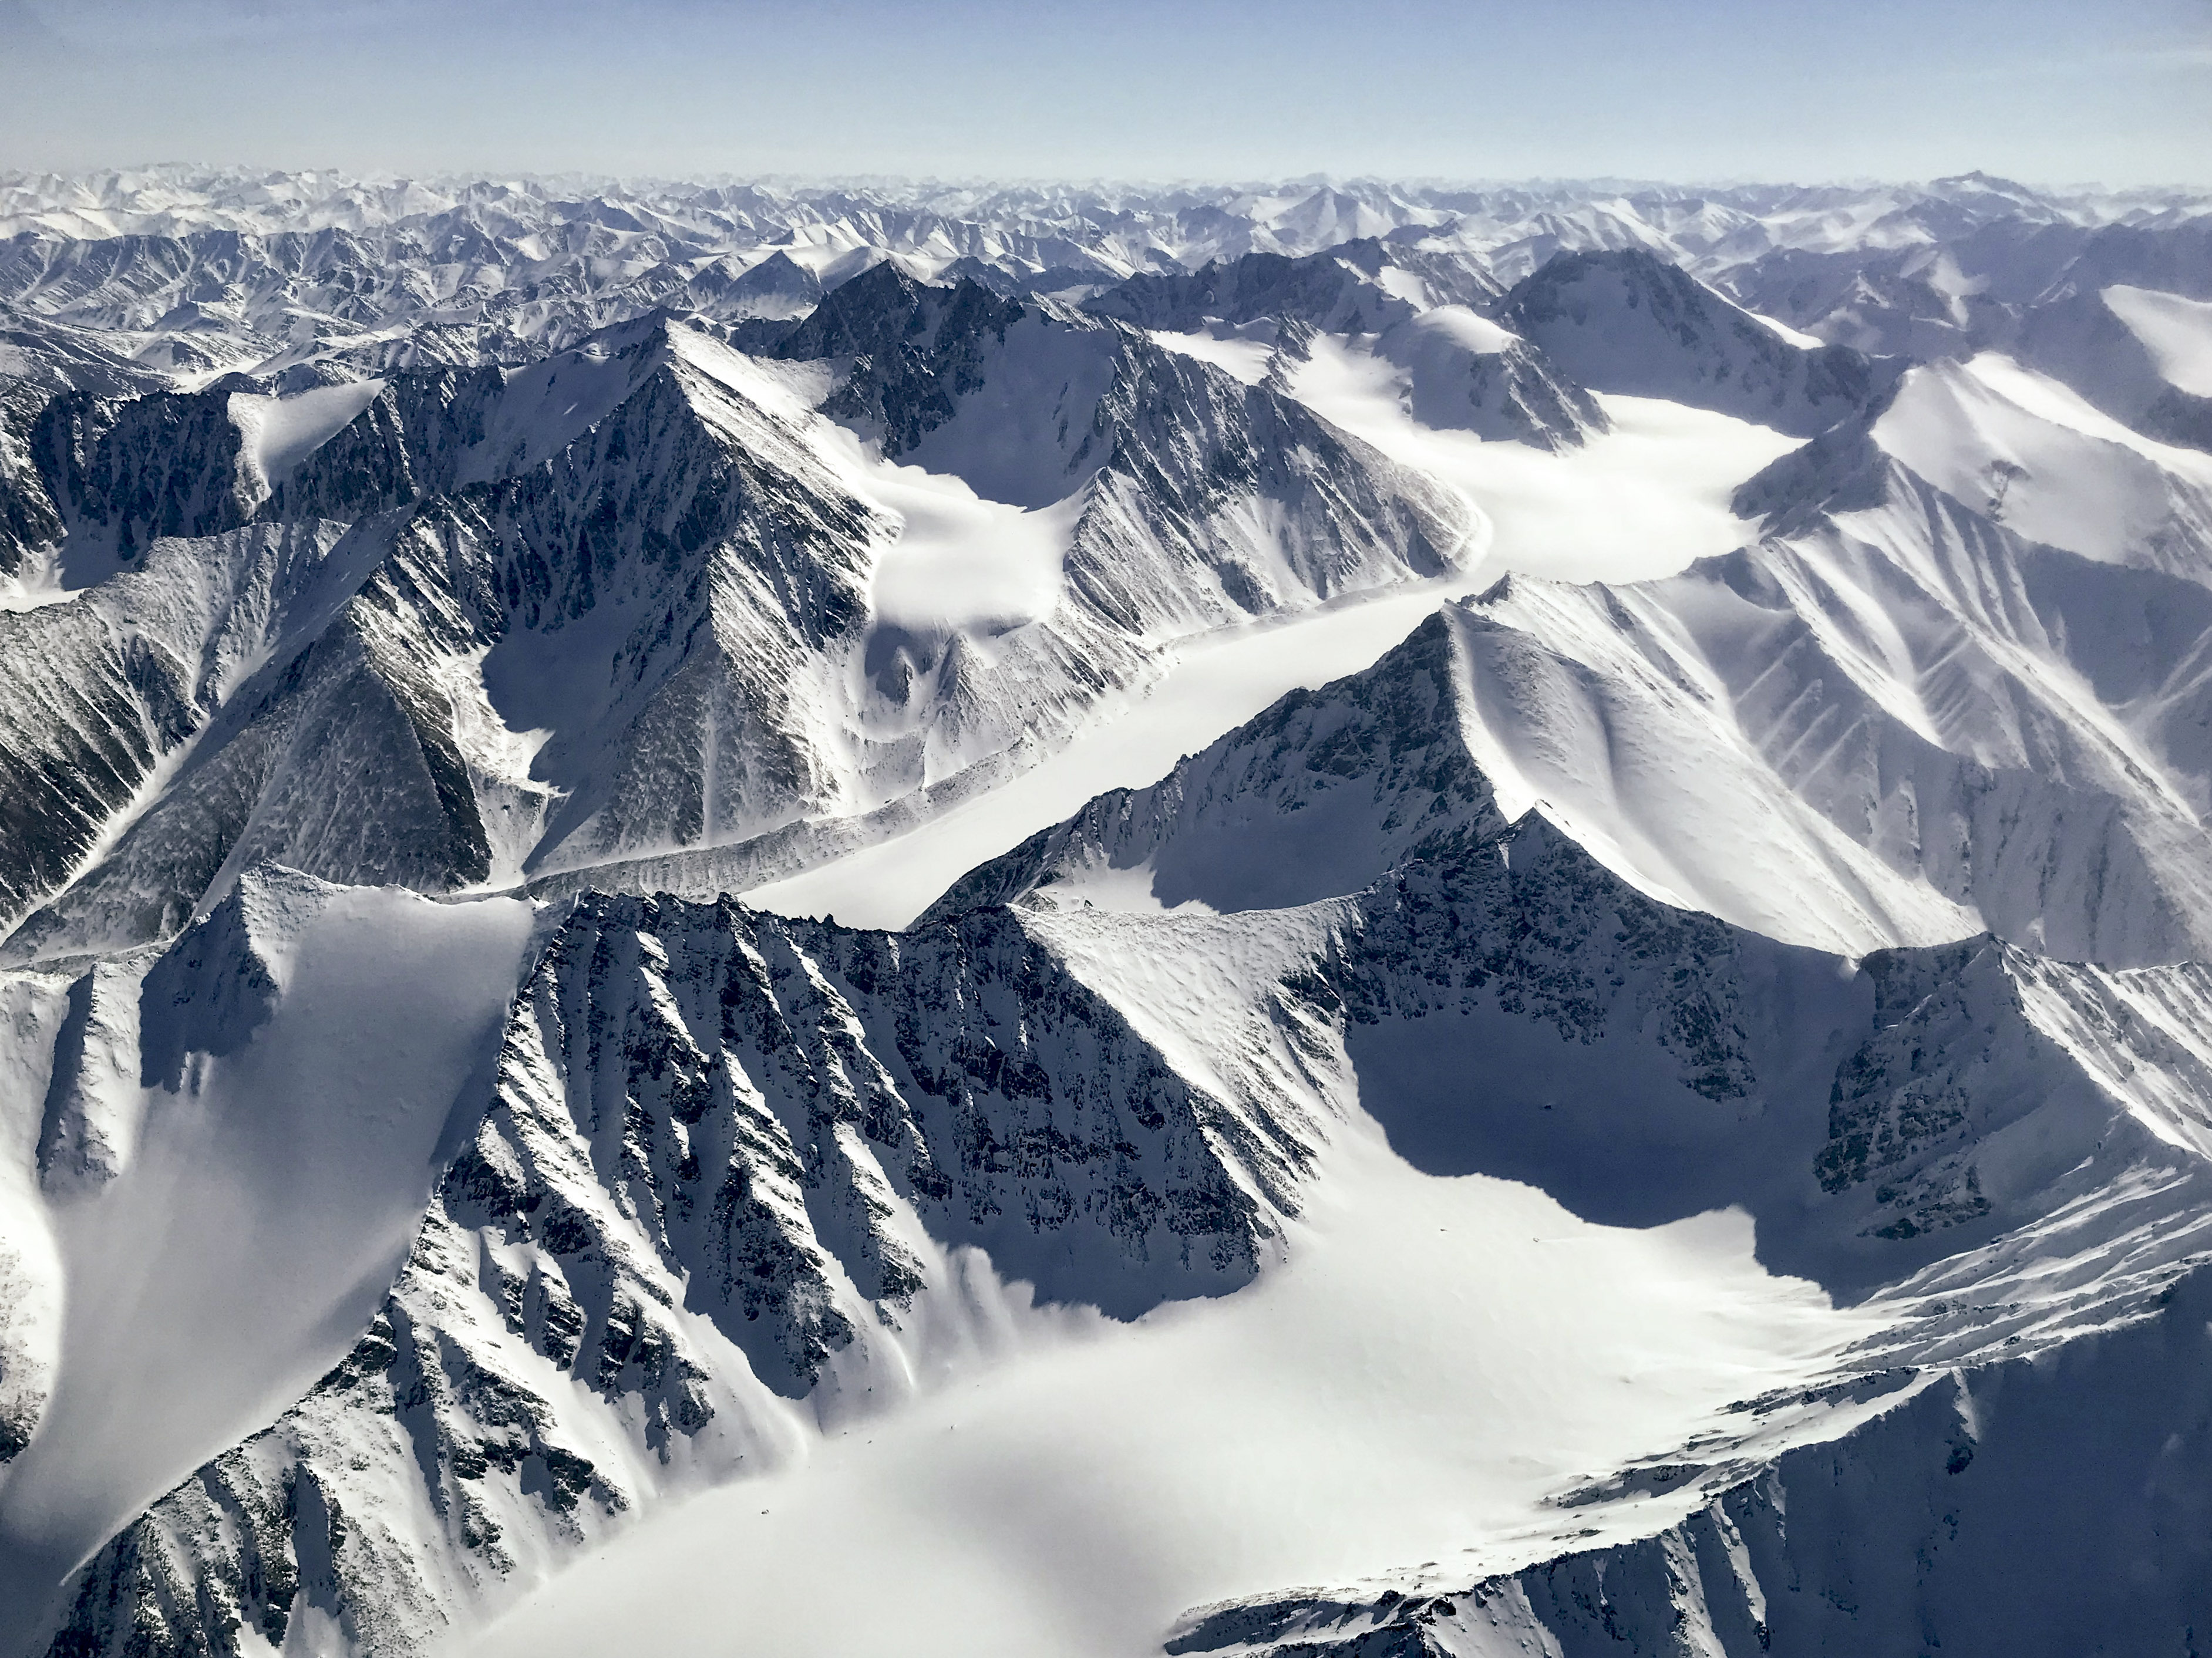
The mapping itself went well. The calm air and clear skies over the Arctic Refuge made for pleasant flying with stunning vistas.
Our flight was the equivalent in length of flying from Canada to California and back, though we passed over maybe 500 people instead of 5 million.
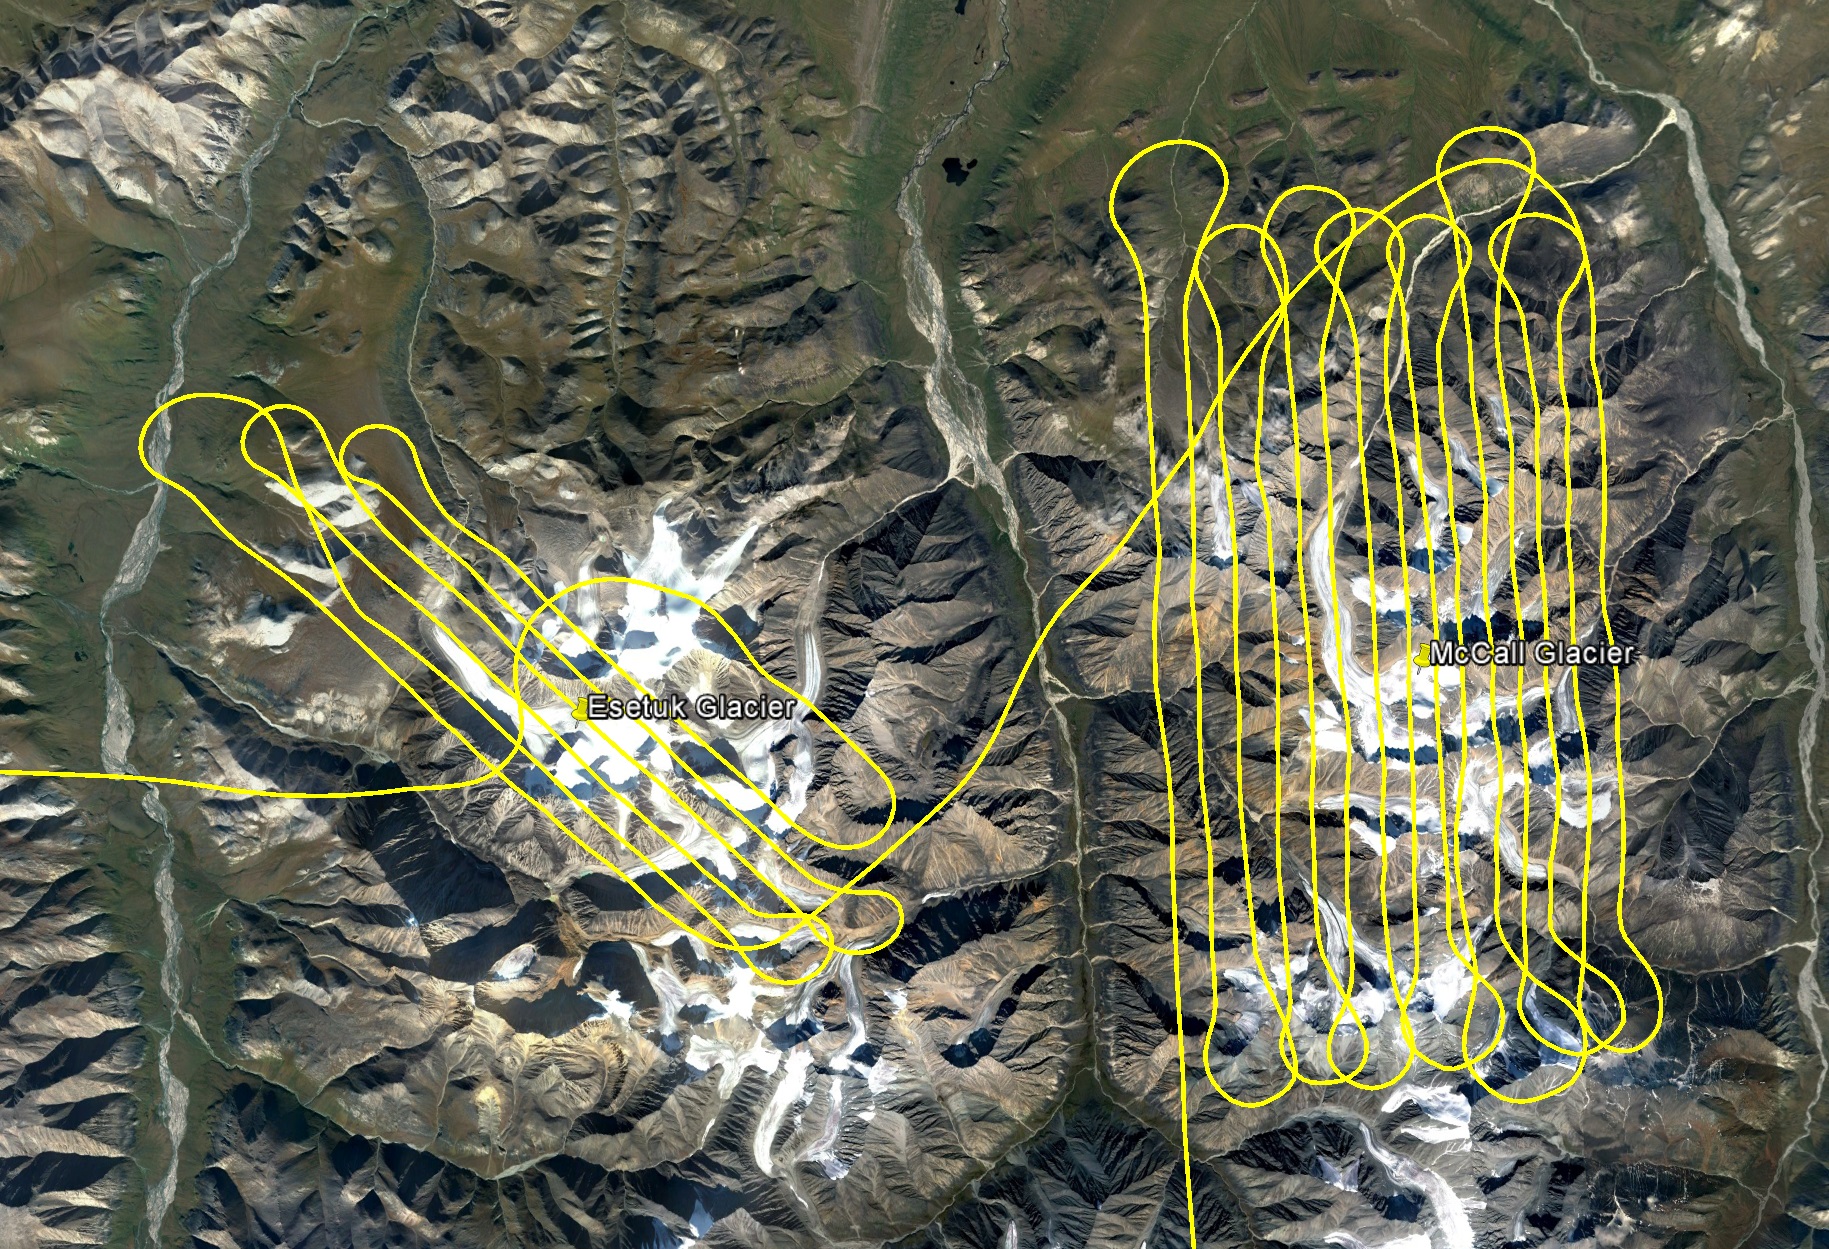
Our flight lines over McCall and Esetuk Glaciers. We captured about 20 smaller glaciers as well. Hiring a commercial company to make a map like this would probably cost $50,000. My opportunity cost of doing it for free (that is, not doing other commercial work) is less, but on the same order.
Mt Chamberlin, 3rd highest peak in the Brooks Range, with Chamberlin Glacier descending from it. I’ve mapped this glacier and peak at least 10 times over the past 5 years.
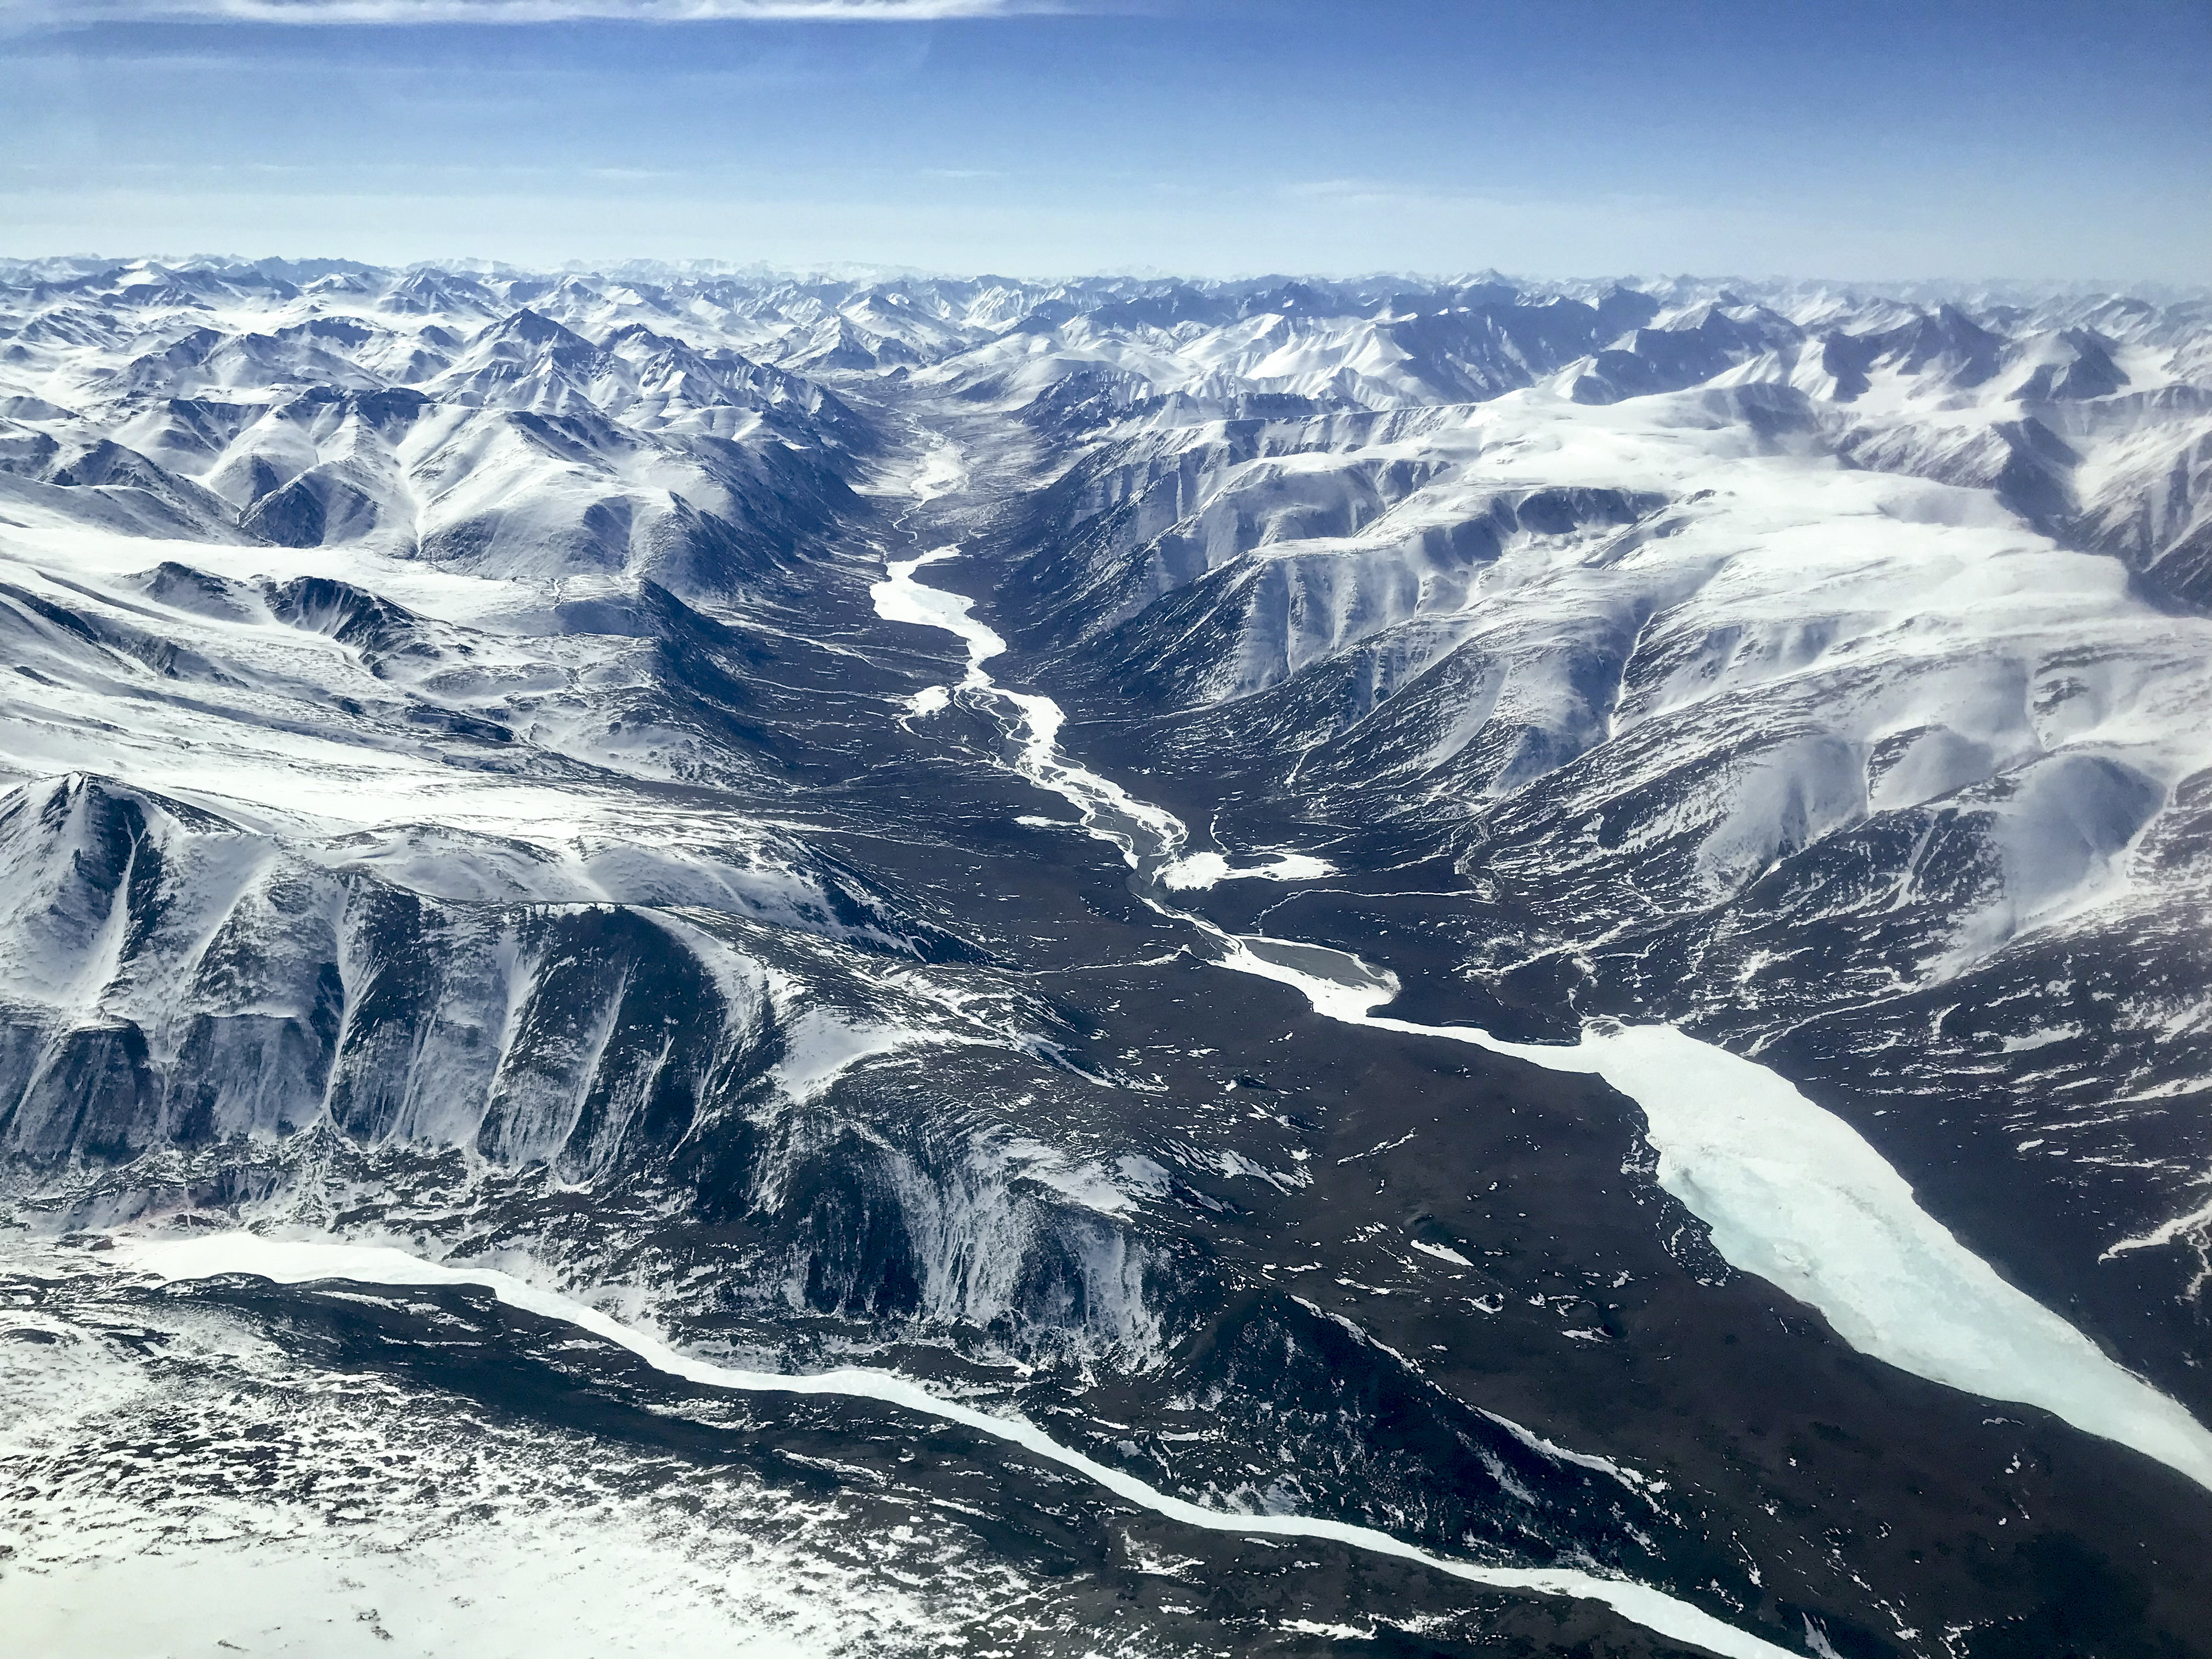
The Hulahula River is often snow free at the end of winter because of wind scour and sublimation. This river carries huge amounts of glacier meltwater to the coast throughout summer, keeping the river open when it otherwise would be dry due to lack of precipitation. Dolly Varden use this pulse of glacier meltwater to make it upstream to spawn, and the locals then harvest those fish for subsistence. The river also carries tons of sediment to the ocean, where it forms the largest deltas in Arctic Alaska despite being one of the smallest rivers. Tens of thousands of migratory birds use this delta for feeding and chick rearing. When the glaciers disappear, so will those deltas. When the deltas disappear, what will happen to the birds is anyone’s guess. But having a bunch of oil rigs surrounding it is not going to make the question any easier to answer, so hopefully having time-series of awesome maps will help.
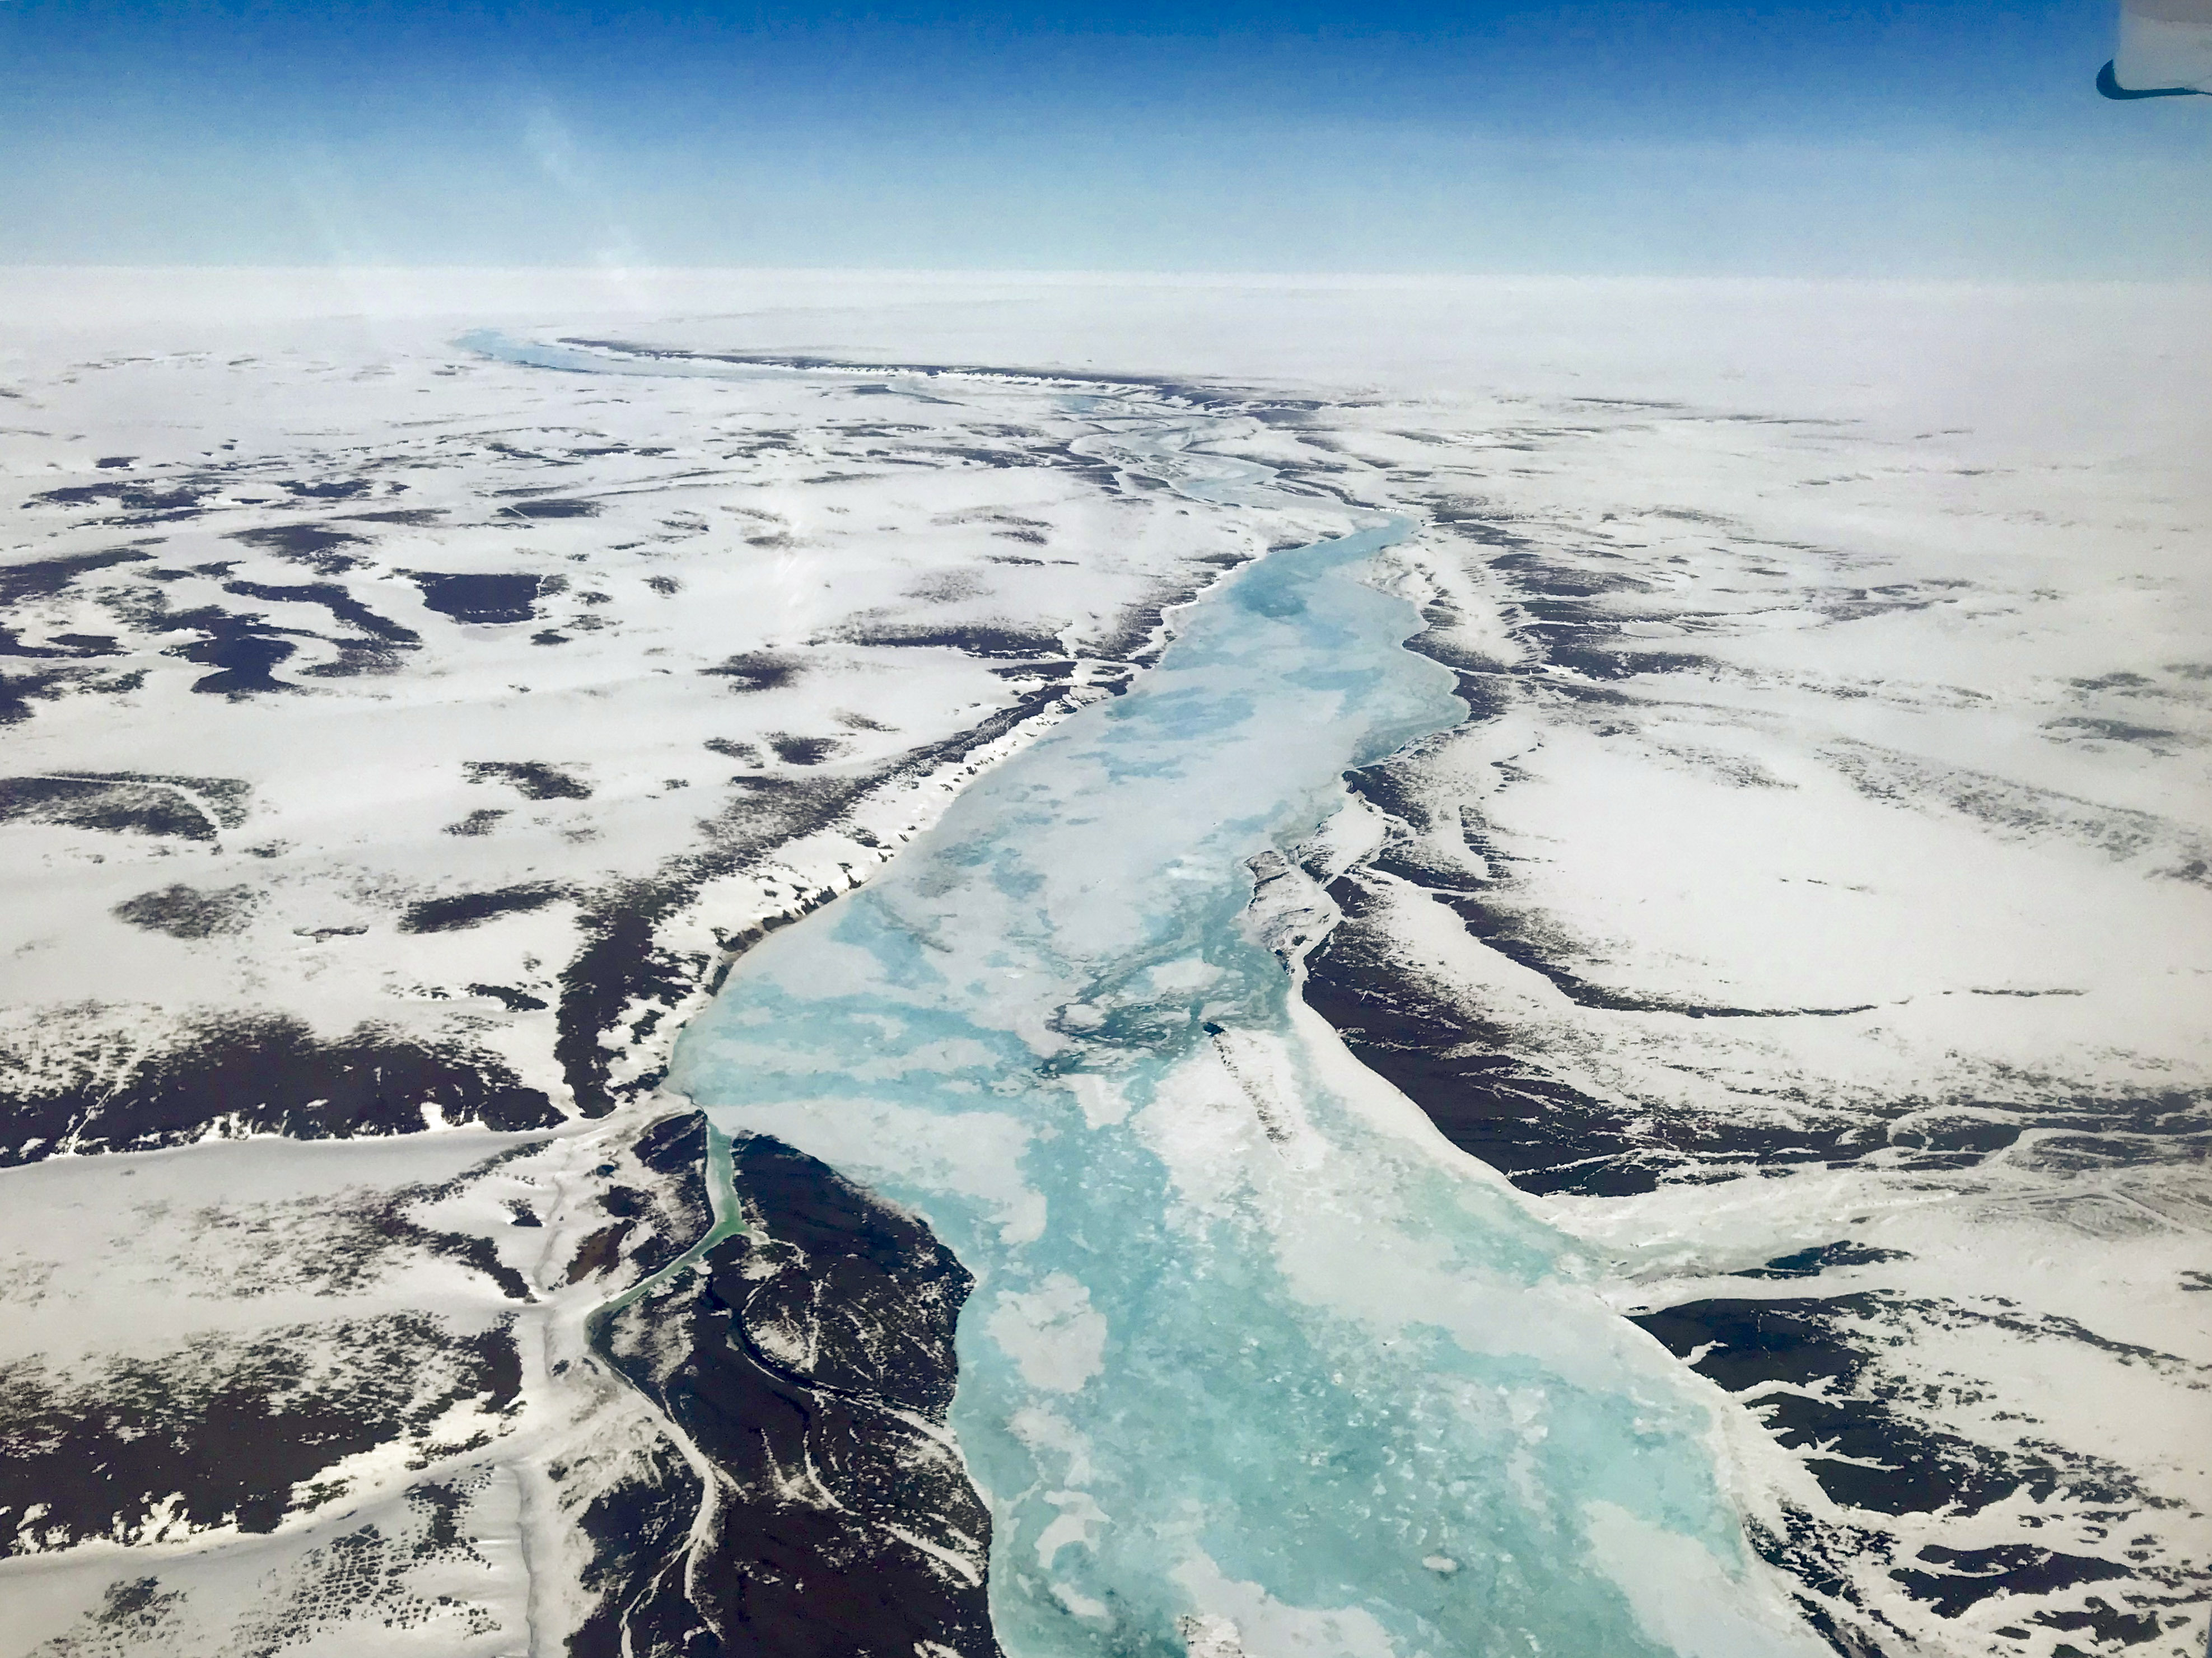 Aufeis on the Canning River. The Canning River is the western boundary of the Arctic Refuge. Aufeis is formed when liquid ground water emerges to the surface in winter and refreezes, and can be many meters thick. In spring, it diverts the river into various channels somewhat randomly, such as the Staines River, the westernmost distributary of the Canning River near its delta. That is, depending on how you read the law, the boundary of the Refuge varies with season and/or climate change. I mapped the Staines branch just for fun when it was empty last fall, just to show that it is still topographically viable as a distributary and actively takes on water under normal season water discharge variations of the Canning River.
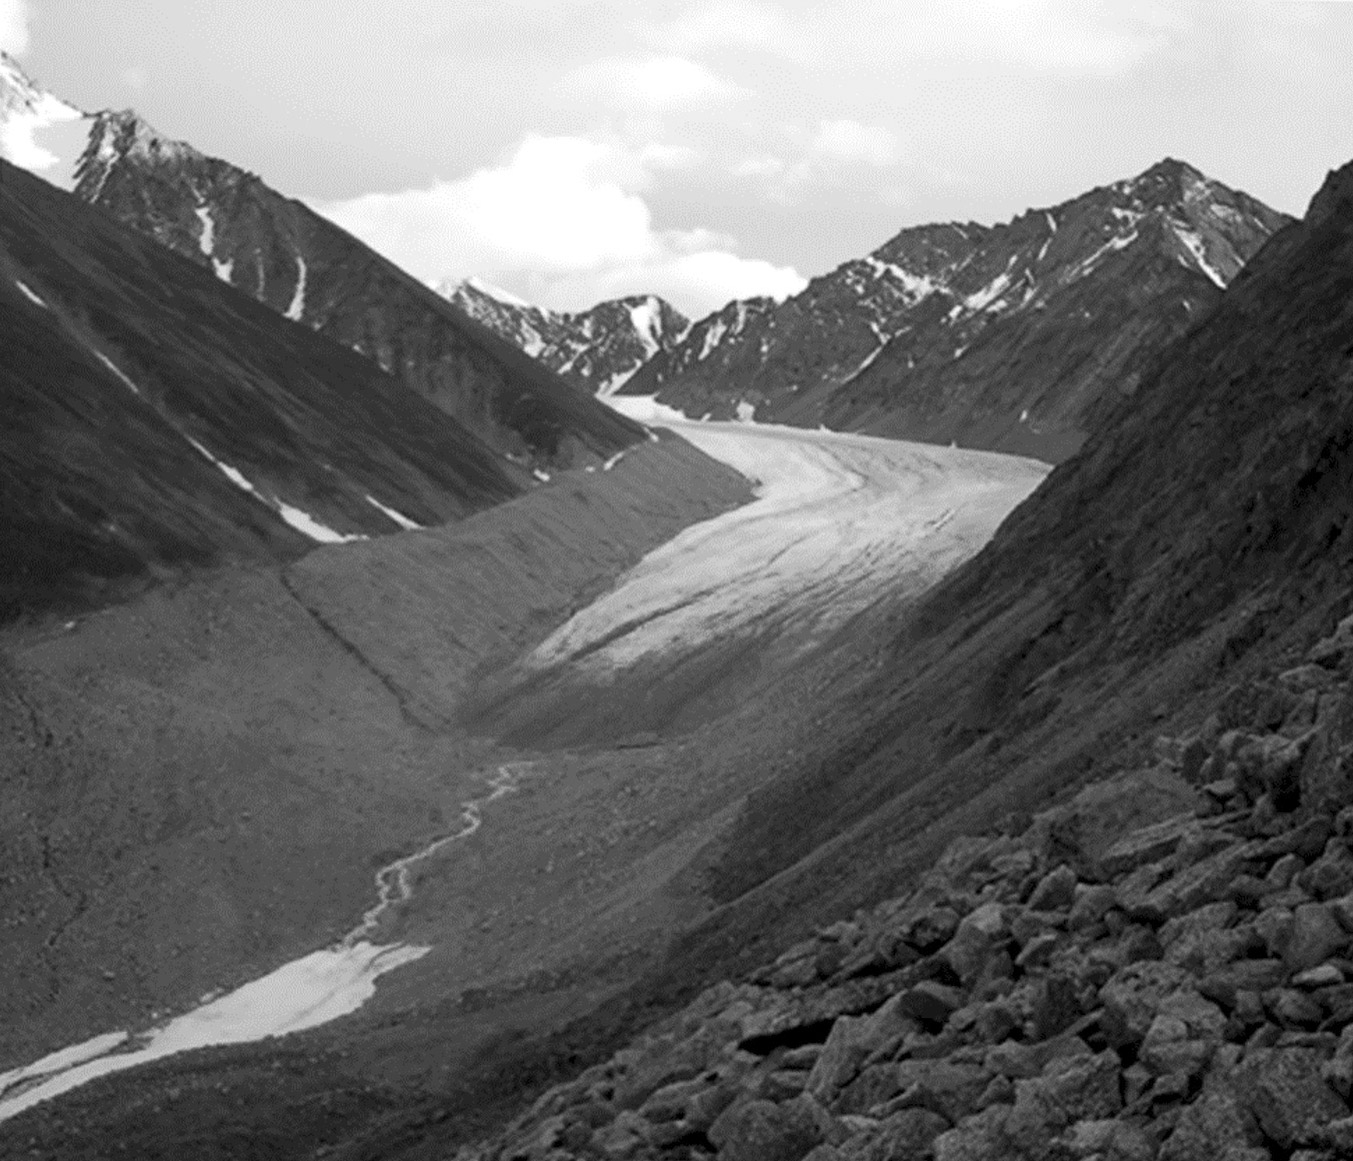
Here is McCall Glacier, taken during one of our flight lines to the east of it.
Here is Mt Chamberlin, on our way to Kavik. If you look really closely, you might see some recent ski tracks. These are some of my first attempts at airborne video, so there’s still a lot of improvements that can be made.
Once we had completed our flight lines, we headed to Kavik River Camp to drop off some supplies for use later in summer, catch up with the locals, and splash in a little more fuel for the way home. This time of year you never know what to expect in terms of runway conditions. Under the best of conditions, the runway is lumpy, rough and rocky. In spring, however, it can be covered by rock-hard drifts, soft snow, mud, or a combination of them all. Fortunately Rick and Sue had been there to maintain it so about half the runway was clear of big drifts and there was a snow free trail down the middle of it that remained just wide enough for wheels. Landing there was probably the biggest excitement of the trip, as on my first attempt to land I discovered several hundred ptmarmigan blending in with the snow on the runway. After buzzing them once they dispersed long enough to land; we basically had to do the same thing on the way out.
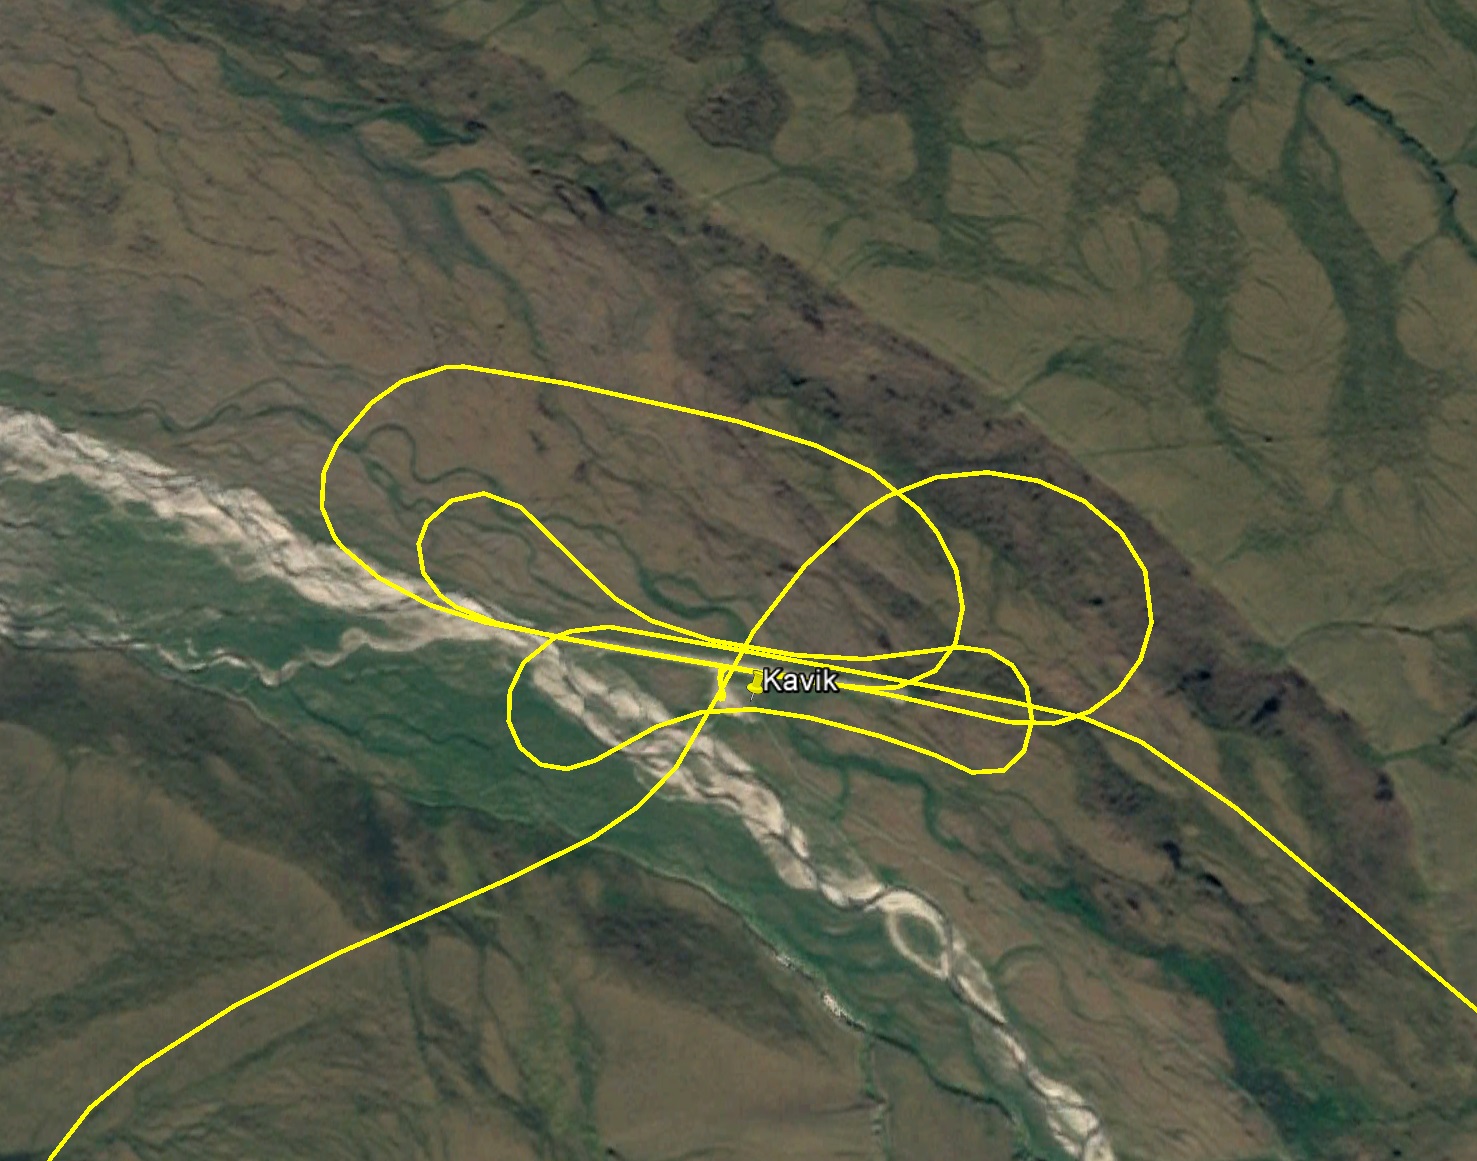 Landing somewhere new, or landing somewhere that conditions are constantly changing, requires a few low passes to assess the sanity of landing there.
Here we are landing at Kavik. This is a 360 degree video, so you can use your mouse to get a view inside the cockpit or outside. Only about half the runway was useable, so we had to fly over the recently plowed part to land on the gravel. We had to abort the first landing as there were hundreds of ptarmigan hanging out on the snow at the edges of the usable surface, if you look really close you can see them flush but they are small so tough to see. On the next pass we had a flock of Canada Geese flying over us and ptarmigan under us. It’s always something in the Arctic!
Here is our take-off from Kavik. It’s 3D video, so pan around with your mouse. The idea was to get off the ground as quickly as possible, to avoid the rocks and soft mud and snow.
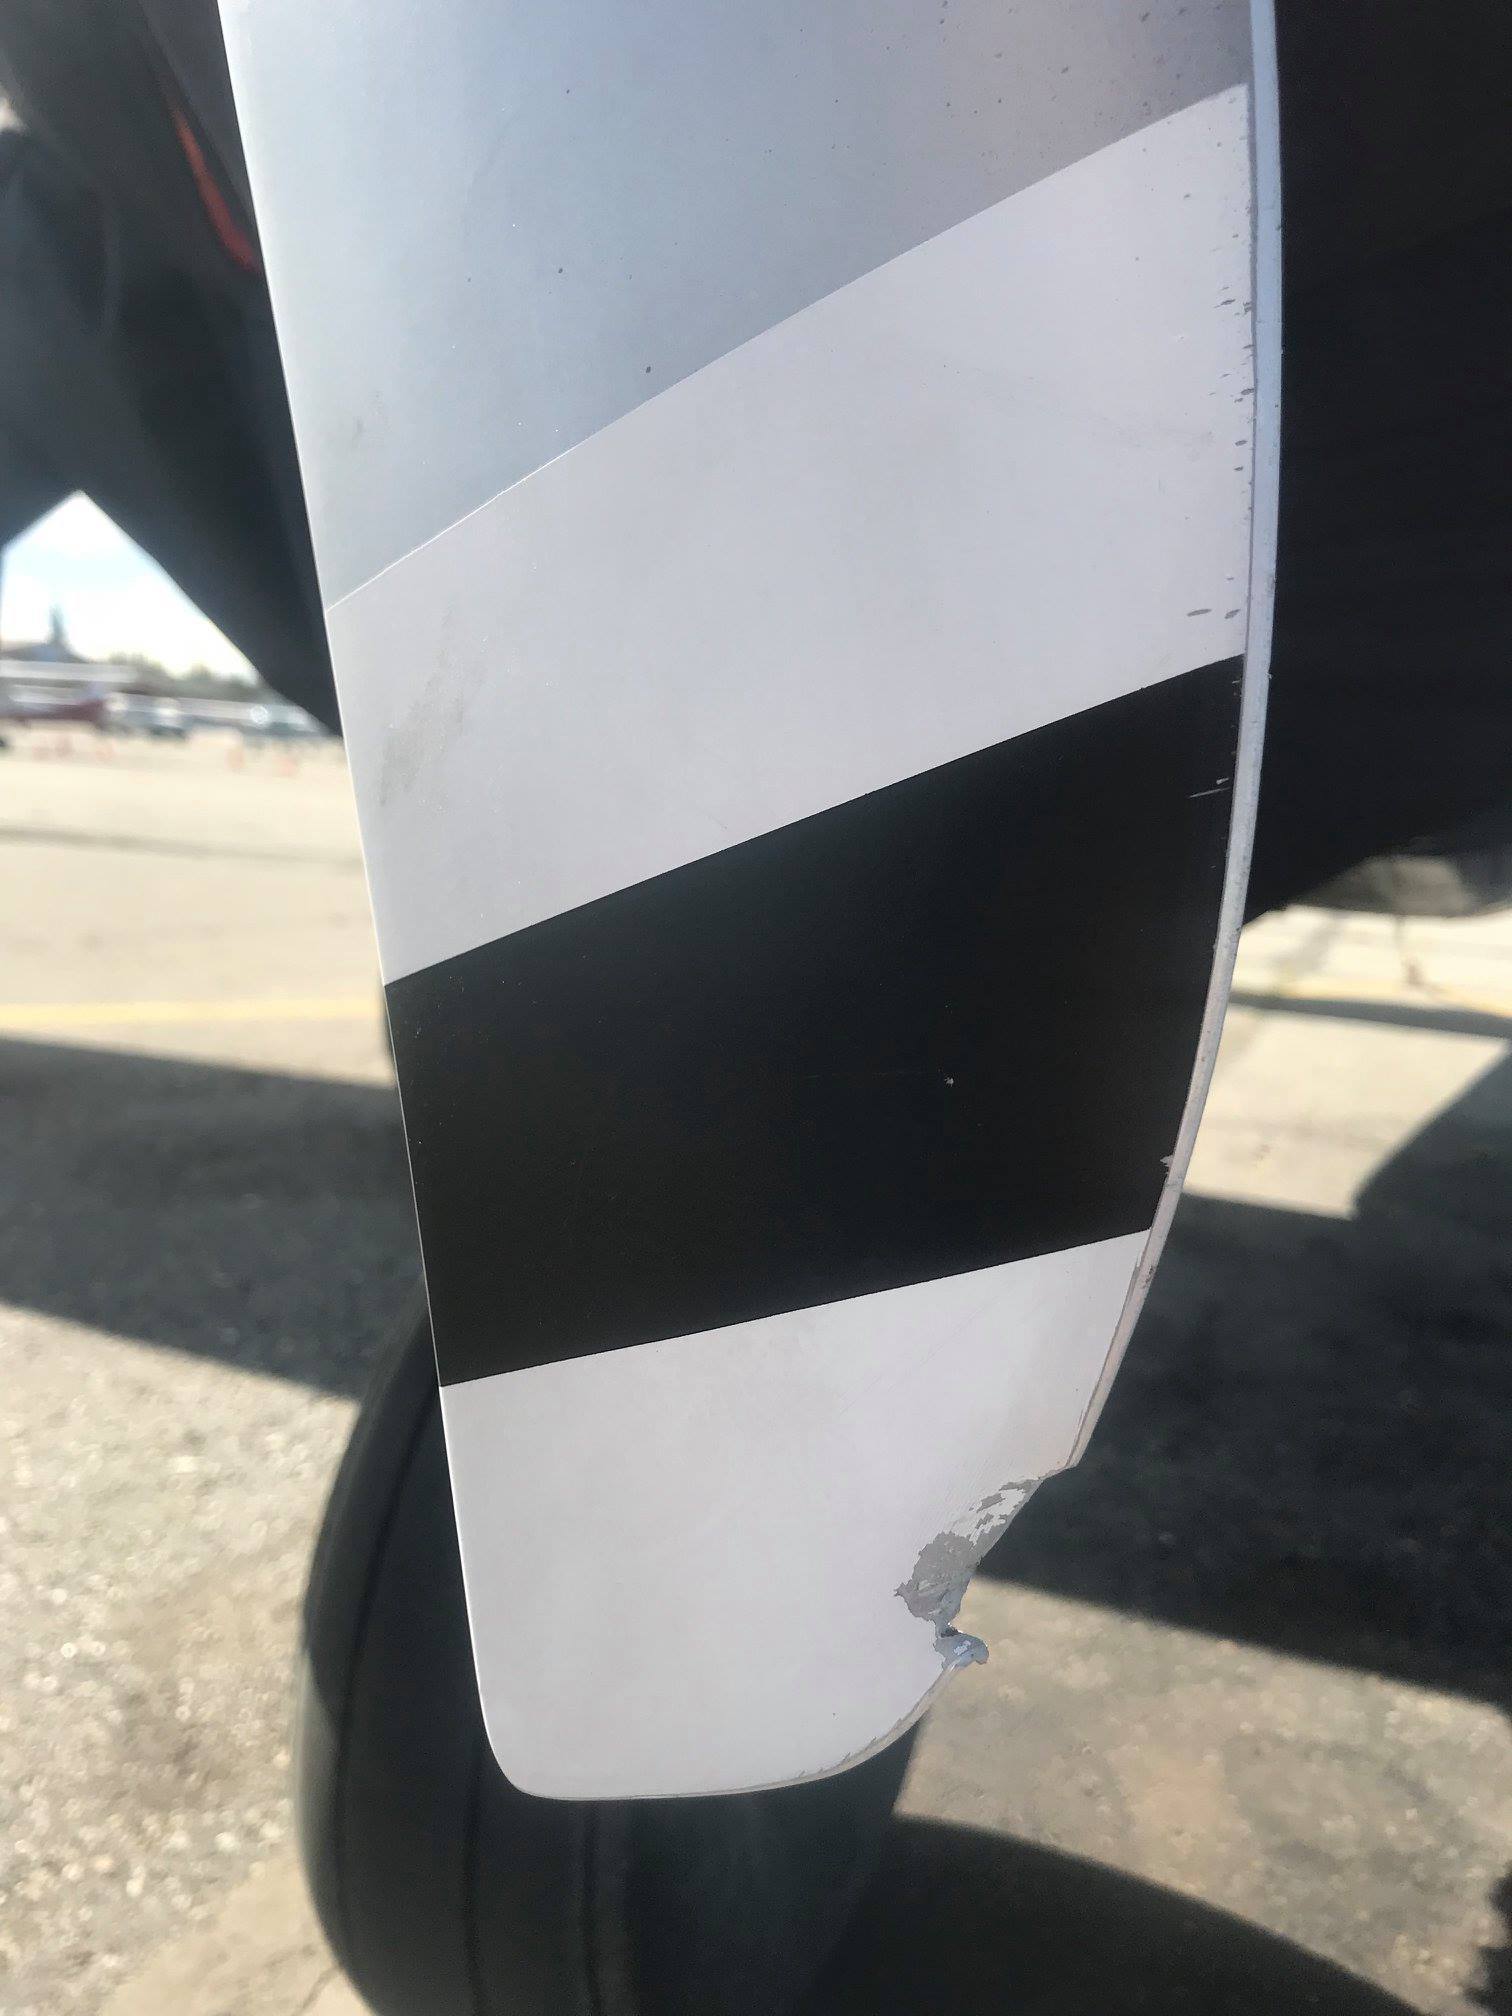
This didn’t happen in Kavik fortunately, but landing on the gravel strip back at Fairbanks International the next day. That means a new propeller! These are the risks of flying in Alaska, $10,000 out the window in a heartbeat. This is why flying in the Arctic is so expensive — if this would have happened in Kavik the cost could have been double and we’d still be there…
I had wanted to process the data right away and show some results here, but life (and rocks in propellers) got in the way. The raw data itself all looks great however, so I am confident the results will be just as awesome as they always are.
So in the end it was a great day to begin our 2018 field season in the Arctic Refuge, making this my 16th year of working out there. During all of that time, I have been about the only physical scientist working in the mountains of the Refuge and certainly the only one conducting a long term program of understanding change to our country’s Arctic glaciers. But times are changing. With oil drilling operations now allowed on the coastal plain of the Arctic Refuge (known as the 1002 area), I imagine there will be a lot of new faces out there, many doing things that could have long-lasting impacts of the fragile, frozen landscape.
Thus my major goal for this summer is to map the entire 1002 area, roughly half the size of Connecticut, with sufficient resolution and accuracy to topographically-measure tire tracks, such as those leftover from exploration here in the 1980s. I’m not taking a stand for or against drilling, but I am taking a stand for rational behavior and using the scientific method to determine the most responsible methods for whatever does happen out there. Part of this requires us to have an excellent base map that is sufficient in accuracy and resolution to determine whether ice wedge polygons are high centered or low centered, or even the width and surface depth of the ice wedges themselves, for example so that ice roads can be planned properly. With such a base map in made in summer, I can also then make similar maps in winter, and by subtracting them I can measure snow depth, which is critically important to permitting exploration vehicles to drive over the tundra in winter without harming it. With such a base map in hand, we will be able to largely disentangle landscape change caused by climate from landscape change caused by human activity in the area. So I want to put these maps into the hands of all of the stakeholders by this fall so that the best possible plans and policies can be made, and through a combination of personal loans, private donations, and NGO contributions we’ve raised enough funding to acquire these data this summer to create this baseline map before any work begins there this winter.
However, not only can we use this map to make better plans, we can use this map to assess the efficacy of those plans as well as to keep people honest in sticking to those plans. By making this map again next year, we will literally be able to see every tire track, and possibly even every footprint, that is left behind by oil exploration activities over this next winter. Thus even if these impacts were made when following the established protocols, we will then know that we have to modify those protocols. And if they were caused by violating those protocols, we will be able to determine that too. Perhaps most importantly along those lines, however is that as humans we all behave differently when we know someone is watching us, else there would be no market for radar detectors or even police. So another important part of my goal in making this map is to simply demonstrate that I can make this map, and by inference that I can make this map again, and again, and again, such that any violations of protocol — down to the level of footprints, tire tracks, and candy wrappers — will be found.
Along those lines, it is important to me and those that are funding my acquisitions this summer that all stakeholders know that we do not need to rely on government or industry to make these maps — the upper level connection between politics and industry has become way too cozy for any rational person to believe that either group will serve as an adequate watchdog over major efforts like this, despite the intentions and sincerity of those in the lower levels of those organizations. So while we hope to secure some additional government and industry funding for this work, our goal is also to raise money privately through crowd-funding. The purpose here is certainly to raise some money, but perhaps more importantly it is to demonstrate support for protection of this area: the virtual equivalent of a million man march for those who will never be able to visit this area personally. So beginning on October 2nd (10/02), after the data are fully acquired and processed, I hope to open a crowd-funding campaign to solicit donations of $10.02 from as many people as possible. It is perhaps preposterously naive or ambitious, but I’m hoping for participation of tens to hundreds of thousands, so that we can raise enough money to repeat these maps again next year and for years afterwards and build a village of interested volunteers to analyze the data and contribute to the discussion. If it works, I believe a demonstration of public support like this will send a loud and clear message to all stakeholders that the Public will not allow the largest untouched wilderness in the country, the Arctic National Wildlife Refuge, to be handled with anything but the utmost concern and respect by those who would develop it. That is, we want Big Brother and Big Oil to know that Little Brother is watching. So consider this blog the first call for mobilizing Little Brother to build such a village and lead such a march — I have no experience at this and my hands will be full with the mapping efforts, so I’m asking any heros that can help organize that part of the effort to contact me now so that we will be ready by 02 October 2018.
Here we are in the 1002 area in 2006, hiking into McCall Glacier. Everything within this view, including where we are sitting, could be covered with oil rigs and roads in the next few years. Even minor disturbance to this frozen ground caused by tire tracks can cause damage that lasts centuries, especially when exacerbated by climate change in the area which is causing the permafrost to warm and be even more susceptible to irreversible damage. Documenting the shape of the landscape this summer, at level of measuring tire tracks topographically, is therefore an essential component of responsible development here. Click here to see the image in 3D.