Detecting Tire Tracks in the 1002 Area with Fodar
Last Sunday (24 June 2018), on my first day of creating the best topographic map ever made of the 1002 Area of the Arctic National Wildlife Refuge, I was fortunate to find that seismic exploration this past winter had reached the Refuge boundary from the oil fields to the west. I consider this fortunate because it is the potential damage caused by the tire tracks from such seismic exploration that is motivating me to make this map this summer. So here I had the opportunity to be the first person to measure and assess this damage on a wide scale at such high resolution and accuracy: not only demonstrating that I have the capability to measure these impacts but that these impacts exist and are a potential threat to the values that motivated the formation of this Refuge. You can see what these tracks look like a month later here, and learn more about my map of the 1002 Area here and here.
My goal in making this new map is not to take a stand for or against the oil exploration and drilling that Congress recently approved, but rather to make the best contribution I can towards ensuring that whatever happens out here is done as sanely and responsibly as possible. I have been making the best topographic maps of Alaska ever made for years now and have been the only physical scientist running a long-term field program in this area for the past 15 years, so the combination of this skill with this experience puts me in a unique position to make this contribution. My biggest concern about proposed operations out here is seismic exploration. This exploration uses trains of large vehicles operating on a grid pattern over the land. This work is done in winter on top of the snow cover to minimize damage to the fragile tundra and the permafrost below — but is that mitigation enough to prevent all long term impacts?
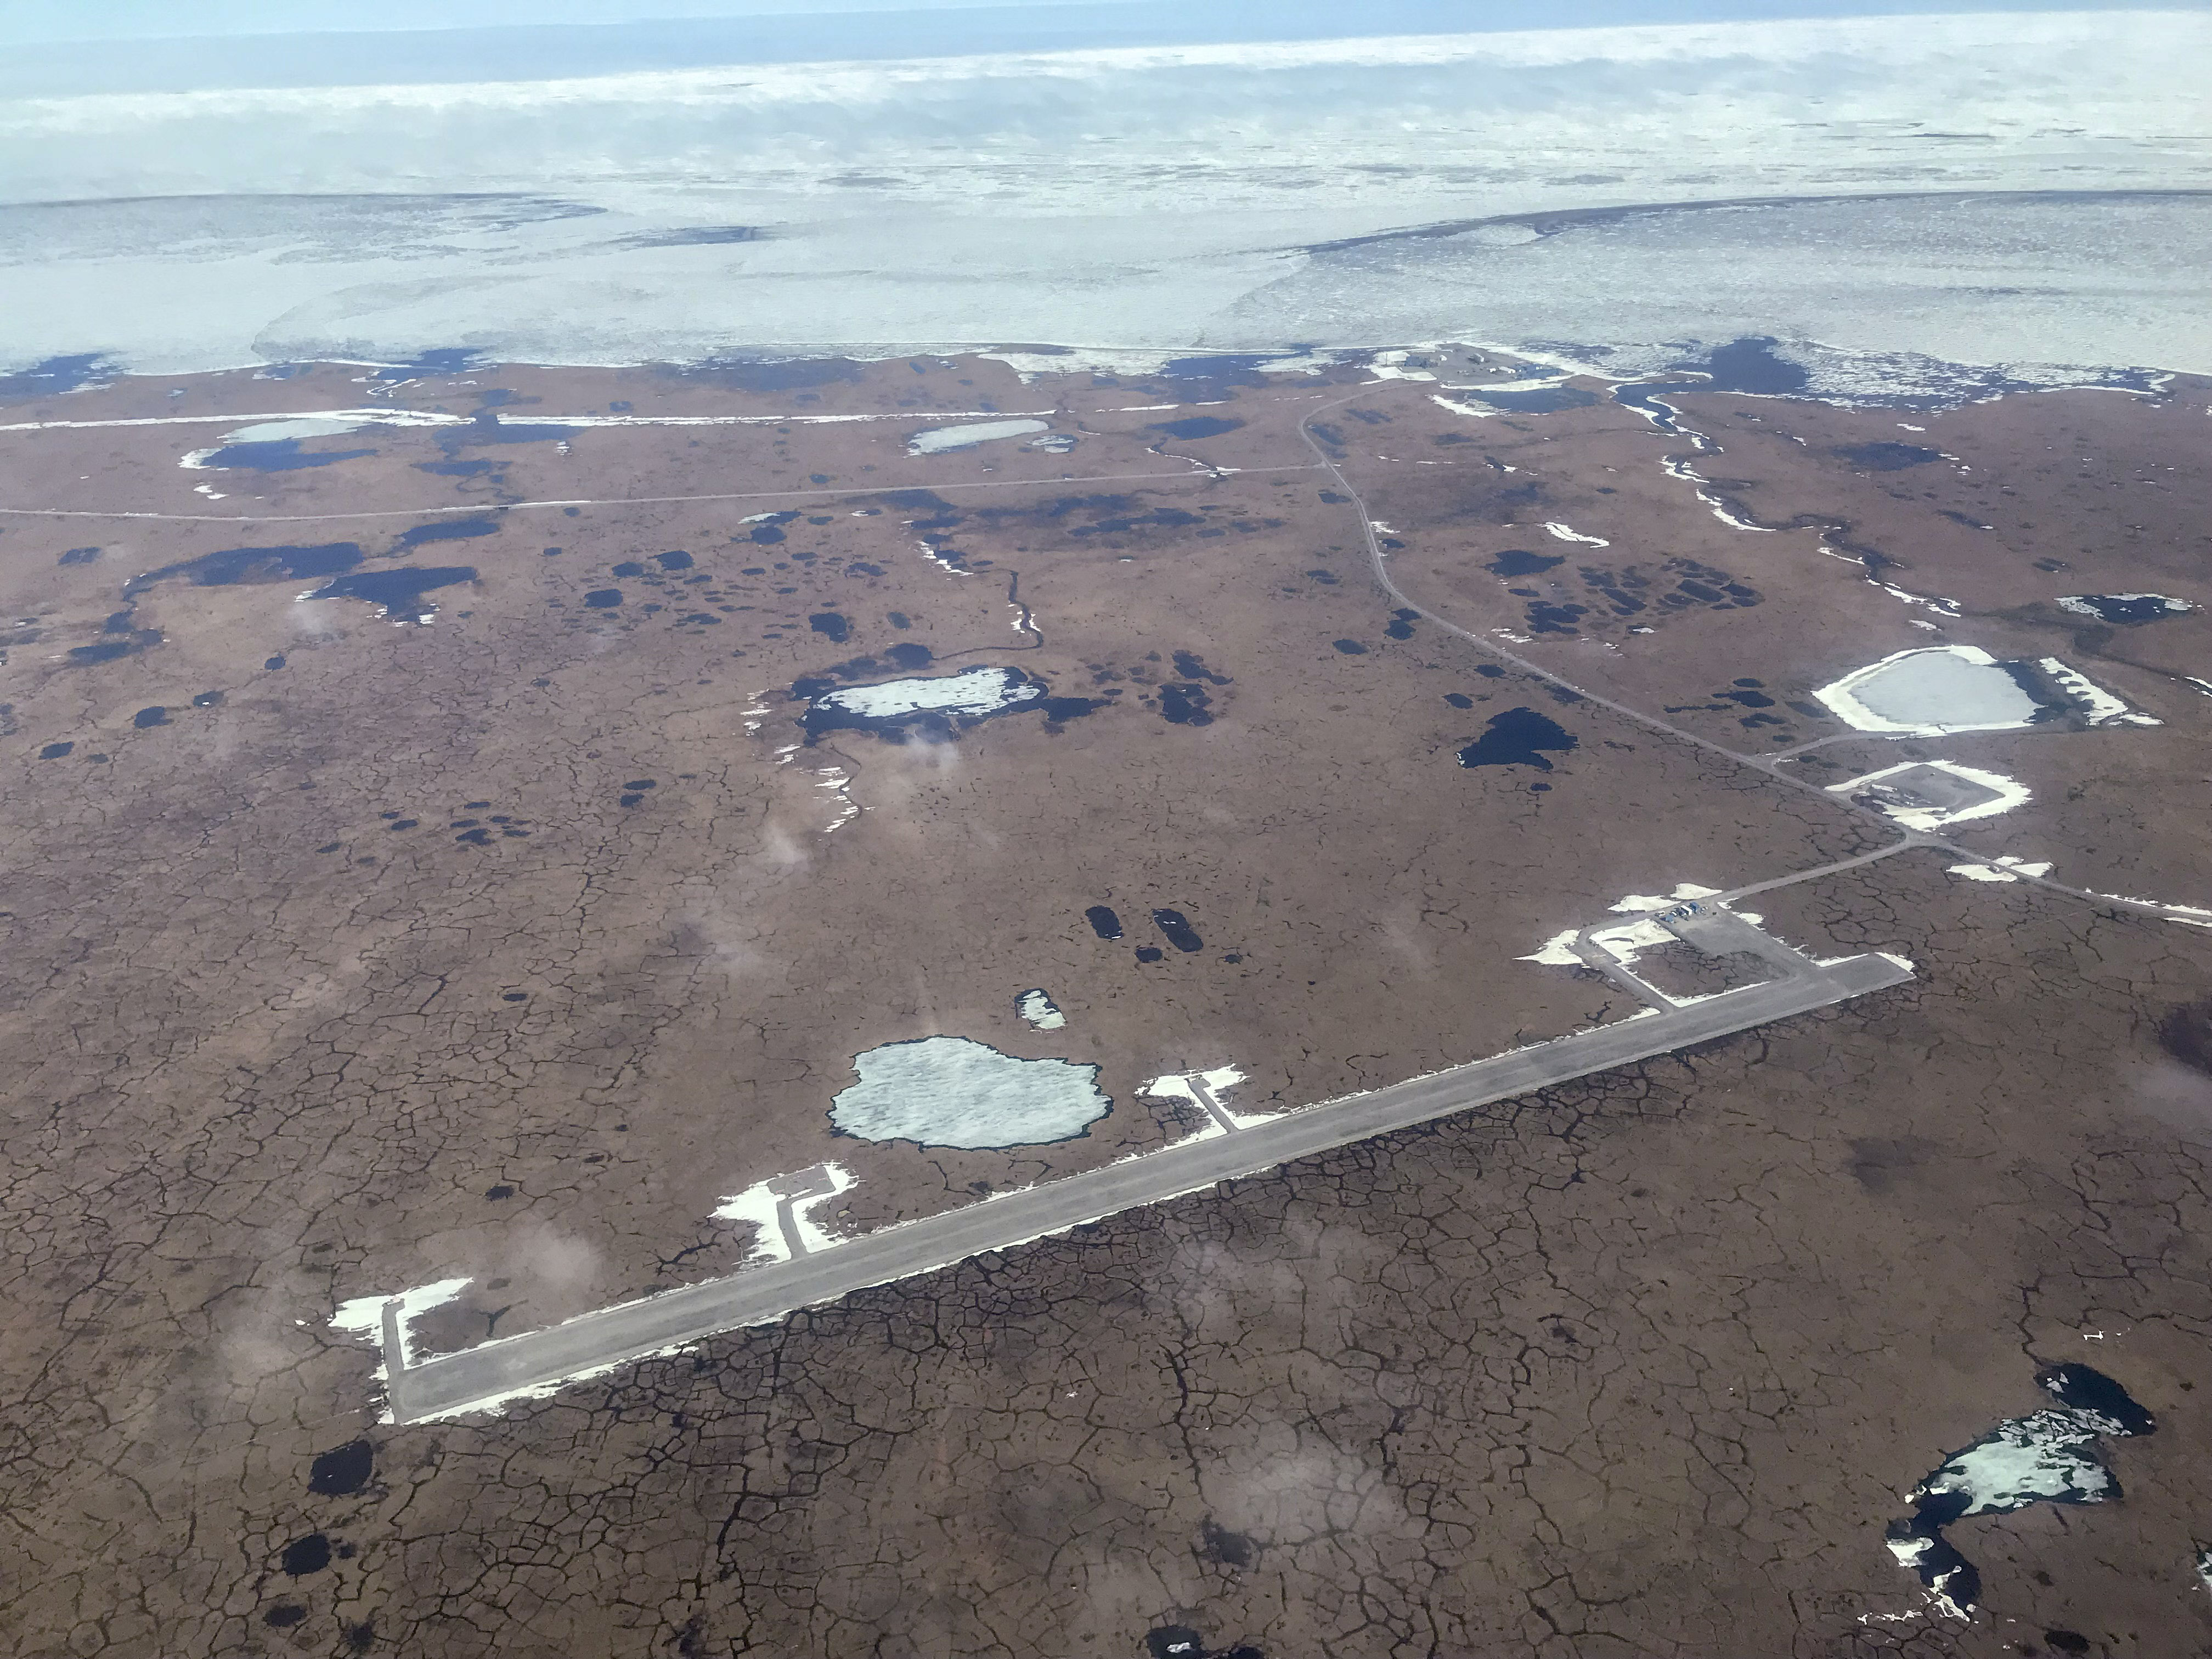 When most people think about the impacts of oil drilling in the 1002 Area, I think they are mostly thinking things like this runway and oil drilling pad at Pt Thompson, about 10 miles from the Refuge boundary. Whether you consider this an eyesore or not, it is nonetheless fairly tidy — the ‘impact’ is largely isolated to the gravel roads and airfields, and they do keep a tight leash on the workers there in terms of trash, vehicle oil spills, animal interactions, etc. And because it’s so bloody expensive to work up here, I think we can trust that there is a strong economic motivation within the oil companies to limit the amount of such infrastructure. So while clearly this gravel infrastructure has an impact visually and ecologically, I think those impacts are pretty obvious and something we can fairly easily decide as being acceptable or not.
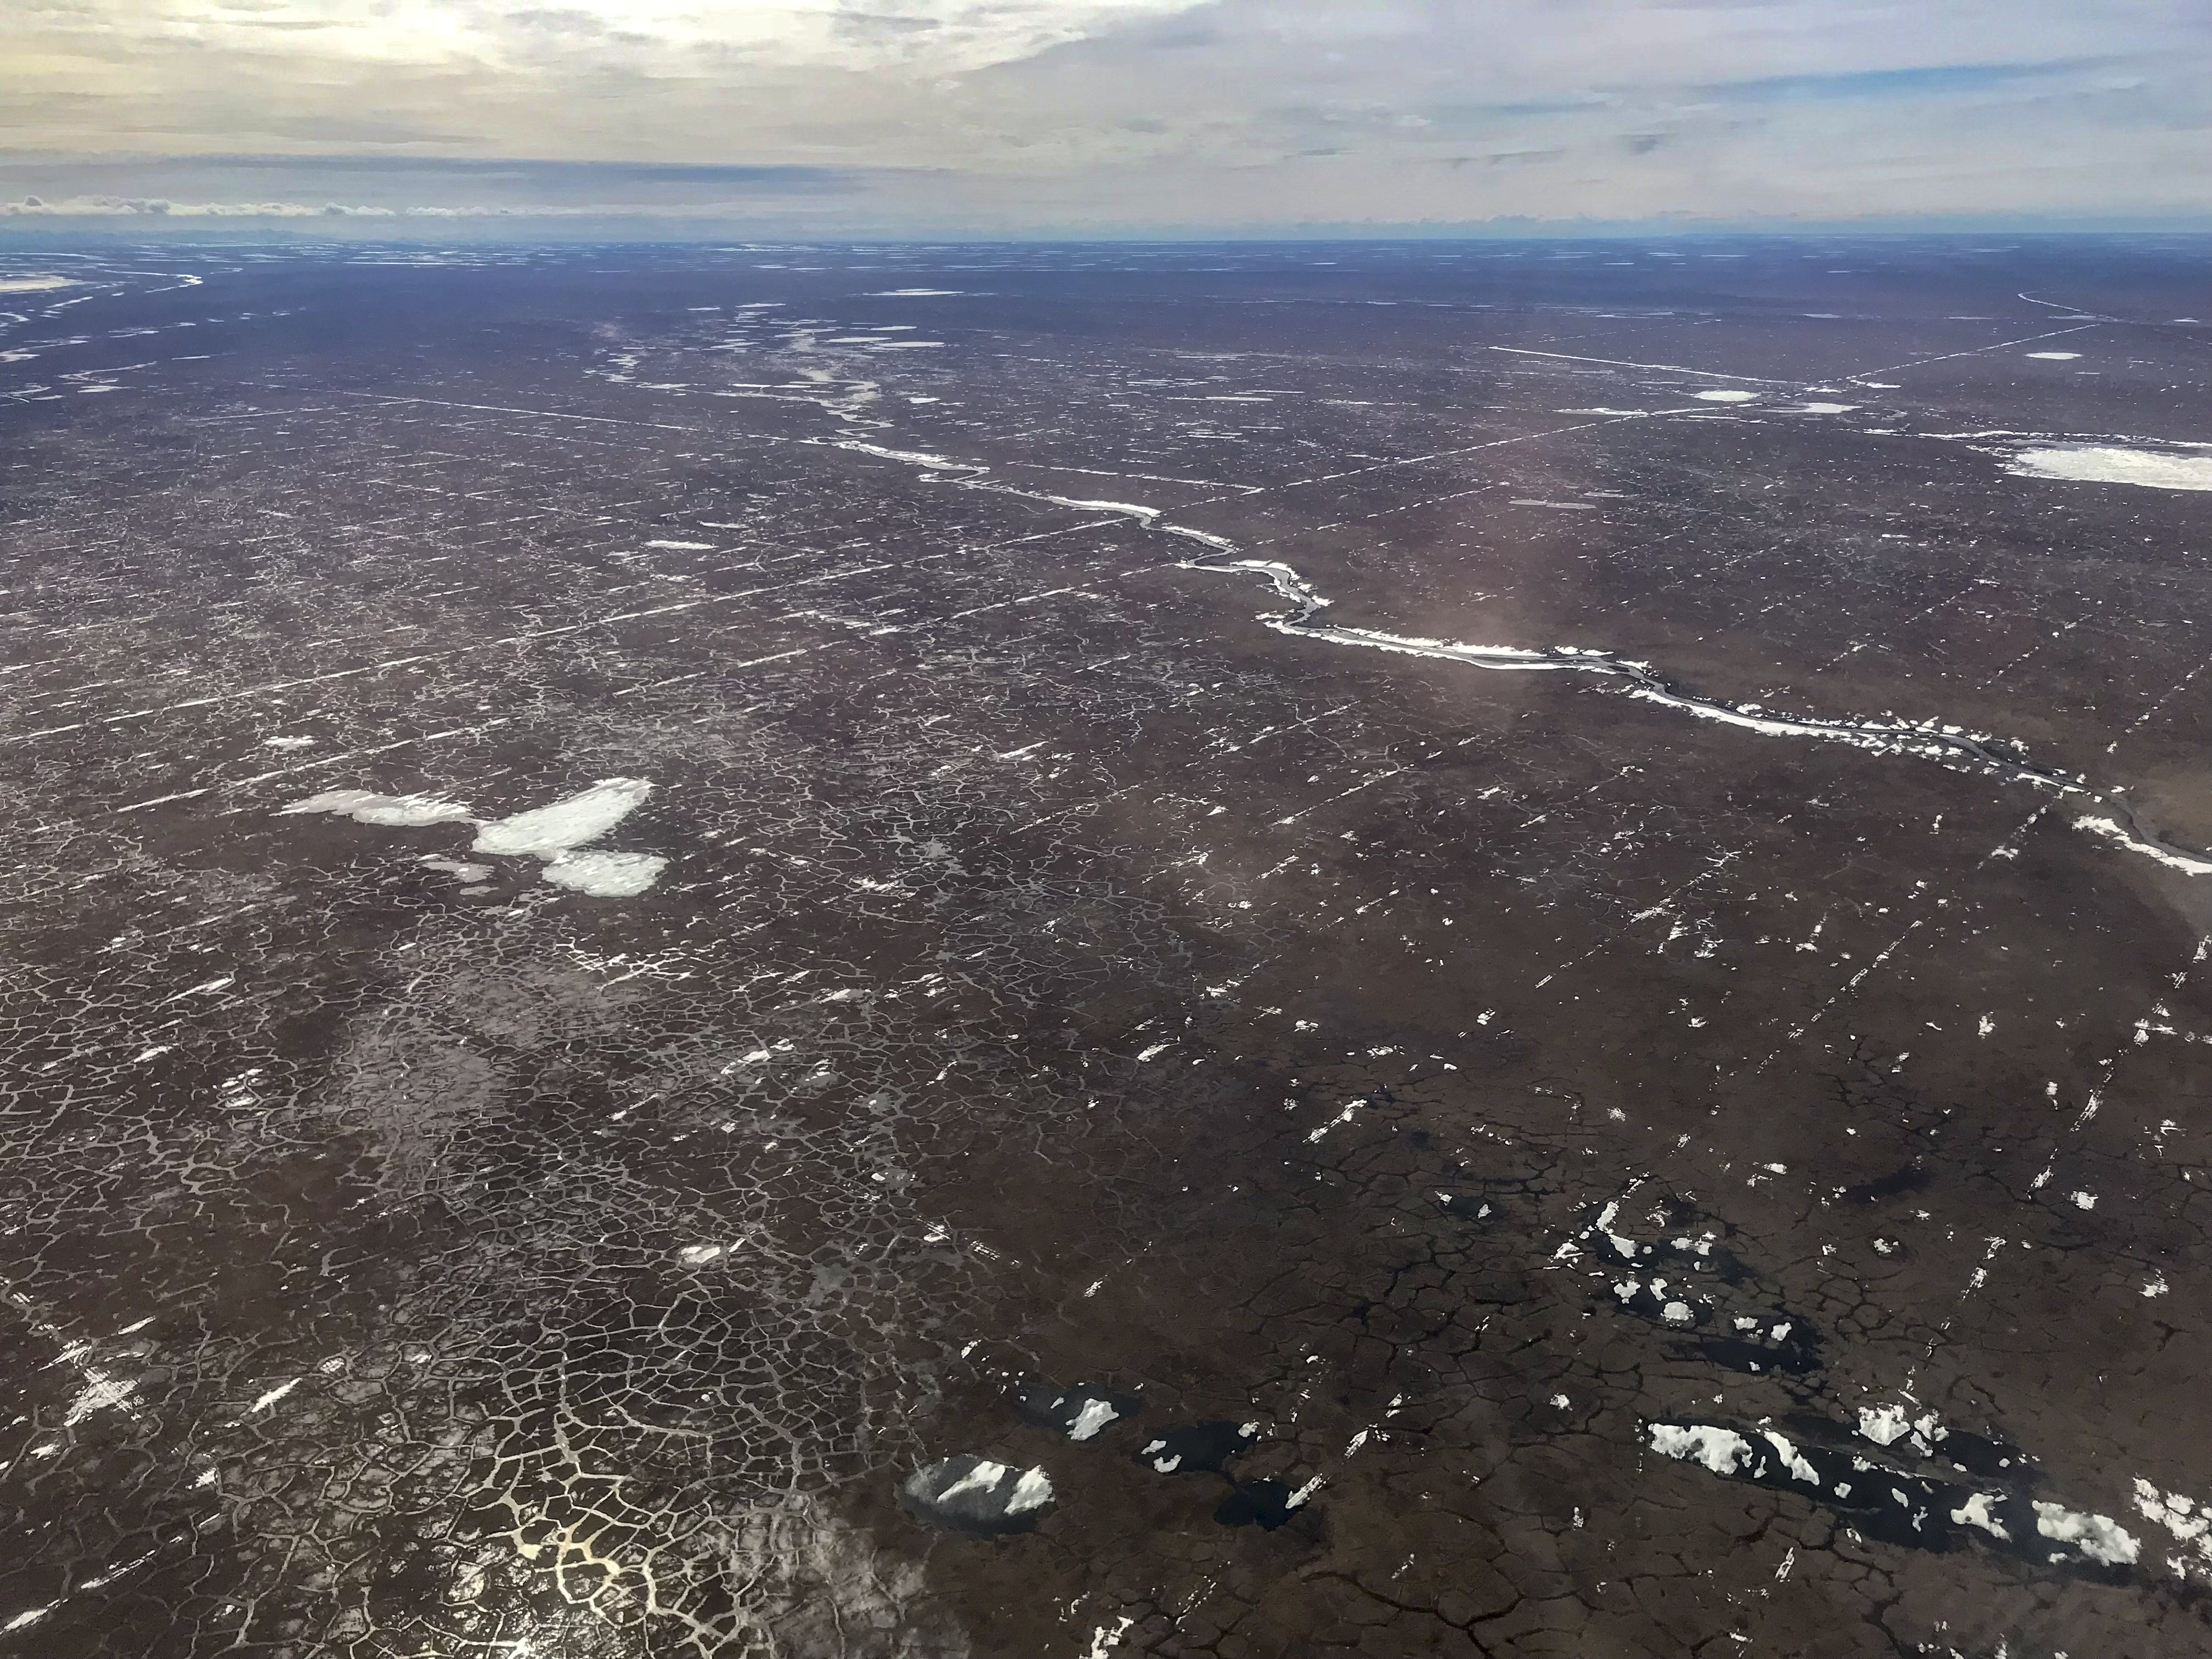
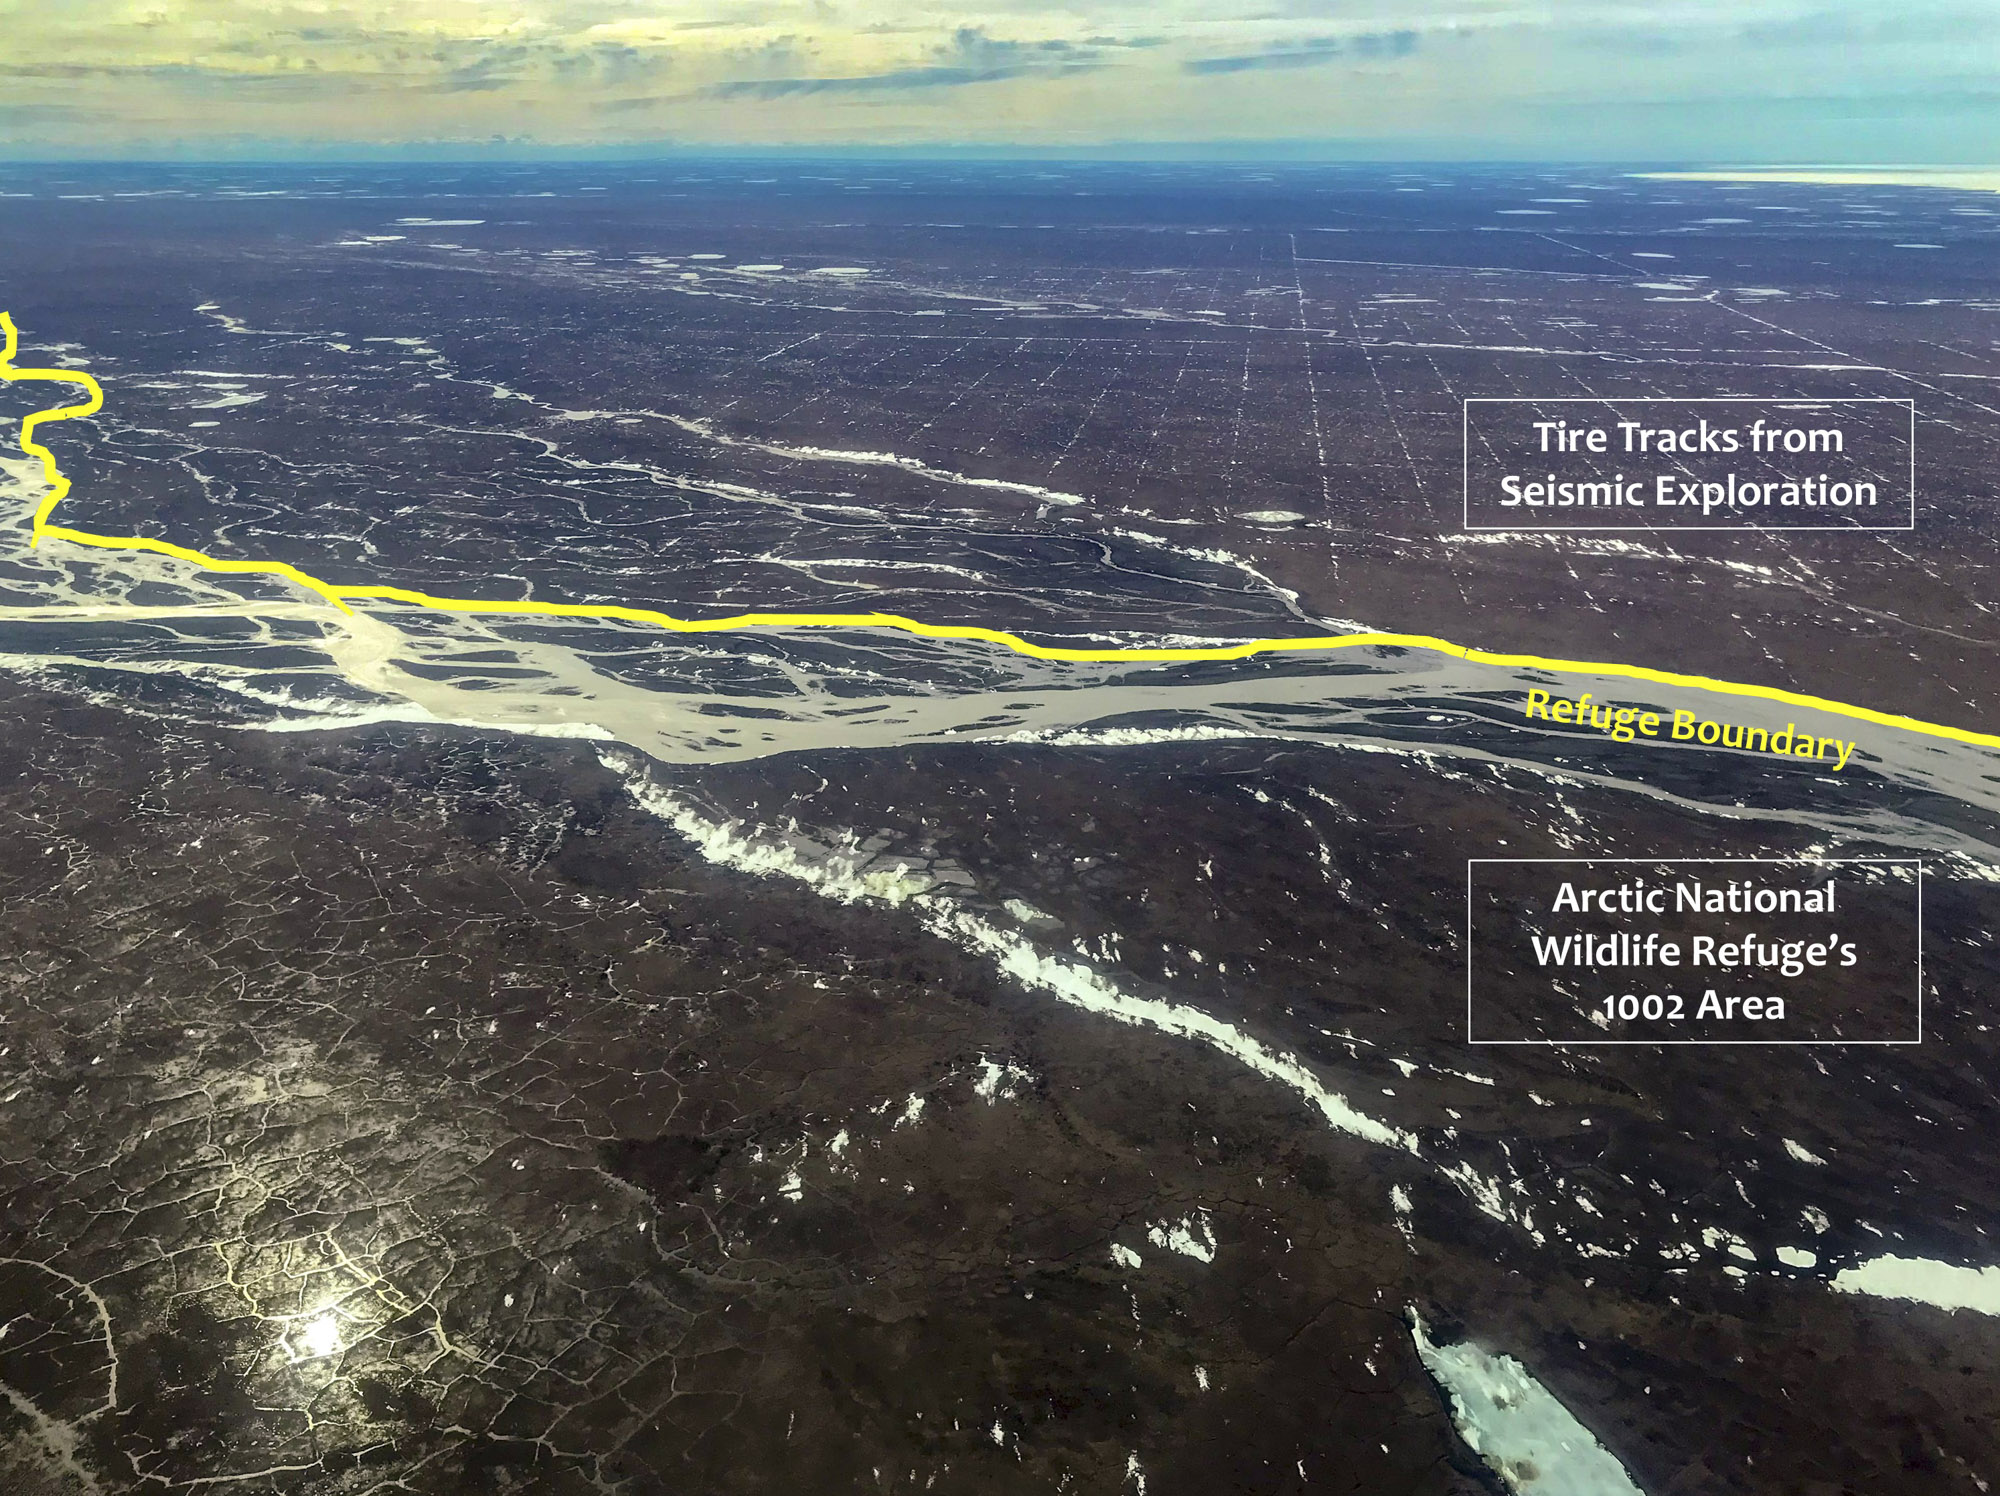 When I think about the potential impacts of oil exploration in the oil fields, it’s this checkerboard that’s on my mind: these are the impacts of the seismic exploration that controls where the gravel infrastructure is placed. I took this photo a few days ago. Running across the middle of the frame is the Canning River, which defines the western boundary of the Arctic National Wildlife Refuge. Above it, to the west, you can clearly see the grid lines left behind by the seismic vehicles used to map the oil field below the surface. They ran those lines literally to within feet of the boundary (the Canning River). In the foreground is the 1002 Area of the Arctic Refuge. To me, the most important question all stakeholders should be addressing right now is: Is the impact of such seismic exploration in the Arctic National Wildlife Refuge acceptable? Considering that such exploration is due to start this winter, we don’t have a lot of time to address that question, which is why I’m making this map now.
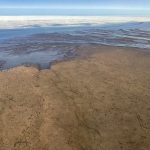
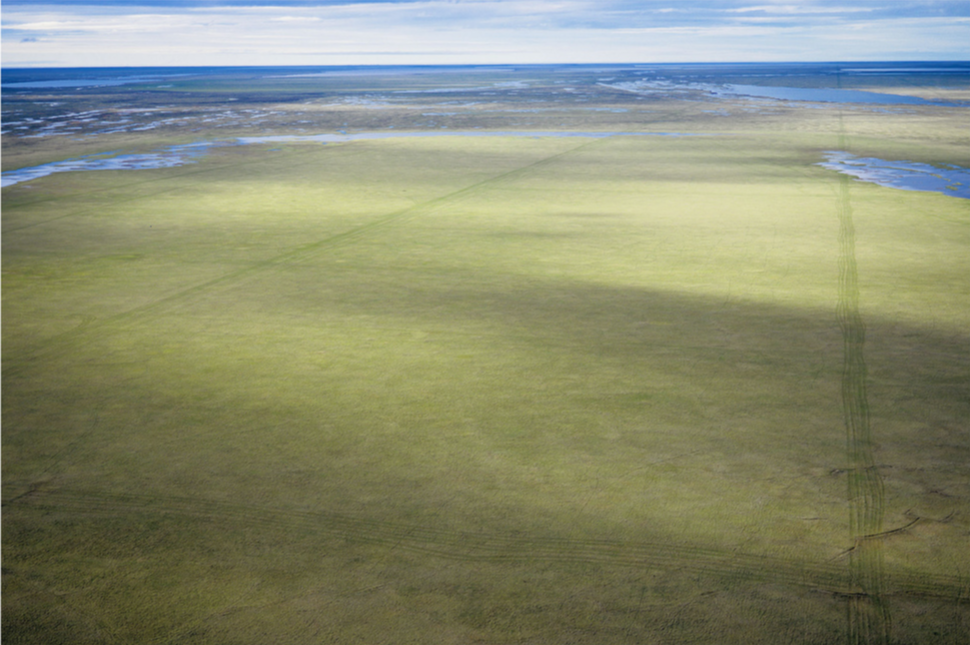
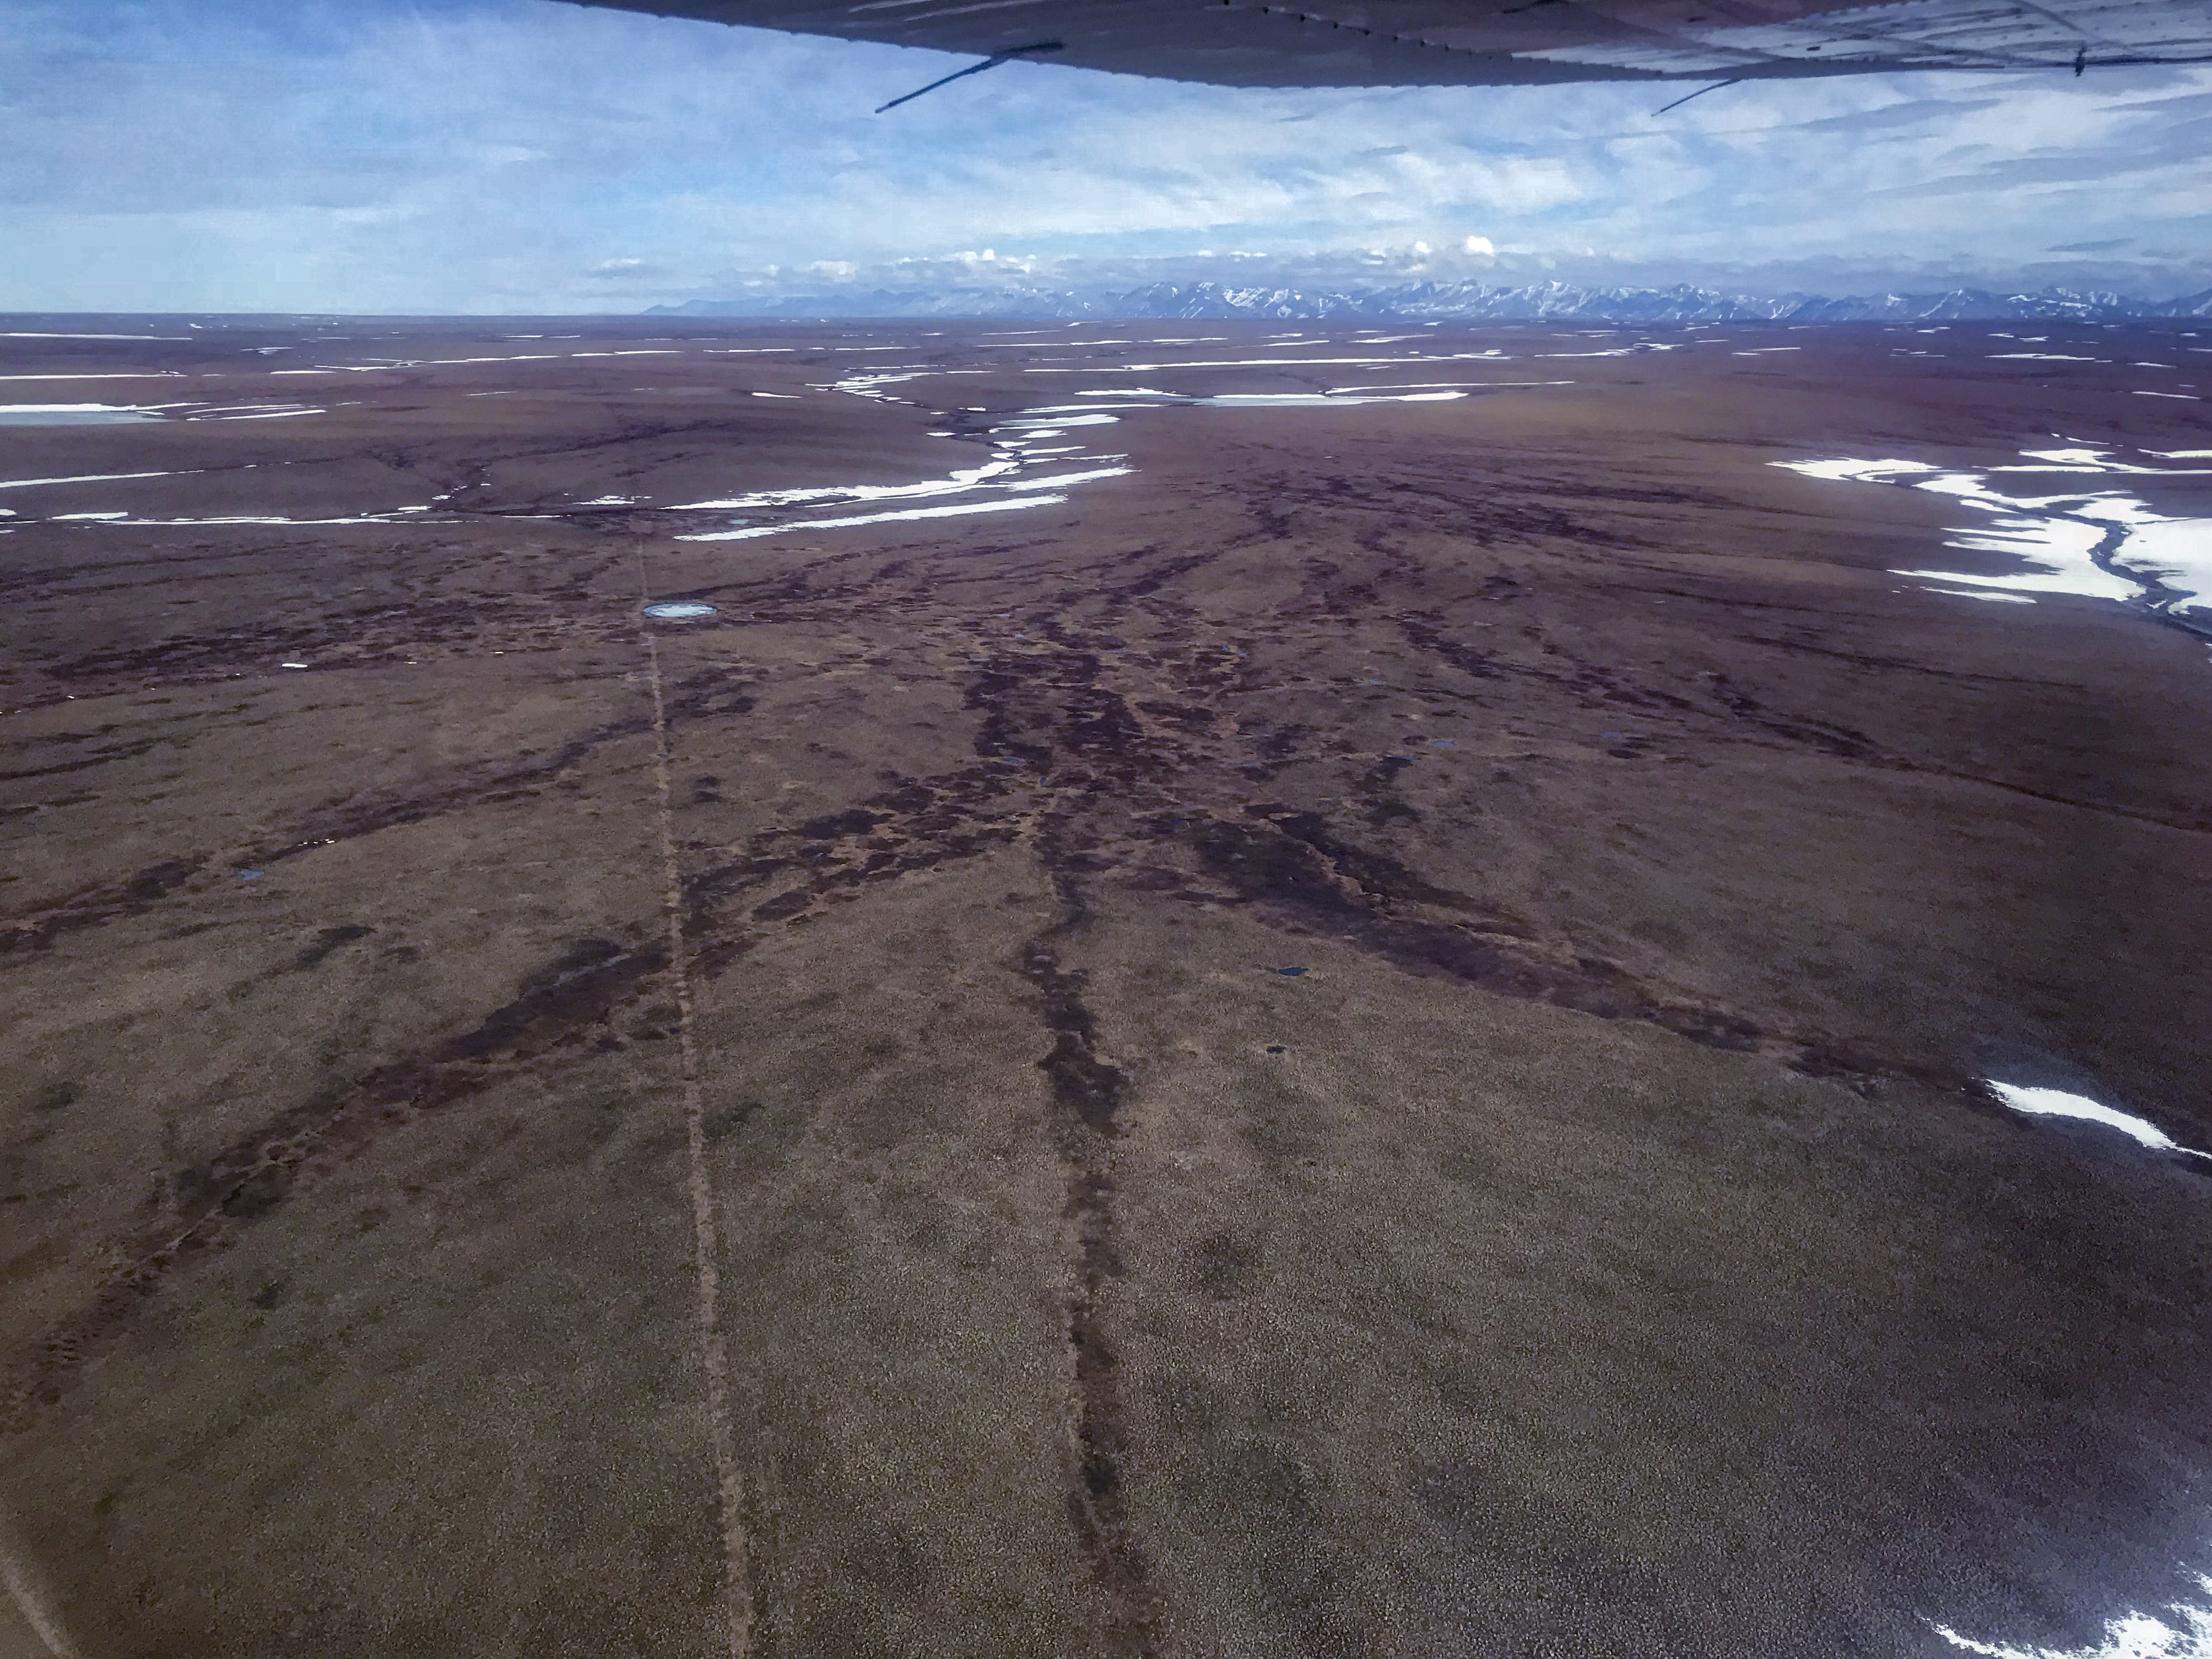
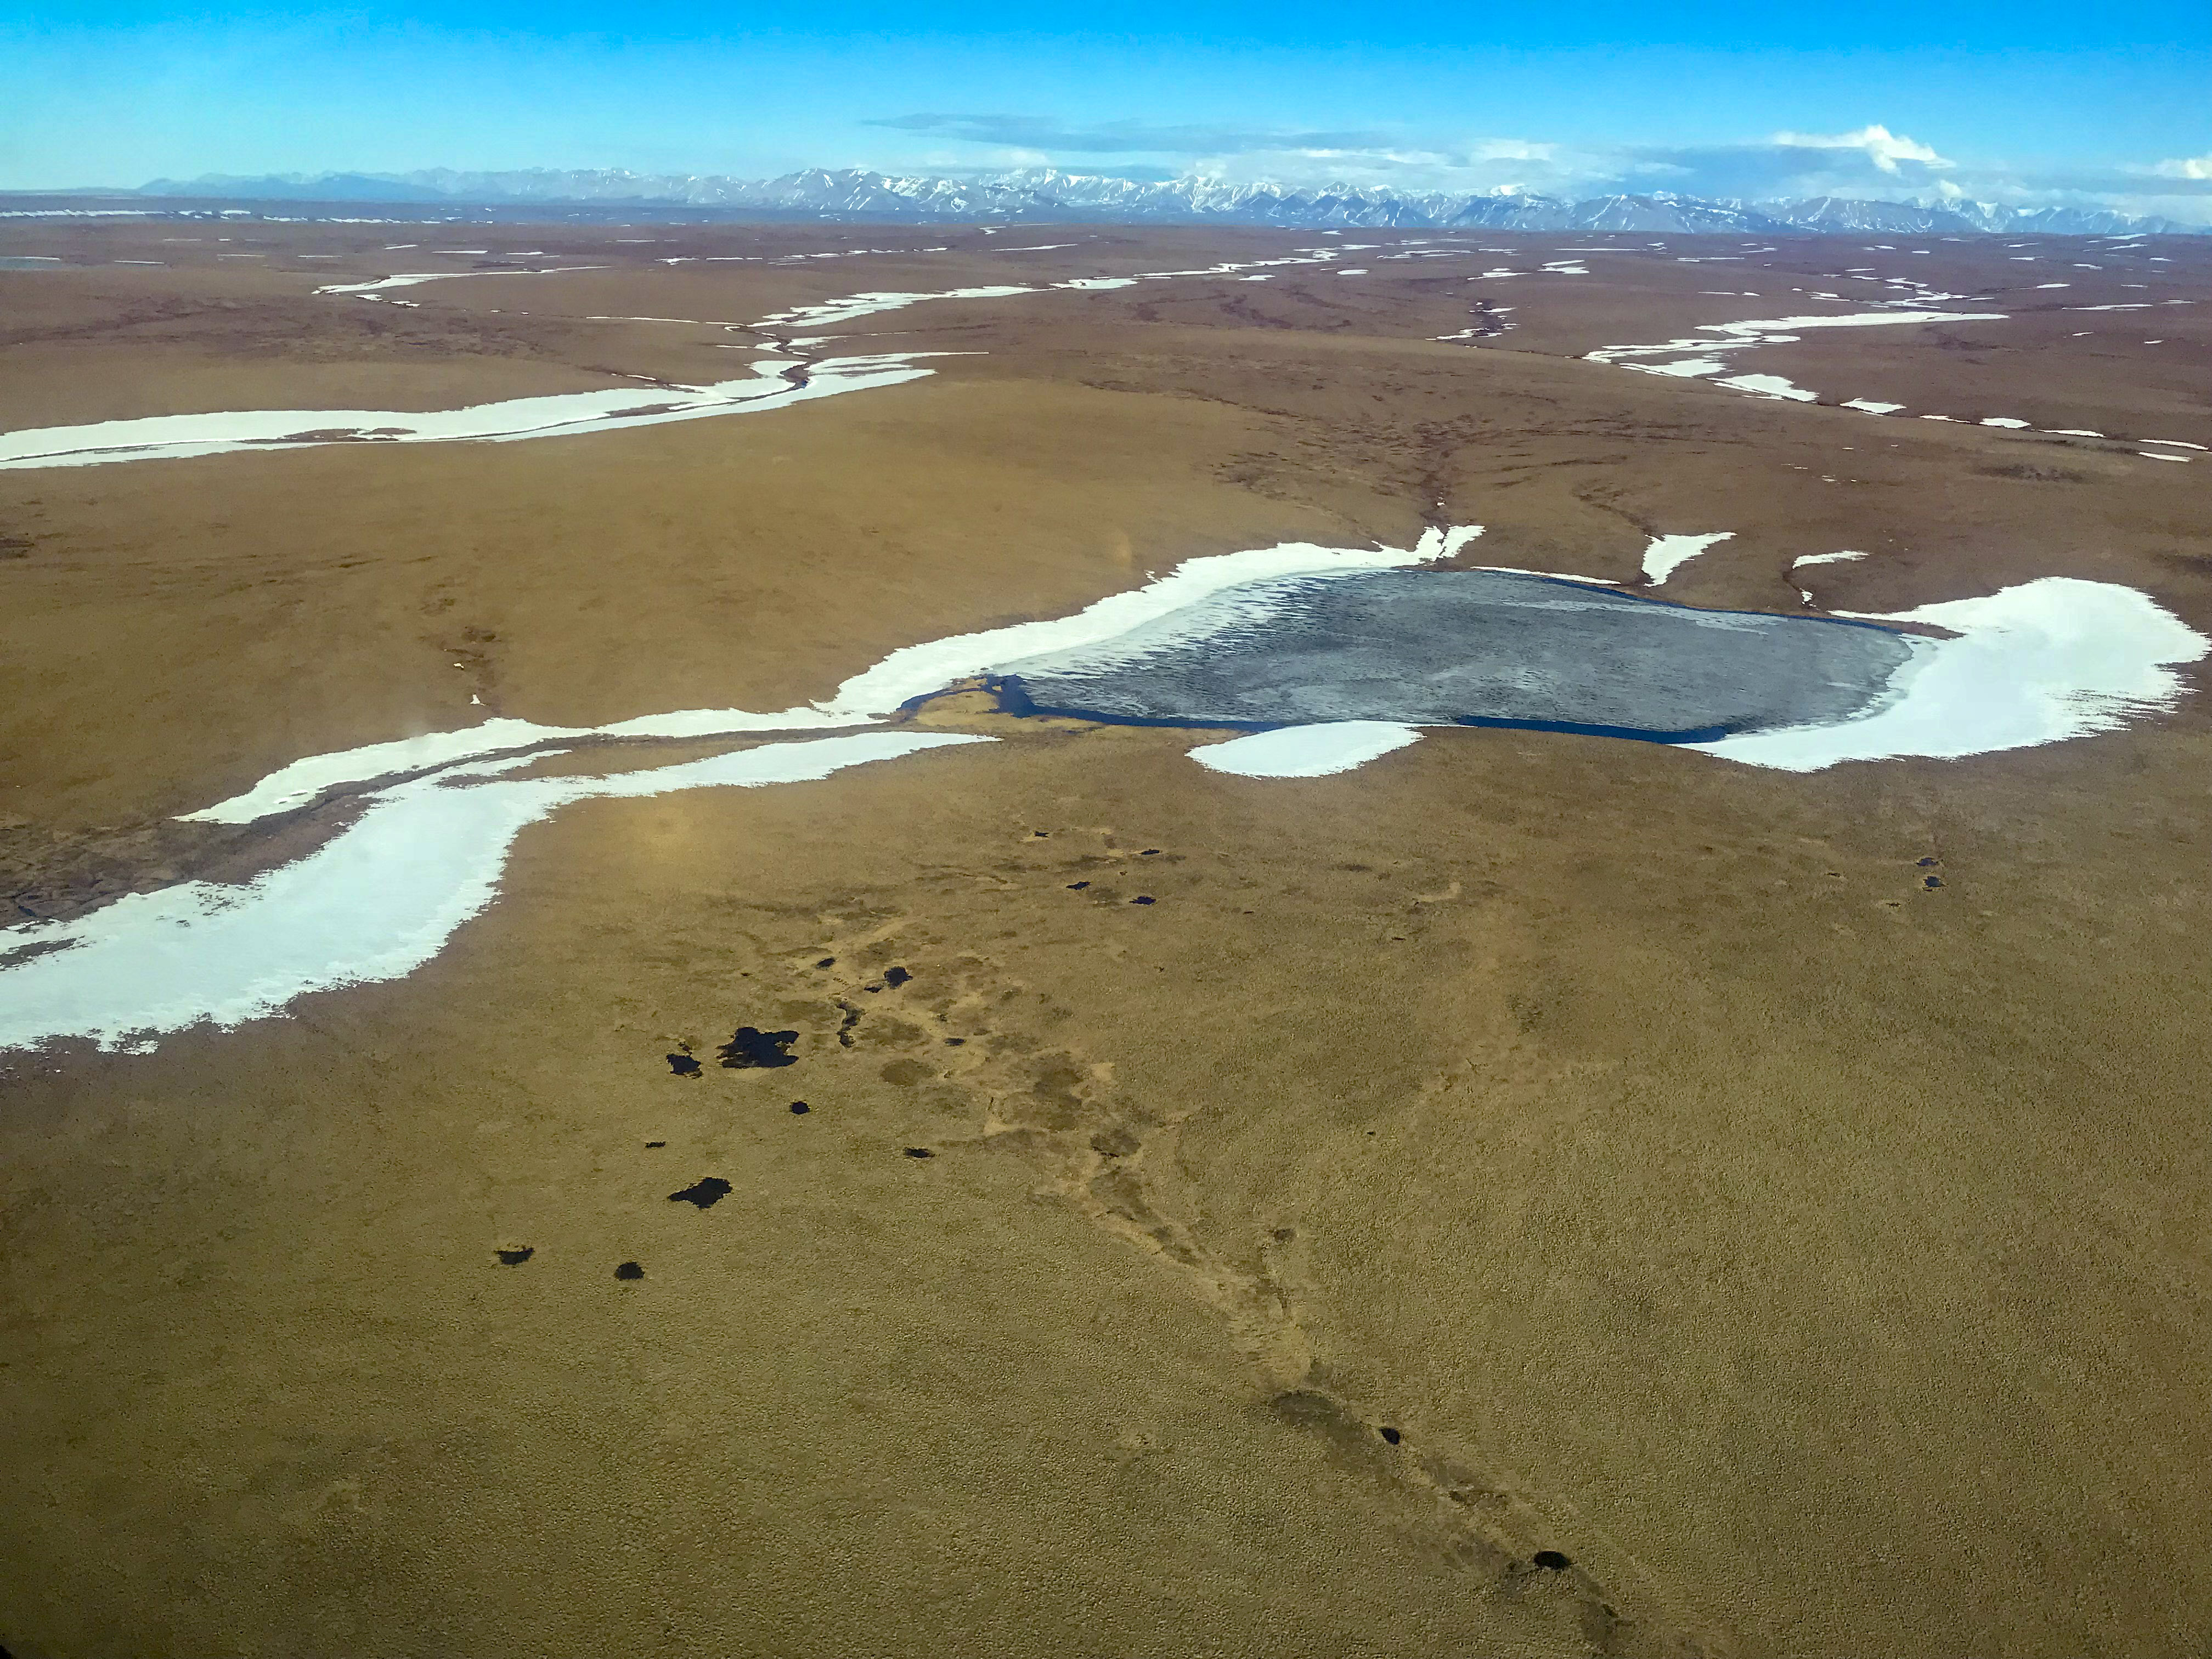
 Here are some of those seismic lines a few days later, after the snow melted. Even without snow on them, they are still visible. Is this an acceptable impact? That’s a question for the stakeholders to answer. In the meantime, my goal is to make the measurements needed to answer the questions: Why are these tracks still visible? How will they affect the form and function of the tundra ecosystems in the 1002 Area? The intersection of these questions is: How can we improve methods of seismic exploration so that there is truly no impact? That is, with my maps, we can test the efficacy of new seismic methods towards that goal.
Anyone that’s flown over the oil fields to the west can clearly see the grid pattern used by the seismic vehicles from years ago, so clearly there is some impact. Here is a great article that gives an overview of some of those impacts and how it may relate to the 1002 Area. But exactly what is that impact and should we be concerned about it? Though I am a physical scientist specializing in Arctic landscape change, I’ve never actually studied these questions before, but I’m pretty sure that the impact of these lines has never been measure topographically in the Arctic because no one else but me has the capability to do that. My suspicion is that the reason that these grid lines are visible for years and perhaps decades afterwards is because the weight of the vehicle does cause a topographic depression in the spongy tundra (as shown above), as well as compressing and sintering the snow beneath the tires. The compressed snow takes longer to melt in summer, insulating the ground, and causing a change in the surface energy balance. The combination of these impacts leads to the ground beneath the grid lines to be slightly soggier, which leads to different vegetation growing there or greening up sooner or later, and it is this change in color that catches our eye and makes the old trails visible years later. So along the most of the trails, there may no longer be a topographic expression of the actual tire tracks, but even briefly creating those tracks, whether by smushing the tundra or compacting the winter snow the year they were made, apparently does have a lasting impact that is visible for years or decades afterwards. So one question the stakeholders in the process (which nominally includes the general public) needs to answer is: Are we OK with seeing a checkerboard grid of 200 m by 400 m trails over this wilderness for years or decades to come?
Though it’s summer, the checkerboard tire tracks from seismic work done in winter is clearly visible in this image from the oil fields further west (taken by Subankar Banerjee in 2006). Are we OK with the 1002 area looking like this next summer? Is the ecological system going to be affected?
In addition to the aesthetic values, there is also potential for these seismic grids to impact the physical form and function of this tundra ecosystem. This region of the Arctic coastal plain is different than the coastal plain further west because it is much steeper — the mountains come much closer to the coast here, so the hydraulic gradient is larger. This means there is more energy available for water to make new stream channels, utilizing any topographic lows for that purpose, such as those caused by tire tracks. This tundra is already intersected by thousands, perhaps millions, of ice wedge polygons typical of permafrost terrain. The tops of those ice wedges are often lower than the tundra, and when they intersect with each other and with any source of flowing water, small streams can develop on top of them. At some point this flow becomes vigorous enough to begin to physically eroding the ice in those wedges, causing the stream channel itself to deepen itself by meters, thereby capturing even more flow in an accelerating process, which is already accelerated because the terrain is steeper. If this new stream intersects a shallow tundra pond, that lake can be drained by this new river in a matter of hours or days. Disturbances like these, the formation of a new stream channel and the creation of dry land, then can lead the permafrost below to change temperature and the vegetation above to change in character or composition and thus change the habitat for wildlife. For example, willows love to grow in recently disturbed areas, such as the banks of new stream channels -> Rabbits, ptarmigan, beavers, and moose like to eat willows -> Wolves and bears like to eat those herbivores. Thus more stream channels means more willows which means more new animal species which means the existing species, like caribou, have more competition for resources and survival. These impacts take years to decades to unfold, but what seems like innocuous tire tracks may not be as innocuous as some like to believe.
So that’s my motivation behind making this map of the 1002 Area of the Arctic National Wildlife Refuge. And after six months of planning and mortgaging everything of value that I own to afford to make it, I finally began making that map last week! Hopefully once it’s made, someone will find it valuable enough to buy…
The 1002 Area is about 6000 km2. I decided to map it at about 5″ resolution as a compromise between time, money and resolution. At this resolution, it will take me about 100 hours of flying. That’s about $20,000 in fuel alone in the Arctic. I could do the whole thing at 2″ resolution, but that would take 3 times more flying and probably 10 times the cost. I could do it at 15″ resolution, but that’s really not enough resolution to capture the processes of interest. So 5″ ground sample distance (GSD) seemed like a good optimization, and as I show here it is sufficient to see tire tracks. But even at 5″ GSD, the 10 full days of flying required may take 2 months to find given the weather, airplane issues, etc. So my plan is to give myself the whole summer to complete this.
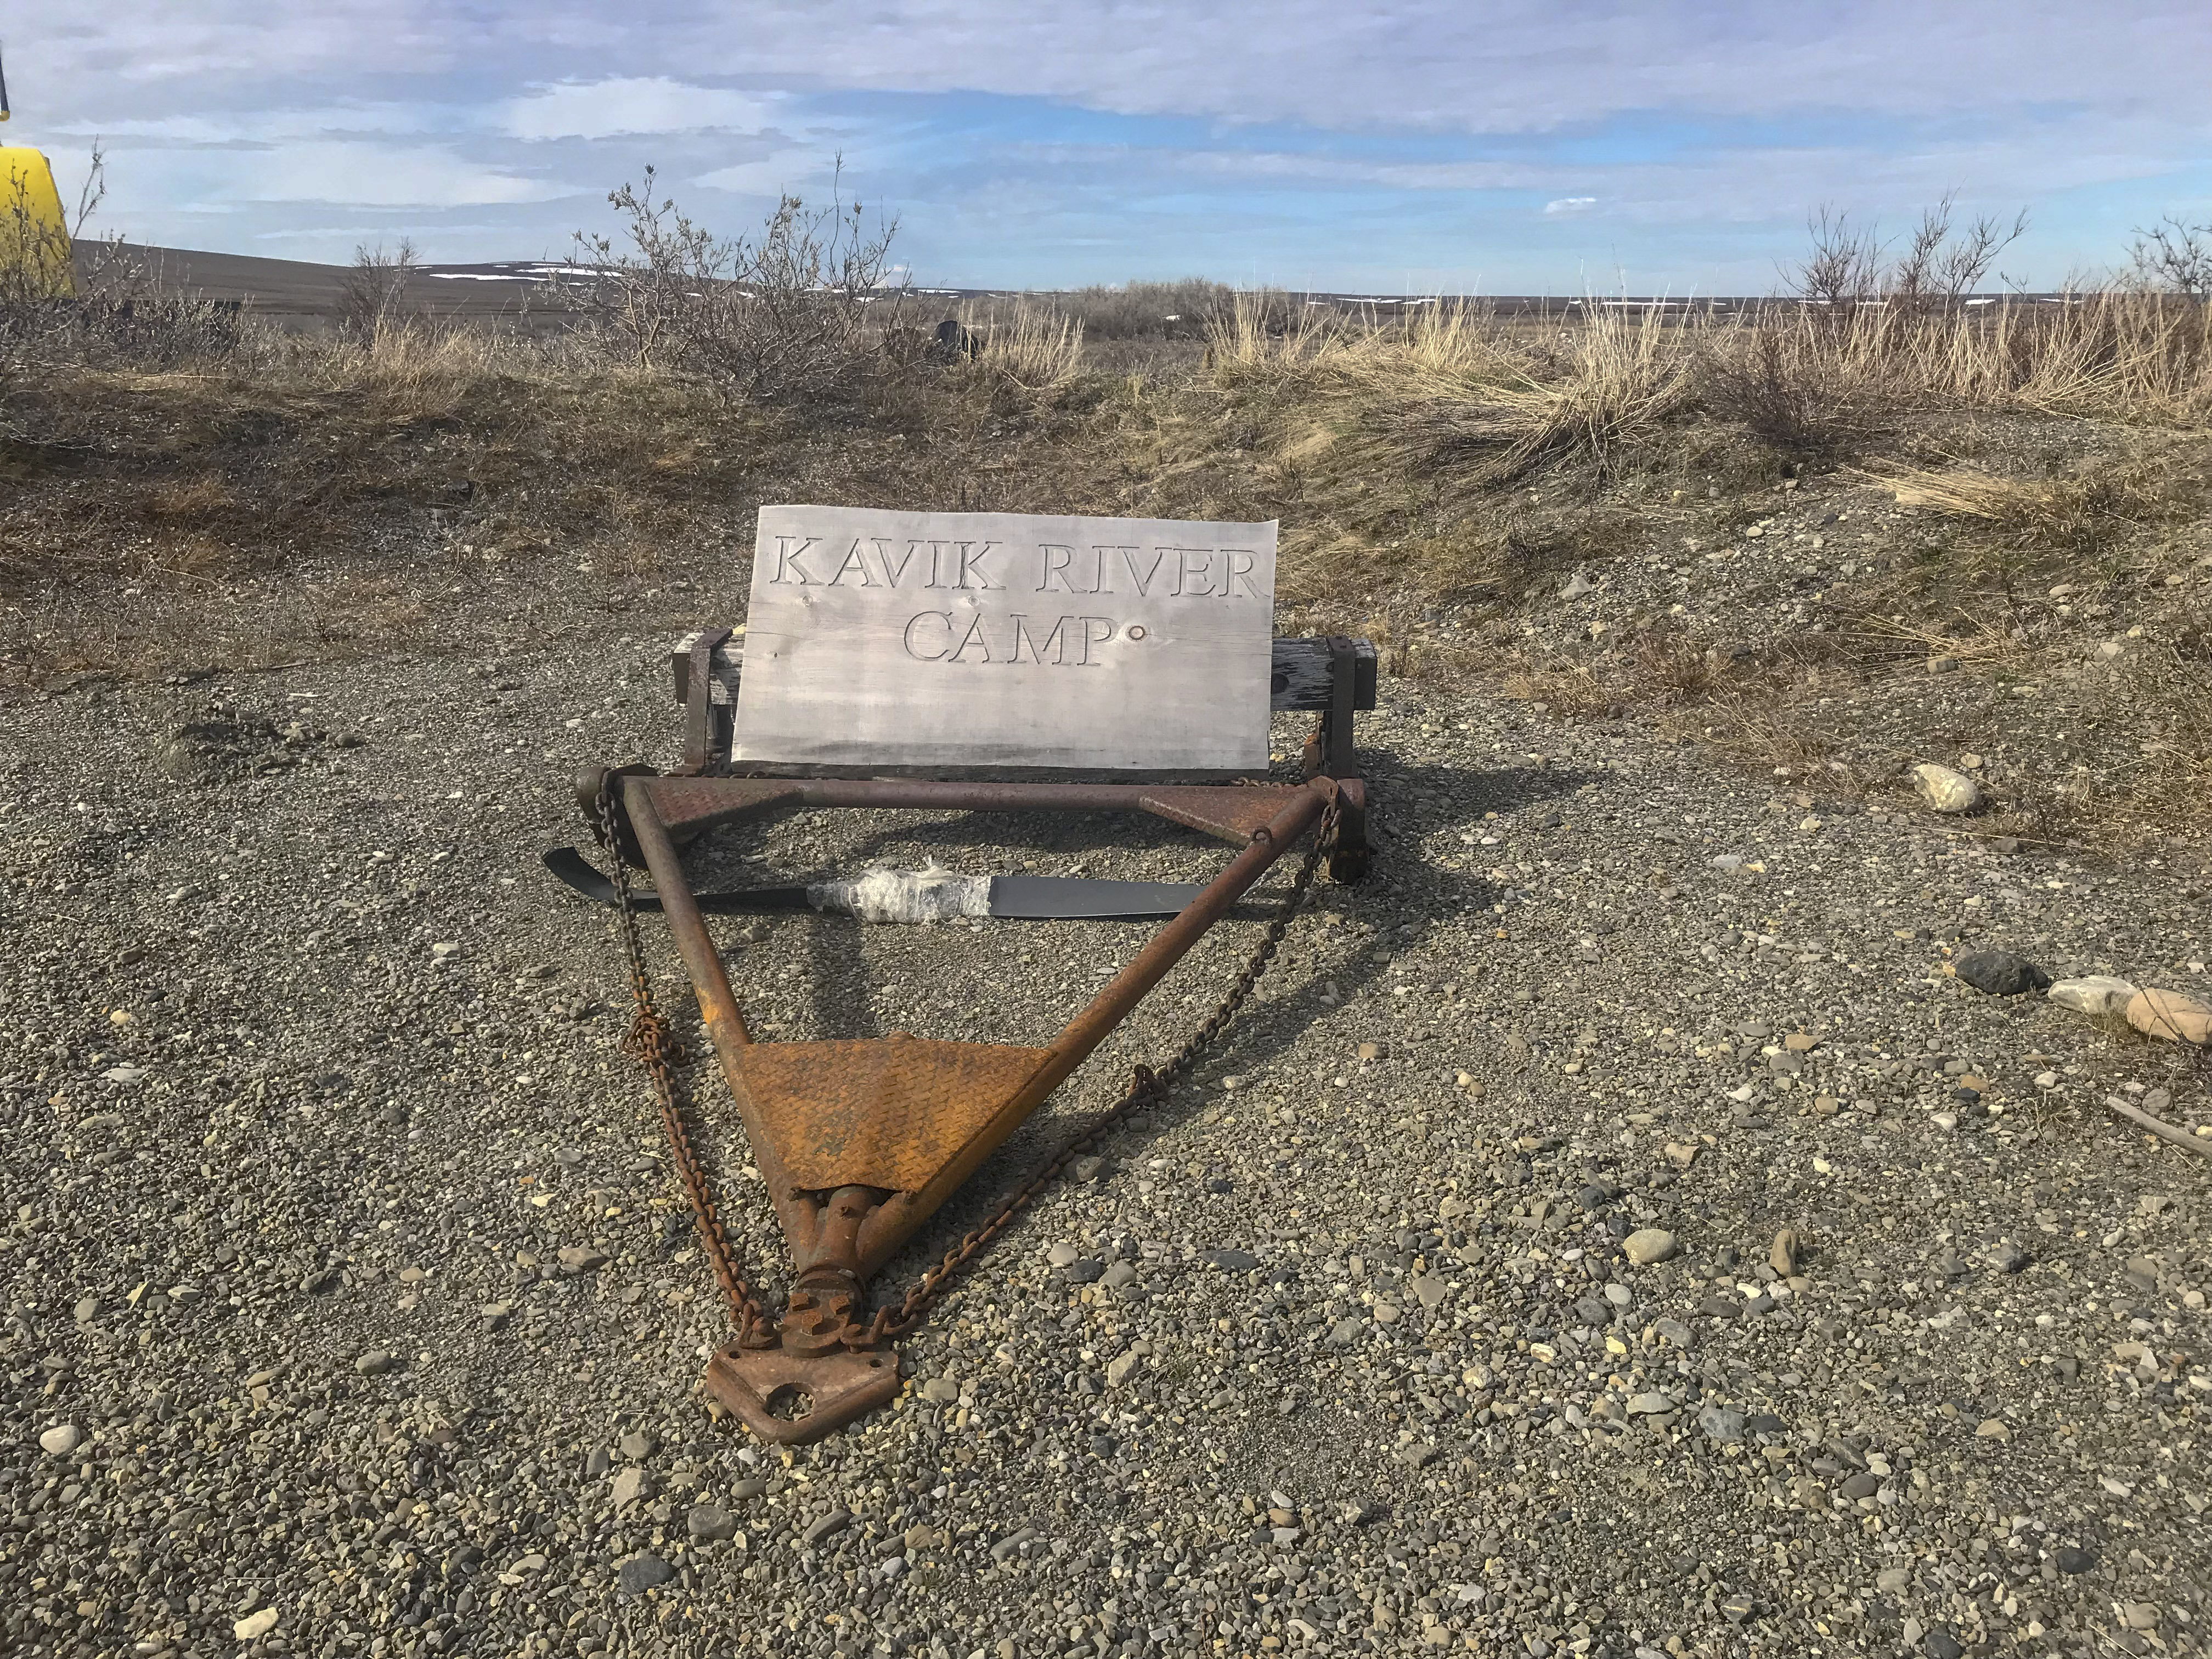
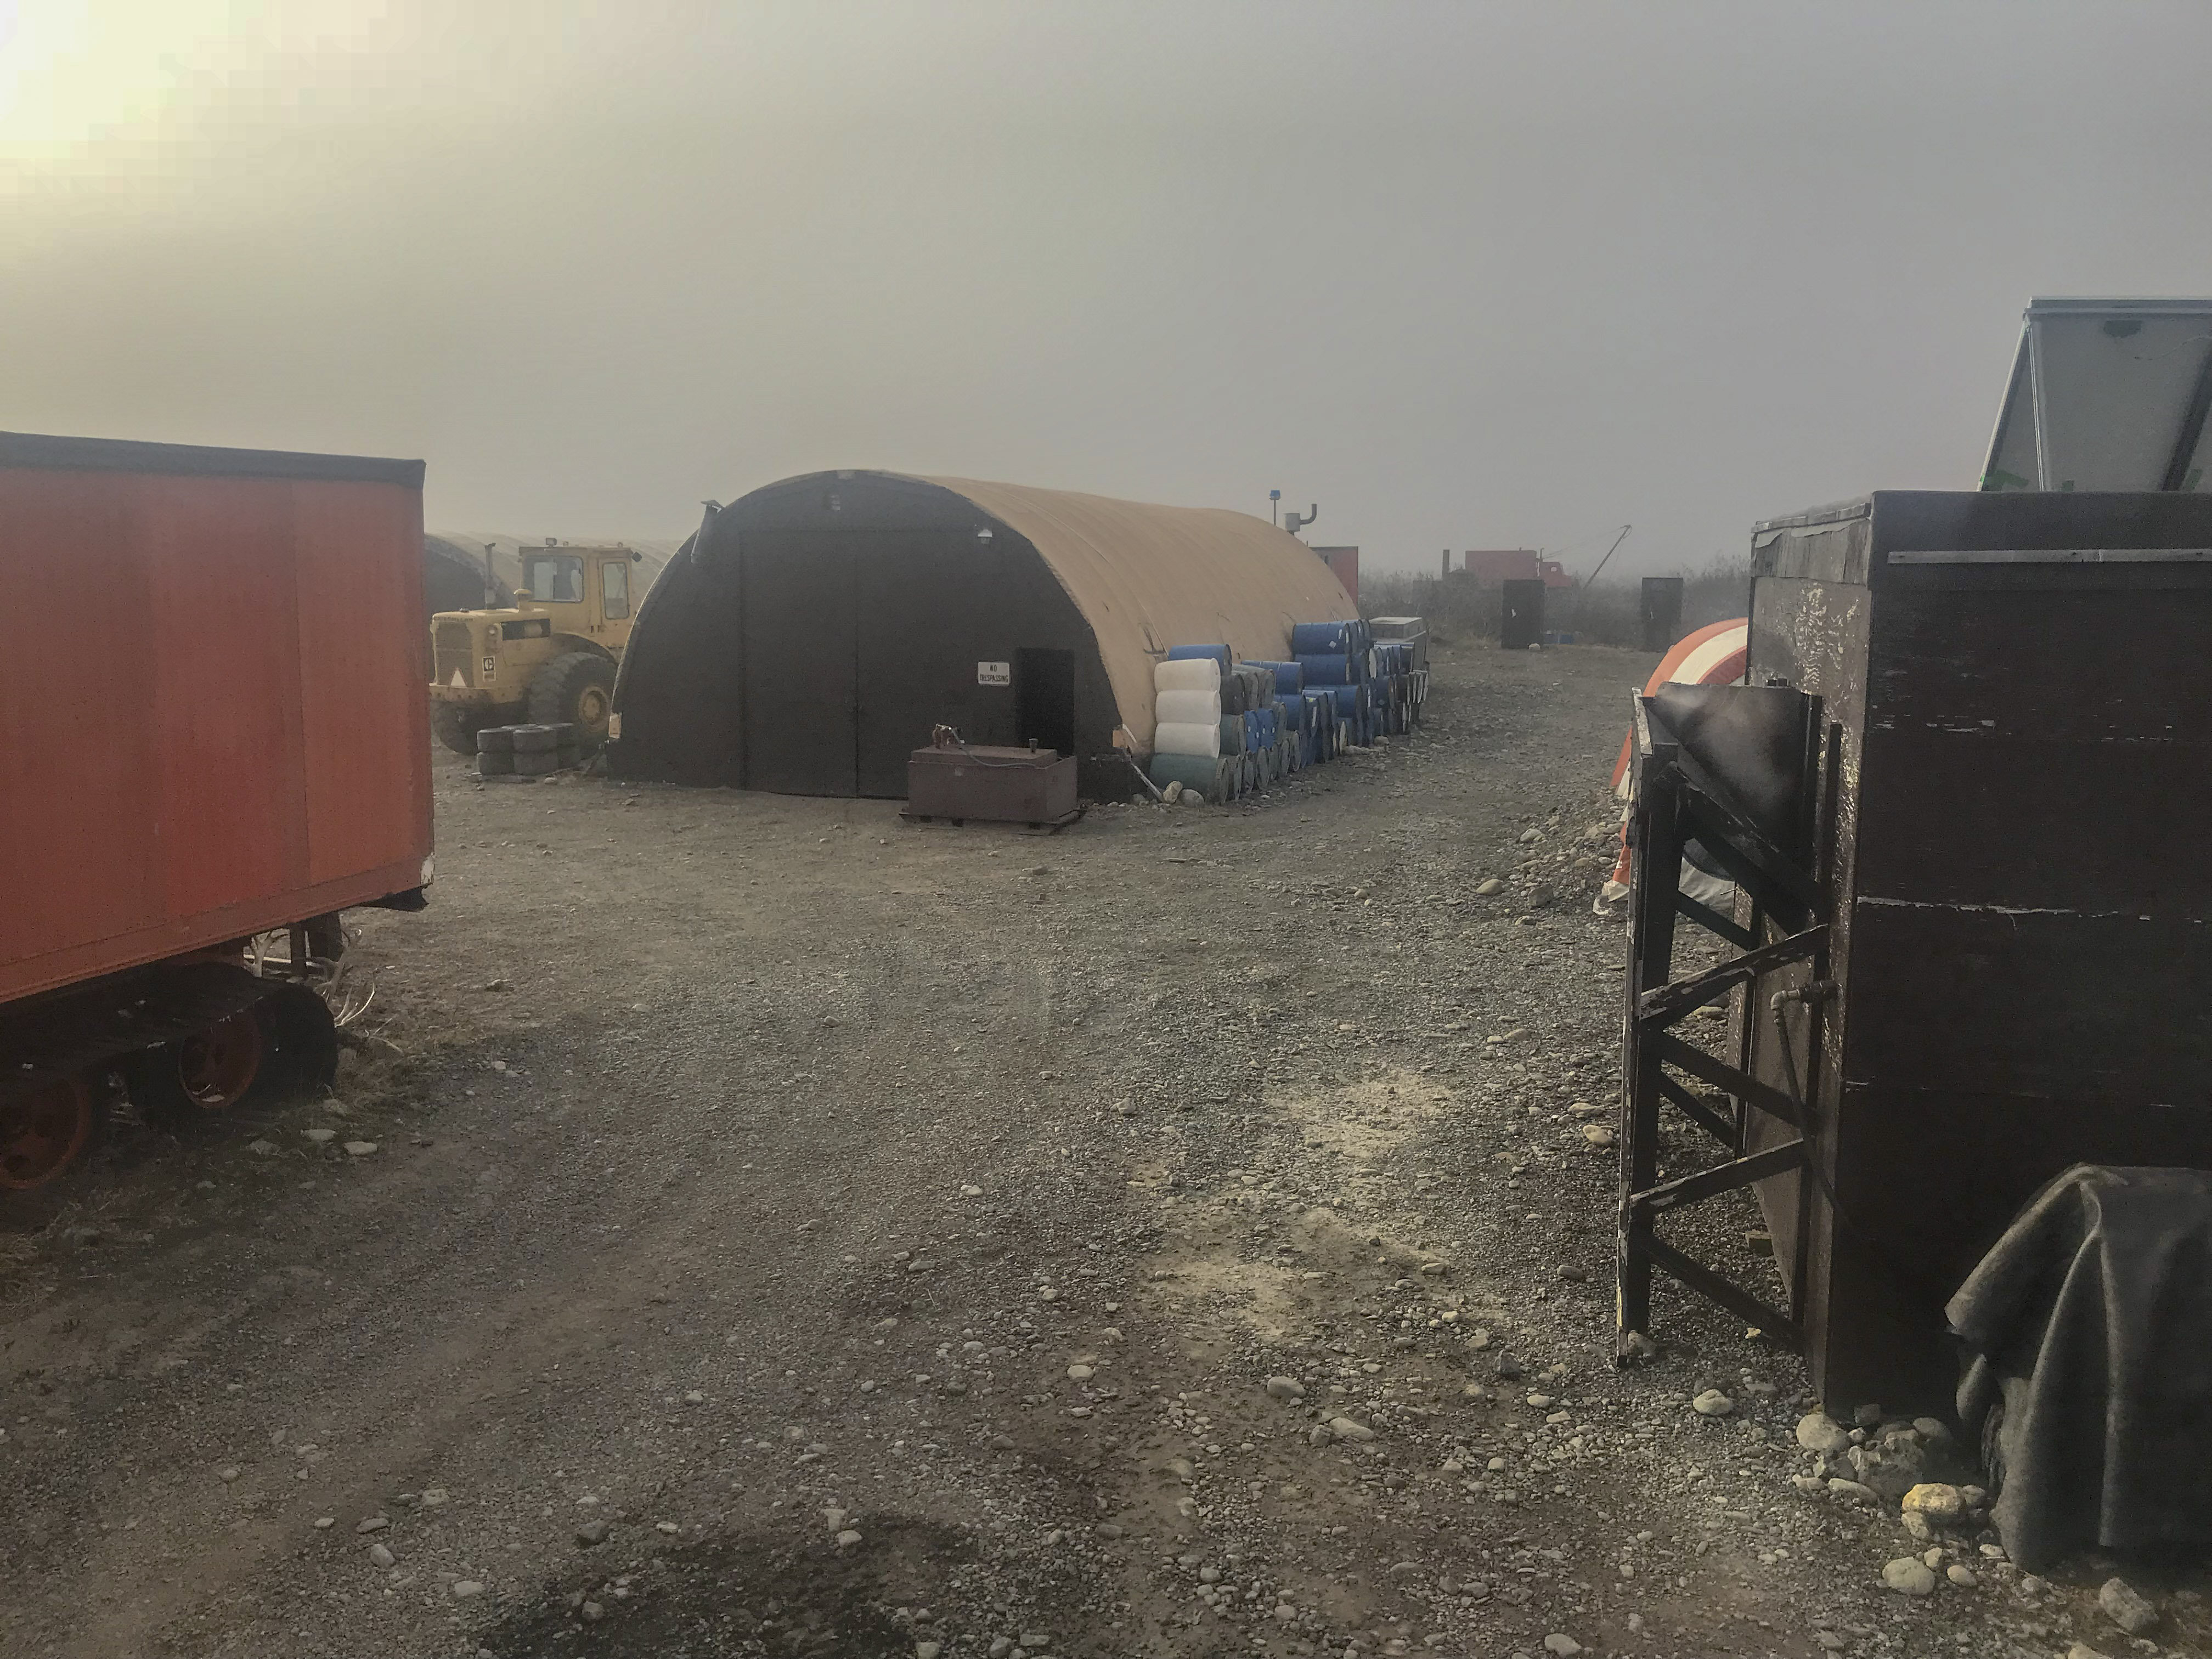
My trip a week ago began from my home in Fairbanks on Sunday, June 24, and about four hours later I landed in Kavik, my home for the next month or two. The weather was great, so after a quick fill up of avgas, I headed out to shake down the system and start mapping! I decided to start with the area near the Canning River delta, as it was great weather for it, which is rare. The coastal zone here is notorious for fog, and if any single thing is going to delay completion of this map, it is likely to be that fog. So any time the coast is in the sun, that’s my priority.
Once out over the site, I instantly got distracted by the tire tracks I showed above. Here was an opportunity to prove to myself that my system had the capability to map these tracks without having to wait a year for the work to actually begin in the 1002! Of course after 10 years of doing this and dozens of validation studies I knew it should, but I’m always pleasantly surprised to say I told me so. So after taking a bunch of obliques with my phone, I decided to extend my flight lines to capture some of this area outside the 1002 as a proof-of-concept, which seems to have successfully worked. The flying went well, and soon I was back in Kavik downloading data and settling in.
Flying to the Canning River delta, I saw this off to the left — tire tracks in a grid pattern. My measurements showed that these grids are exactly 200 m by 400 m.
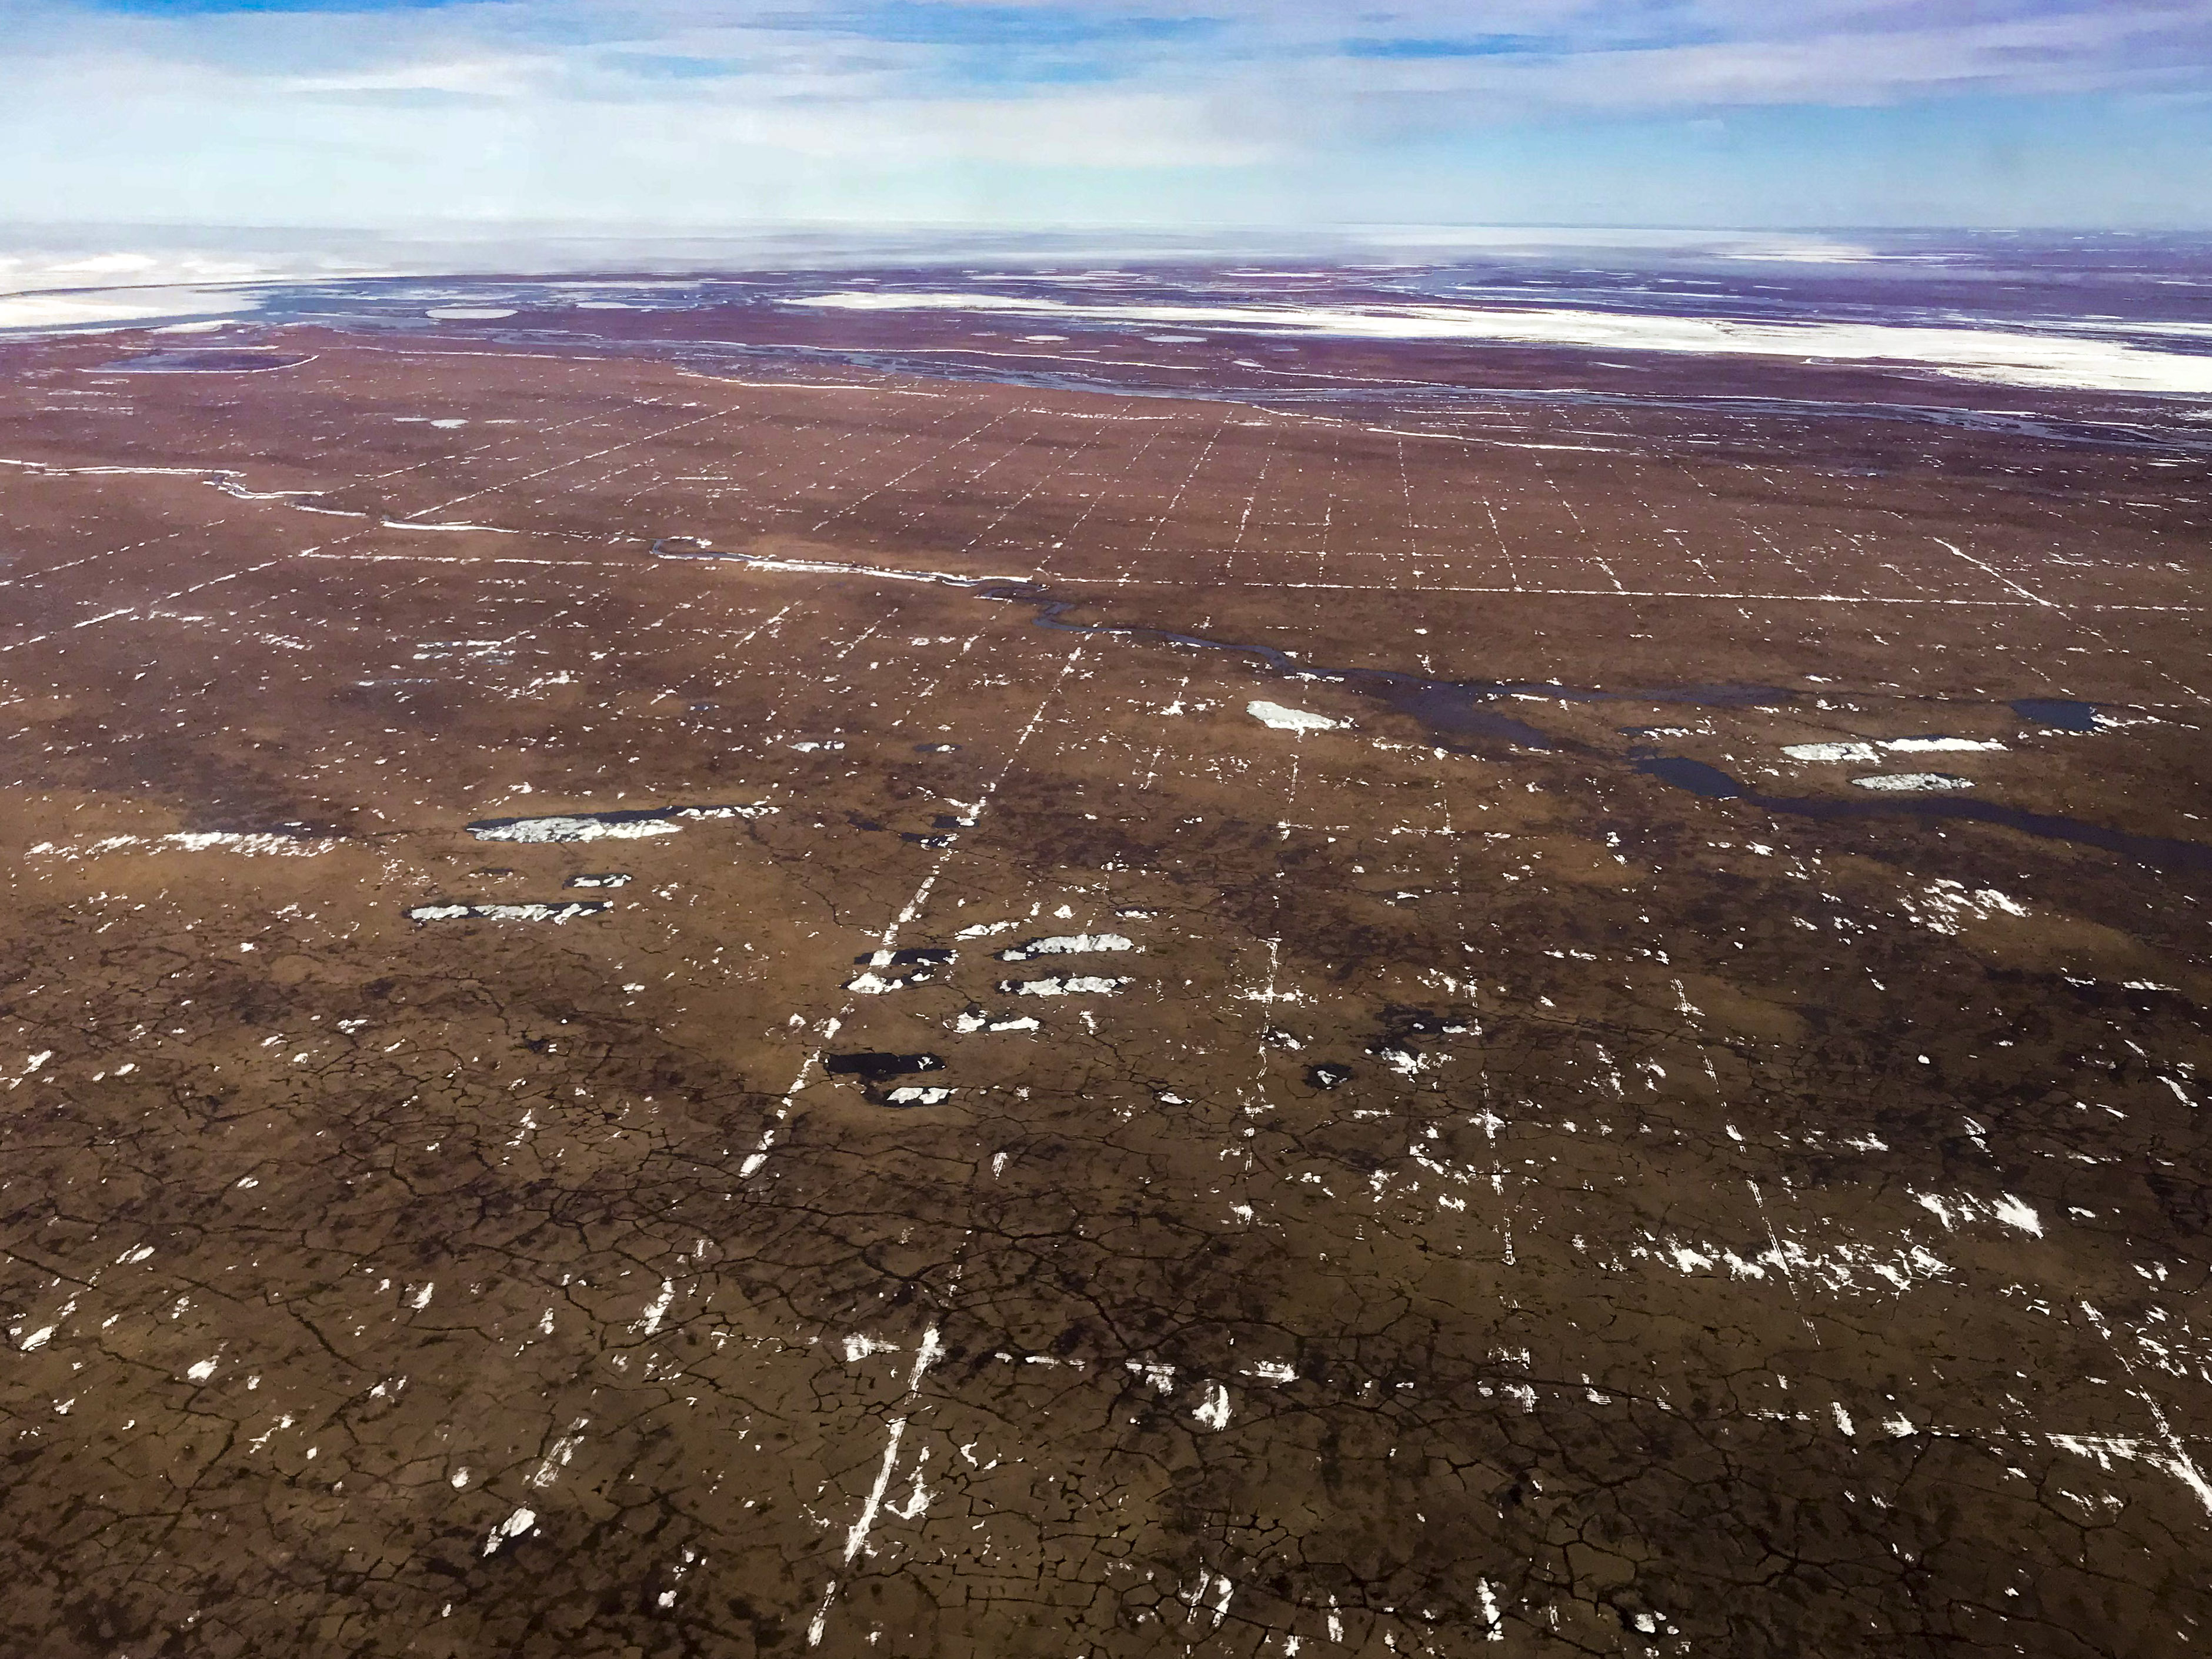
The Arctic Checkerboard. This is looking back towards the Refuge, across the Canning River and before the coast, covered in sea ice. Note: how the lines cross indiscriminately over lakes and rivers. The lakes and rivers are all frozen in winter, but the permafrost-melting process caused by the tire tracks could have major impacts in summer once the lakes and rivers open up by diverting the water along the tracks.
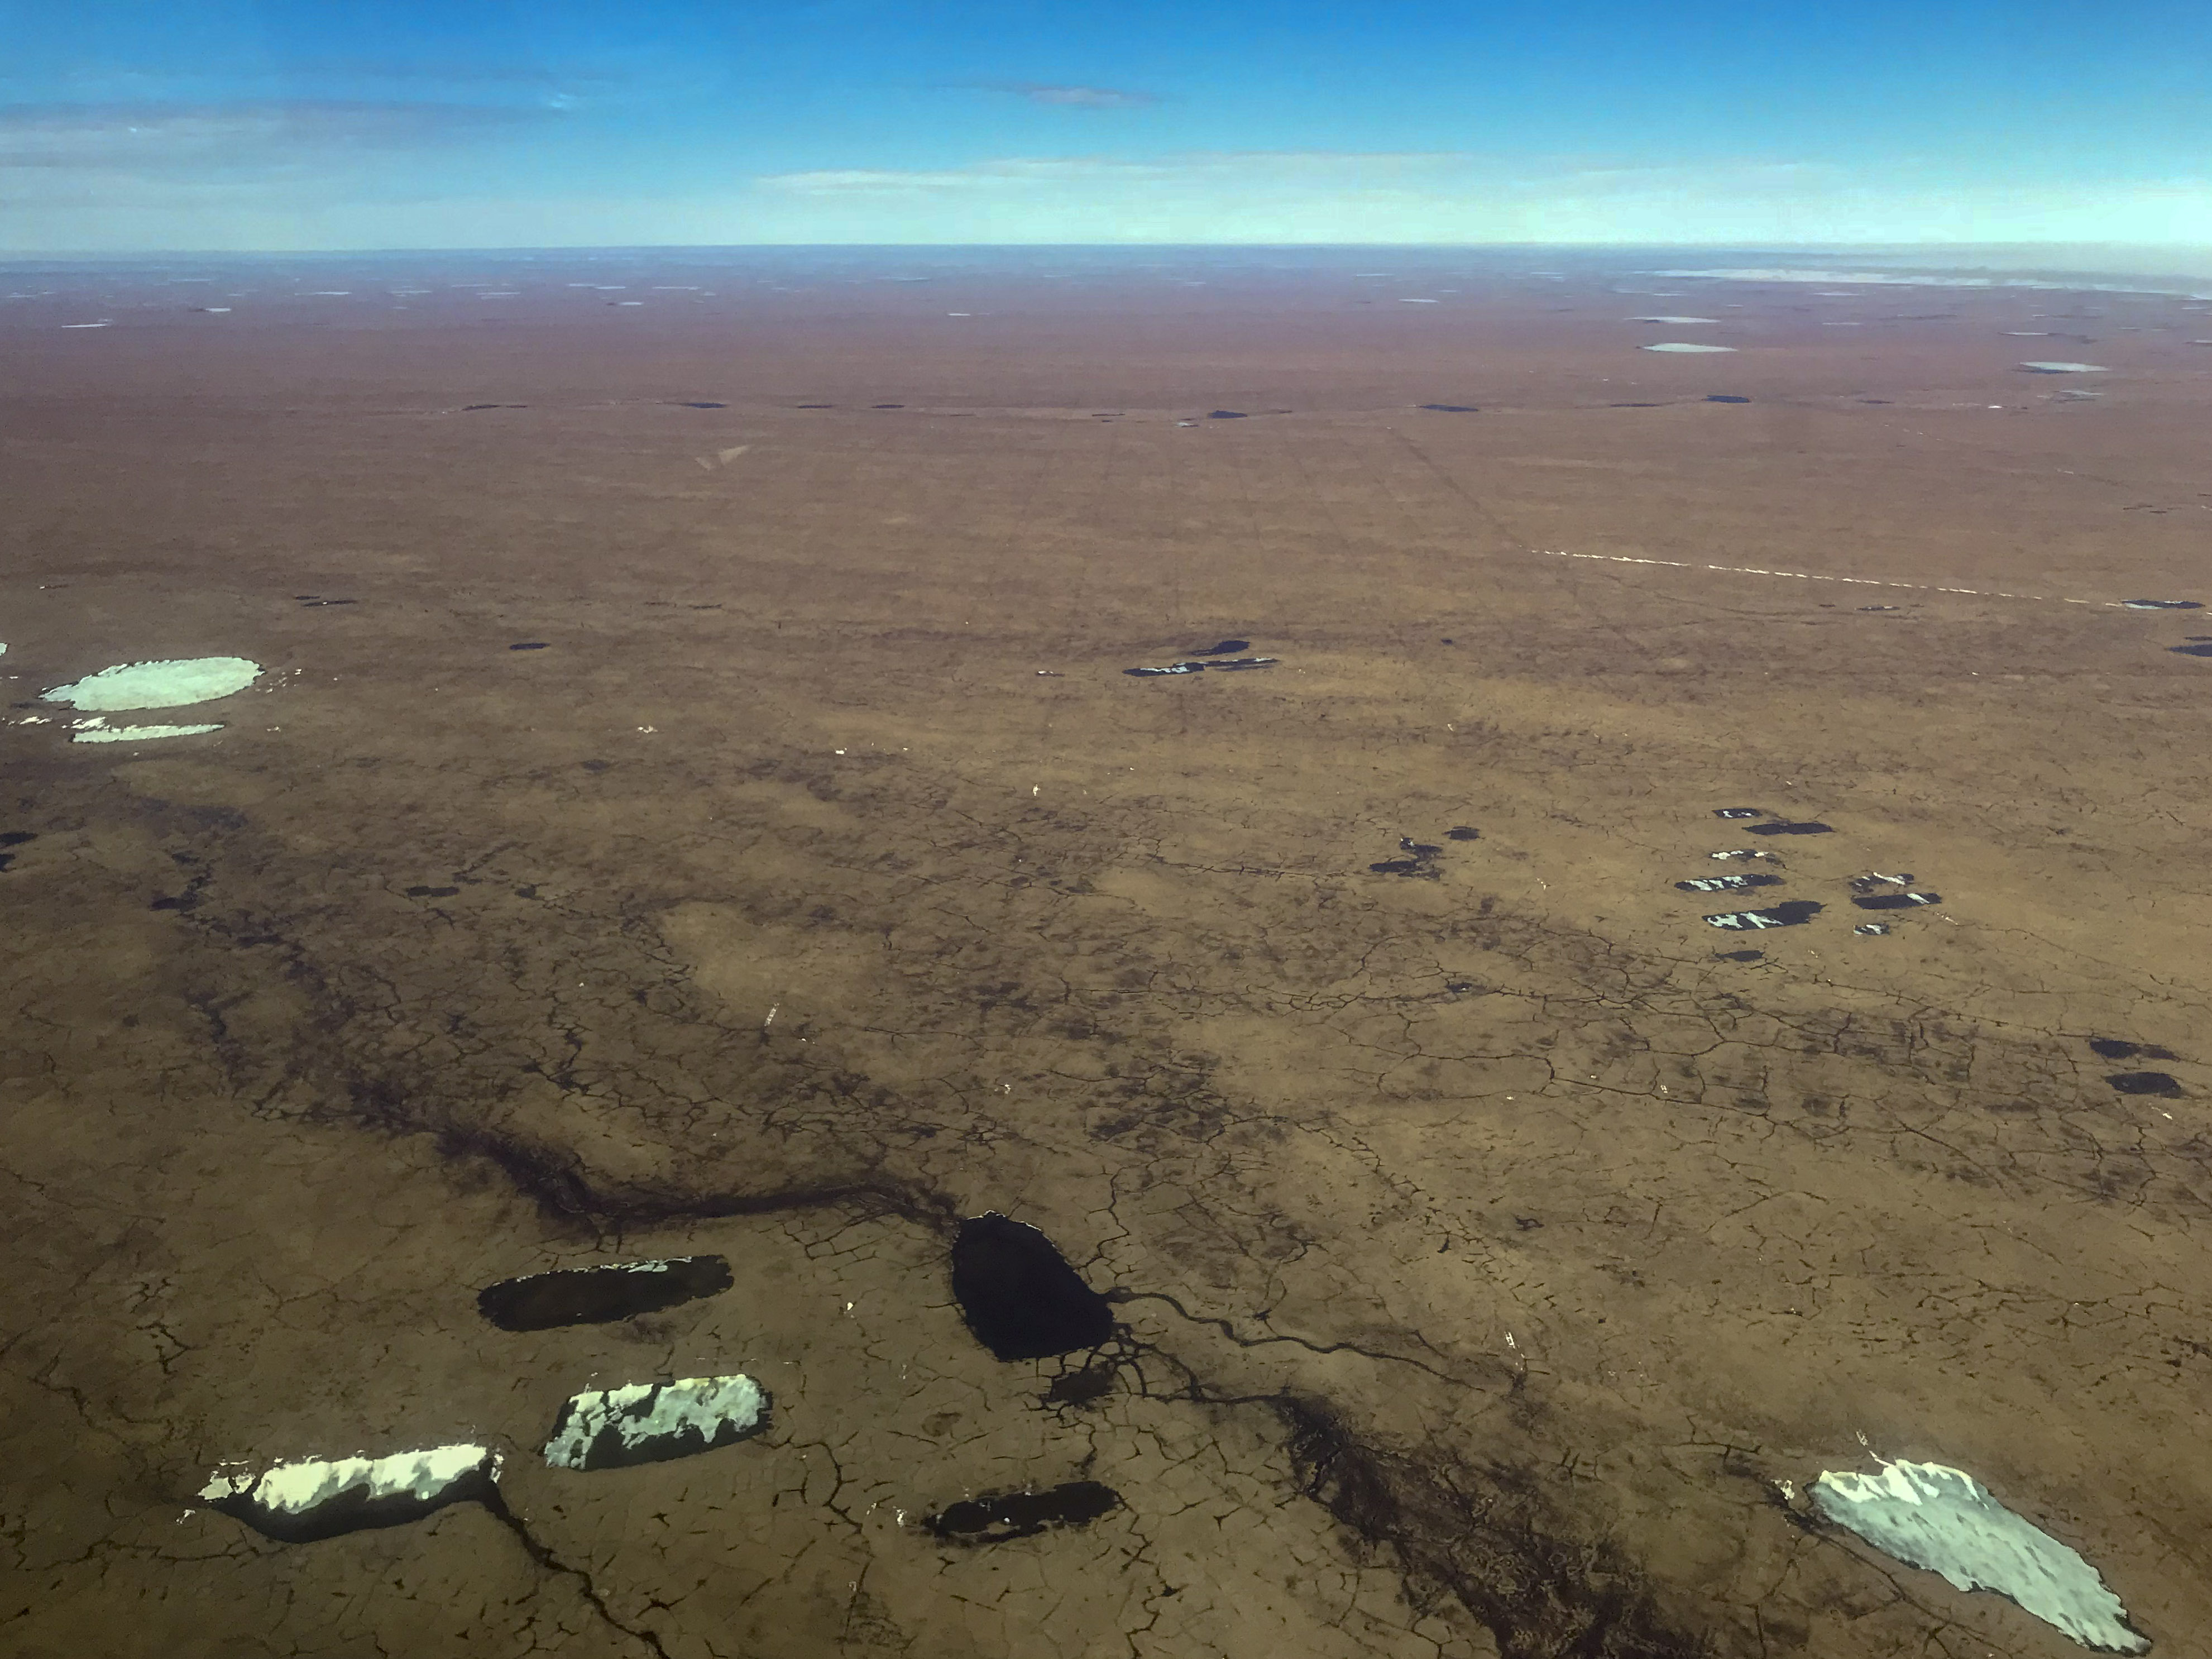
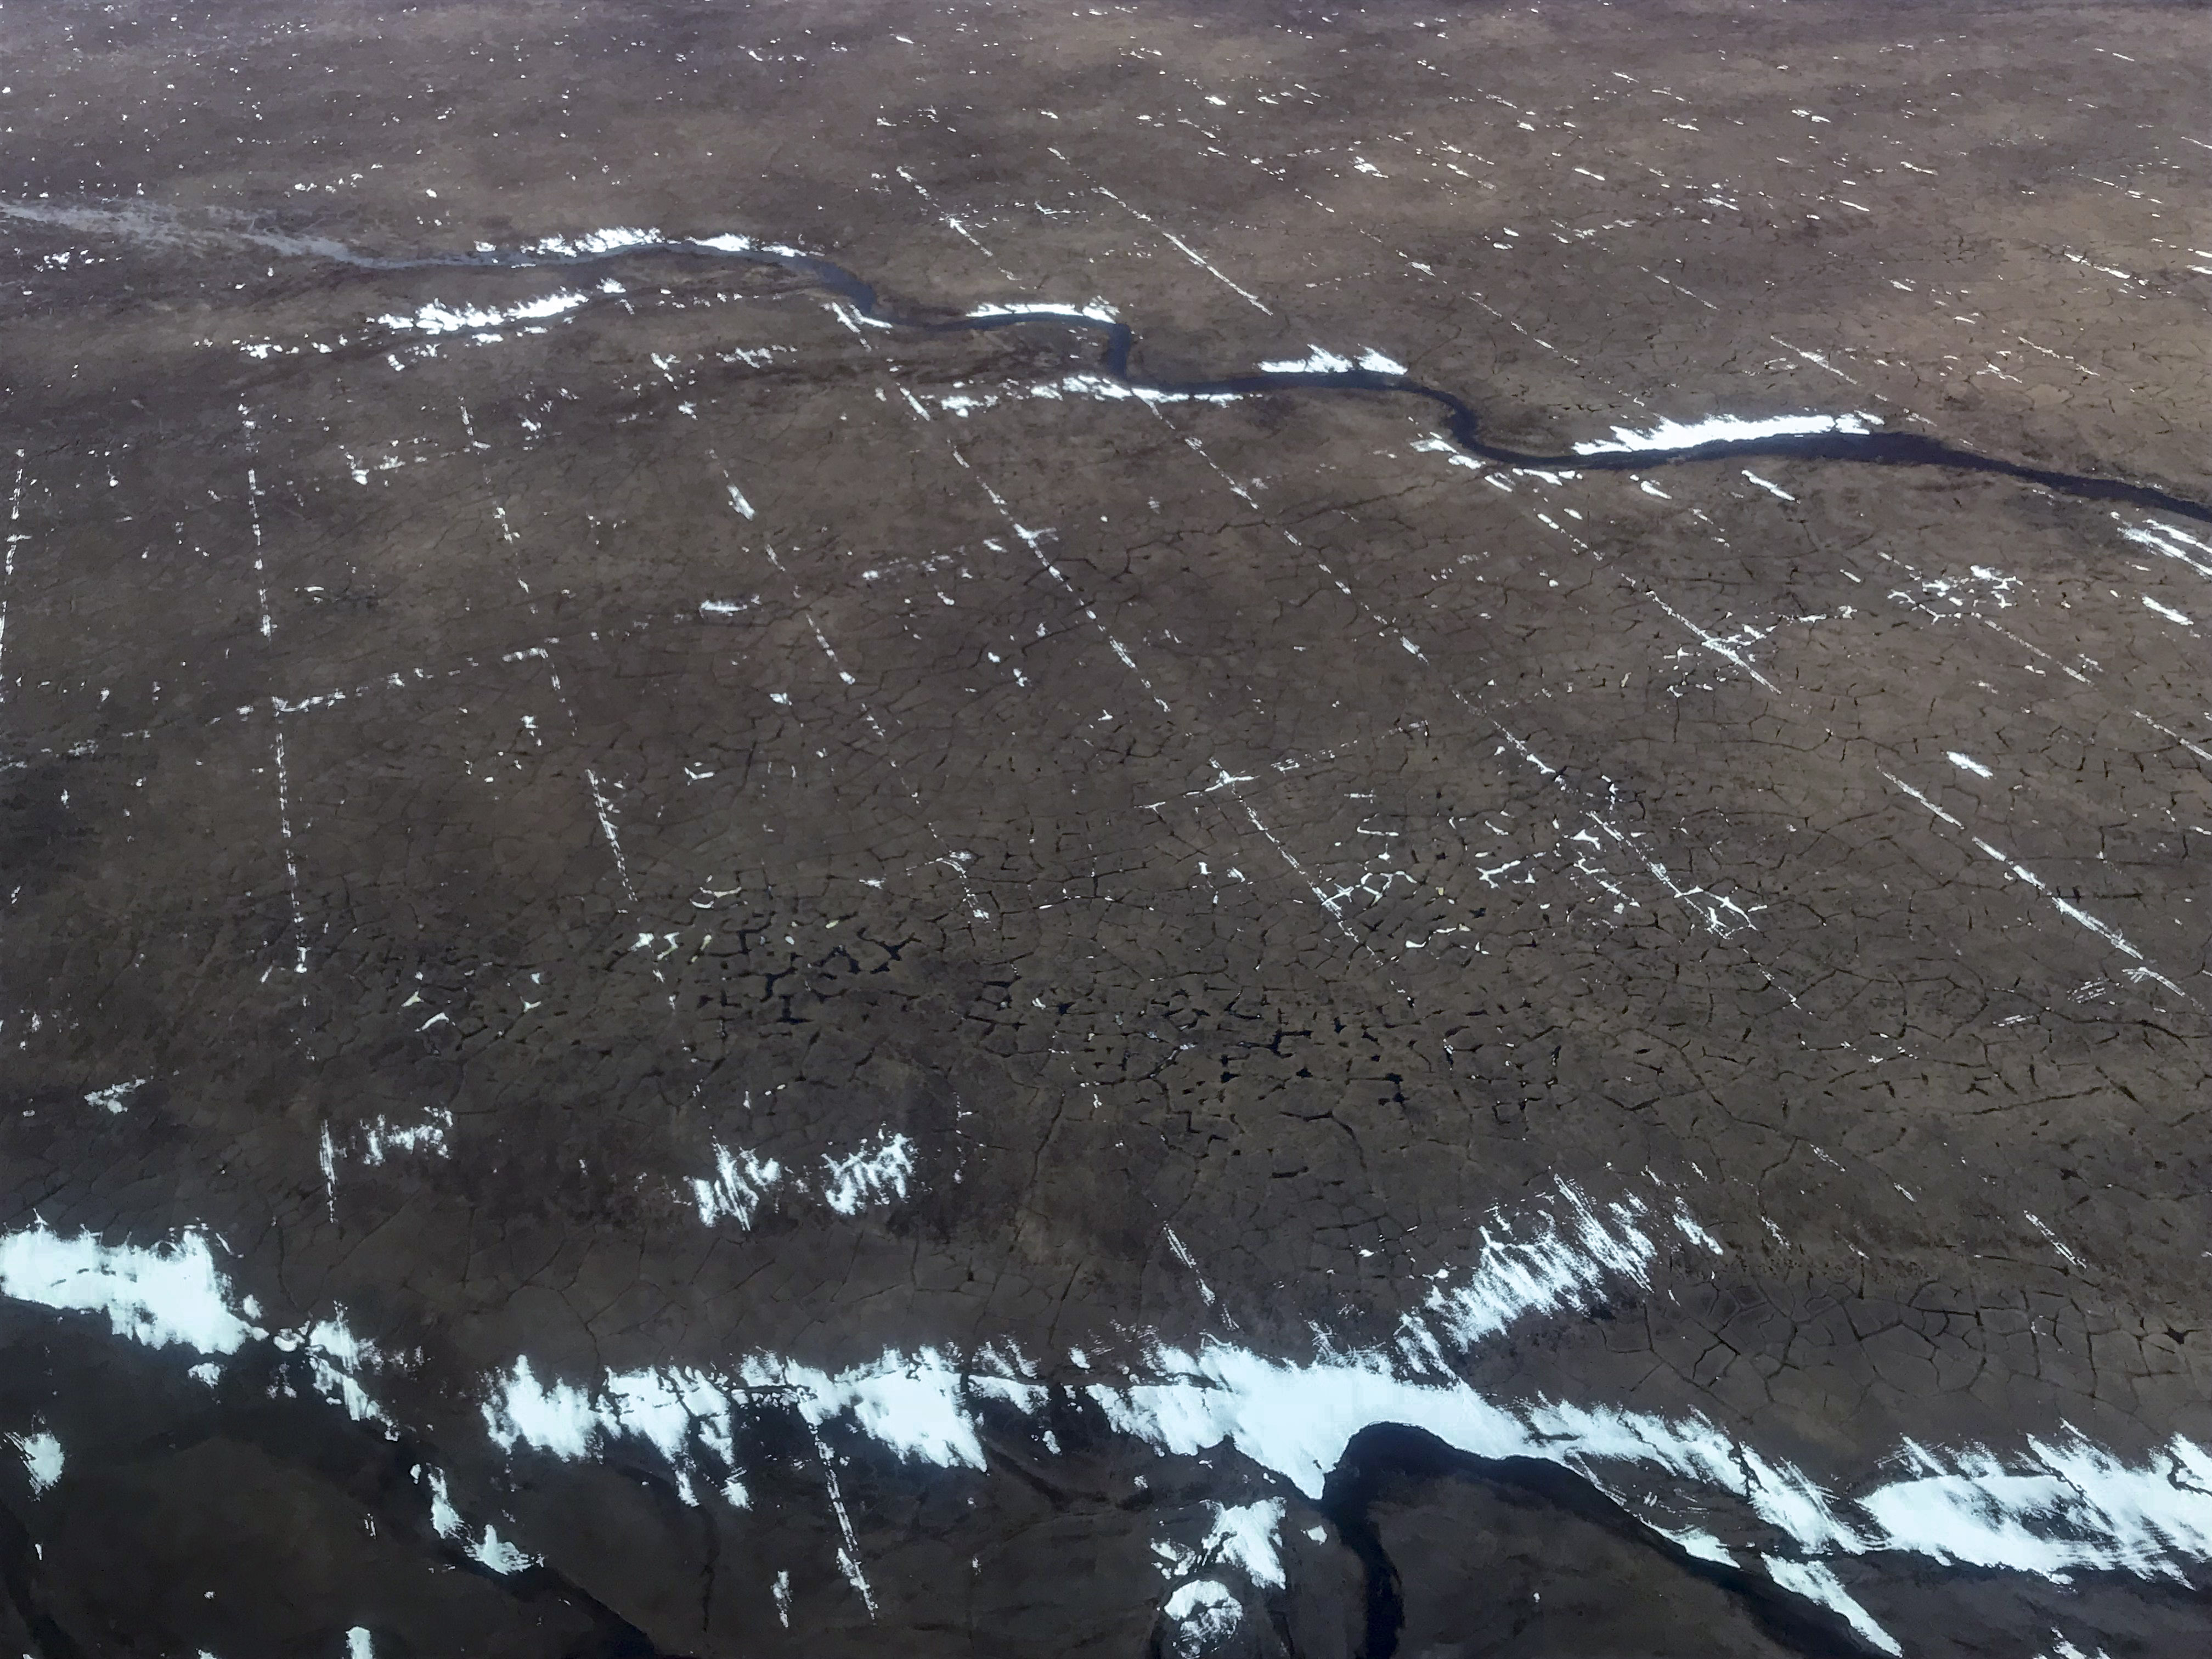
I think the impact of seismic tire tracks is more important on ice wedge polygons than the lakes and rivers. Here at bottom-left you can see a network of such polygons covered by water glinting in the sunshine. Should a topographic depression caused by these tire tracks lead that water in a down-slope direction, it could start the water flowing, which will thermally erode the tops of the ice wedges, melting them down into an even deeper depression, leading to a chain-reaction which could drain enormous areas in a matter of hours or days. This feedback process is well documented in the Arctic in the context of the rapid draining of tundra ponds which intersect with these ice-wedge rivers. Regardless of your opinion about whether the impacts of these tracks are good or bad, having analyzed my photos and data quite a bit now I have to say that I impressed that the operators stuck to their lines and were not out there doing donuts just for fun, so they did a great job of sticking to what they were supposed to be doing.
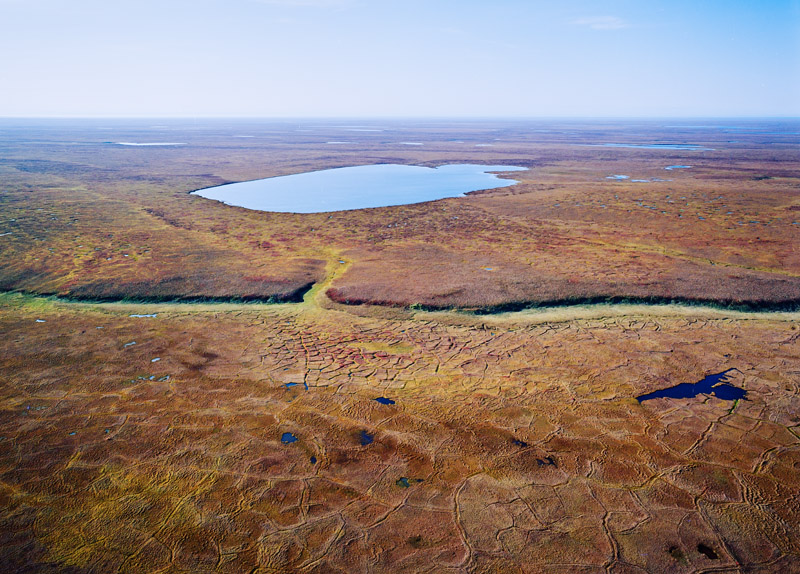
Here’s a photo I took 10 years ago in the 1002 Area, showing a tundra pond that has been partially drained by the process I described above. You can faintly see the outline of the original lake off to the left of the existing one, and the drainage channel straight ahead of it.
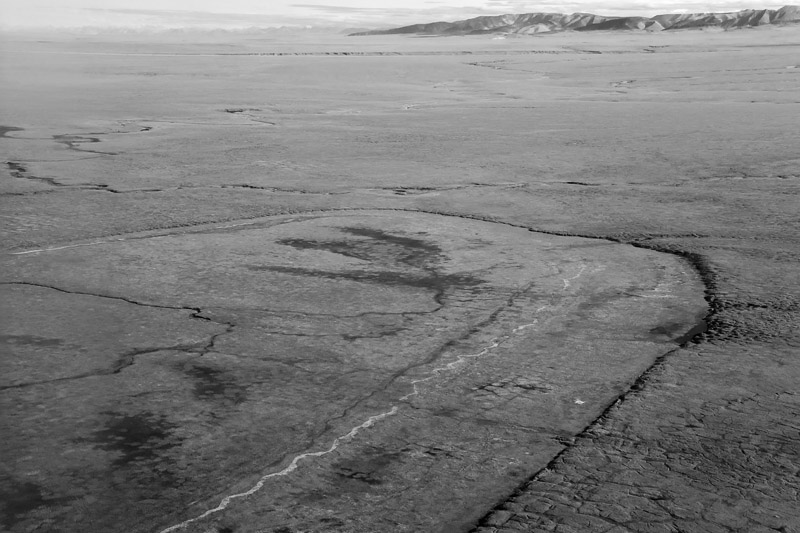
Here’s another photo I took a long time ago within the 1020 Area, showing a dry lake bed from a lake drained completely by this process. Perhaps counter-intuitively, this actually makes the permafrost grow thicker.
The 1002 Area is not flat, as many believe. The mountains come quite close to coast, steepening the coastal plain. This is why there are so few lakes here compared to the west side of coastal plain, which is really, really flat.
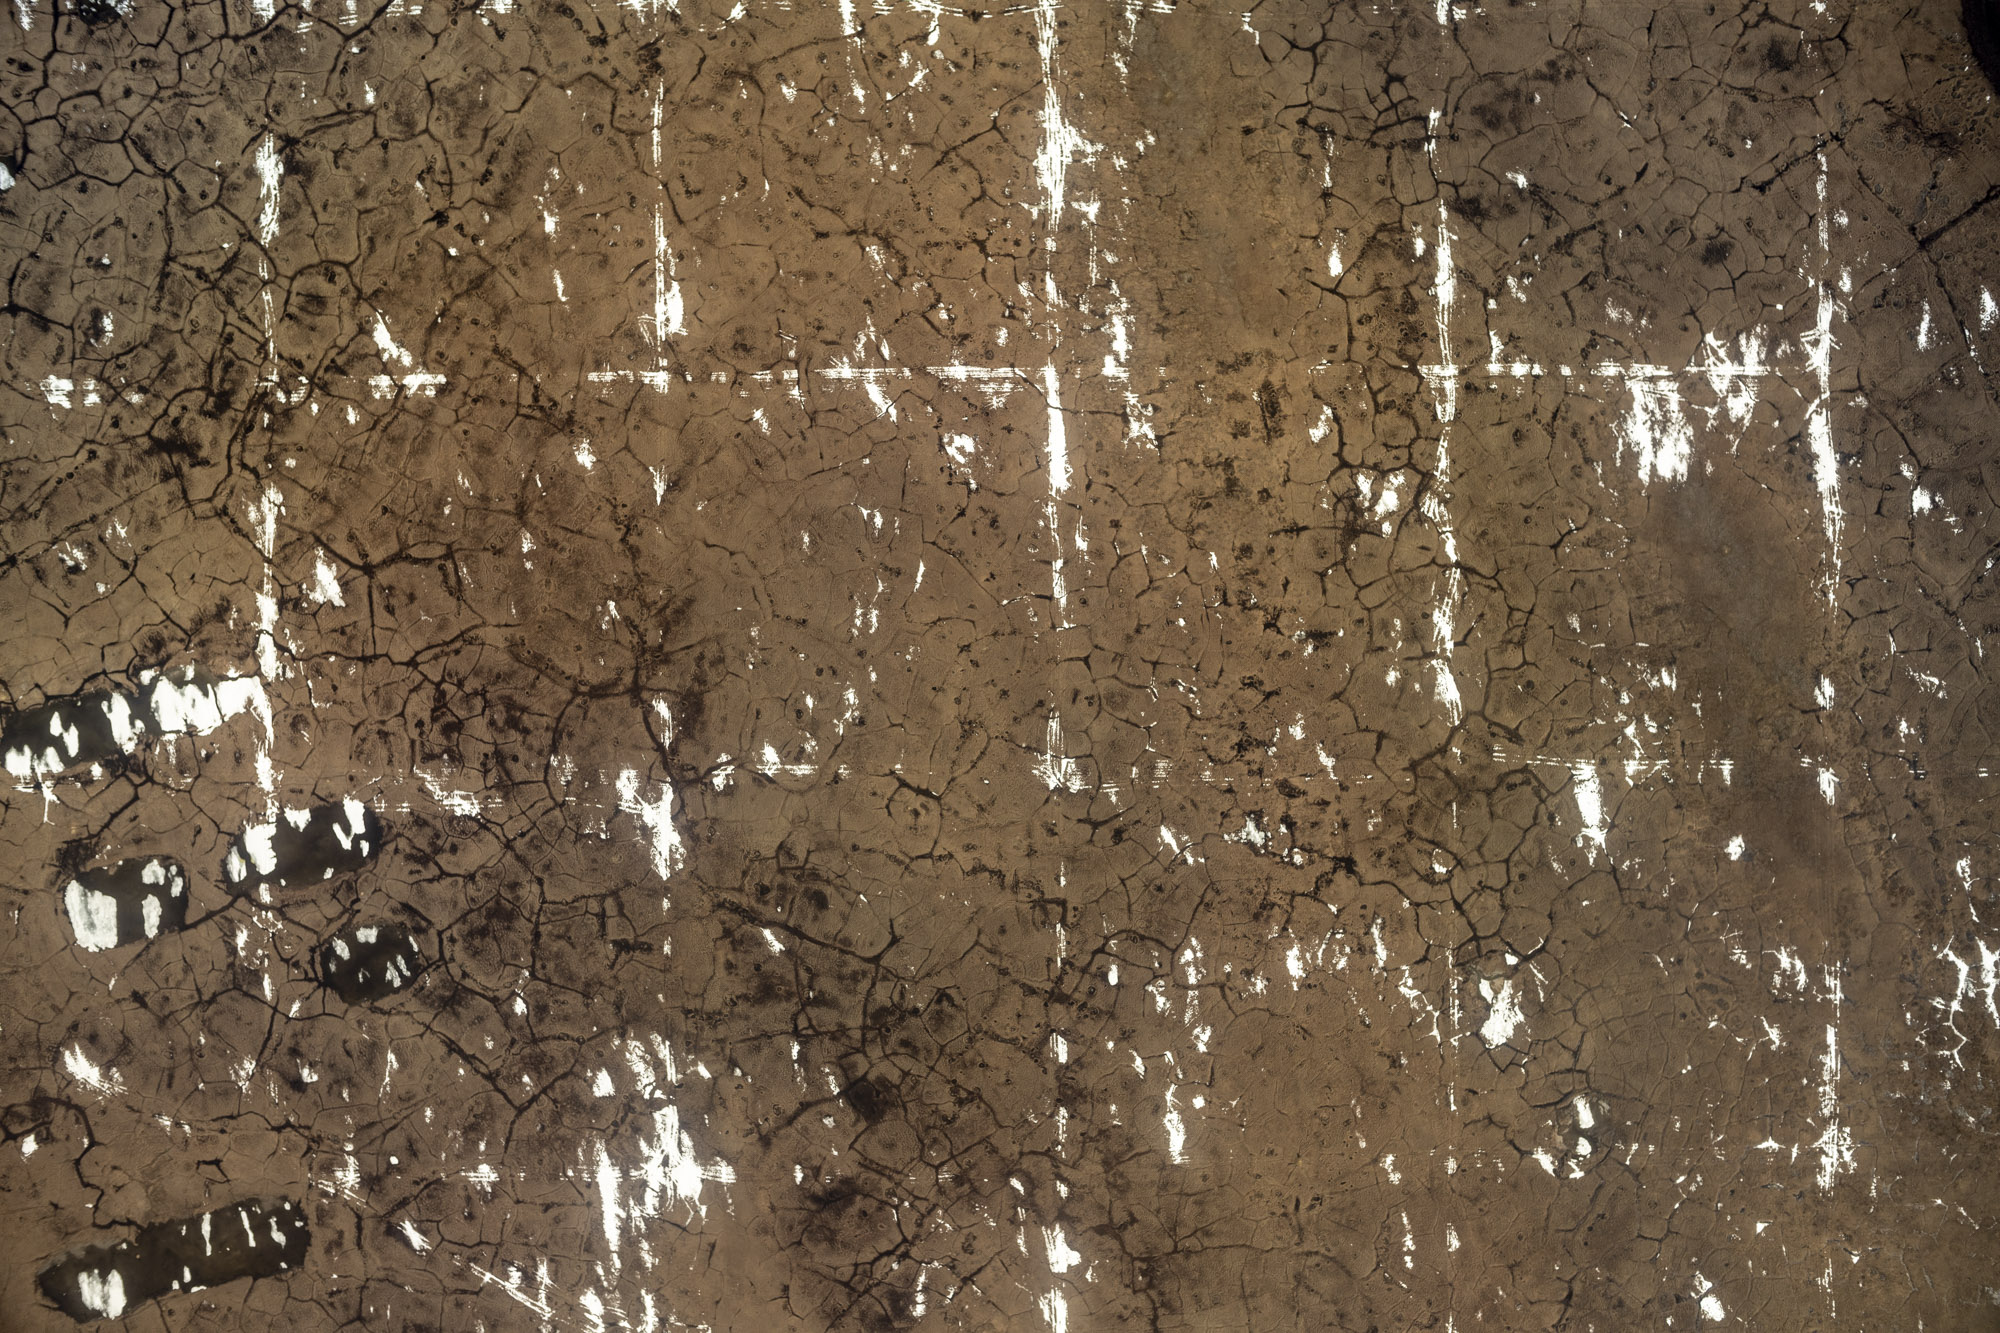
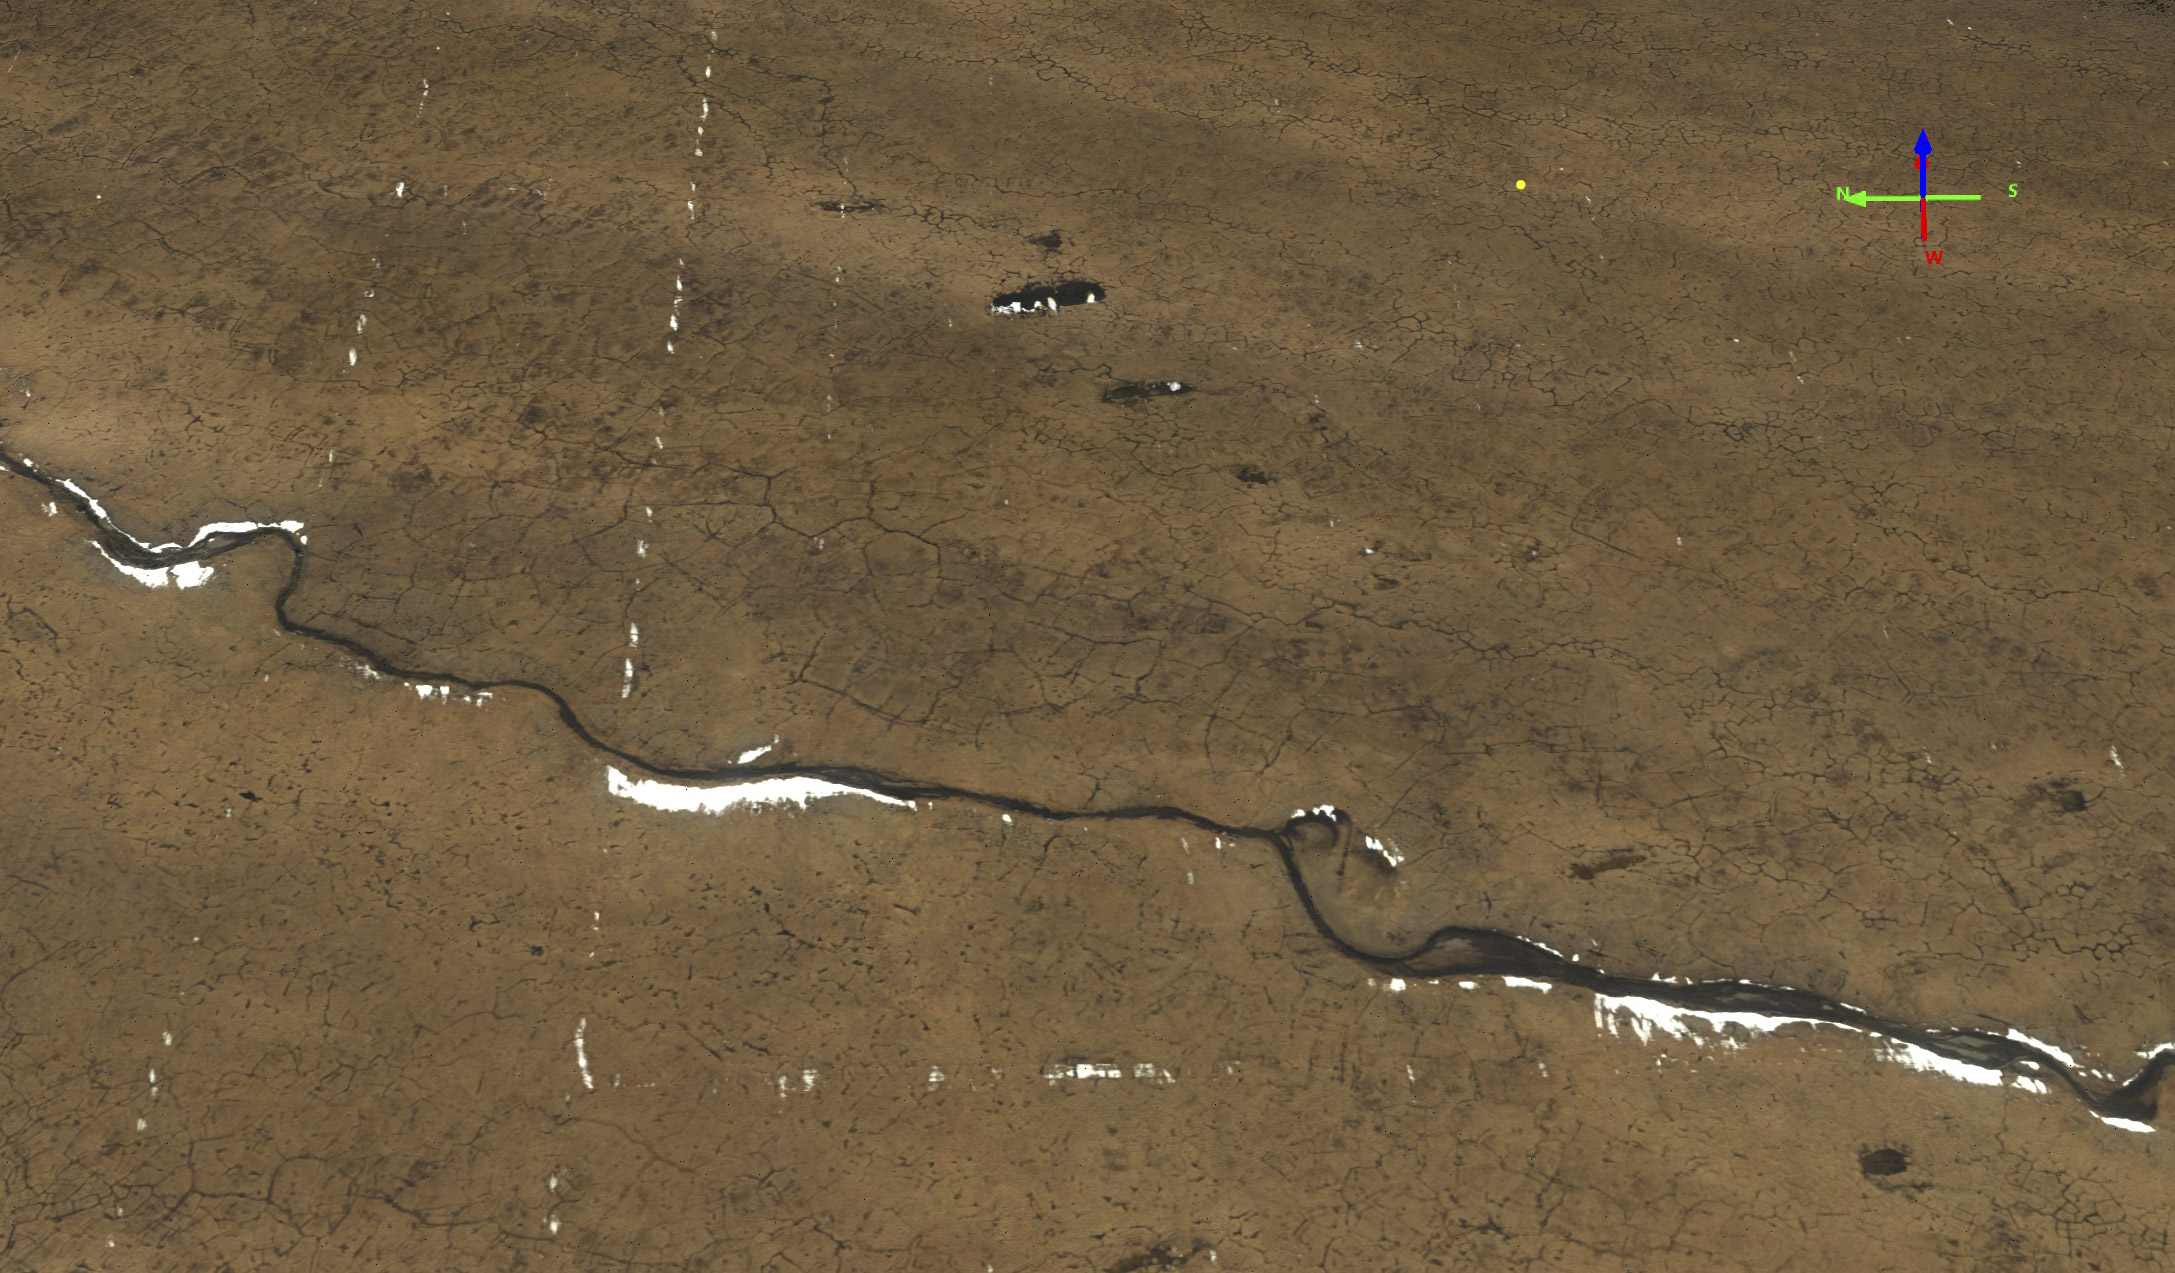
Here is an example of the vertical photography I acquired to make my map. You can clearly see the individual tire tracks that make the checkerboard.
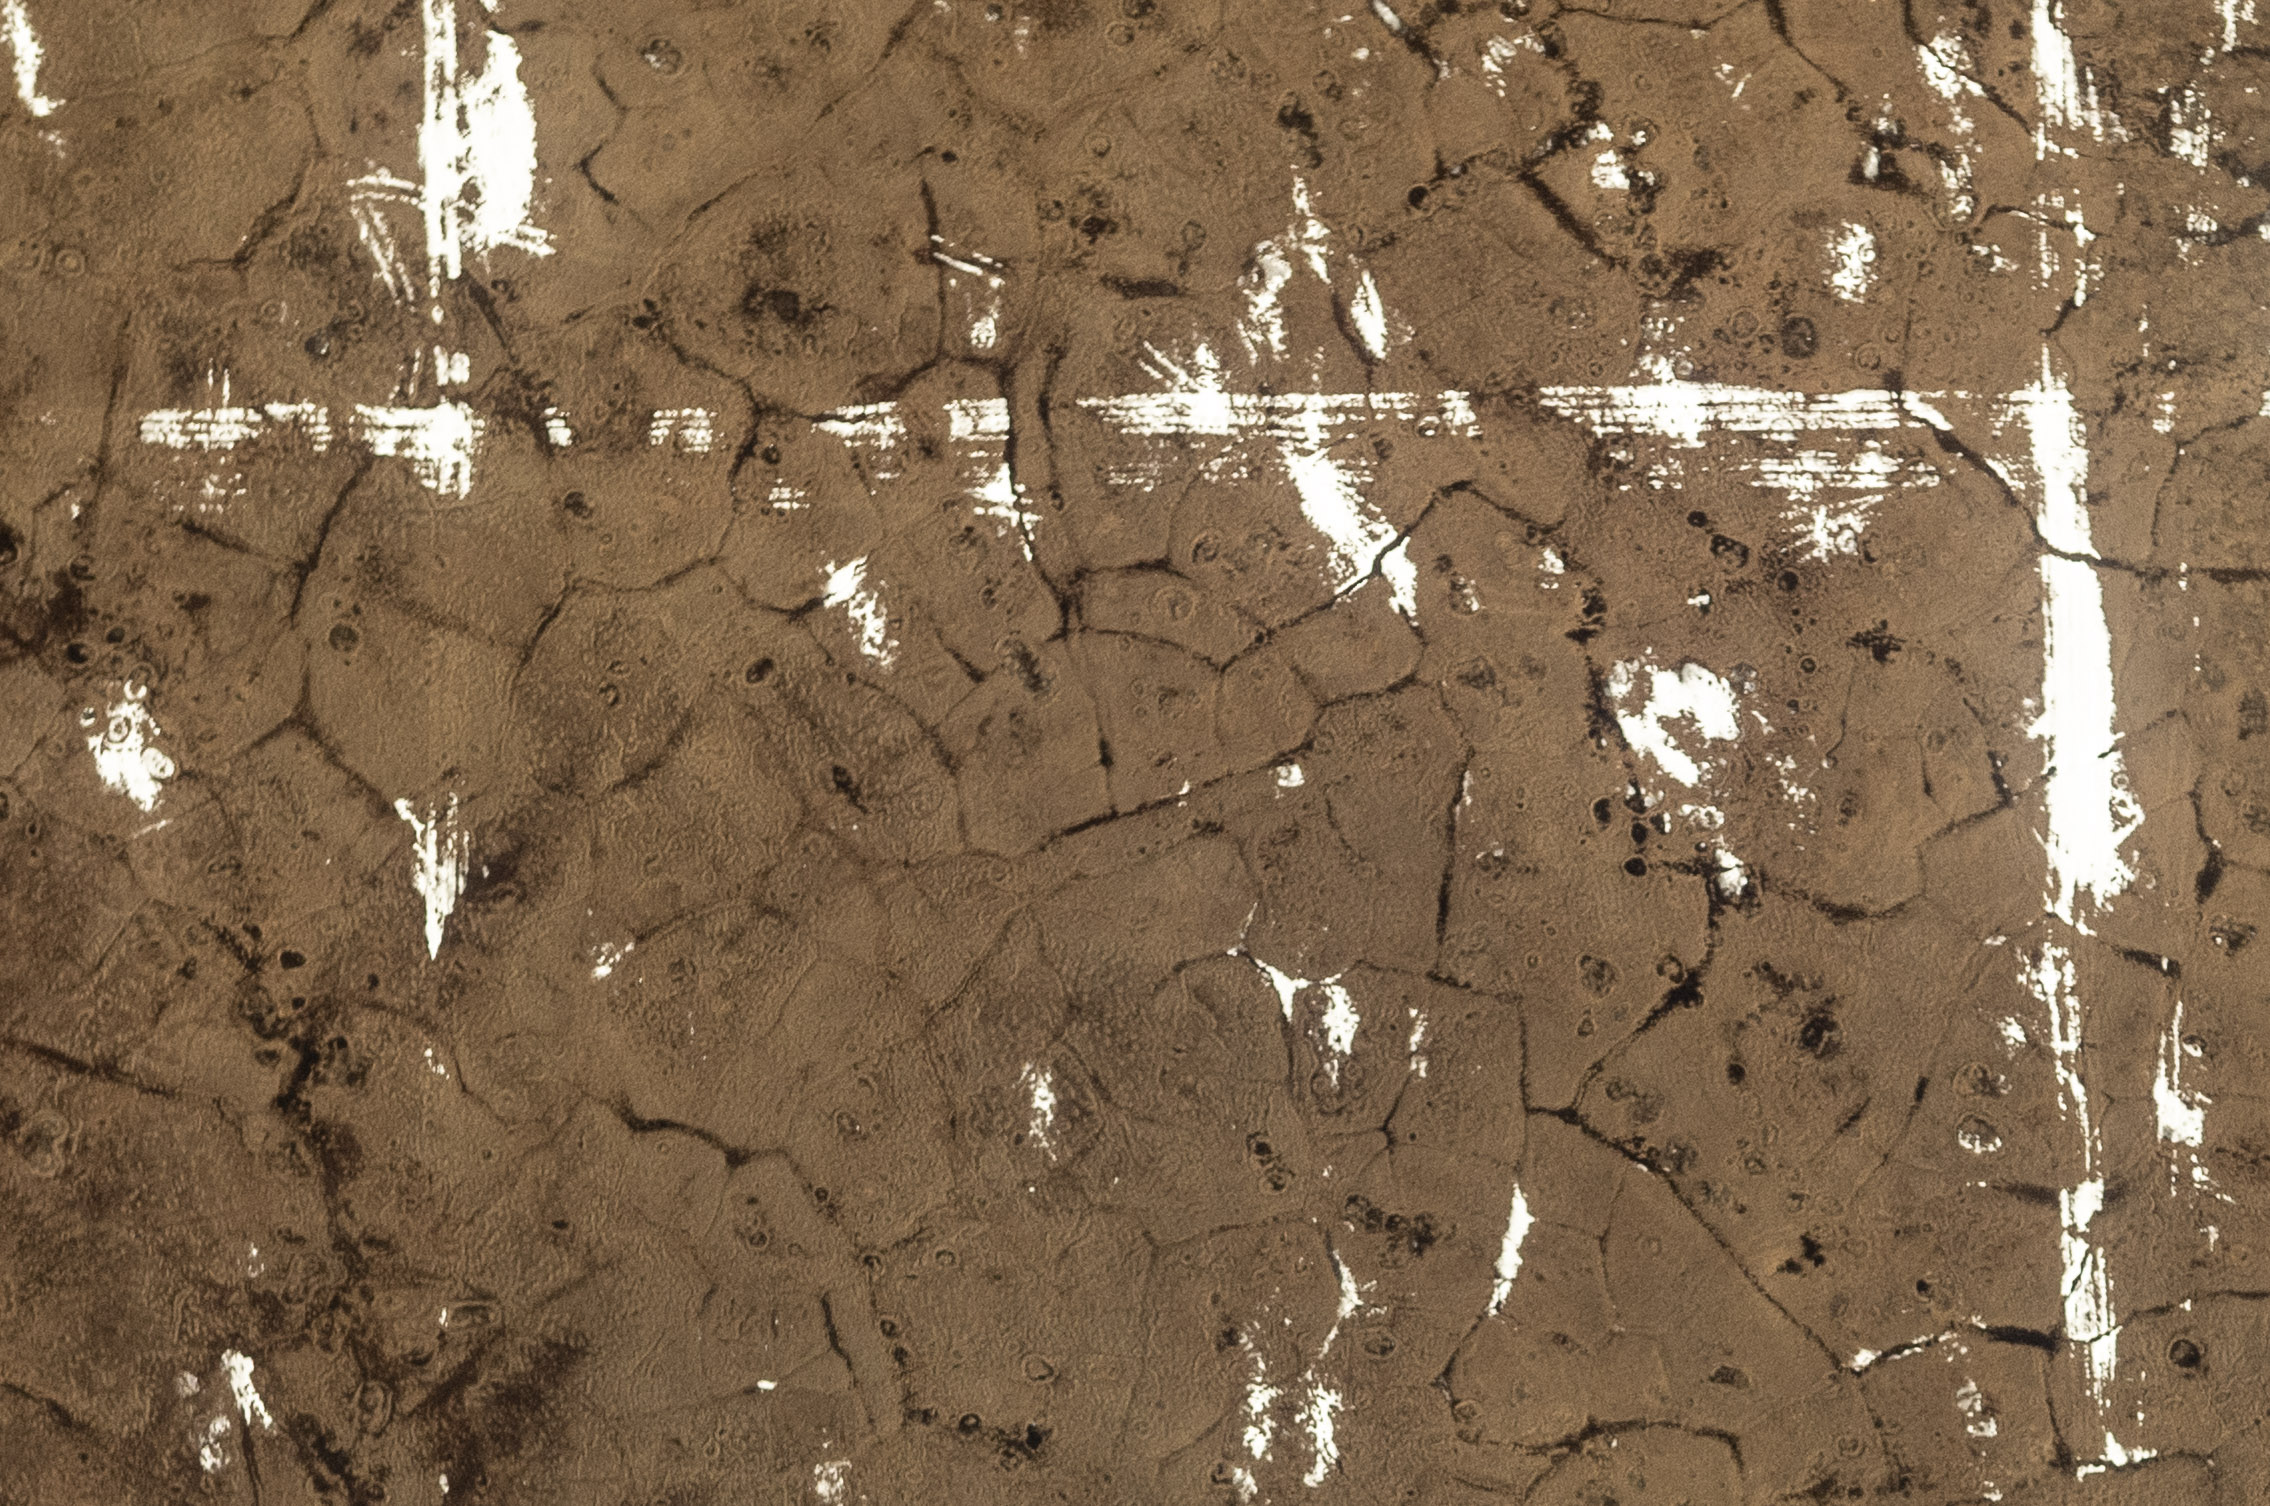
Here is a crop of the previous image. Note that you can not only see the tire tracks in the form of snow, but on the exposed tundra as well.
Here is a seismic track leftover from the 1980s. Though this is just outside the Refuge, you can find similar ones inside. They used different and more harsh methods back then, but the point remains that permanent damage can be caused by using the best available technology of the times. The question is whether the best available technology of today is acceptable to the citizens of this country that own this land?
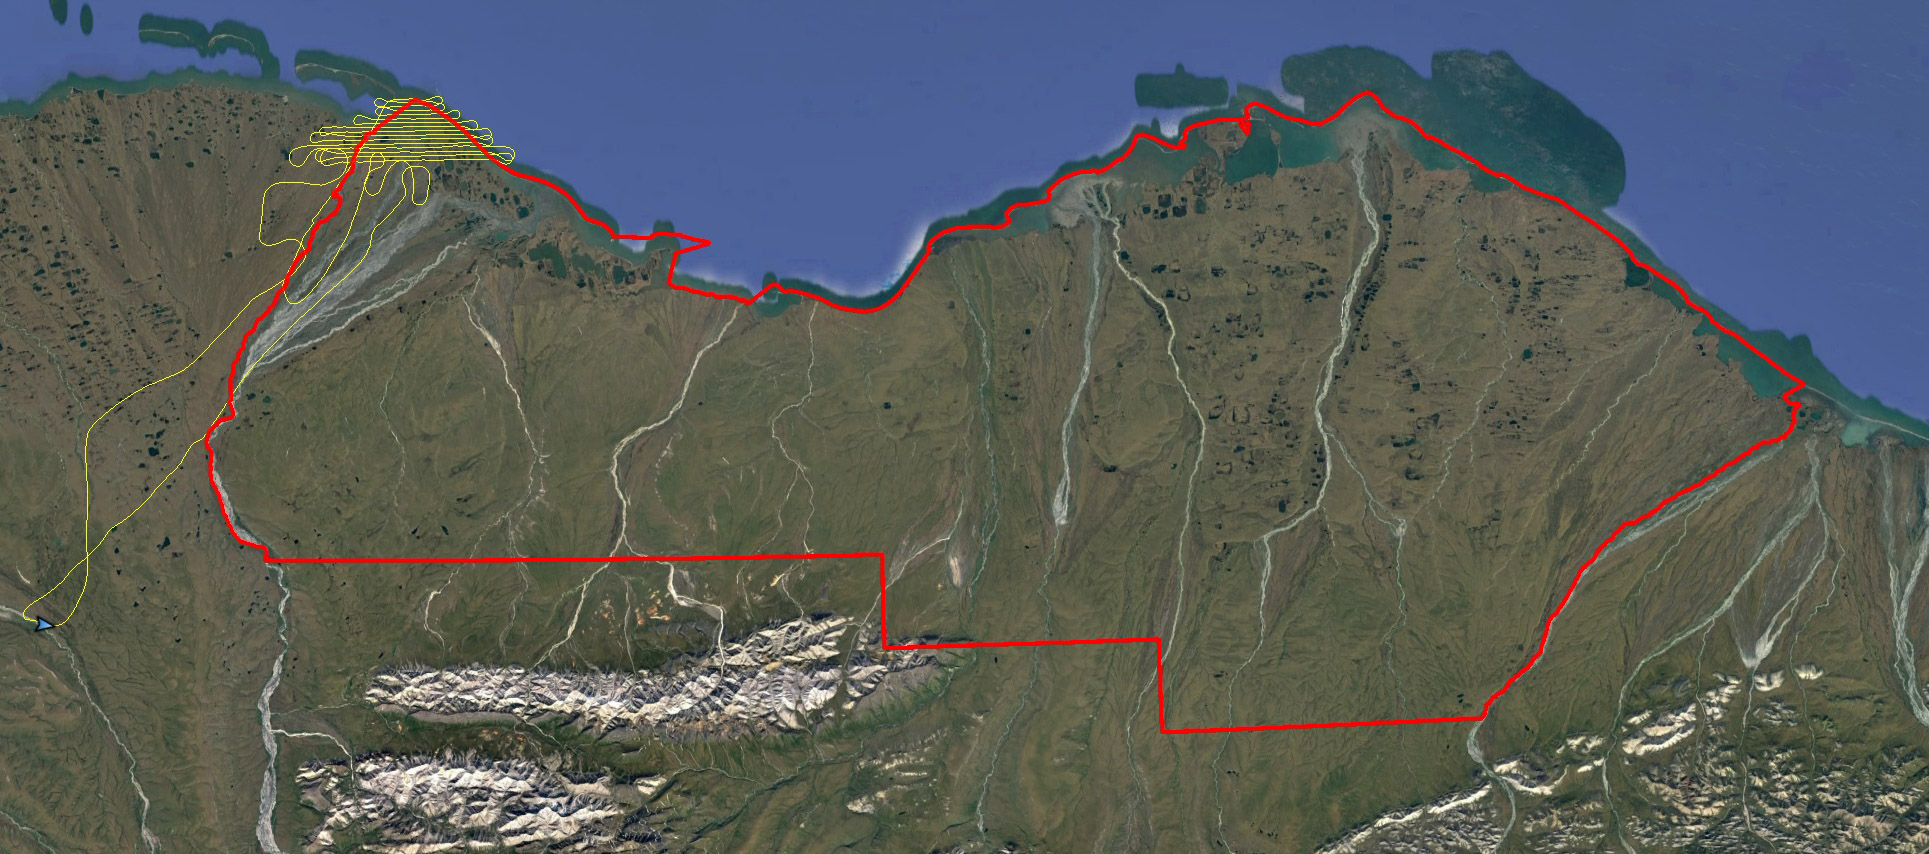
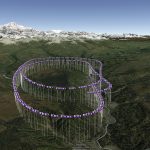
Here are my flight lines, yellow, for my first day of mapping the 1002 Area, red. A long way to go, but a great start!
The next morning I was again up at 4AM, this time processing the data acquired in yesterday’s late night to ensure that all was well, which indeed it was. So by about 9AM I was making my next flight line over the Canning River delta. A low fog had formed over the delta this morning, so I started working further inland, giving it a chance to burn off in afternoon, which indeed it did. In total it was 11 hours of flying taking some 13,000 photos, but the best part was knocking out one of the most troublesome weather locations on the project! Only 9 more days like that and I would be finished! So after landing, refueling, and shoveling some food in my mouth, I stumbled into my bed and dreamt of a week of perfect weather and other good things.
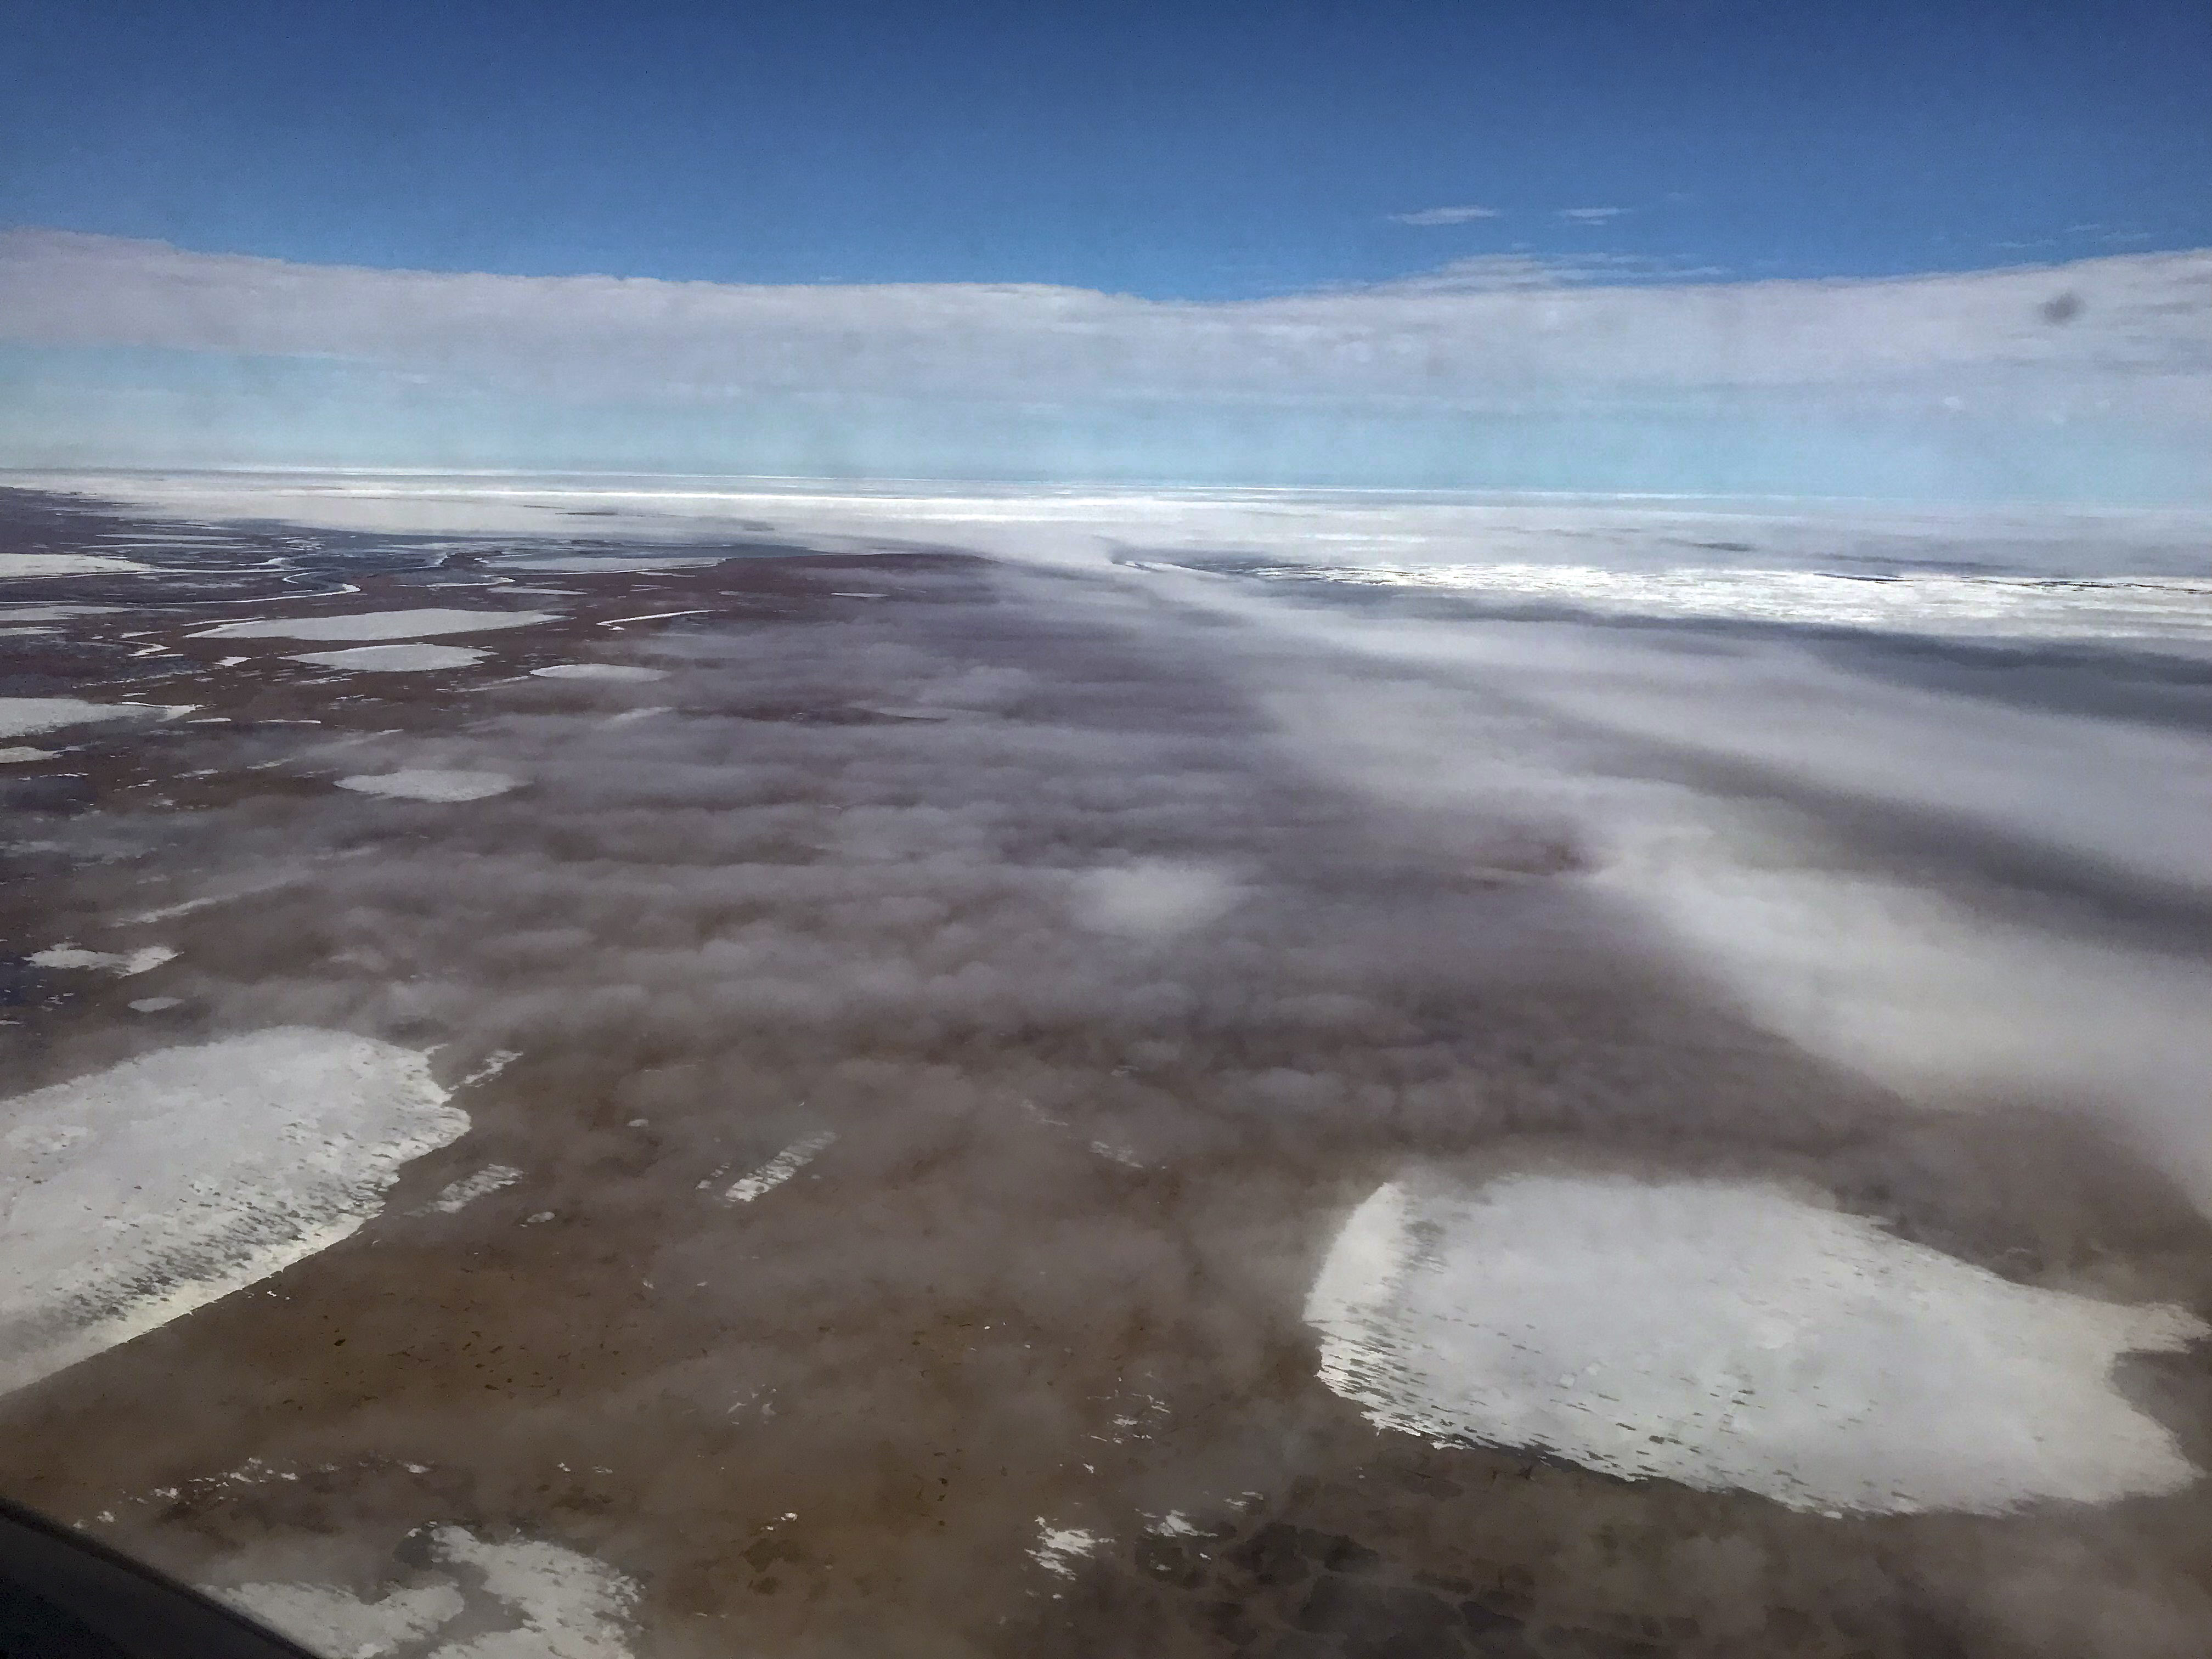
A low fog covered much of the coast in the morning.
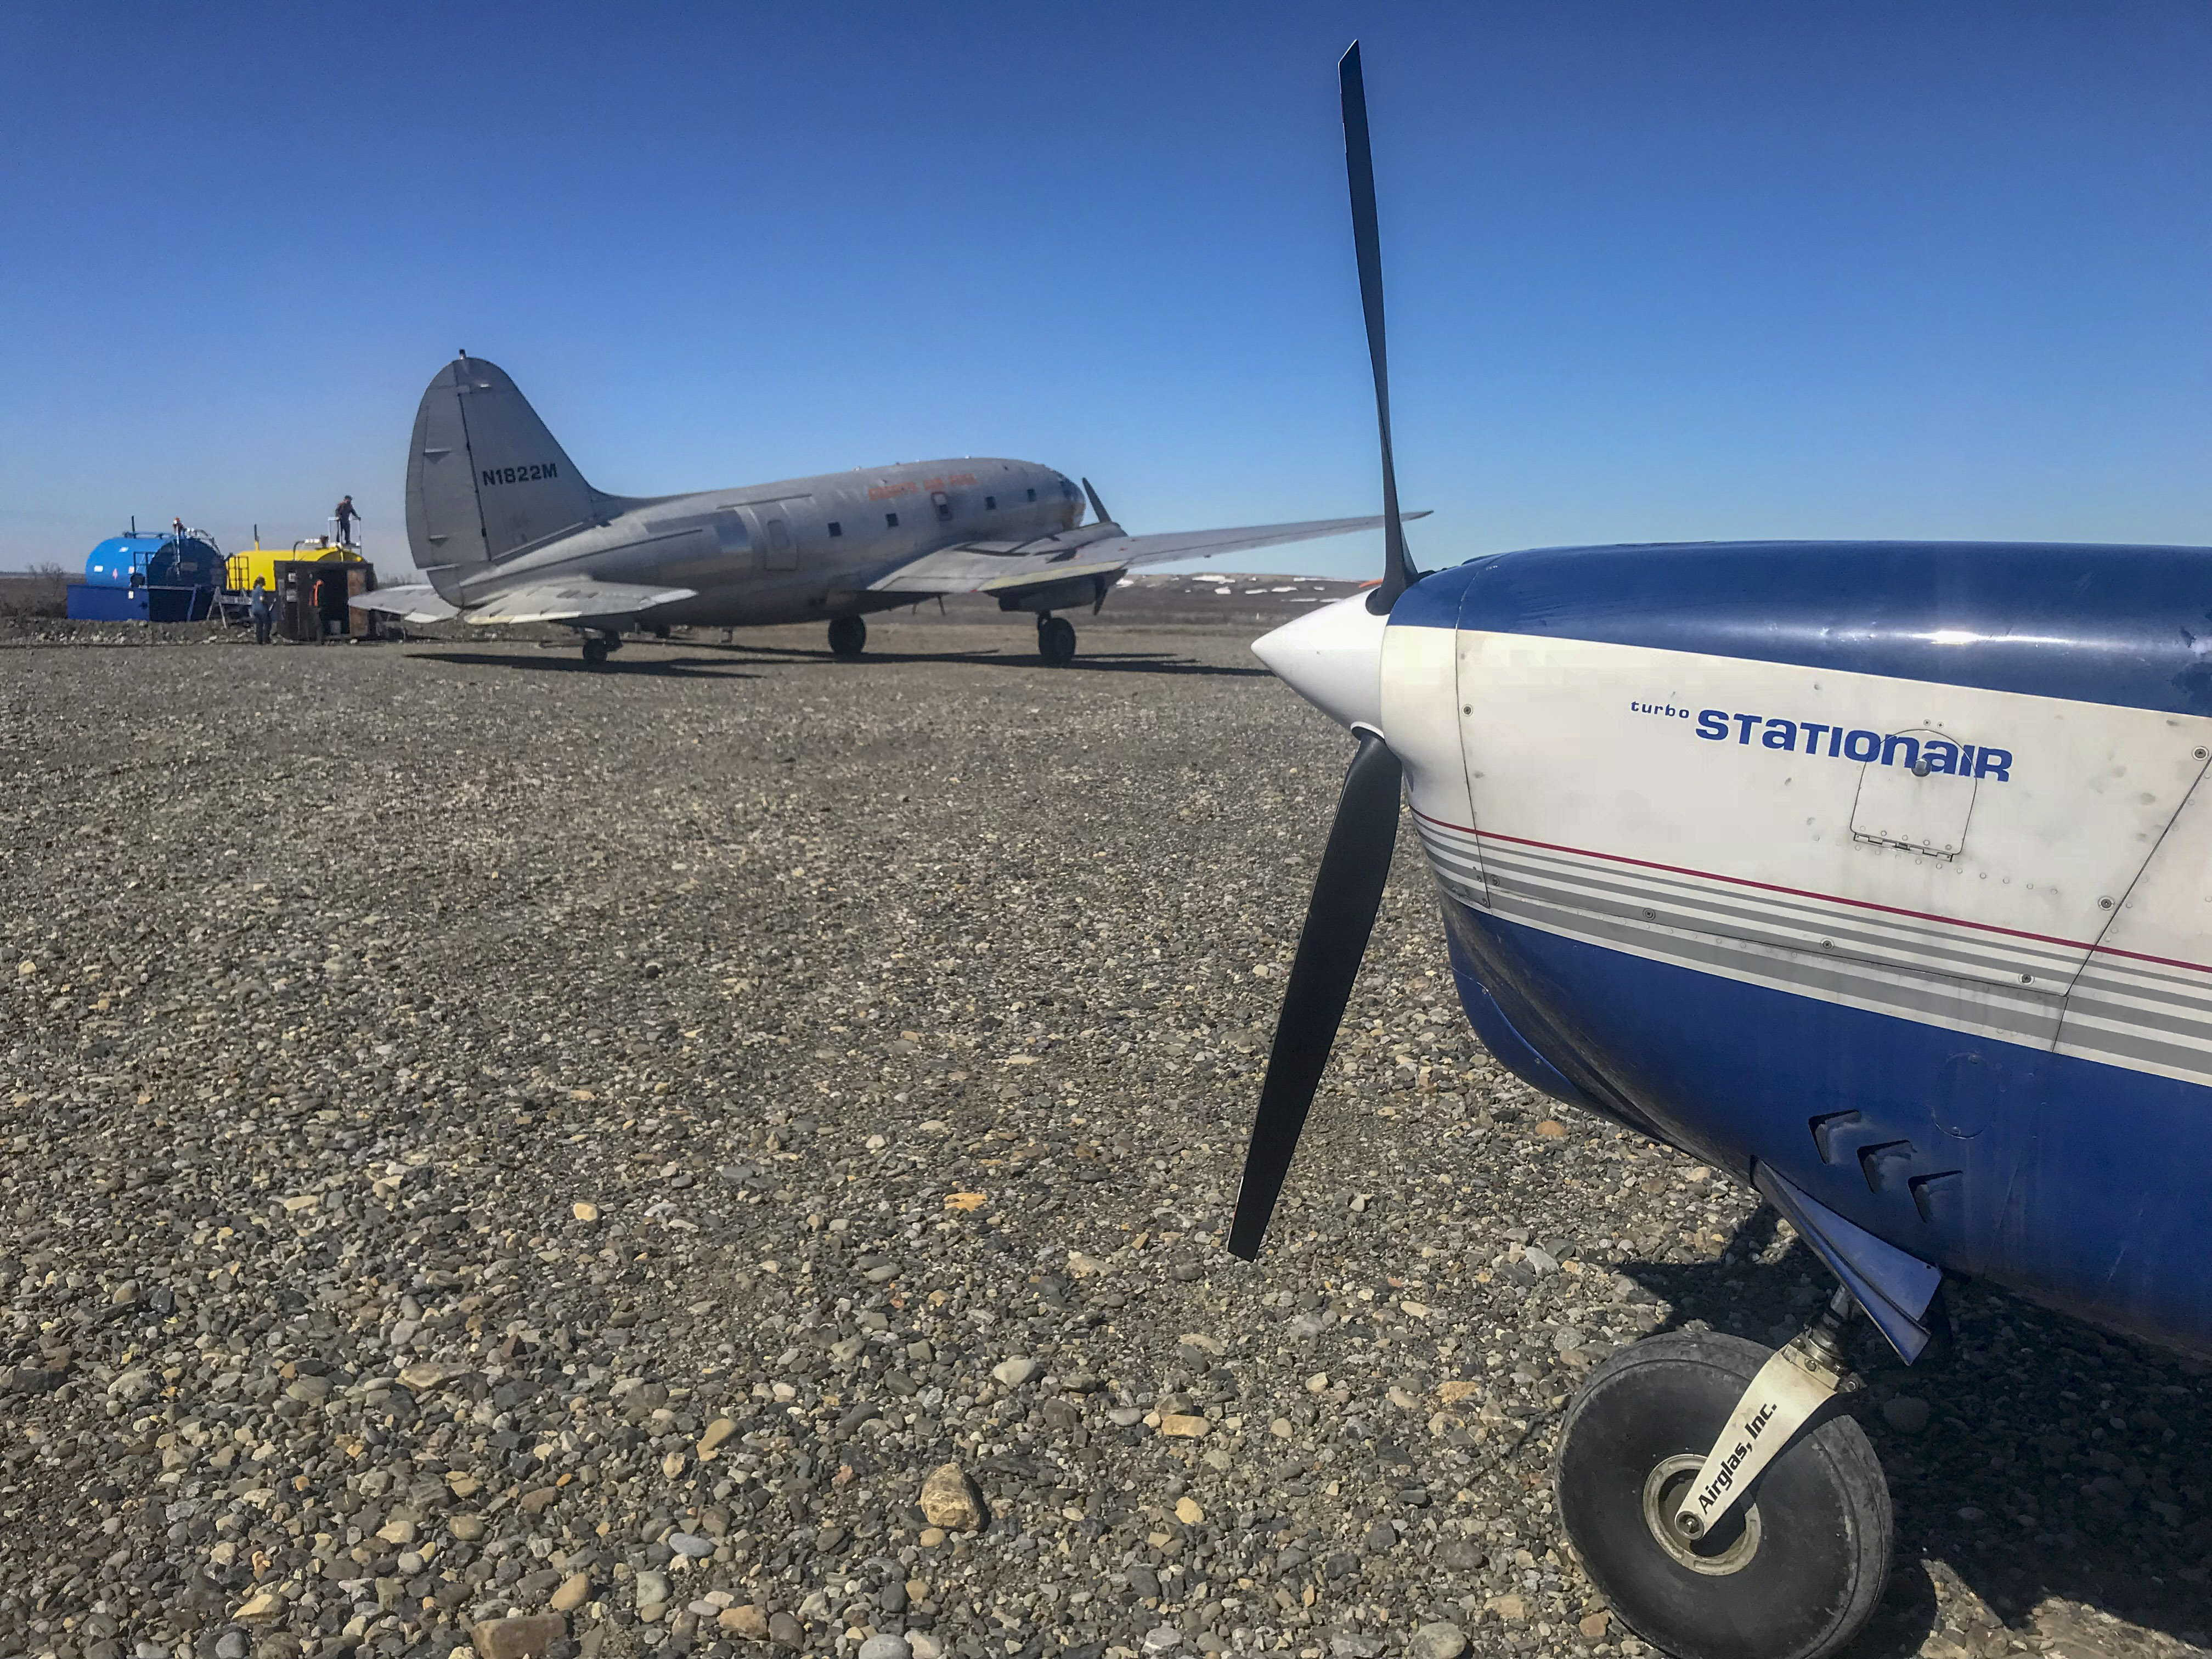
I returned to refuel in Kavik mid day to find Everts’ C46 topping off the tanks — 4000 gallons is enough for me! And that plane is the reason avgas here is $12/gallon… But worth every penny.
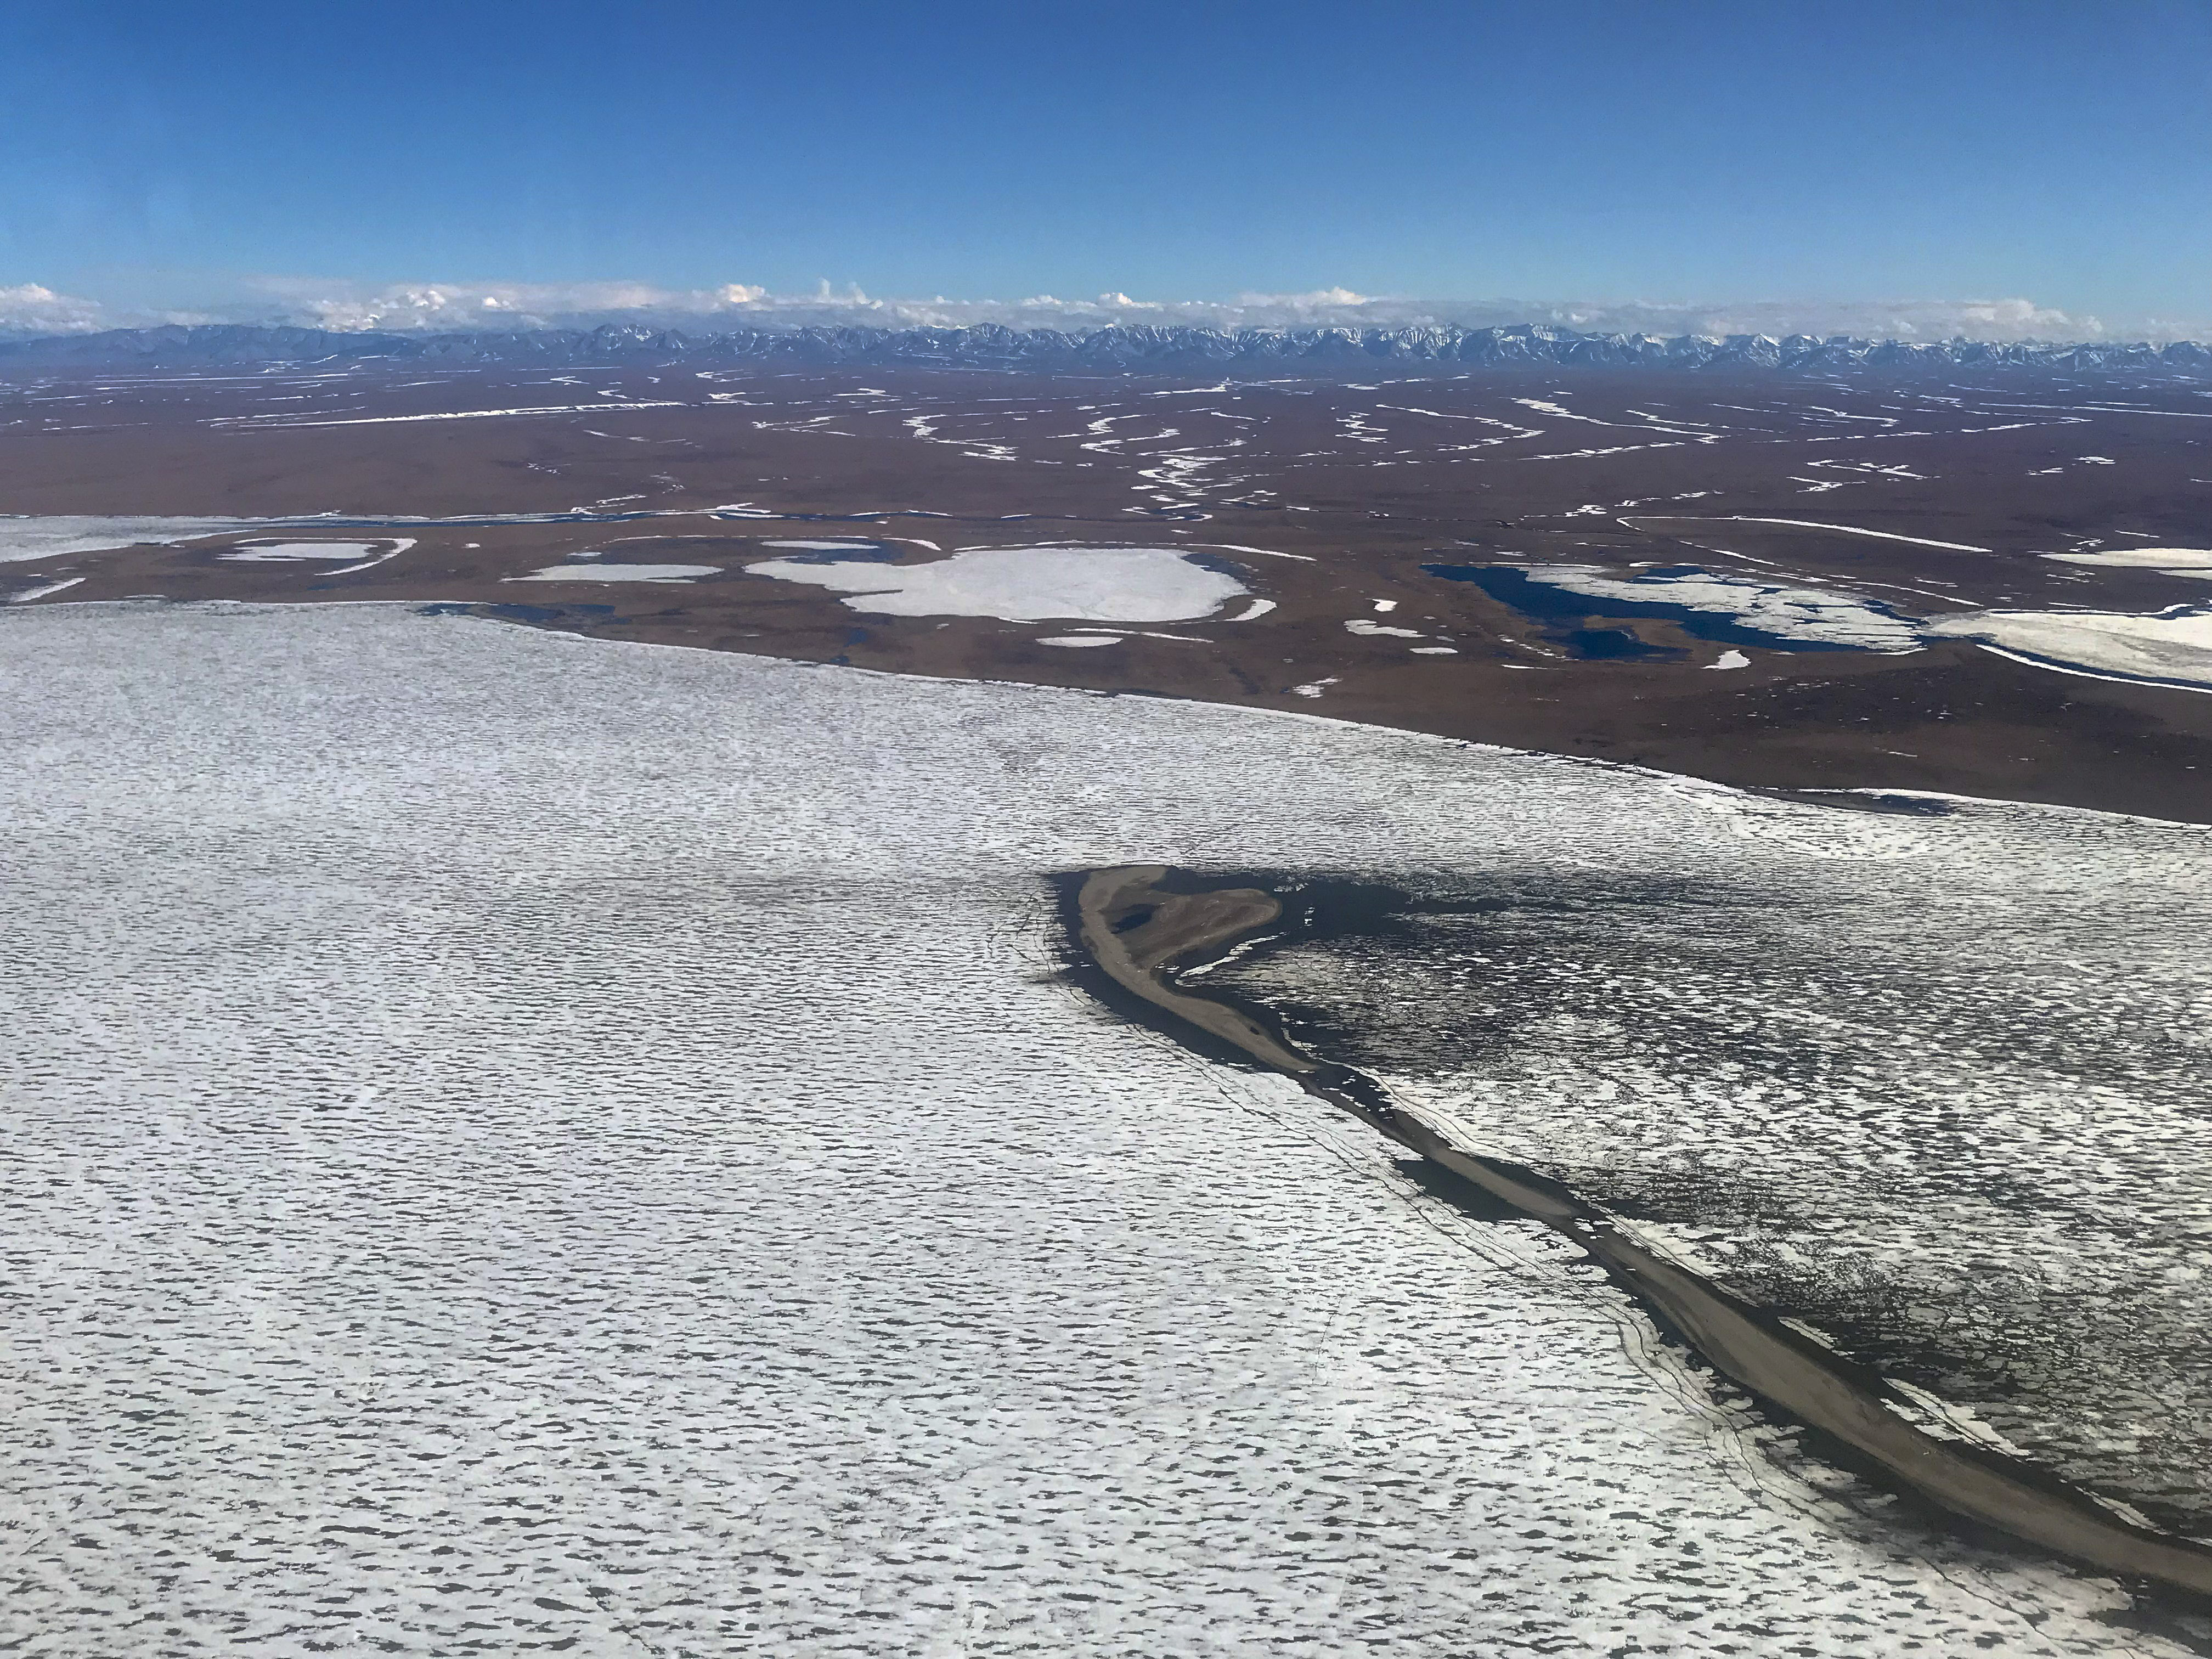
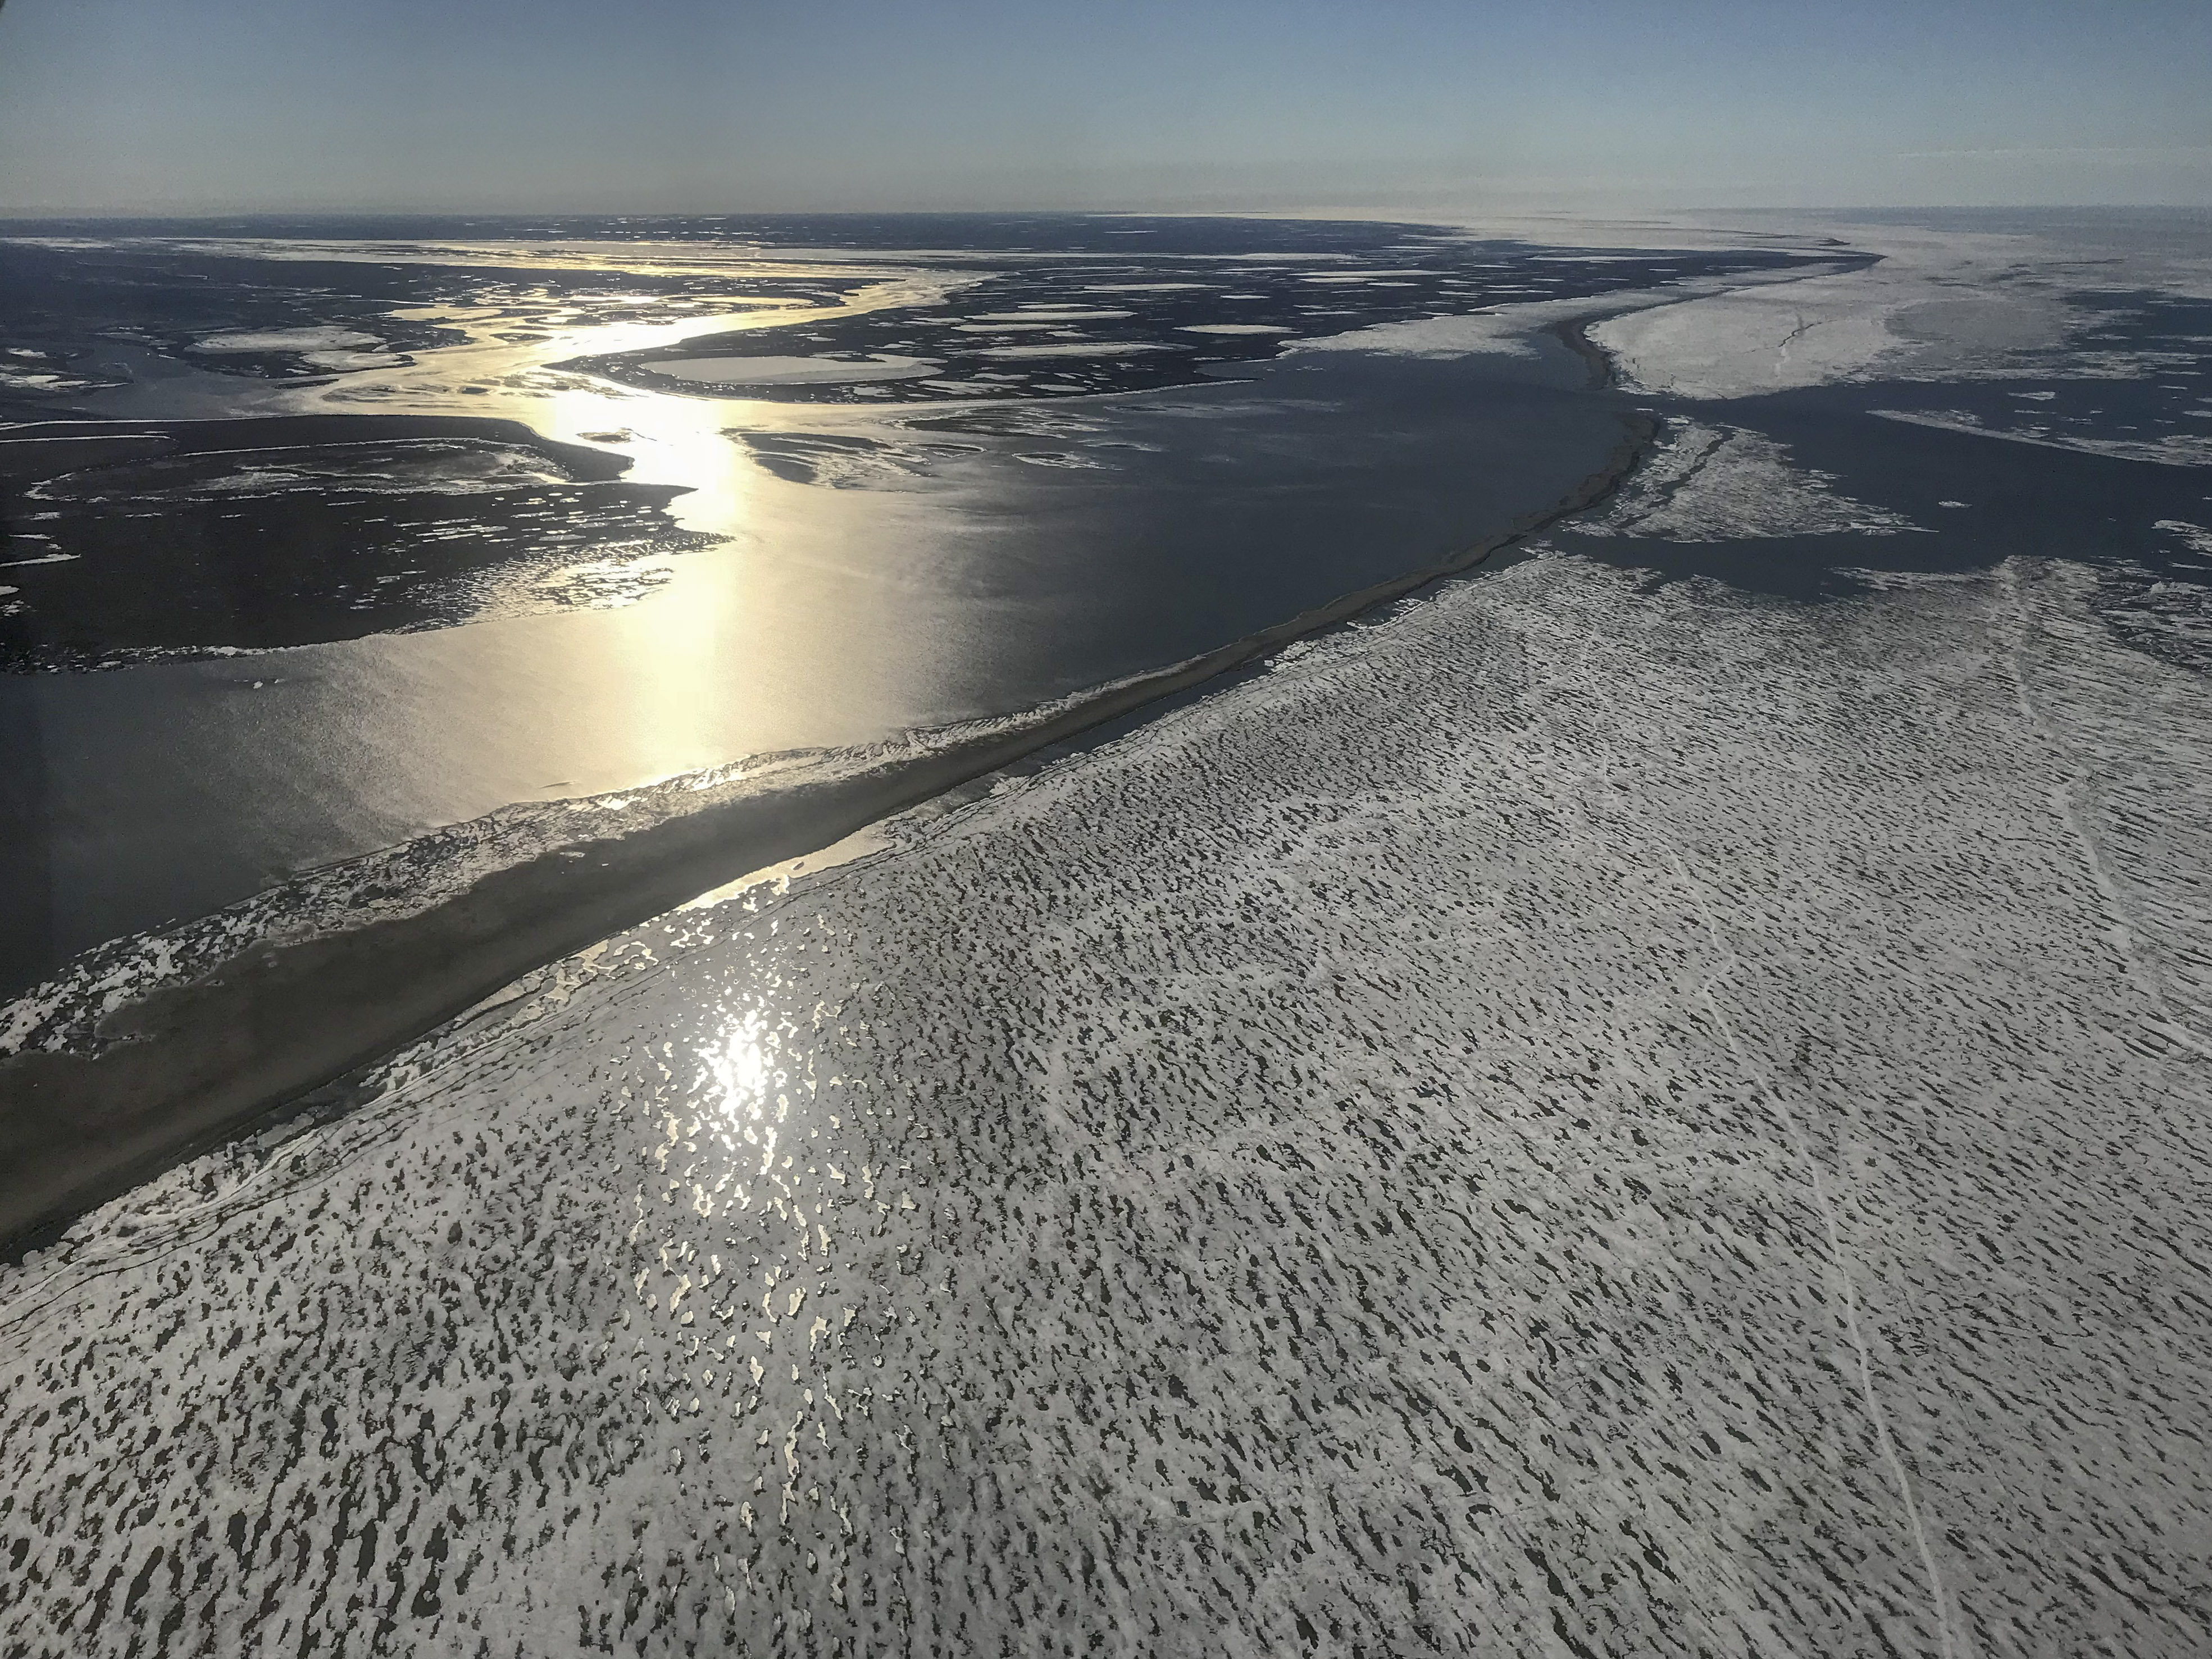
By afternoon, the coast had opened up and kept mapping until I ran out of fuel a second time. This is first year sea ice. Not that multi-year ice forms this close to the coast, but the dramatic wastage of multi-year ice further at sea is also having an equally dramatic impact on the landscape and ecology of the 1002 Area.
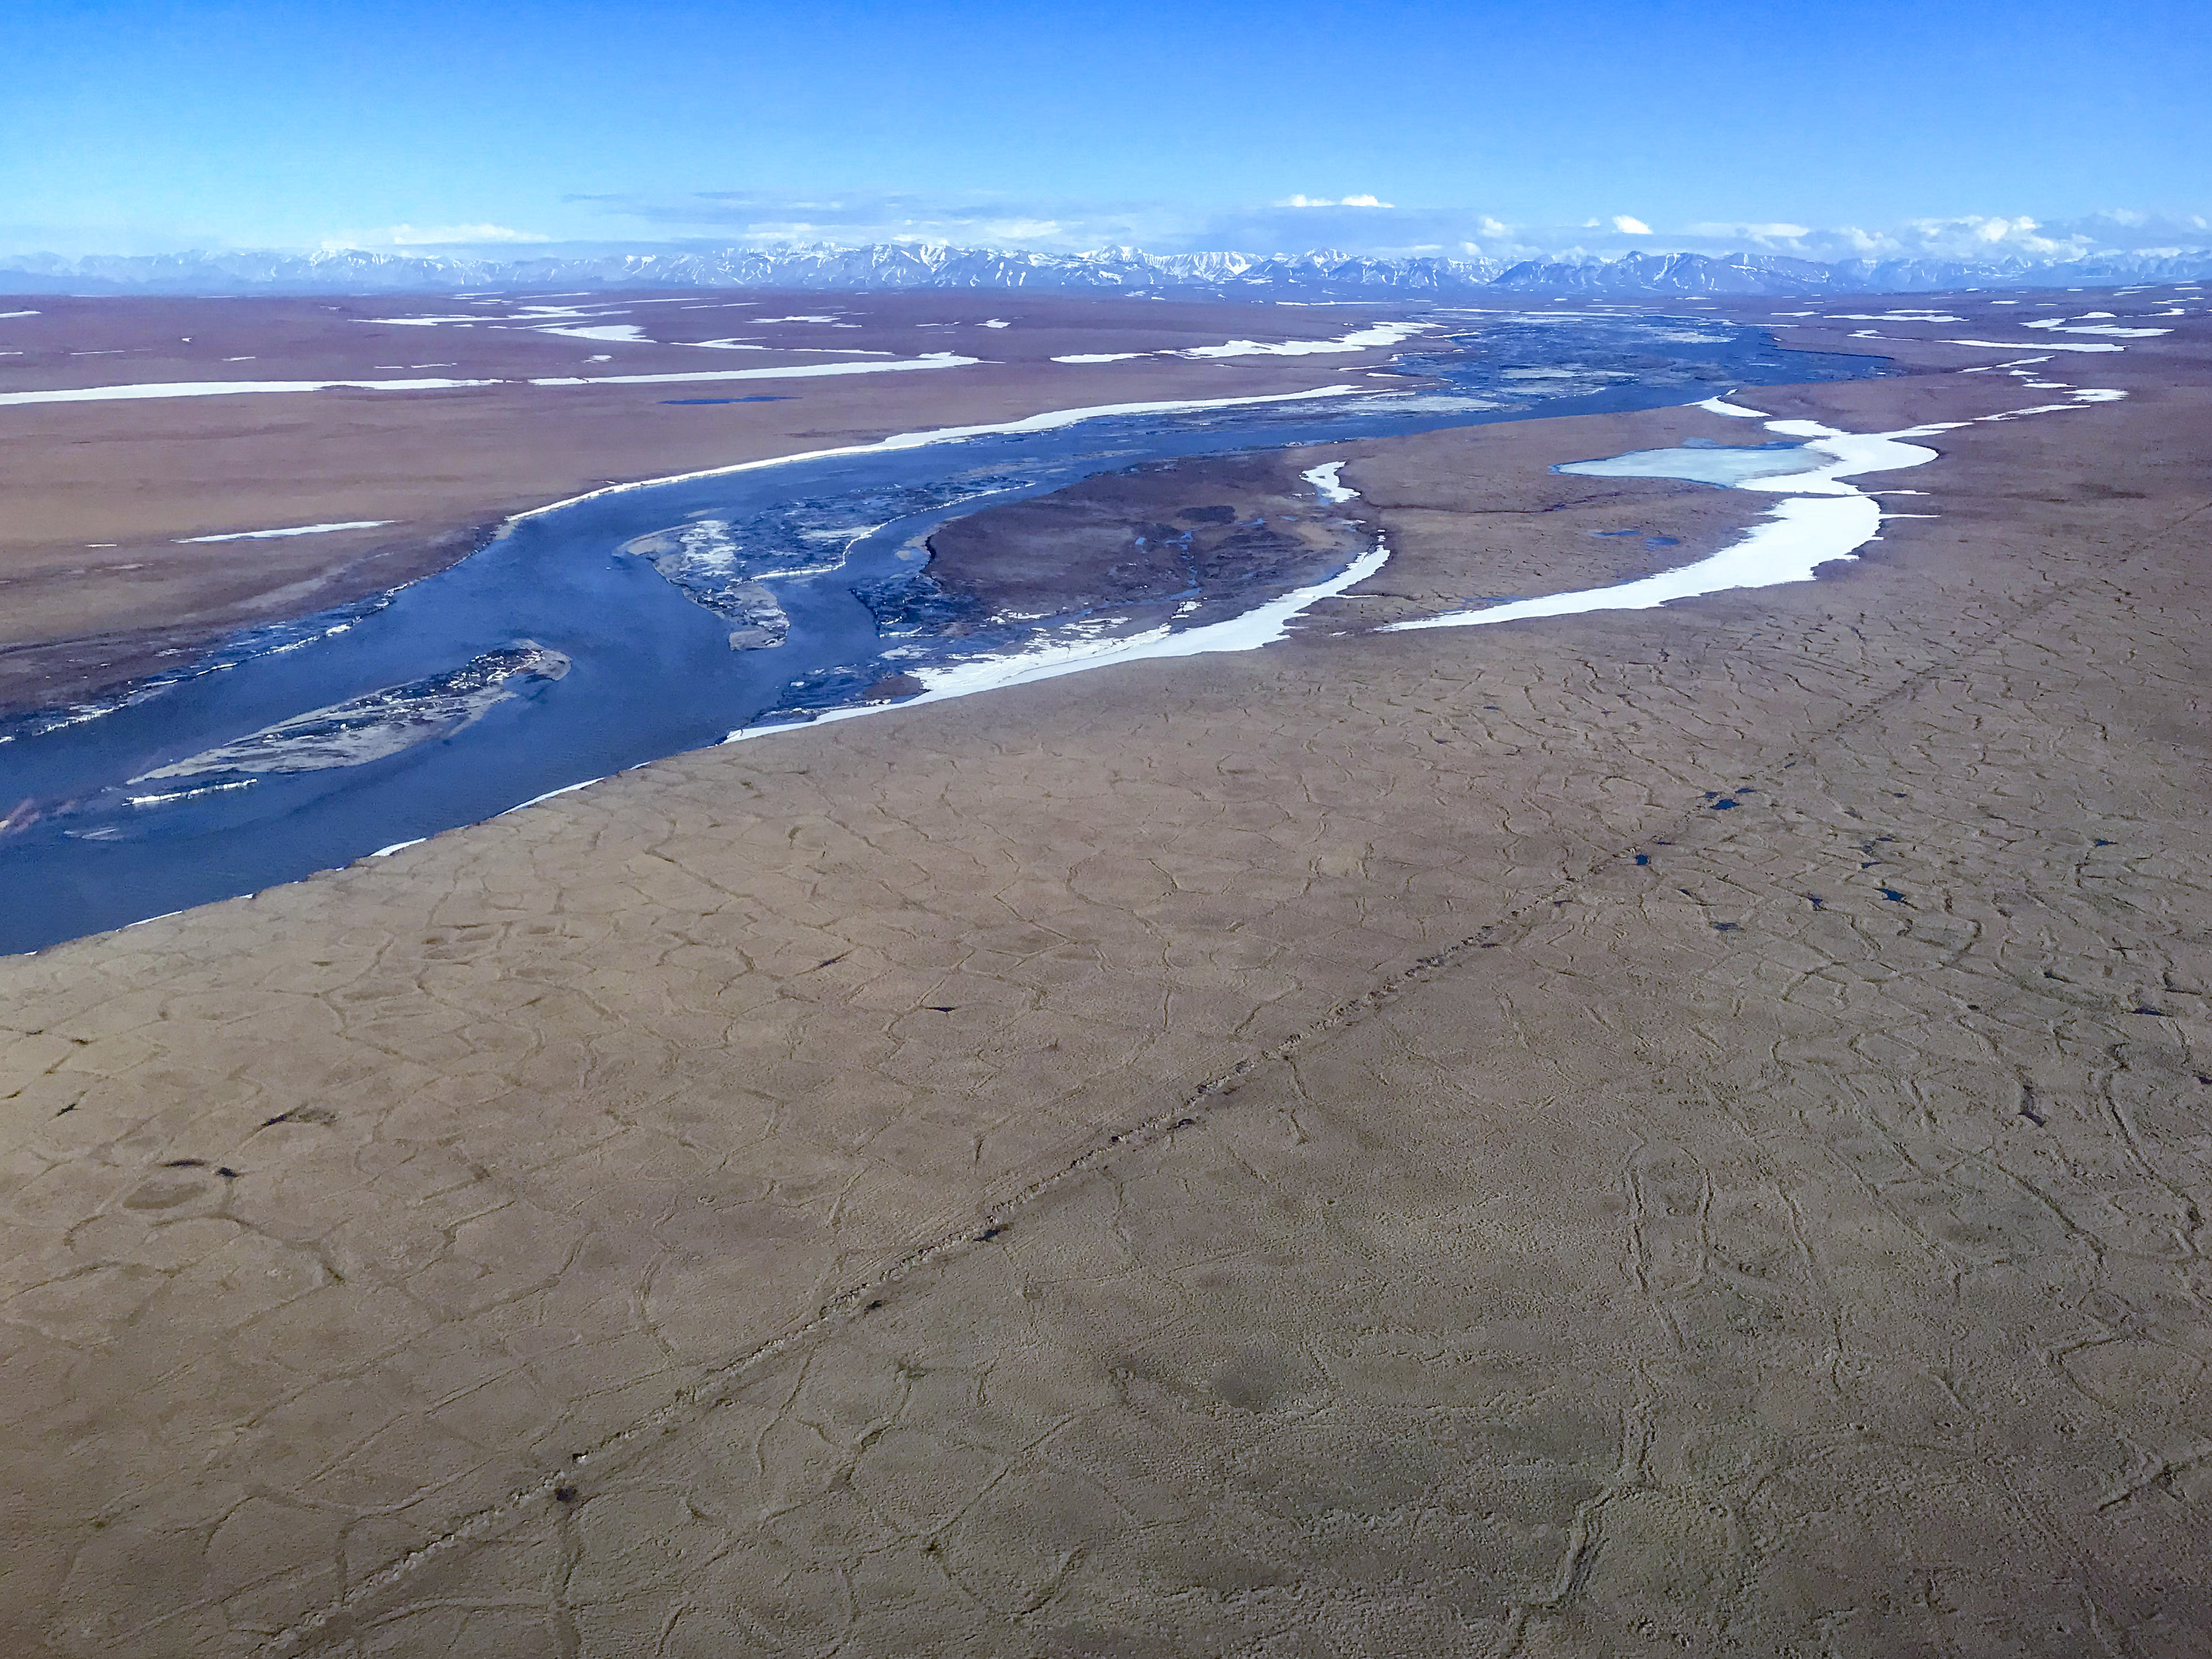
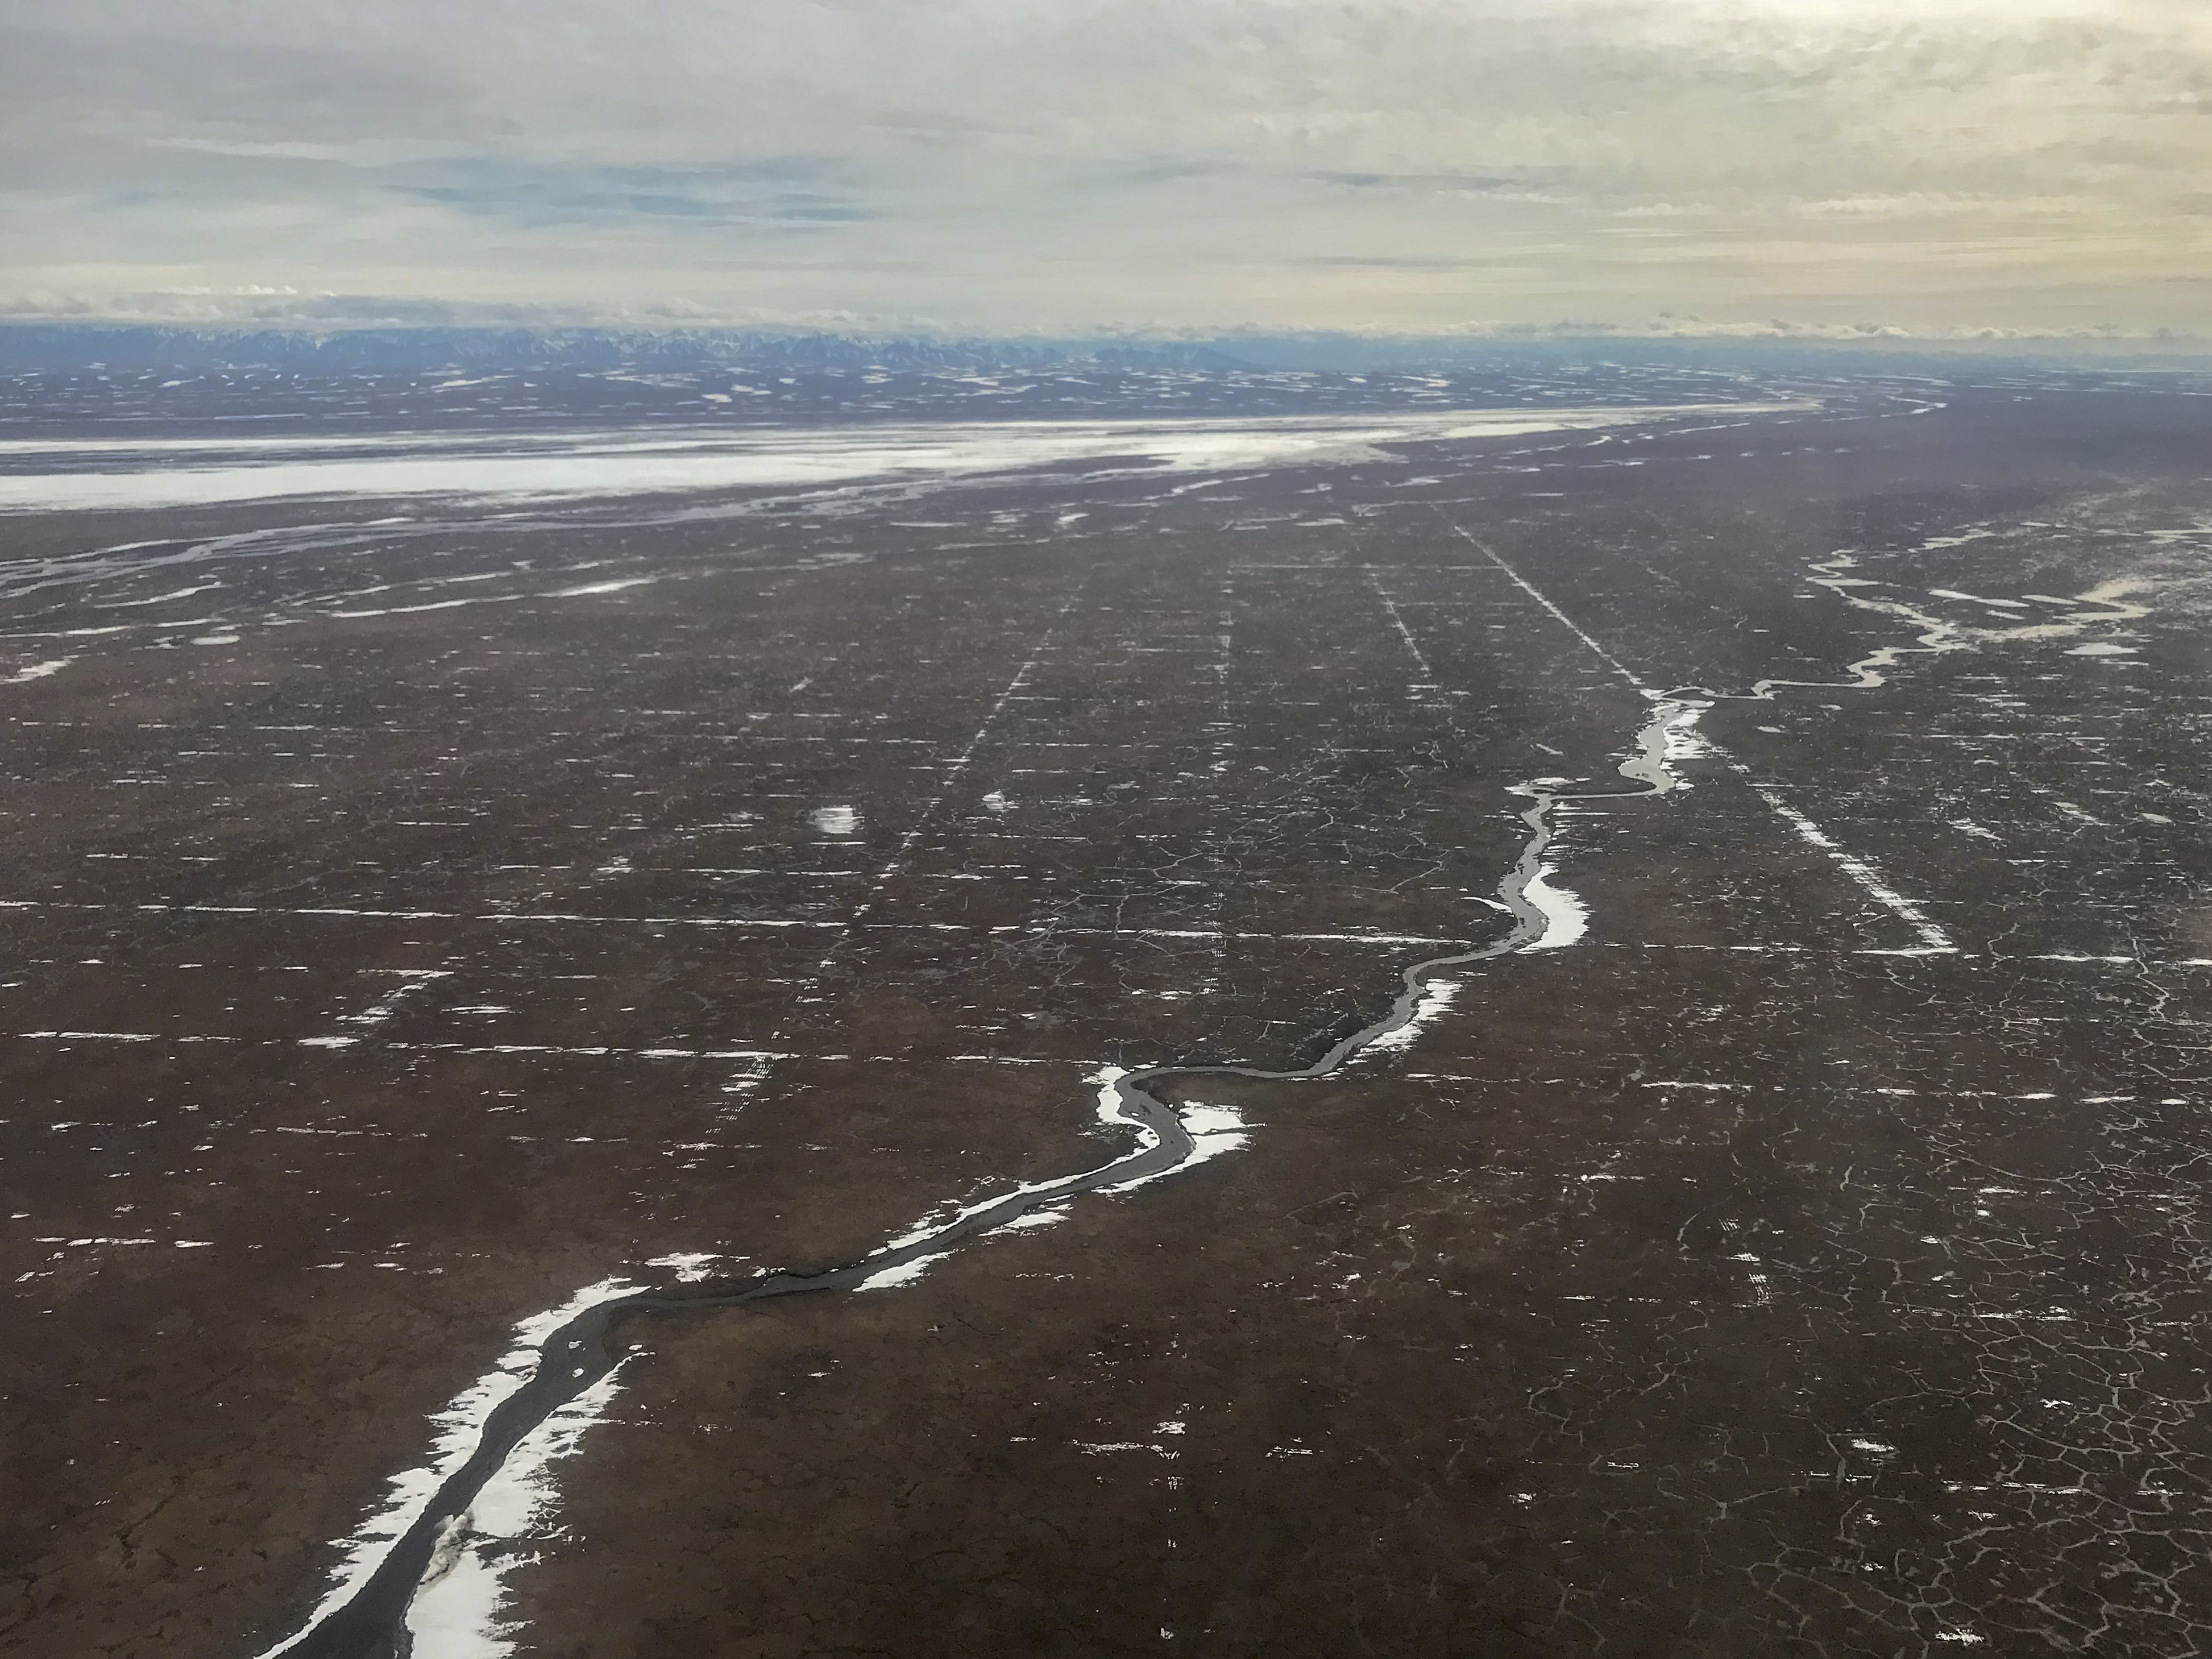
Another 25 year old seismic trail just outside the Refuge boundary, and also demonstrating how close the mountains are to the coast and how different this coastal plain is to the oil fields to the west.
Because of the steeper topography, there are fewer lakes here. Lake water is primary water source for ice roads used to support drilling on the west side. How will such roads be created here? The same technologies used in the west simply cannot be used here.
Another 8-9 days of weather like this is all I need! Besides a functional aircraft, lots of avgas, food and lodging, …
 It was a great day! What a relief to actually start working rather than just thinking about working…
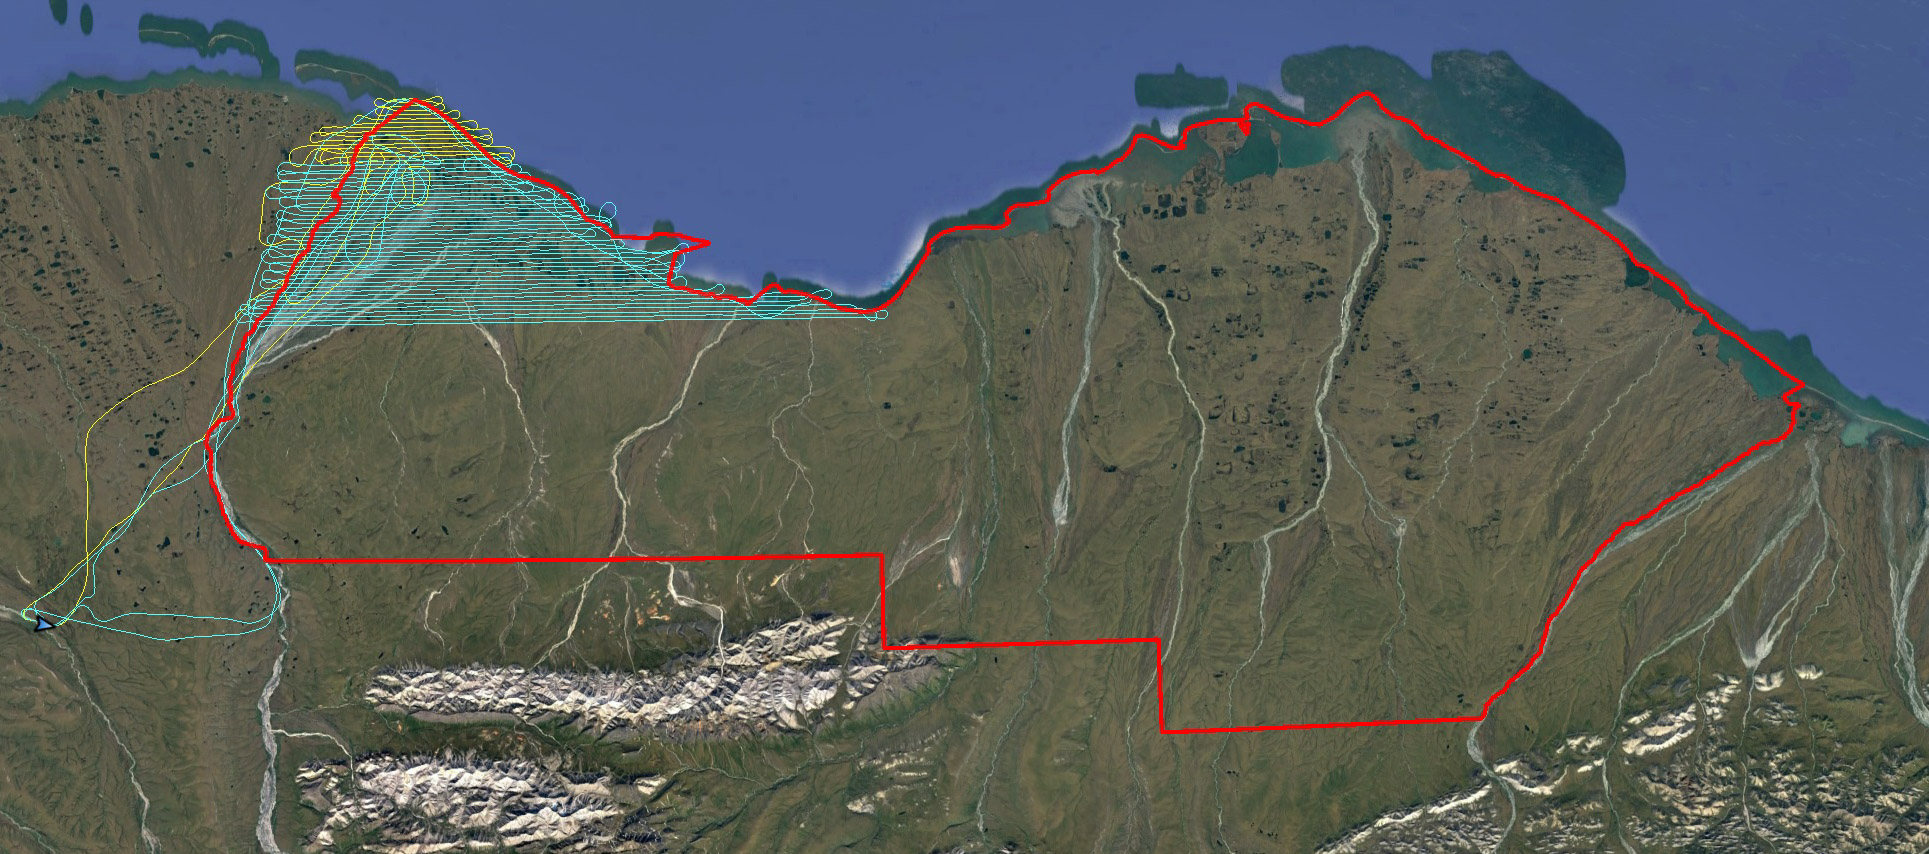
The blue lines were my second day’s progress.
Having flown so late the night before, my third day of mapping (Tuesday June 27) didn’t start until about noon. It was just as well as it took that long for the fog to burn off in Kavik. The forecast had called for the coast around Barter Island to open today, so I thought to map there as that location has the worst weather in the 1002 Area. But as I got close it became clear the forecast was off, so I returned to extend my lines from yesterday further inland and well outside of the coastal zone. This worked well, though I was being chased by the fog all day long. My lines run east-west and I was working my way south. The fog was coming from the north, extending inland about the same rate as my lines were moving inland. It didn’t outpace me until I returned for fuel, and that pit stop allowed it to catch up a bit. But I was able to get another big wob of lines done before it overwhelmed me. “Only” an 9 hour day, but I’ll take it!
I was secretly glad for the fog, gave me a chance to nap and catch up on data processing…
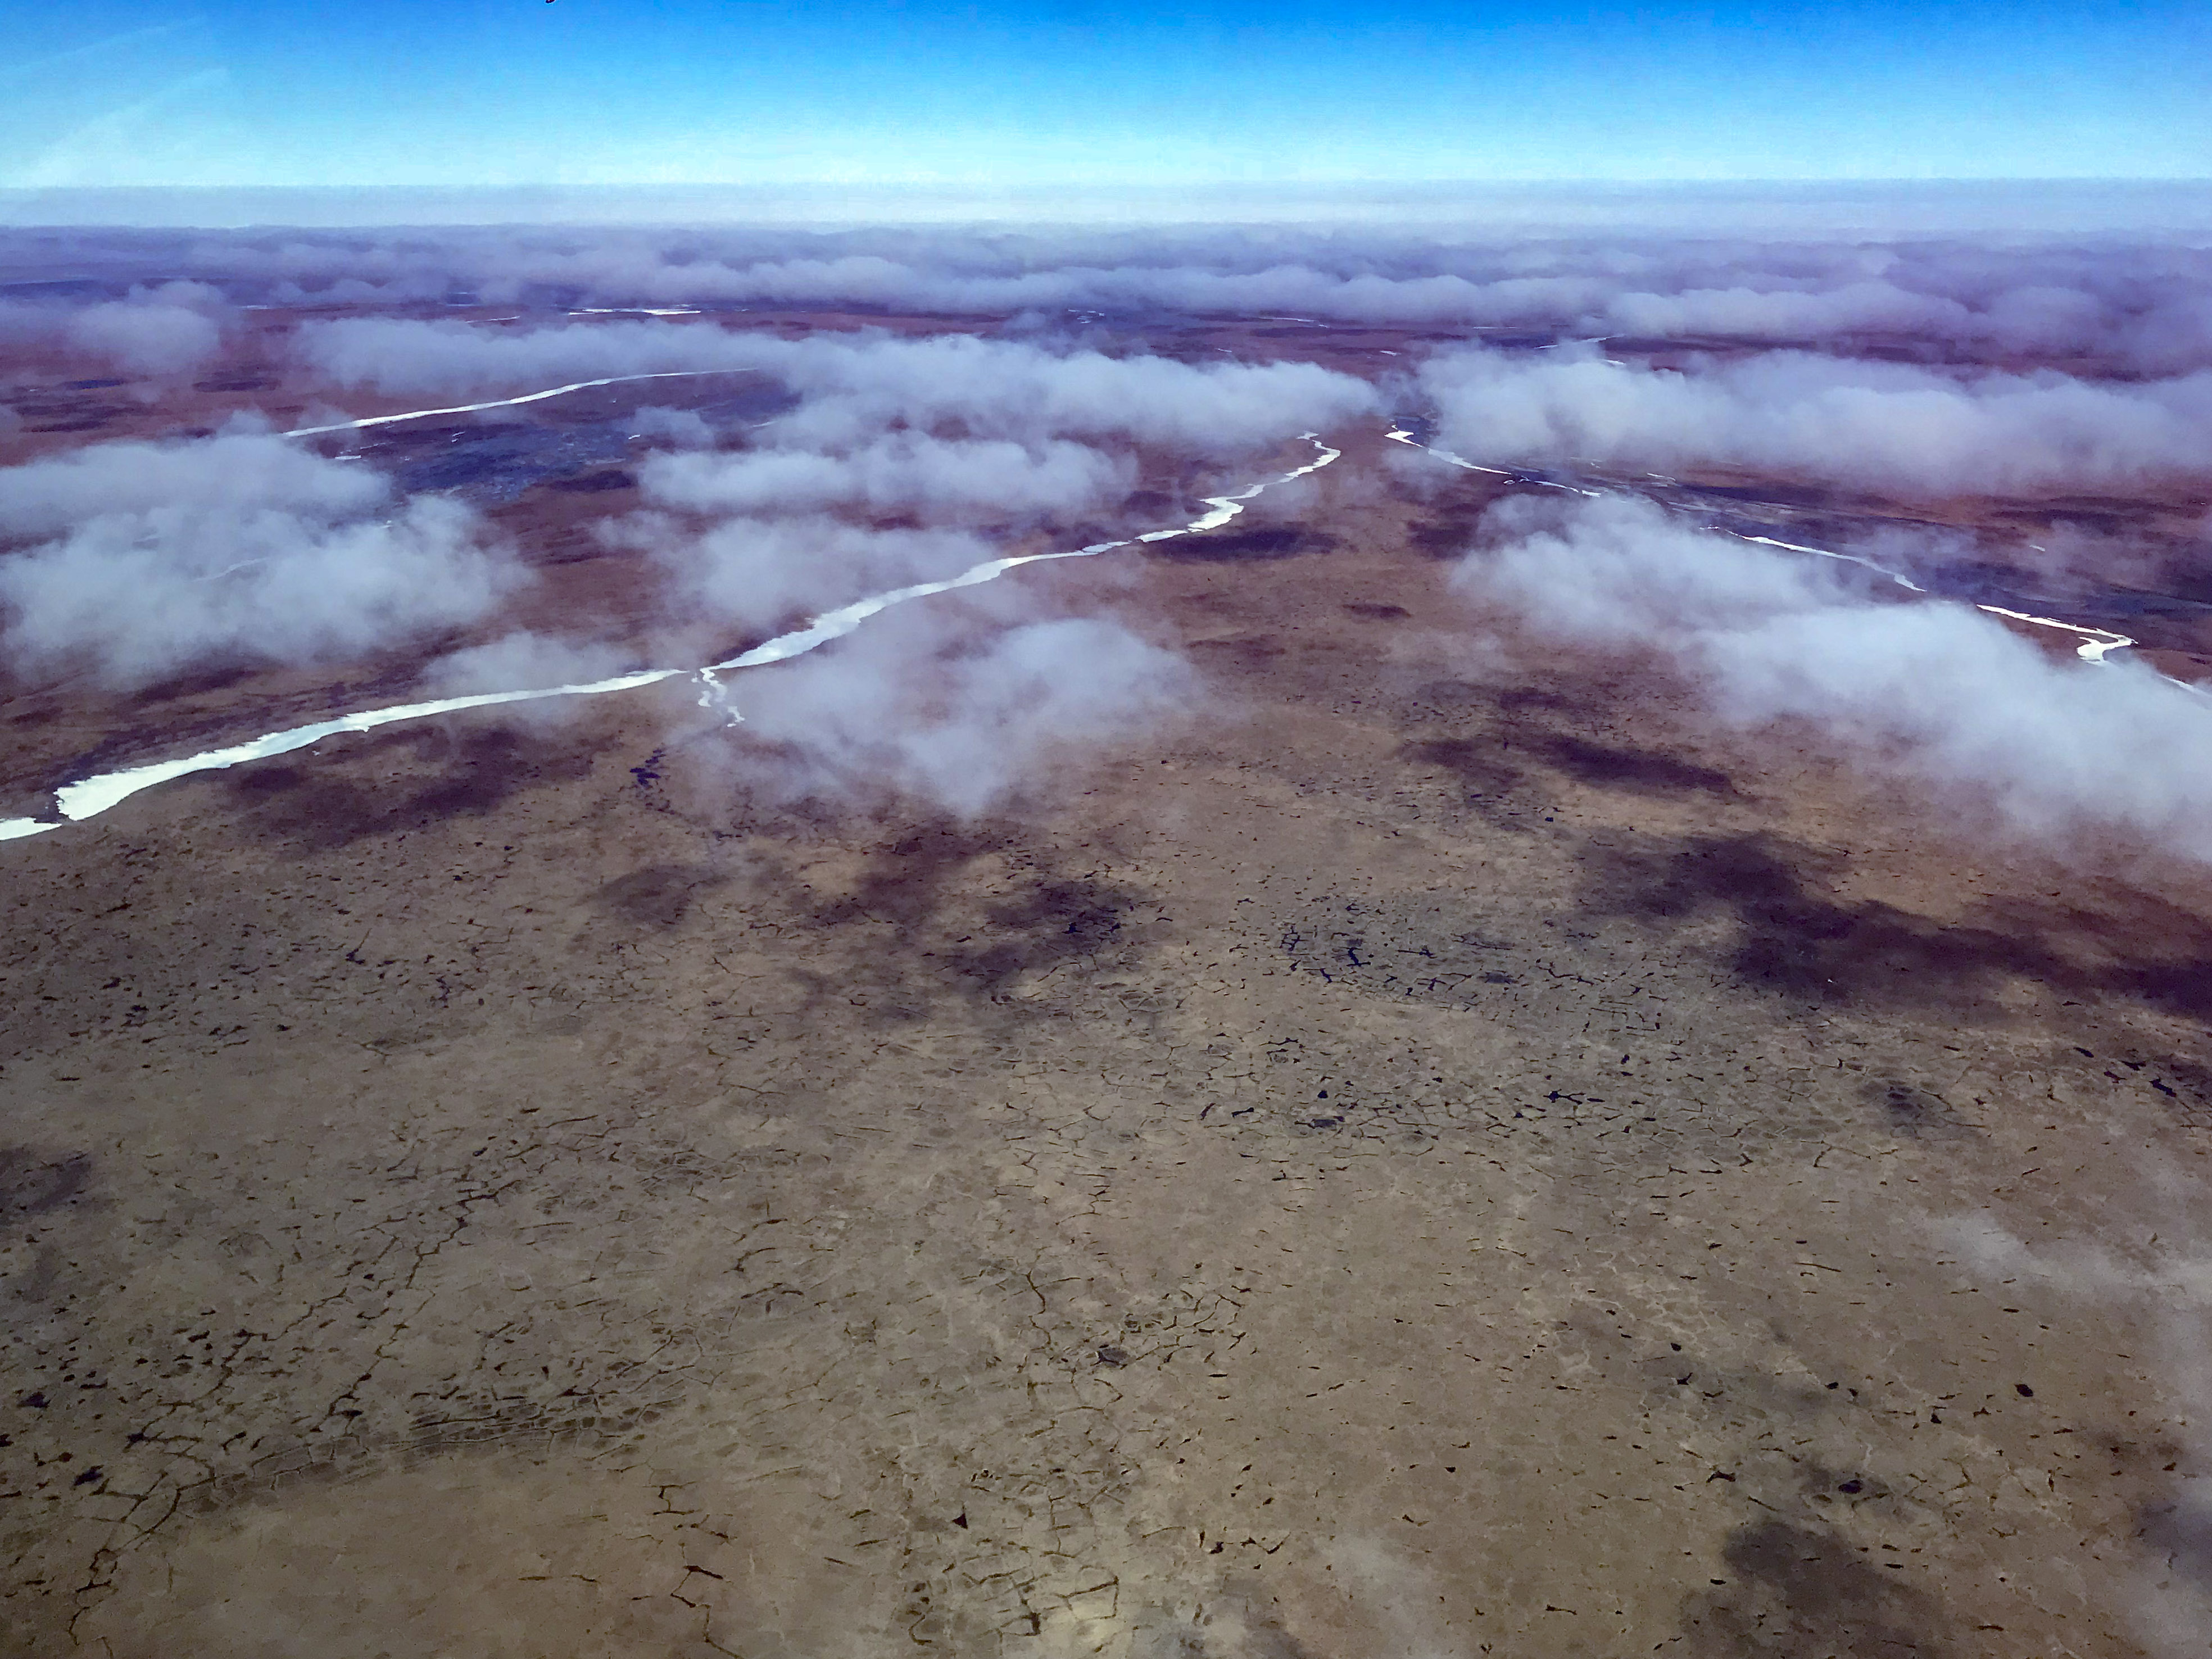 A low fog on the coast gradually followed me inland as I mapped.
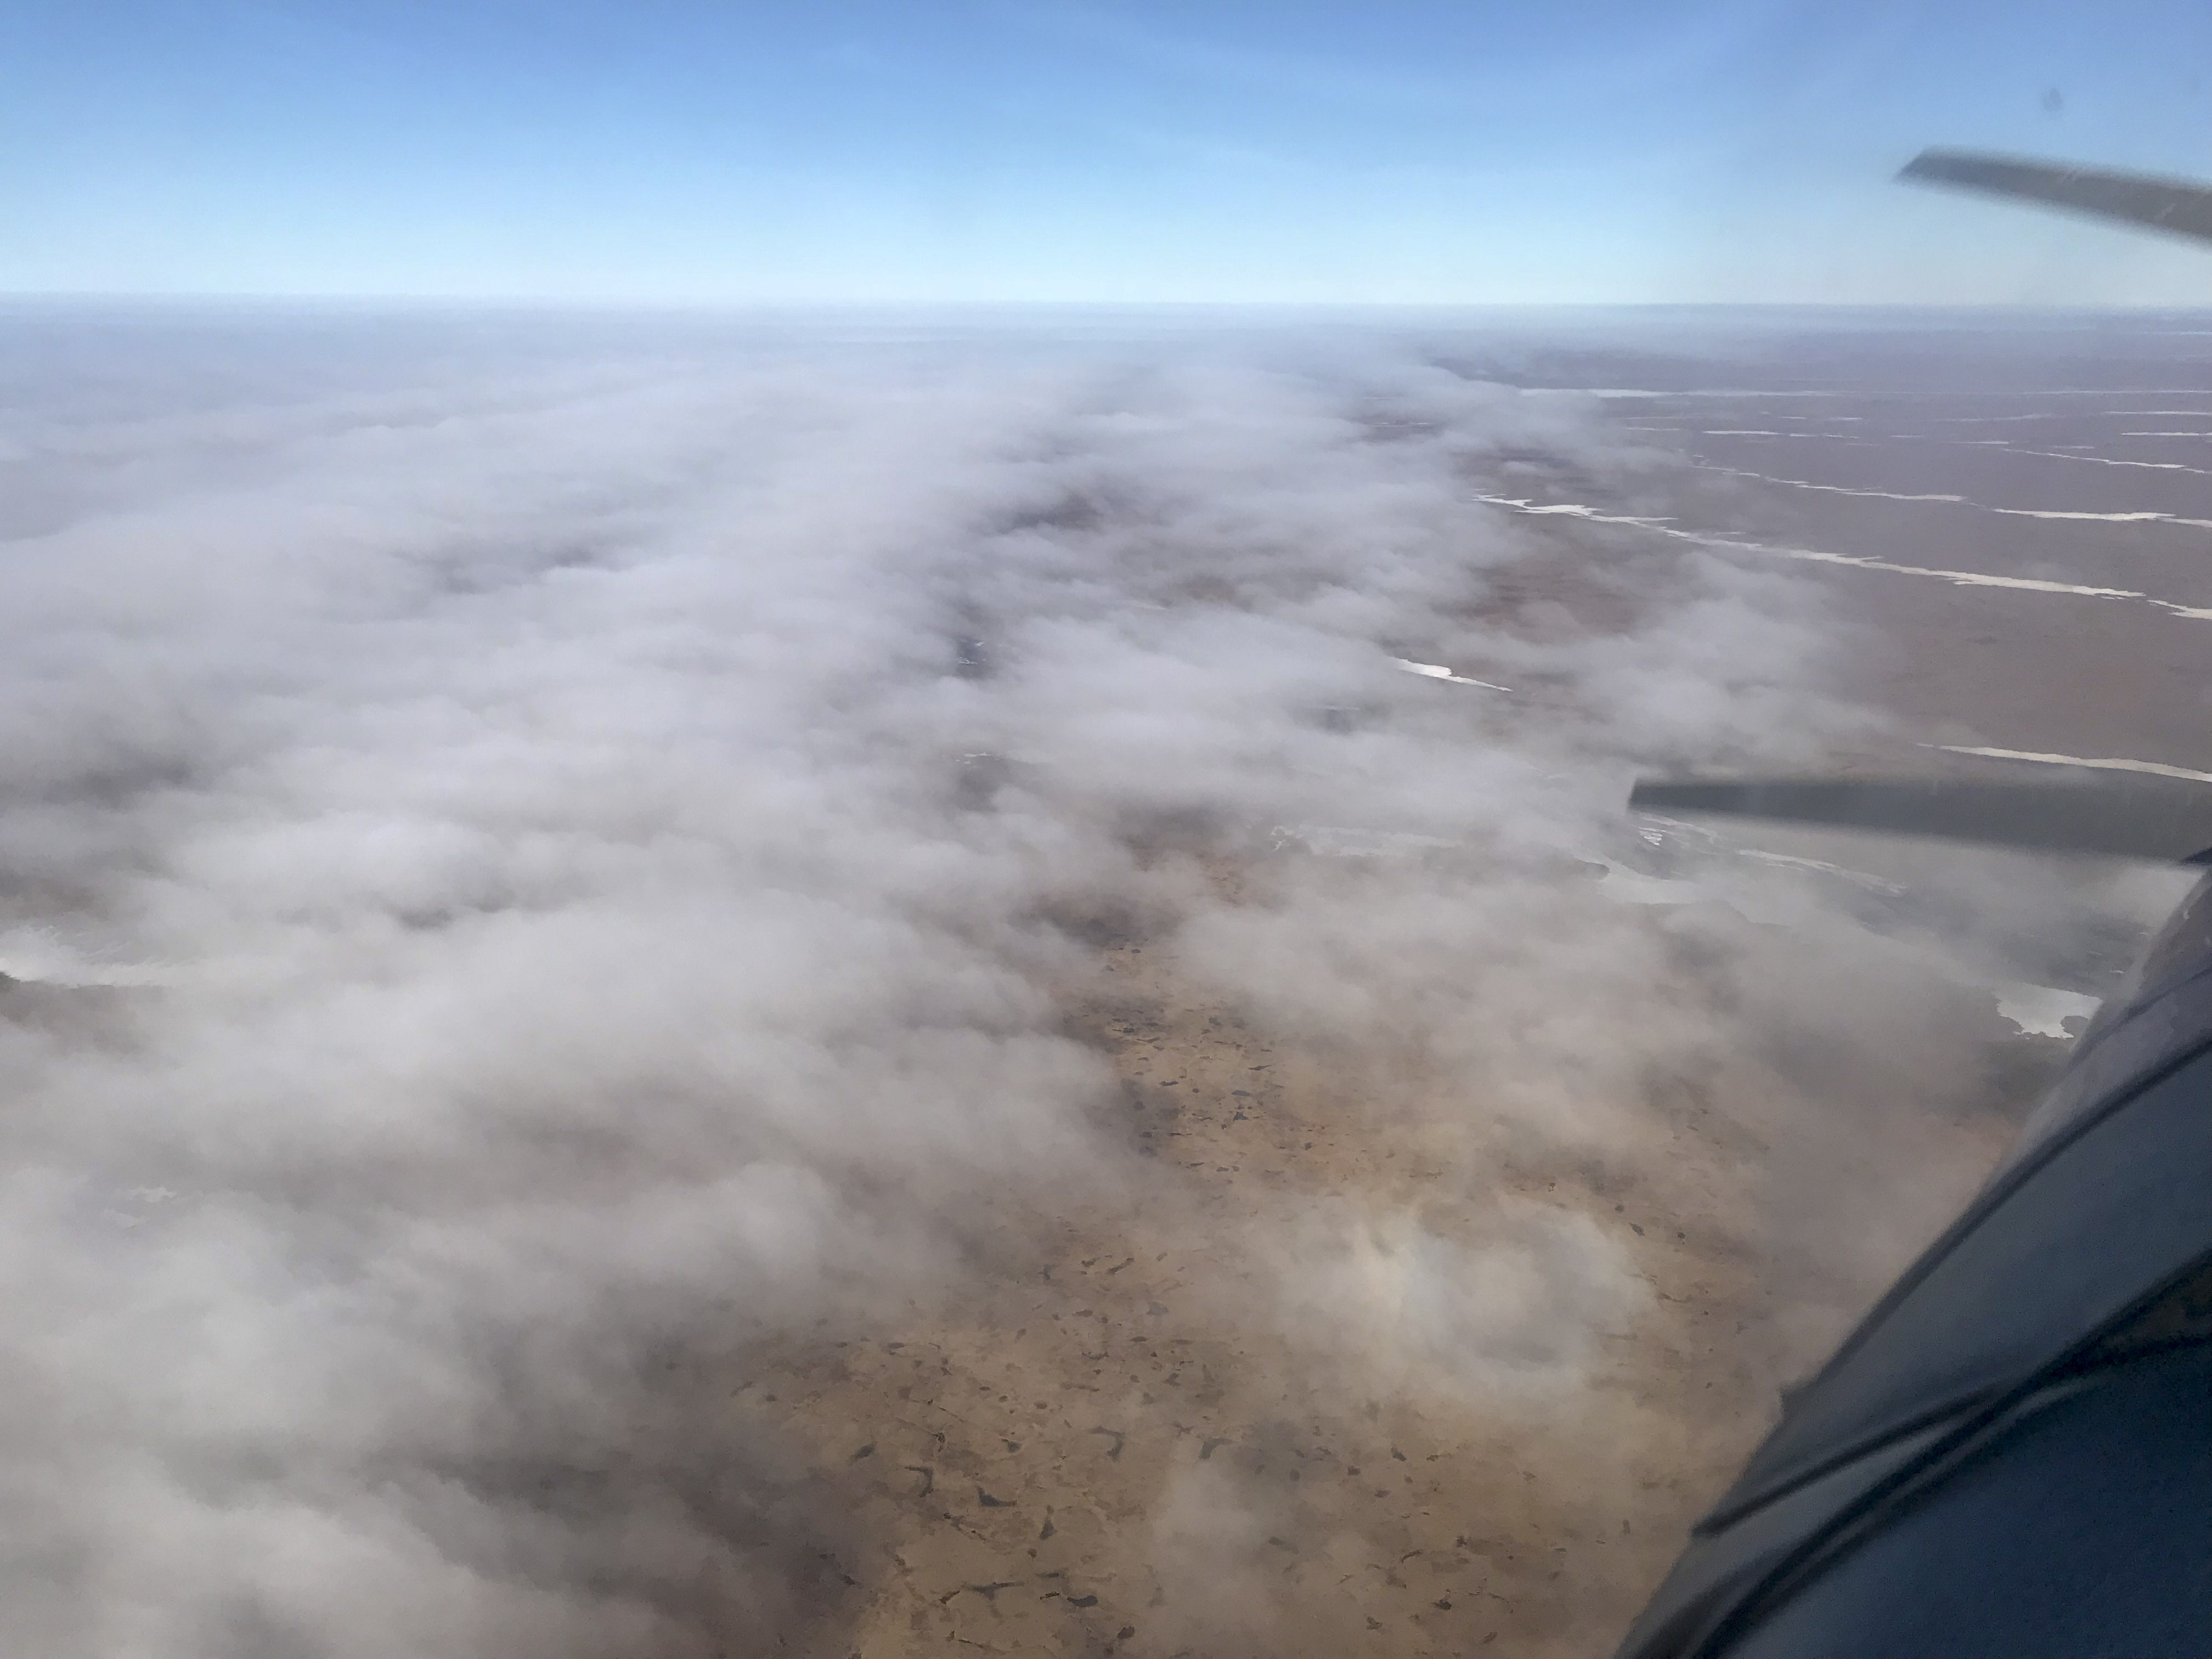 It eventually caught me.
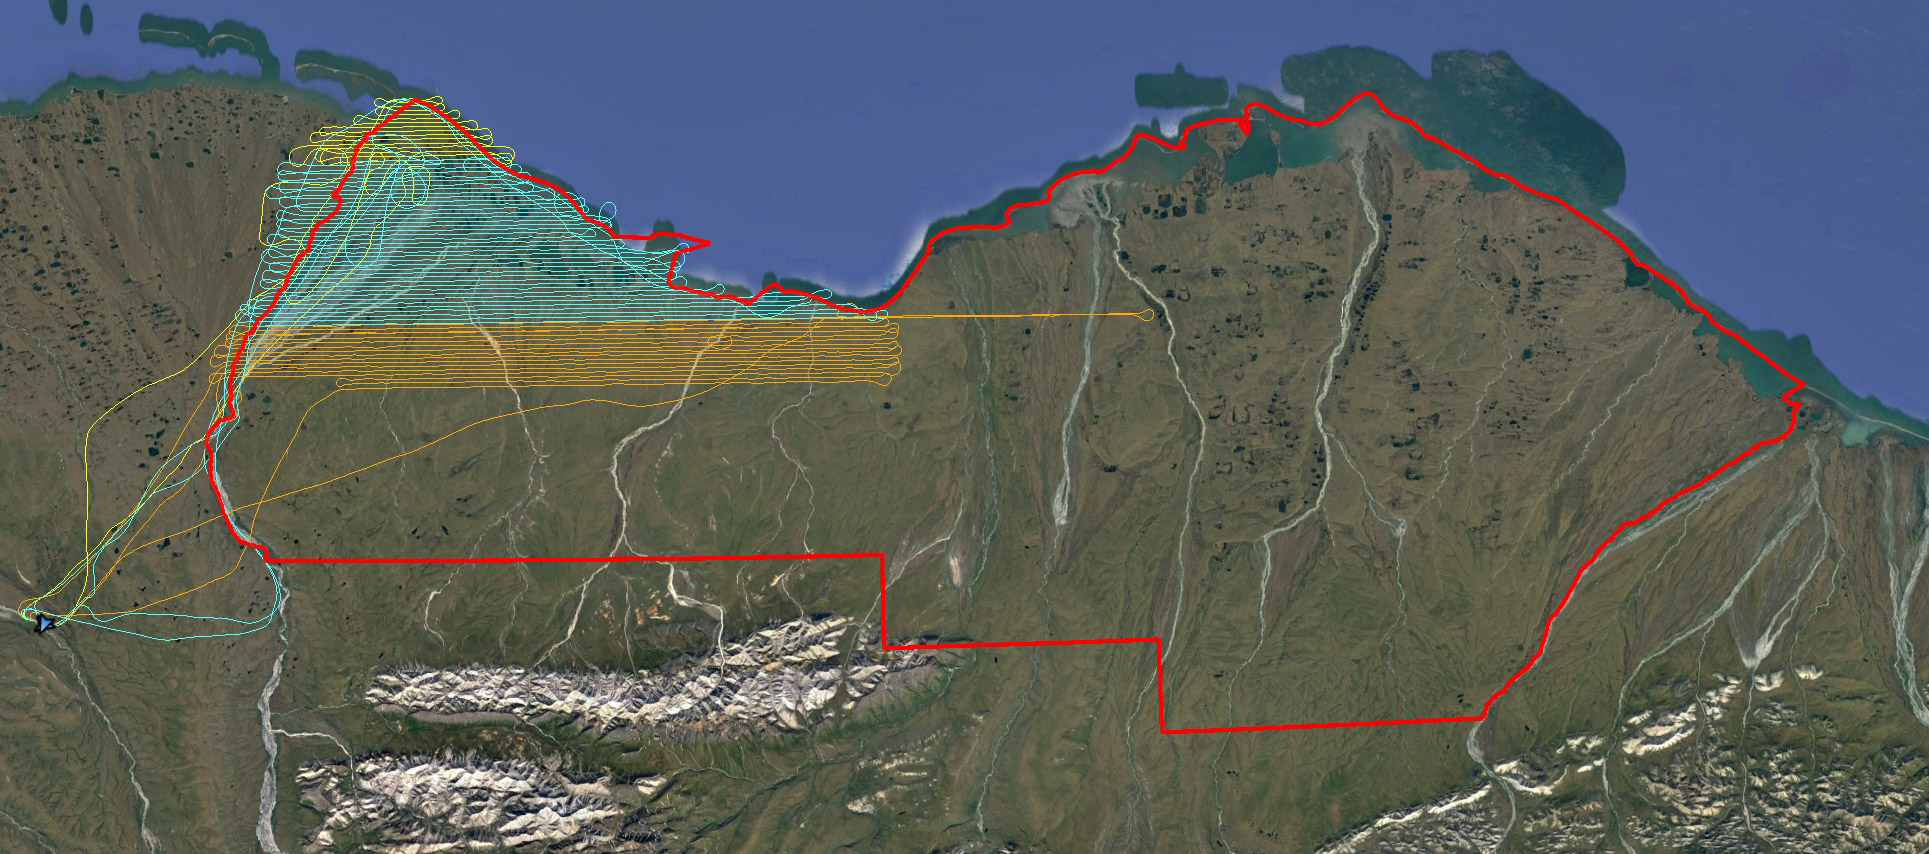
My third day’s lines are in orange. Bit by bit, making progress.
The next morning I decided to leave Kavik and return home briefly. The weather forecast for Thursday and Friday were poor, and I had be back in Fairbanks to see my son’s performance in Hamlet, which he had rehearsing for the past month. Plus I discovered that while taxiing back to park after fueling last night a rock put a decent-sized hole in my prop. This happened about a month earlier and cost me $9000. Fortunately this damage wasn’t as severe, but it did remind me of the risks of working out here — ten thousand dollar bills are the norm and that’s why it costs so much to work in the Arctic and that’s why so few people do it. And by now I had acquired about 15% of area with over 25,000 photos, so it seemed like a good time to head back to Fairbanks to dig into the data deeper to ensure everything was working properly before going the distance. I spent most of that time analyzing the tire tracks just outside of the 1002.
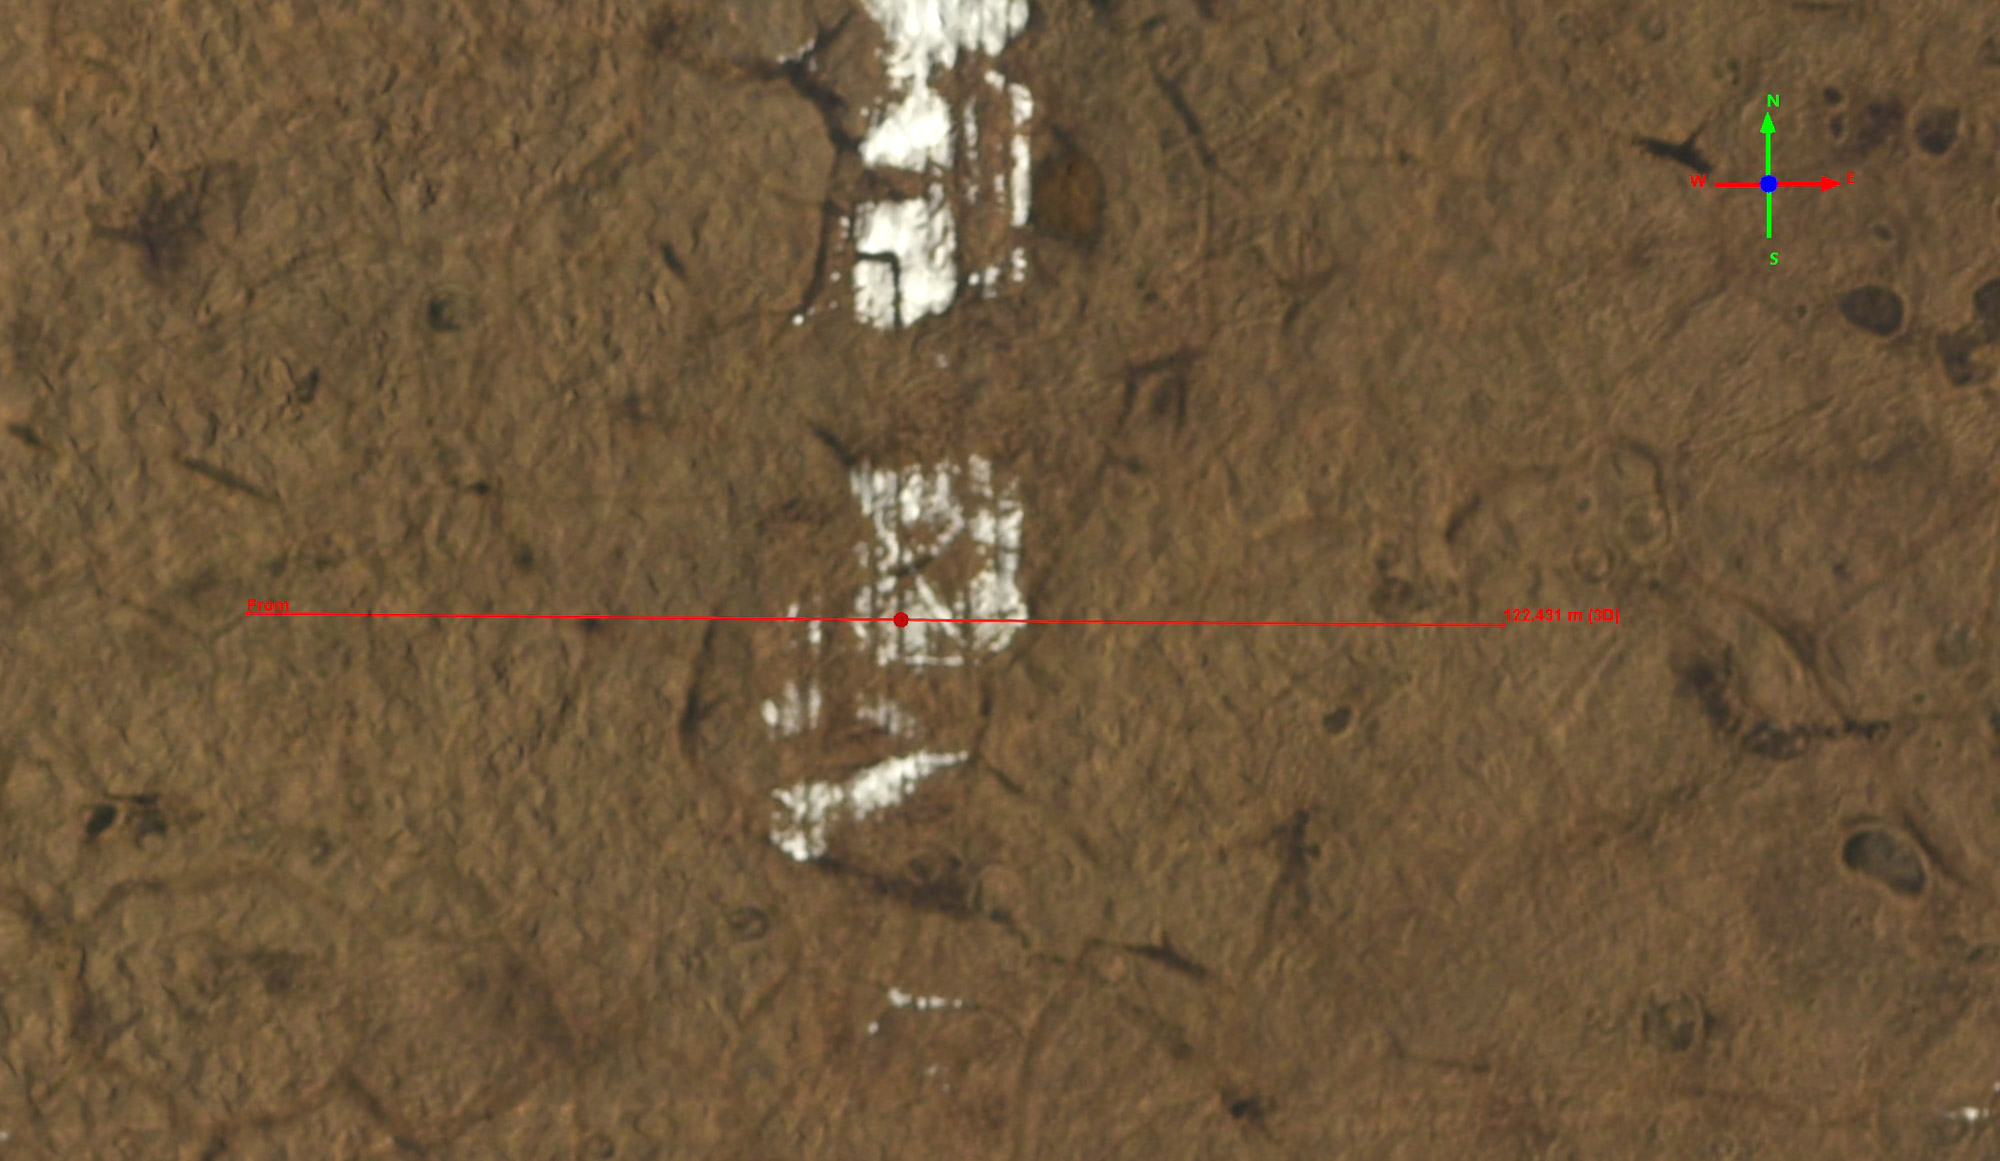
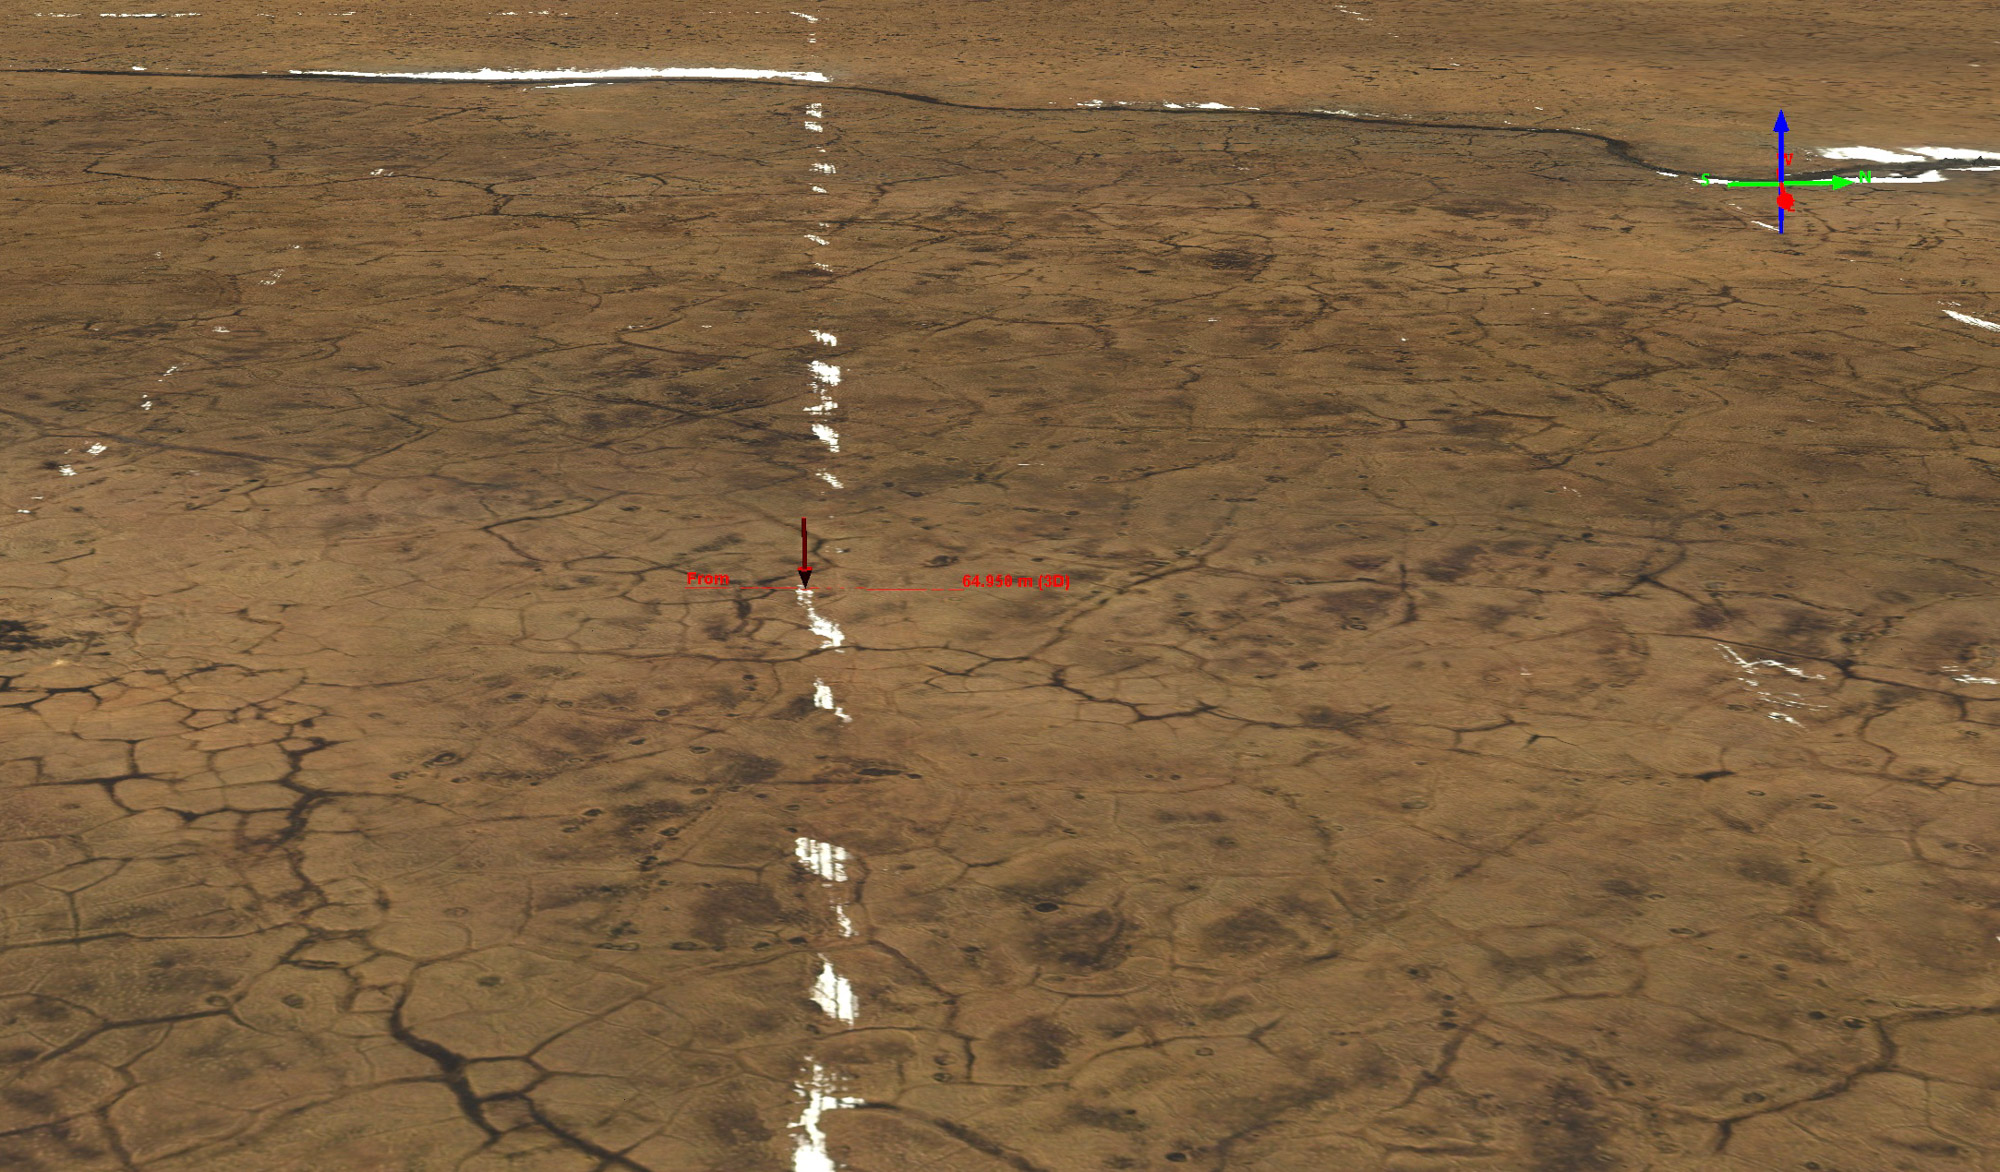
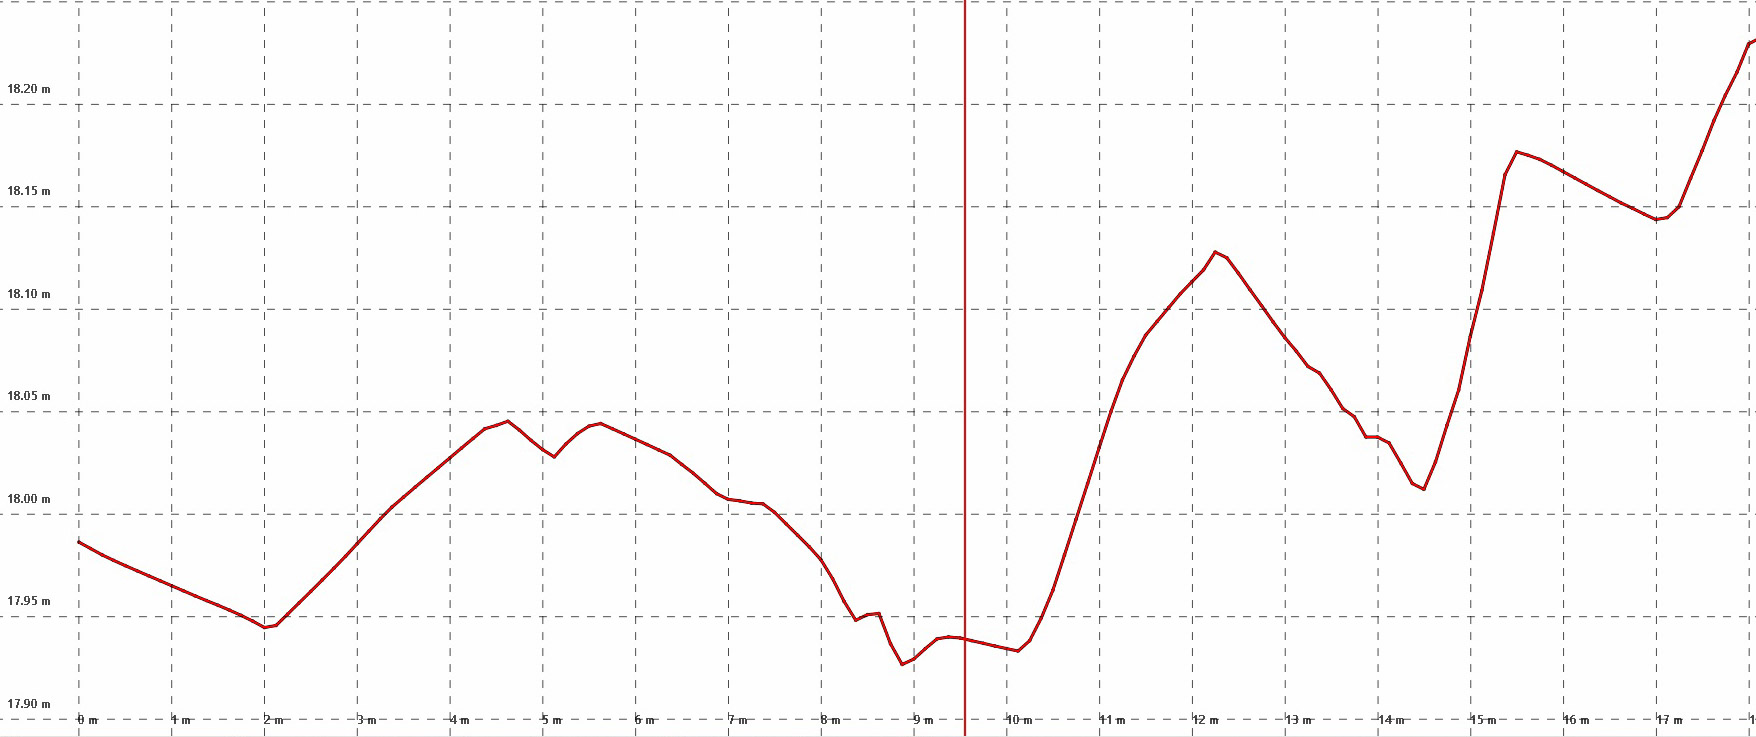
Here is a piece of one of the main seismic trails, as seen in my fodar image mosaic. When viewed in total and in detail, you can tell this one was driven over dozens of times by many vehicles, unlike many of the other lines which were used less frequently. The red line in the image is a transect I used to analyze the topographic change caused by these tire tracks. The plot below shows the topographic data along that transect.
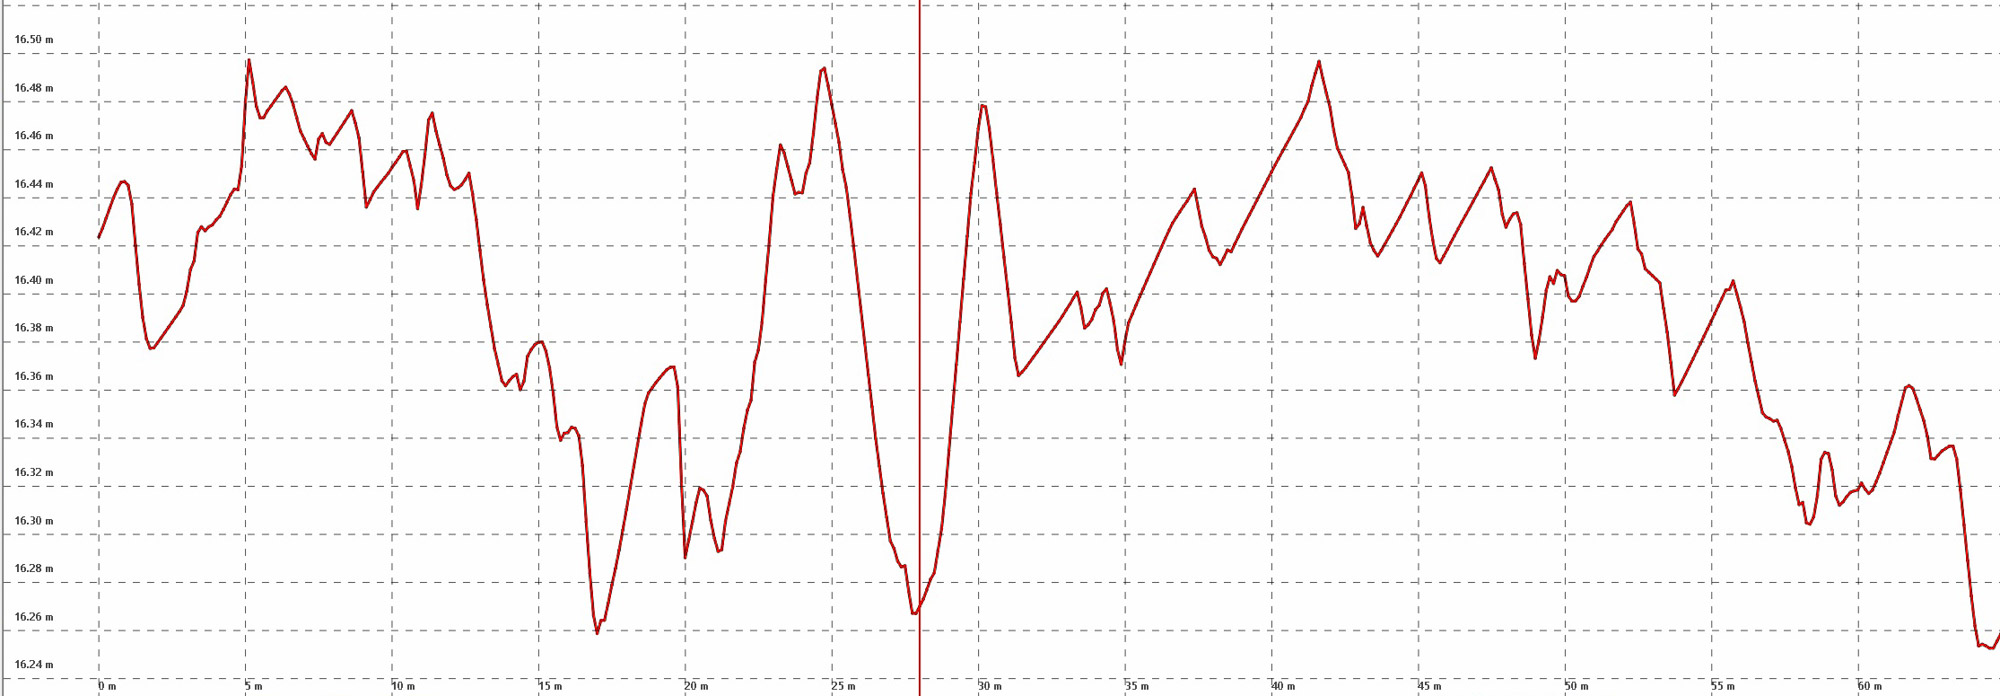
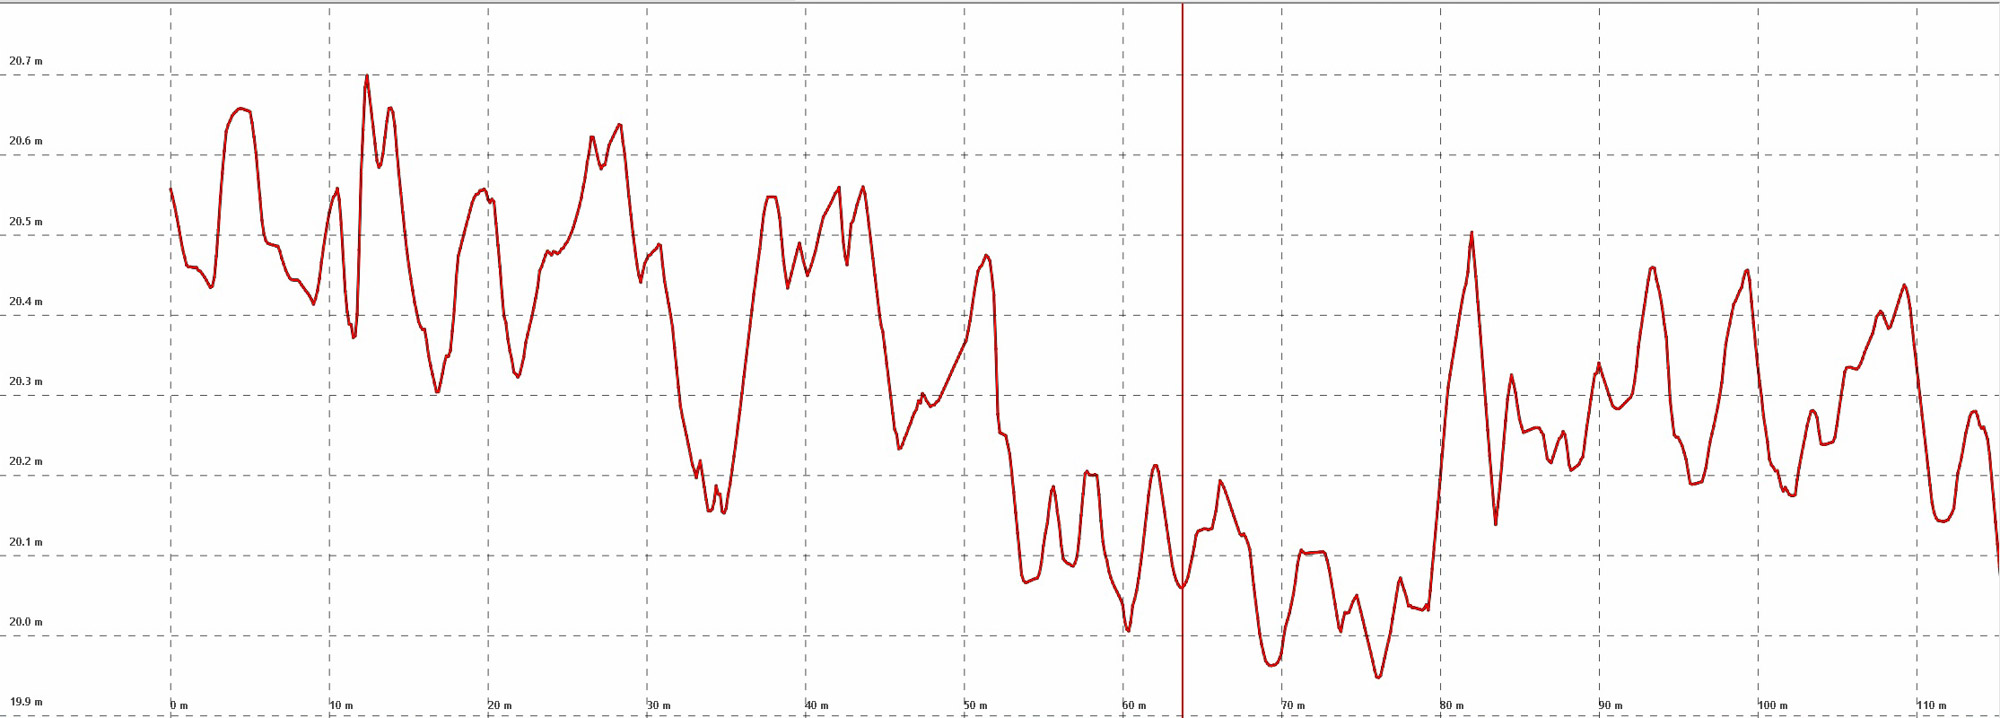 This plot corresponds to the previous image — the vertical axis is topography in meters with grid lines ever 10 cm and the horizontal axis the distance along the red line in the previous image. Here you can see that this main trail caused a depression in the tundra across it’s width (from about 50 m to 80 m in this plot) of about 20 cm compared to the natural terrain. Further, you can analyze individual tire tracks to see their impacts — the vertical red line seen here corresponds to the red dot in the previous image, which in between the compressed snow of two tire tracks. That is, my data is able to resolve topographic variations on the order of single centimeters. I pulled out maybe a dozen transects along this line and all showed similar results.
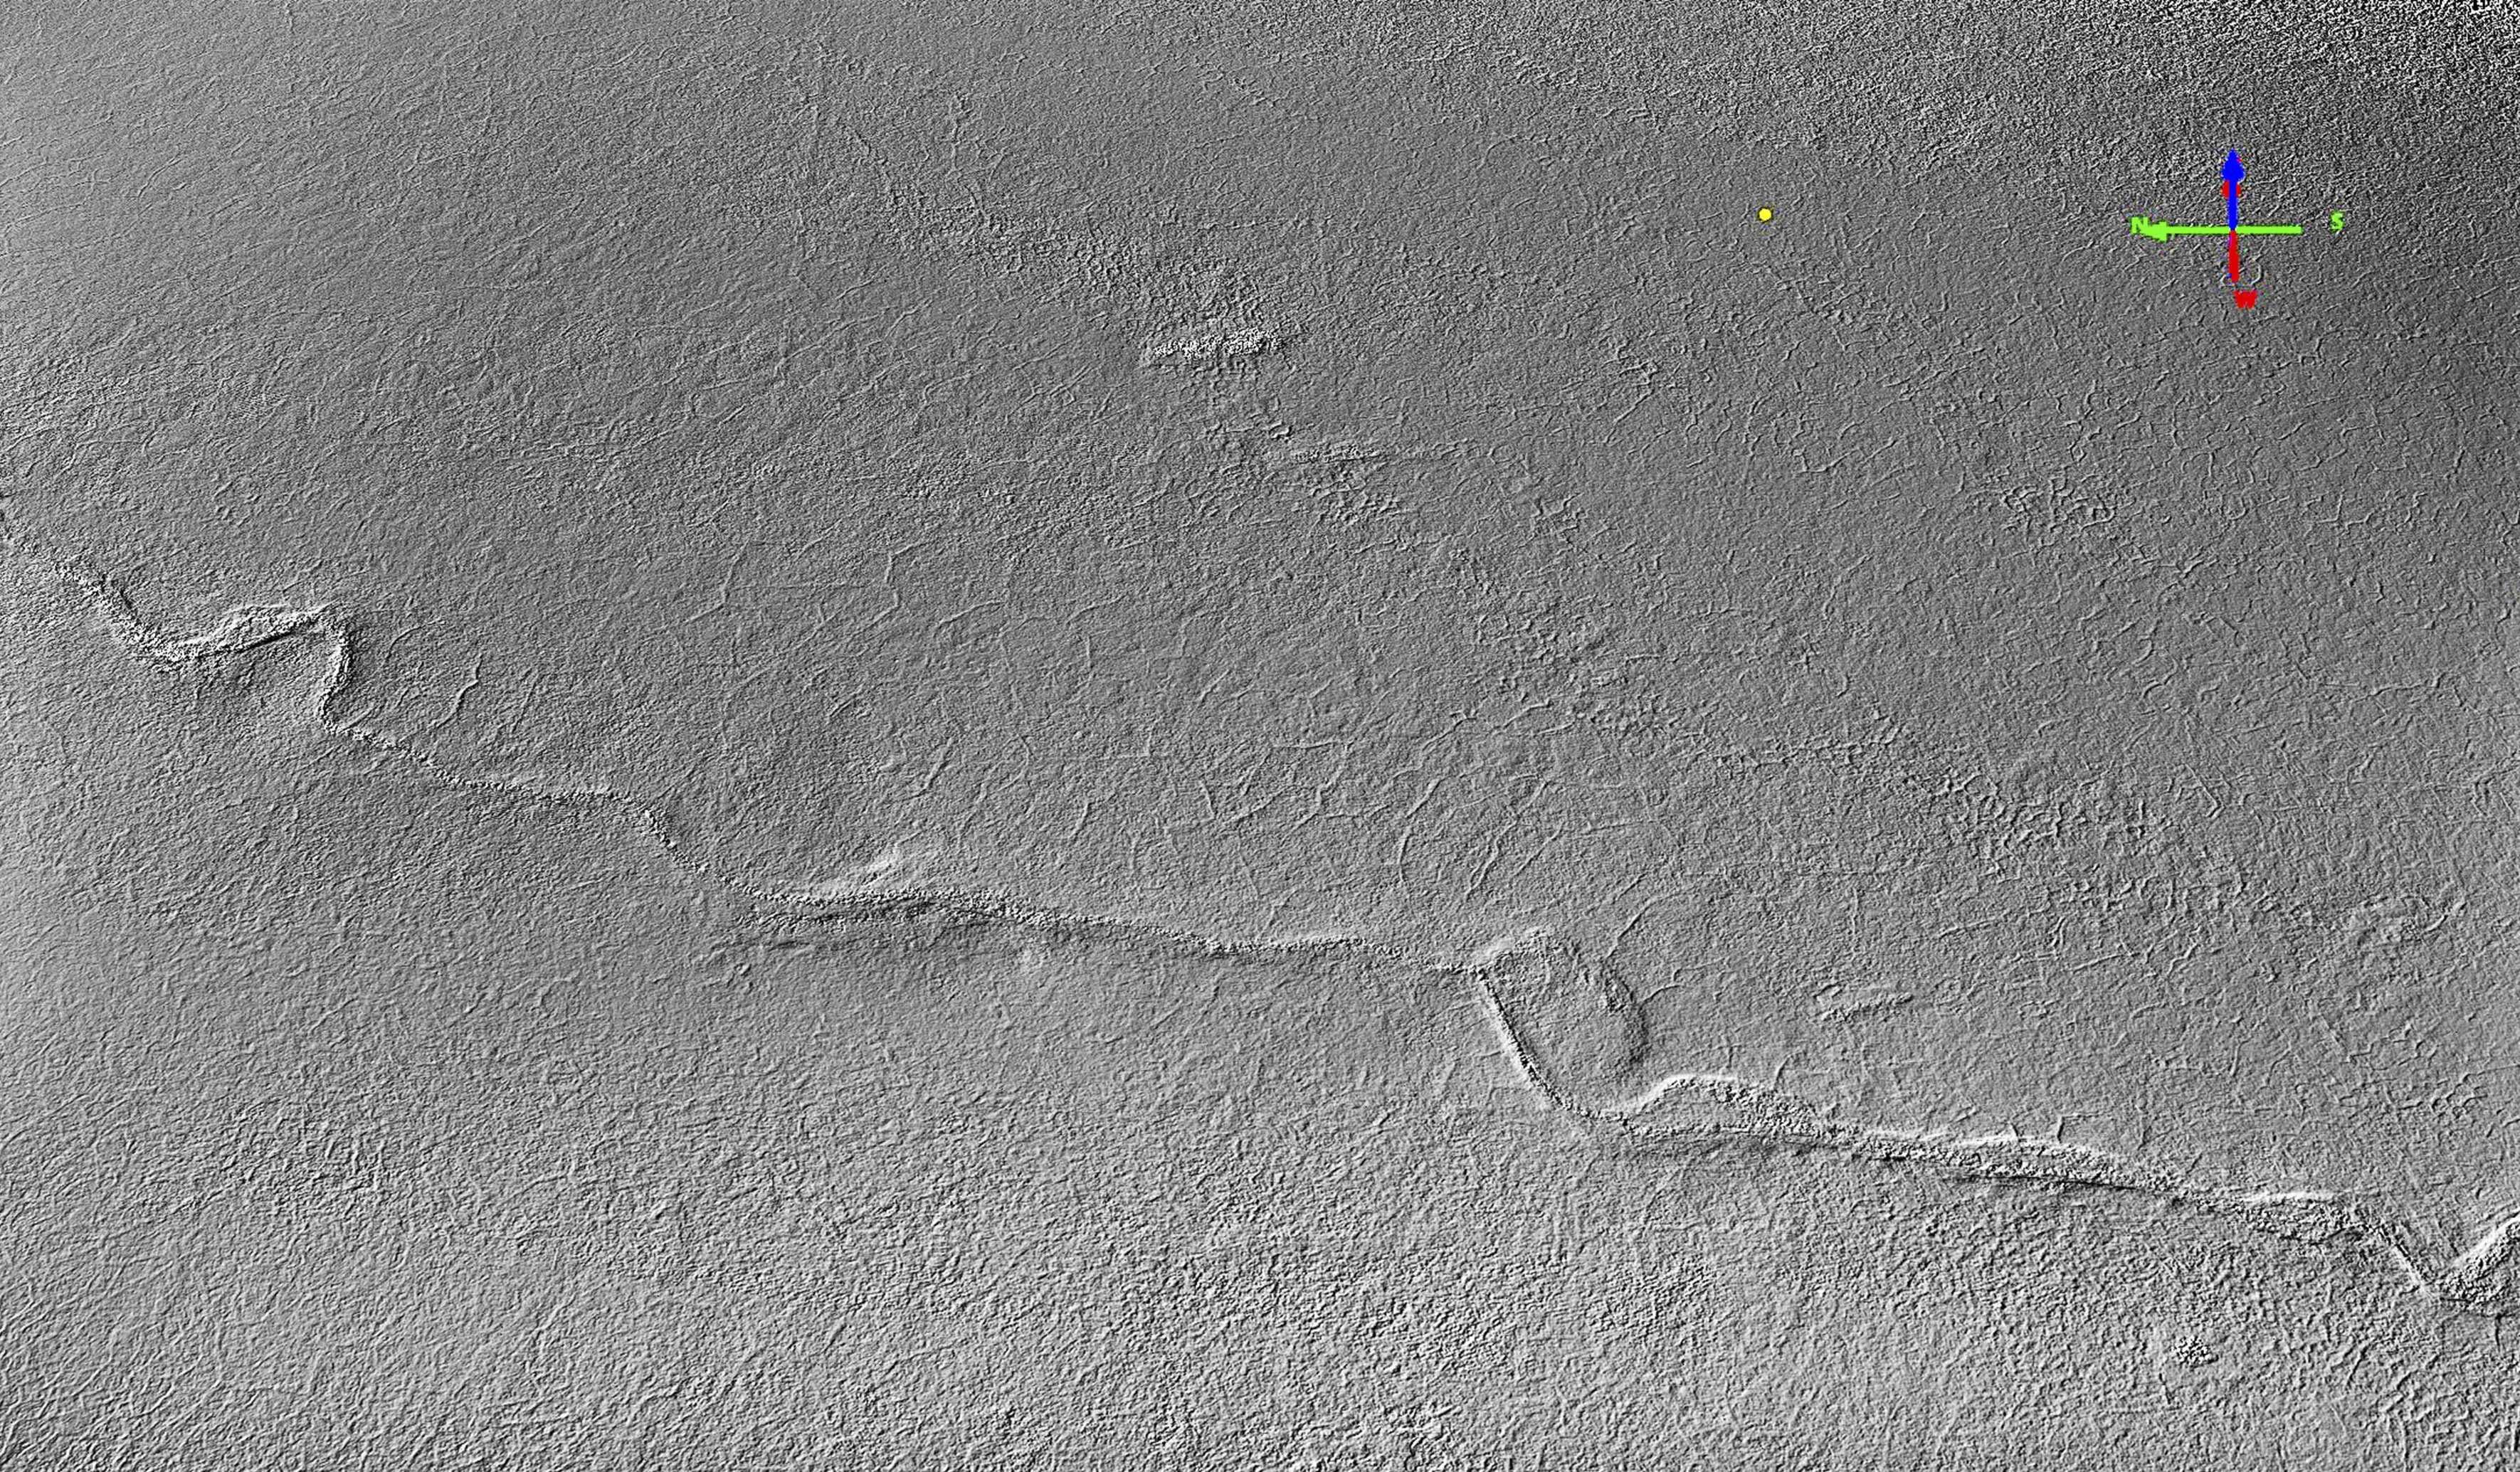
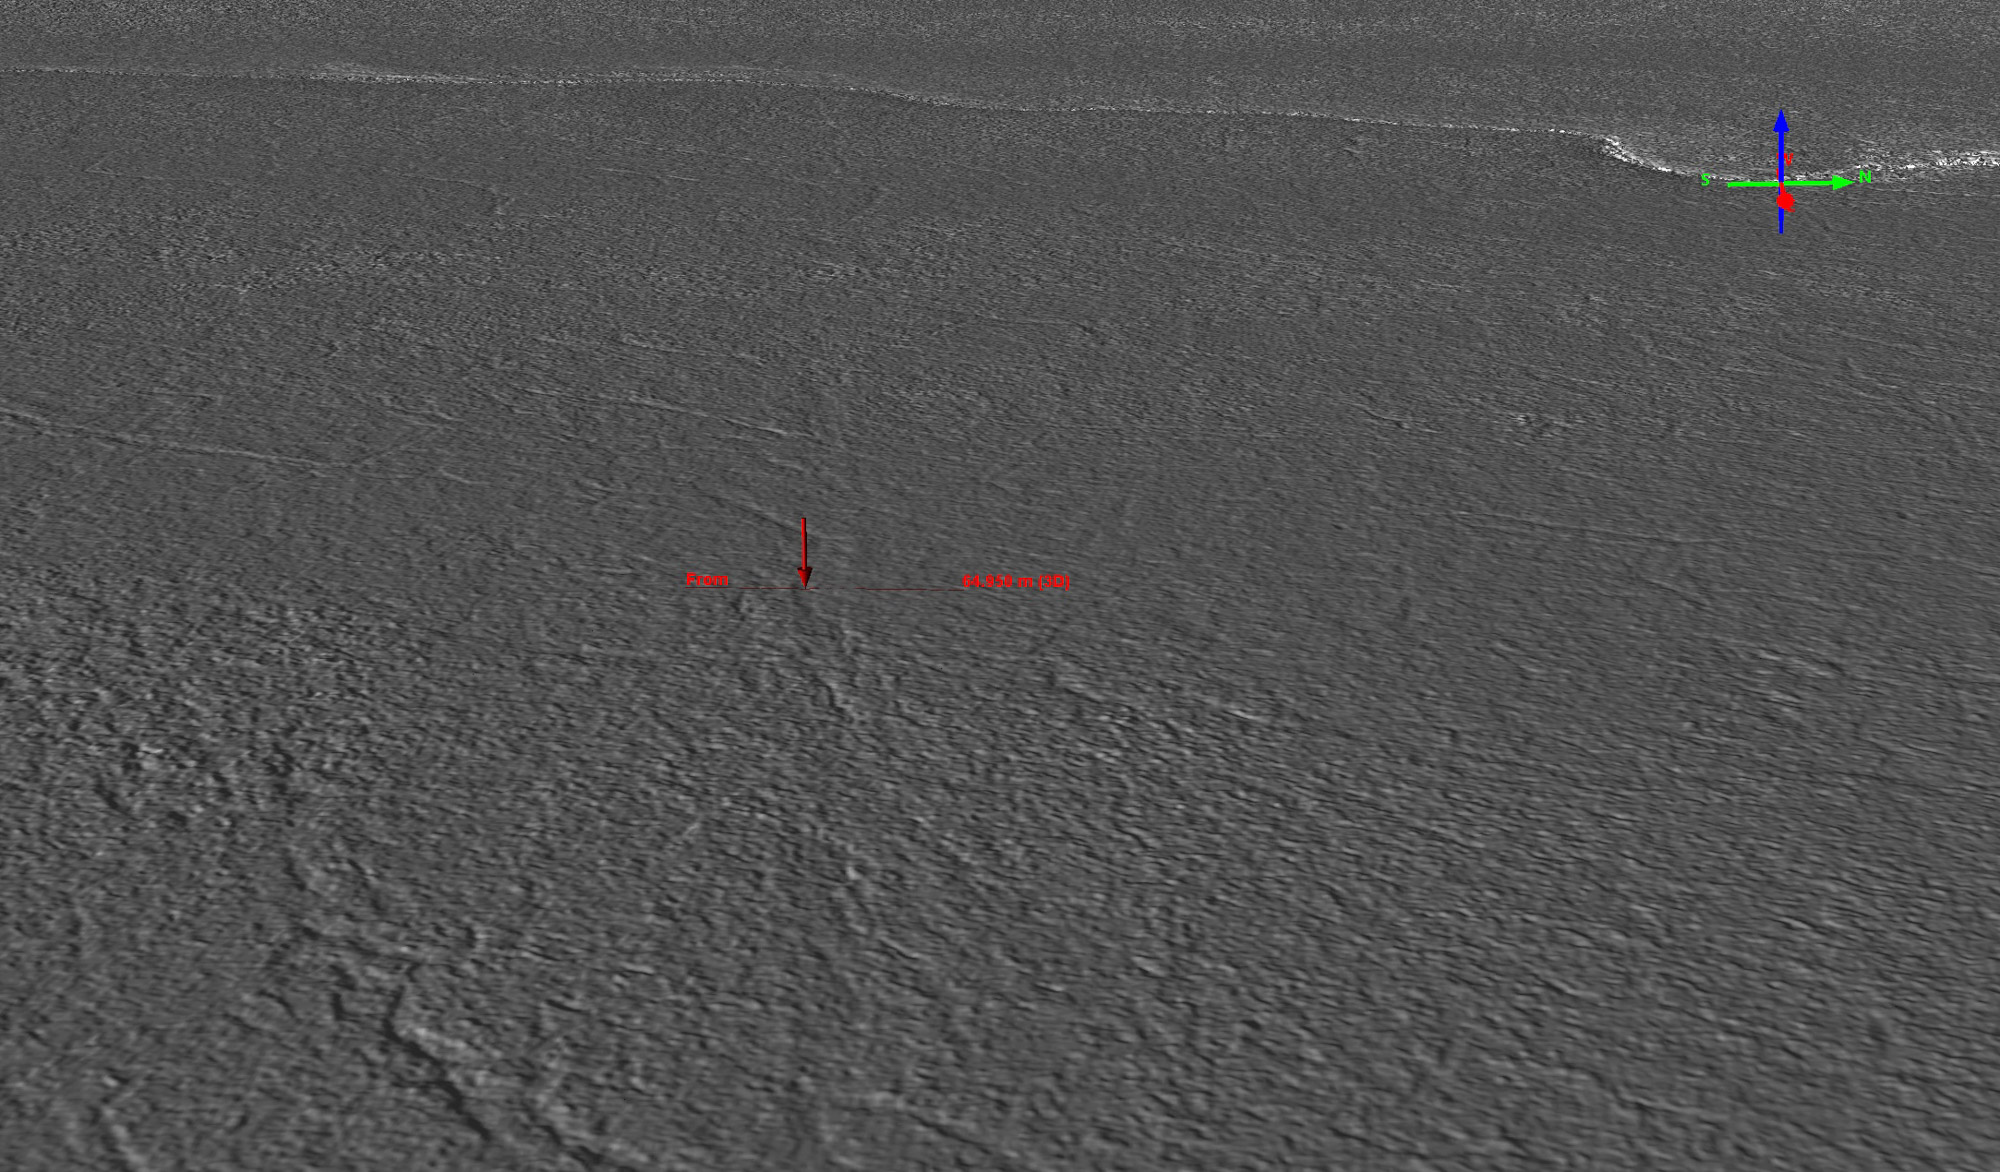
Here is another similar example, see the profile plot below for the data.
 Here is the elevation profile from the previous image — note that the vertical line corresponds to the area between two tire tracks, meaning that the compressed snow is a topographic high in this case of about 5 cm. Like the previous analysis, the entire 15 m width of the trail is about 10-15 cm deep. These values of 5-20 cm are within the natural variation of the tundra surface itself, so some care needs to be taken in interpreting wiggles of this size. But from making lots of profiles like these and looking at the shaded relief imagery to see spatial consistency of these variations, signal (tire tracks) can reliably be distinguished from noise (tussock tundra, ice wedge polygons, etc).
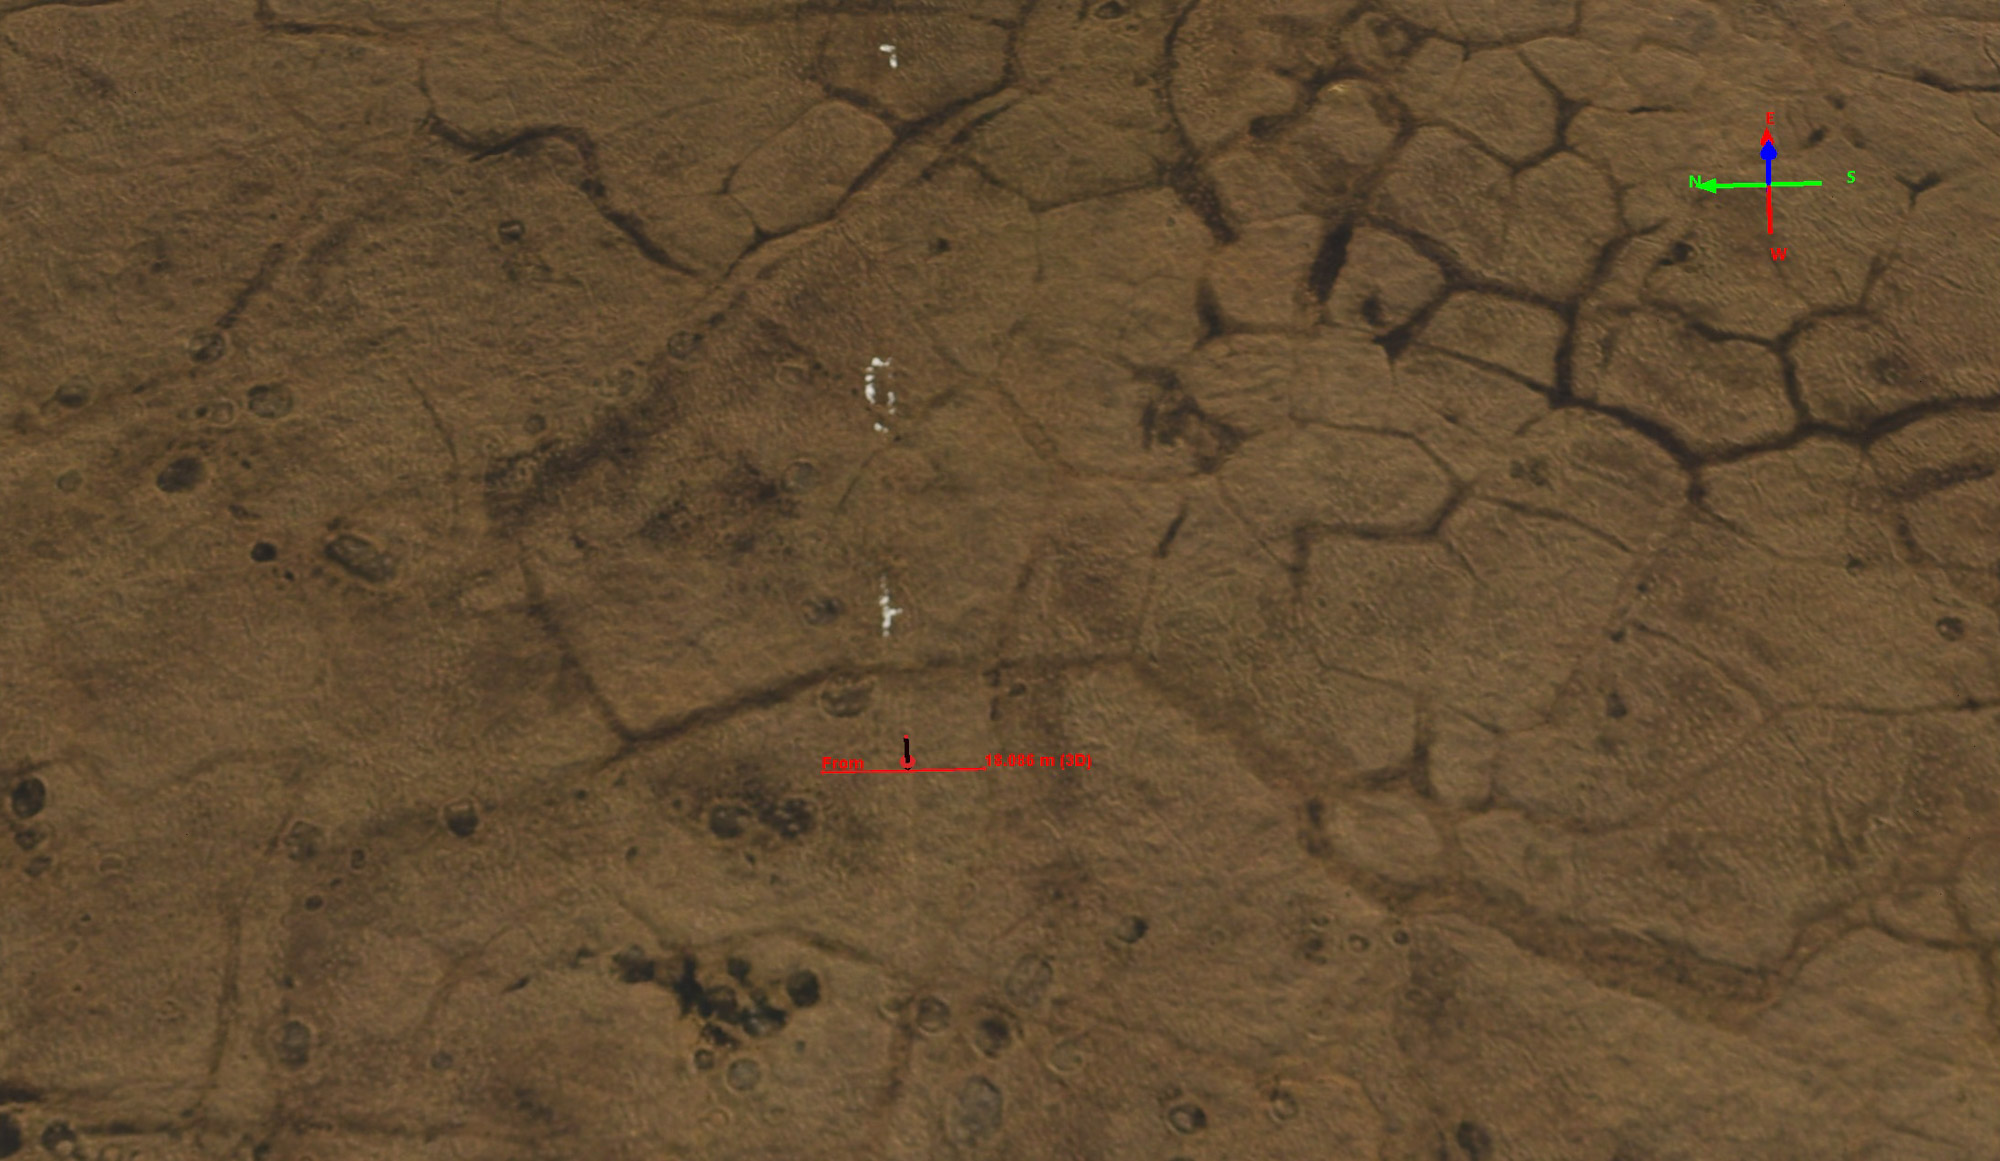
This elevation profile corresponds to the previous image; note the horizontal grid lines here are only 2 cm apart, indicating that the depression left behind at the location indicated by the arrow in the previous image is about 20 cm.
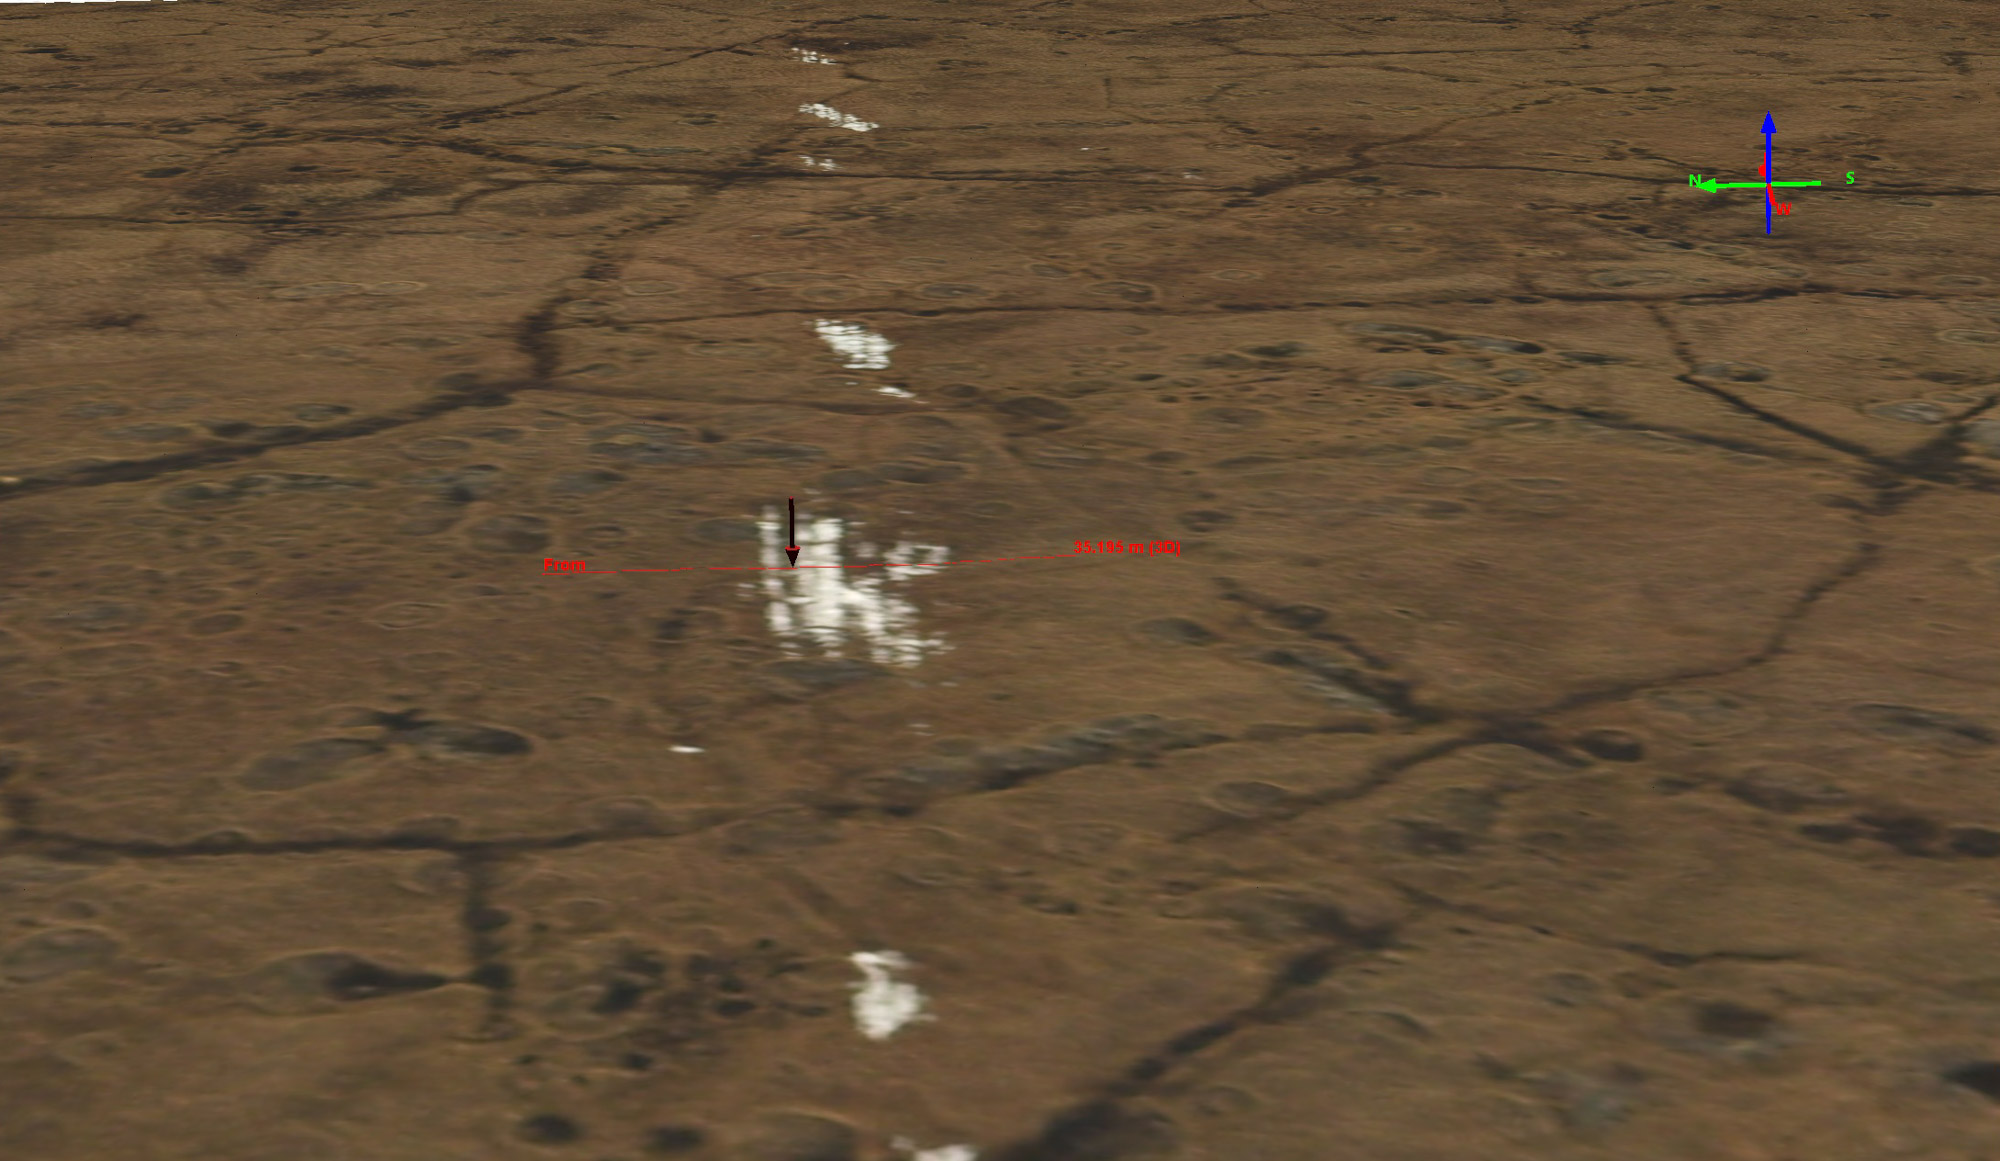
 As a final example, I explored whether the topography was affected after the snow had melted, which indeed it was. Clearly visible in the image are tire tracks with no snow in them, and as the plot below shows this visual indication has a corresponding topographic signature, in this case about 5-10 cm.
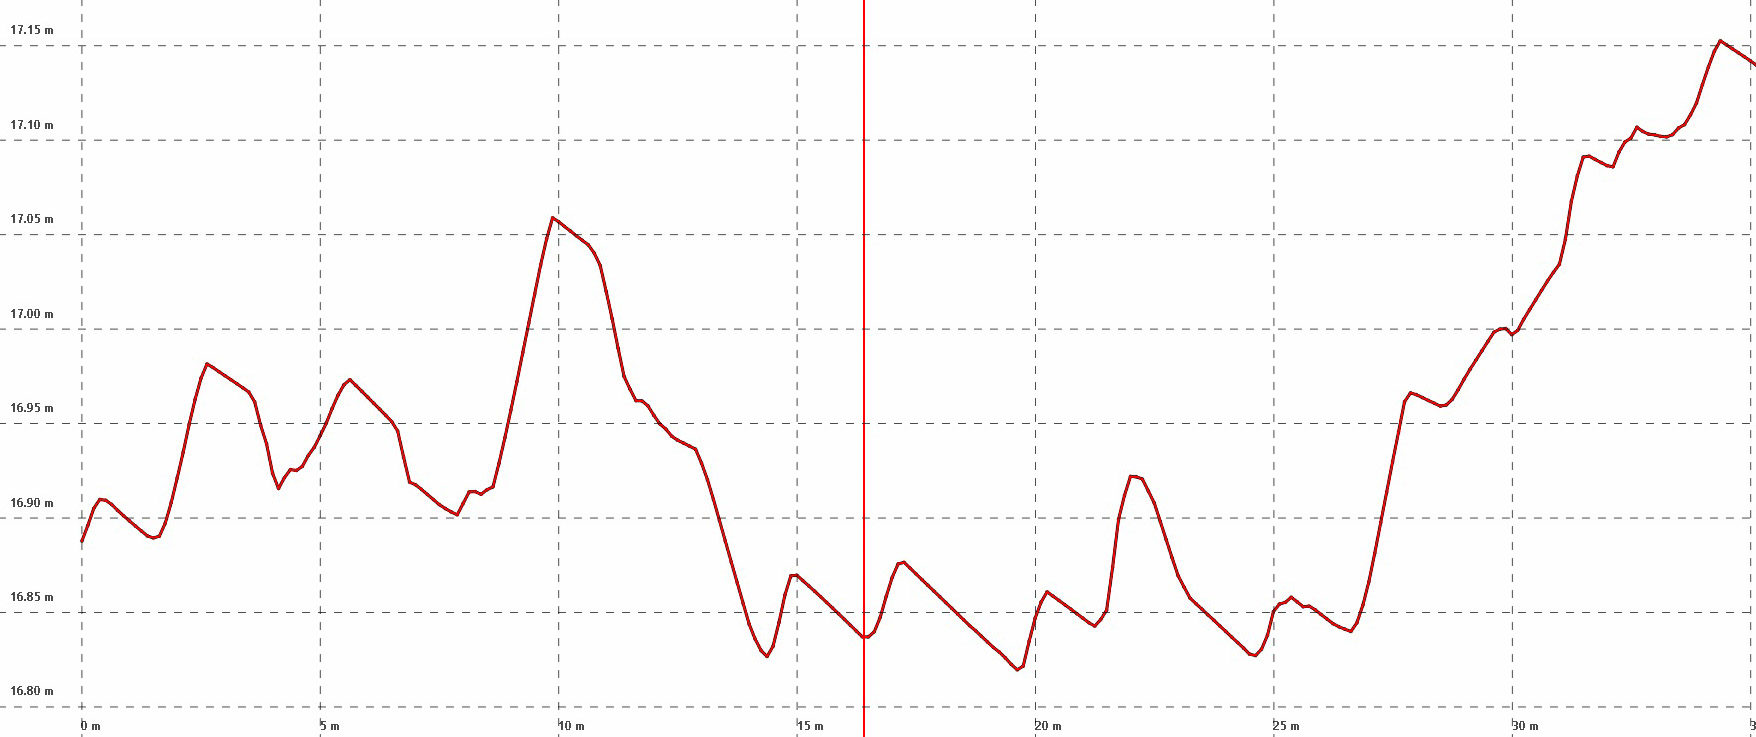
 This elevation profile corresponds to the previous image, showing 5-10 cm of relief change due to the seismic tire tracks.
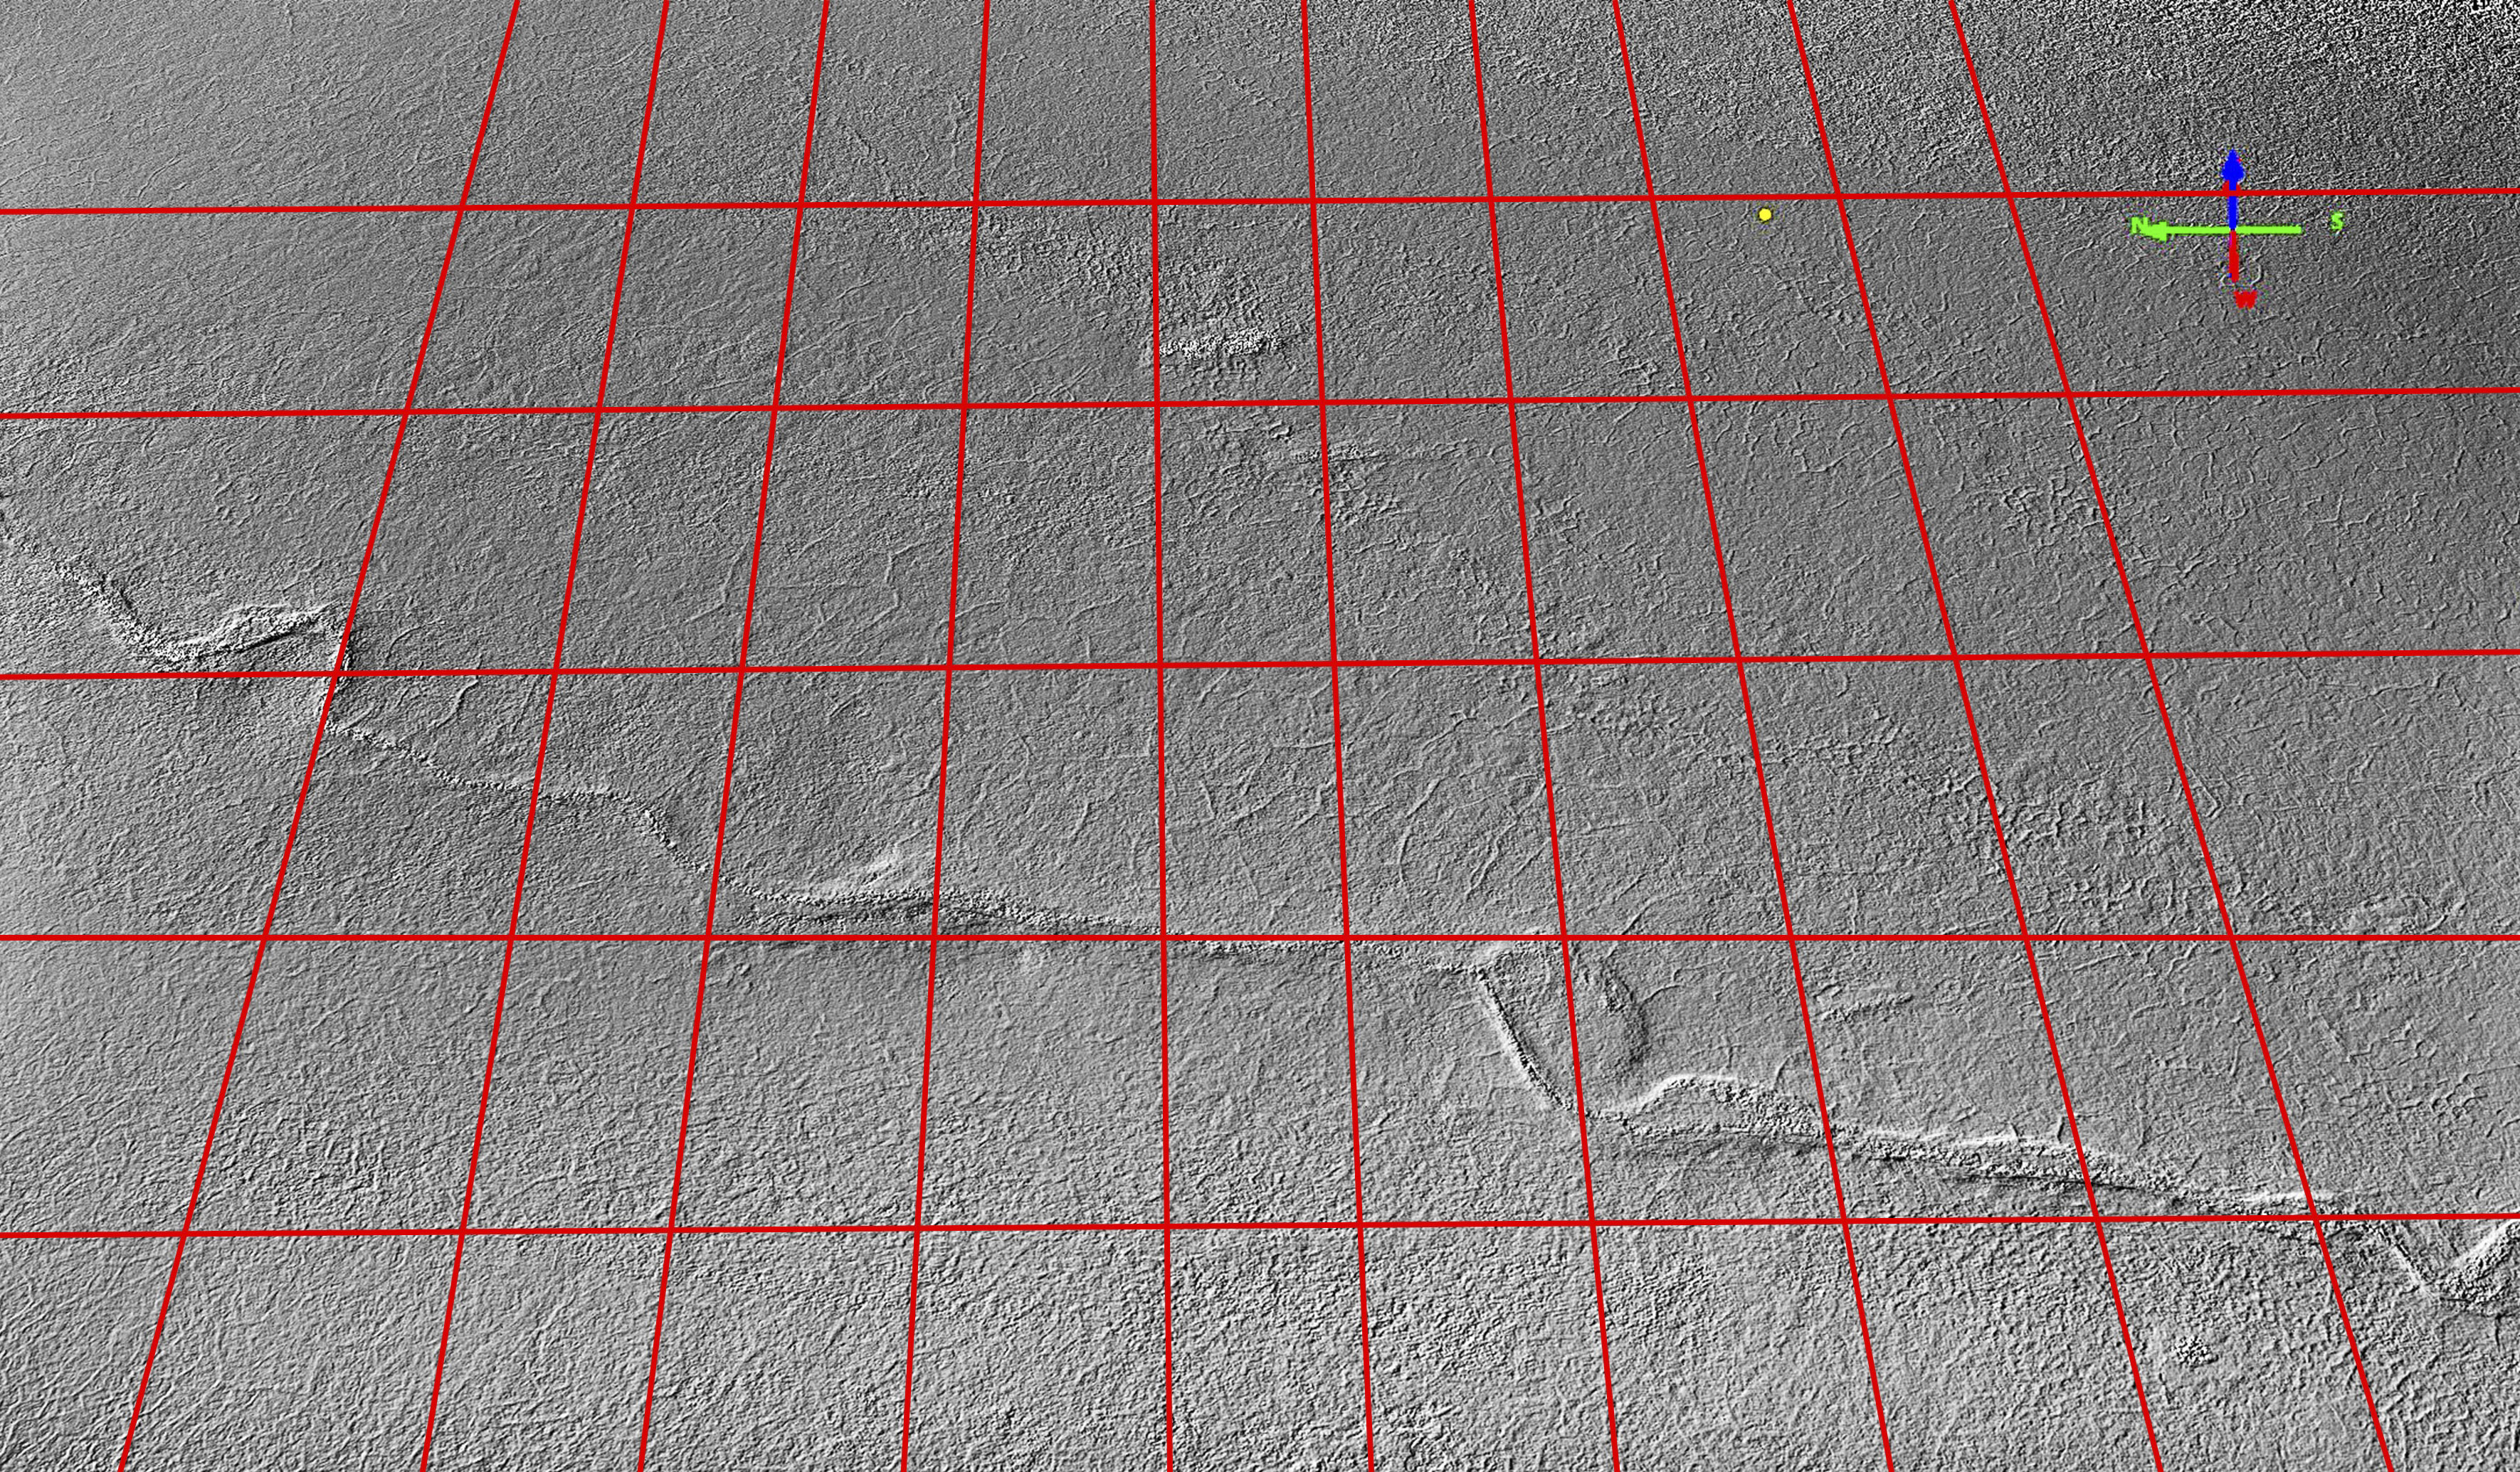
Here I’ve highlighted seismic tire tracks and the impact they may have for decades to come — we now have a means to track those changes. We now have the means to alter our plans for the future, whether for seismic exploration or anything else. For example, by making a similar map in winter, I can subtract this map from that one and directly measure snow depth. Then when seismic exploration occurs, I can make another map in summer measuring the impacts of those trails on the topography and compare this to the snow depth that I measured in winter. Perhaps I will find that when the snow depth is more than 50 cm thick there is no impact of seismic lines on tundra topography, but when snow depth is 25 cm there is an impact…or perhaps it will all have an impact. Right now, who knows? My point is that we need to be monitoring this in support of making the most rational and responsible decisions about whatever happens out there, and this is just one example of dozens of decisions that these topographic maps can assist with. This technology is just of several I have developed that could be put towards this purpose. For example, I can also measure the depth of ground freeze in winter using a different airborne technique, such that we can limit work to only those areas that are frozen to a certain depth.
In any case, that’s a summary of where I’m at — about 15% of acquisitions complete and I have processed those data to demonstrate that I can measure my main signal of interest: tire tracks left behind by seismic exploration. Of course this map will be useful for a lot more than detecting future seismic tire tracks — just because I didn’t feature it don’t forget that I also measuring the the shape and size of every single ice wedge and polygon in the 1002, the entire coast line, every gravel bar, every snow drift, etc. The scientific uses are too numerous to list, but this map will form a baseline against which all future change can be assessed. What I find most useful about these data is that they cover a huge area at a high enough resolution not just to see the final results of change but to get at the processes causing those changes, such as tire tracks or caribou trails or climate change. When subtracting one map from another, the area that hasn’t changed shows as zero elevation but those features that have changed show up as a non-zero, allowing us to easily find needles in a haystack, such that at a glance we will be able to quickly find not only tire tracks but all permafrost subsidence or thermokarst, coastal erosion, stream channel migration, polar bear dens, etc. And by detecting and tracking such small-scale processes over huge areas, we can begin to understand their causes which will allow us to model them to help us predict future impacts and perhaps how to mitigate the ones we consider negative. But I suppose I should get back to focusing on making the first map…
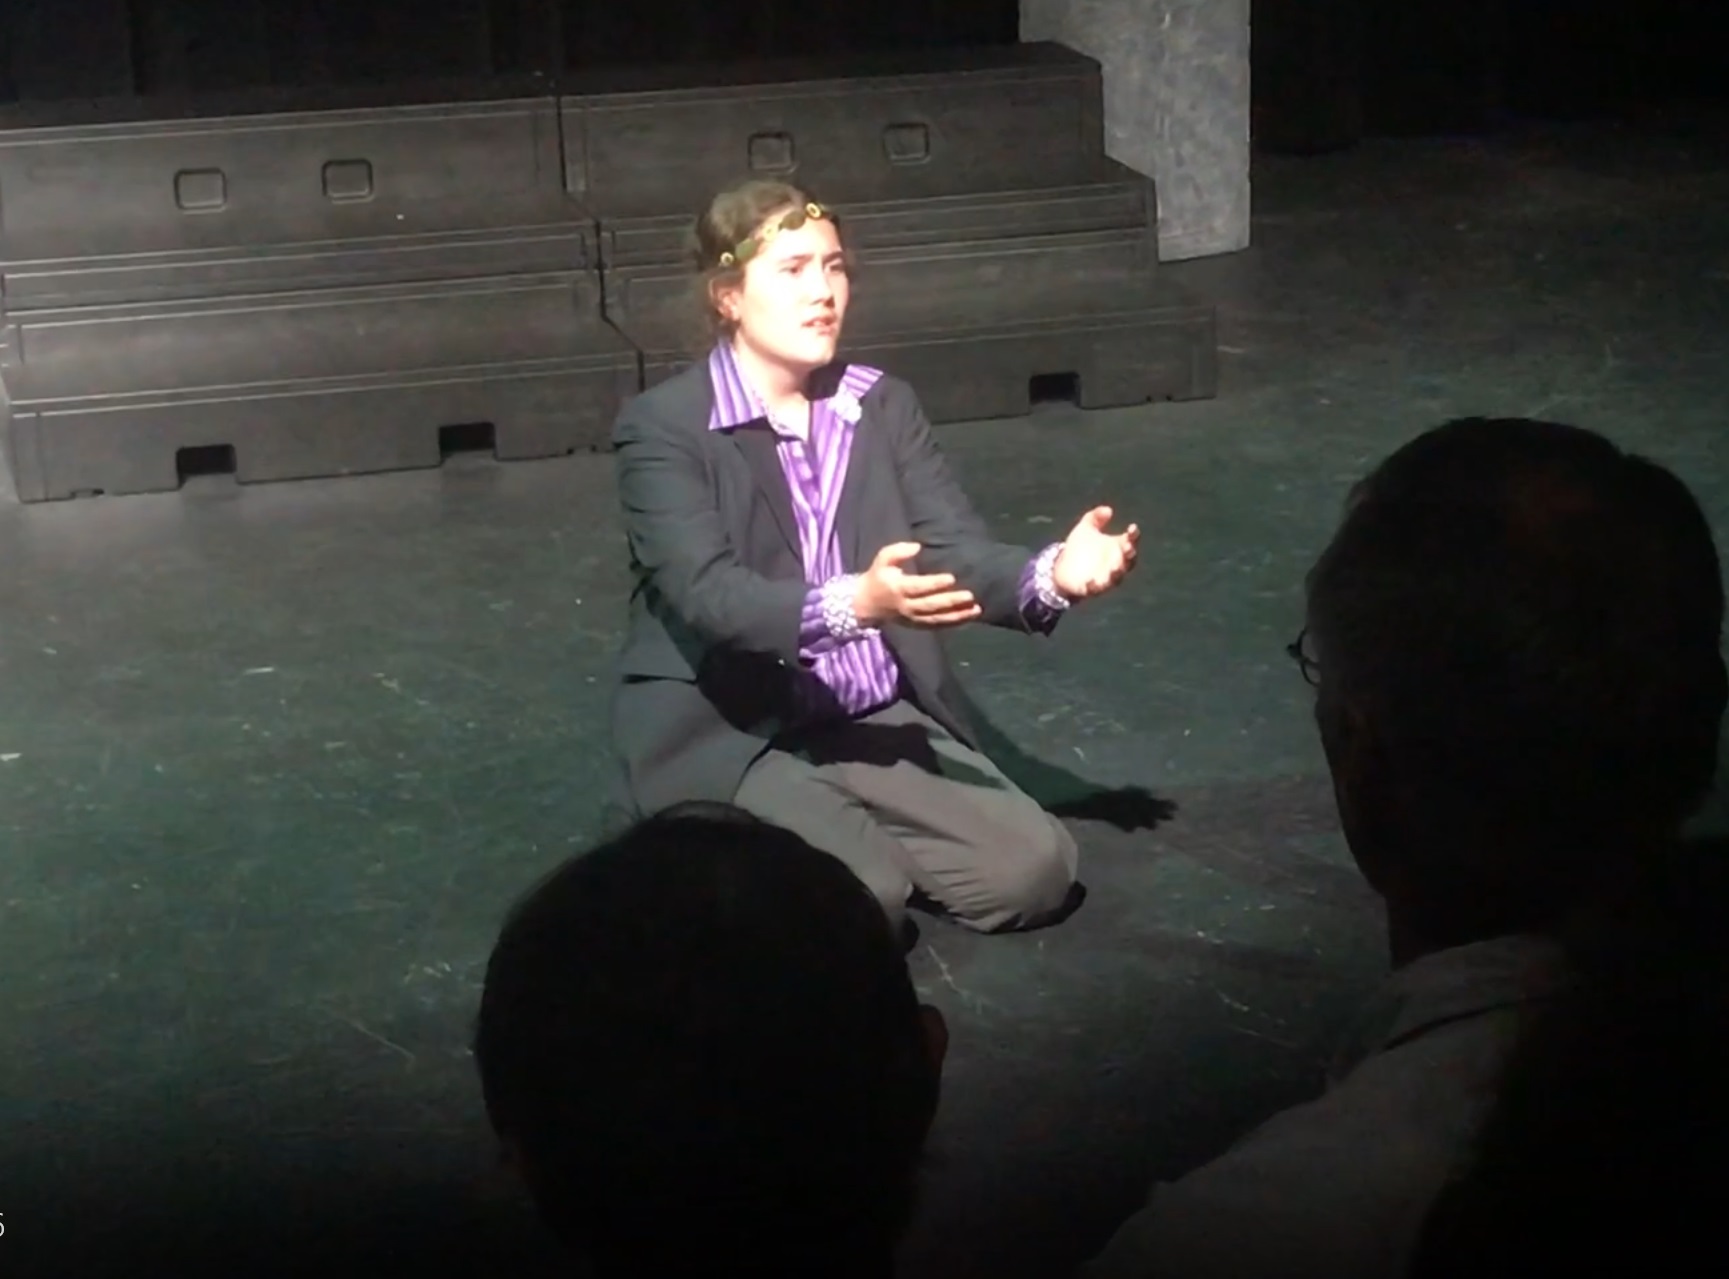 Though the mapping went well, the best part of my week was seeing my son Turner act in Hamlet. He had his first 7 birthdays in the Arctic Refuge during our various field campaigns, and I hope he will have many more there. And I hope when he and his kids are old enough to fly over or spend time in the Refuge on their own, they will realize I did my best to keep it from looking like a giant checkerboard…
You can see what these tracks look like a month later here.