End of Week Two Mapping in the 1002
Week Two of my mapping efforts in the 1002 Area ended with acquisitions about 33% complete, covering ~2000 km2 at 5″ resolution by taking ~50,000 photos in ~7000 miles of flying. My goal for the map is to assist all stakeholders involved with the future of the Arctic National Wildlife Refuge make the most sane and responsible decisions possible. Here, all of the processes that can cause long term impacts to the tundra occur on the spatial scale of inches, thus we need topographic maps and coregistered images on that same scale if we are to understand, predict, and measure the outcomes of our decisions. Such a map does not exist, so I am creating it.
Work has gone well, but slowly as expected. I’ve had six days of mission flying out of 14, and only one of those was a truly full day. This has been a cold and wet ‘summer’ in the Alaskan Arctic. The tundra only began greening up a week ago now, the mosquitoes have barely come out, and there’s been snow in the forecast several times though we haven’t seen any yet on the coastal plain. So overall there have been better years for a mapping effort like this, but having worked here for the past 15 years, I knew the range of possibilities and tried to plan for the worst — if 3 days a week flying is all I get, I’ll be here until August, but that’s OK.
After my first 3 days of mapping in late June, I returned to Fairbanks for a few days just in time to miss a storm in the Arctic. I described some of the highlights from that trip here. In addition to getting a lot of data processing and QA/QC done, I also picked up a passenger in Fairbanks for the next wave of mapping. Joy Juelson is an ecologist specializing in facilitating policy decisions within groups of stakeholders who often hold opposing view points. I lack such skills, and prefer to stick to providing and analyzing data. So Joy tagged along for a few days to better understand this place, its issues, and how good data can facilitate good decision making.
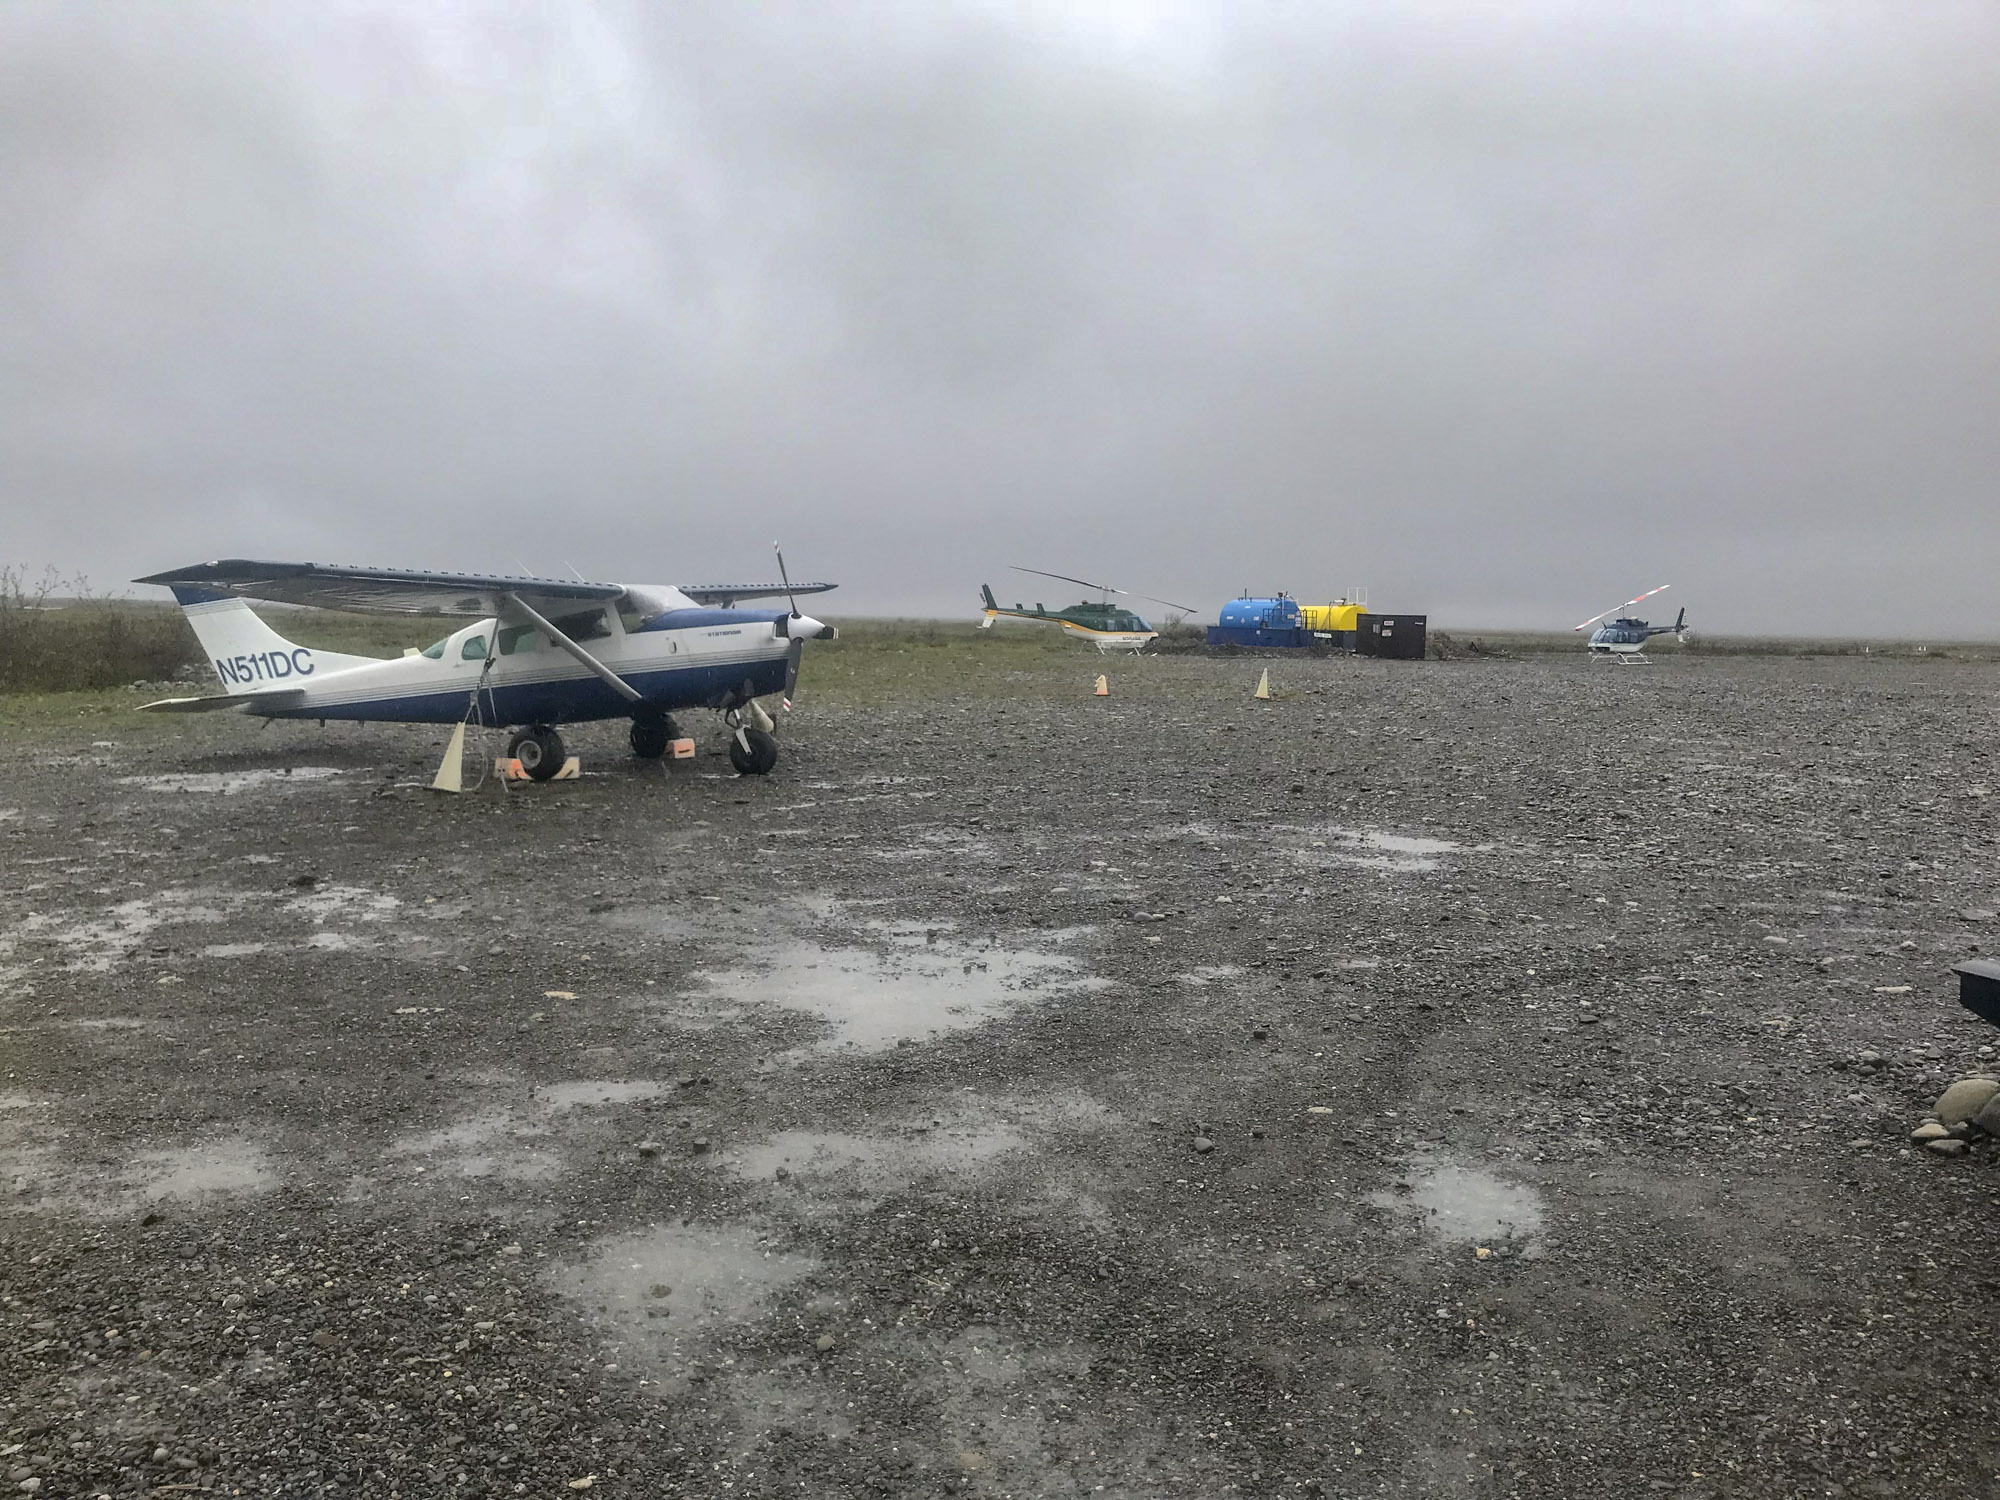
We left Fairbanks on July 2nd after a scramble of packing and repacking and arrived in Kavik in early afternoon. The weather through the mountains was a little sketchy, but much of the coastal plain was in the clear so after unloading gear and refueling we headed straight back out.
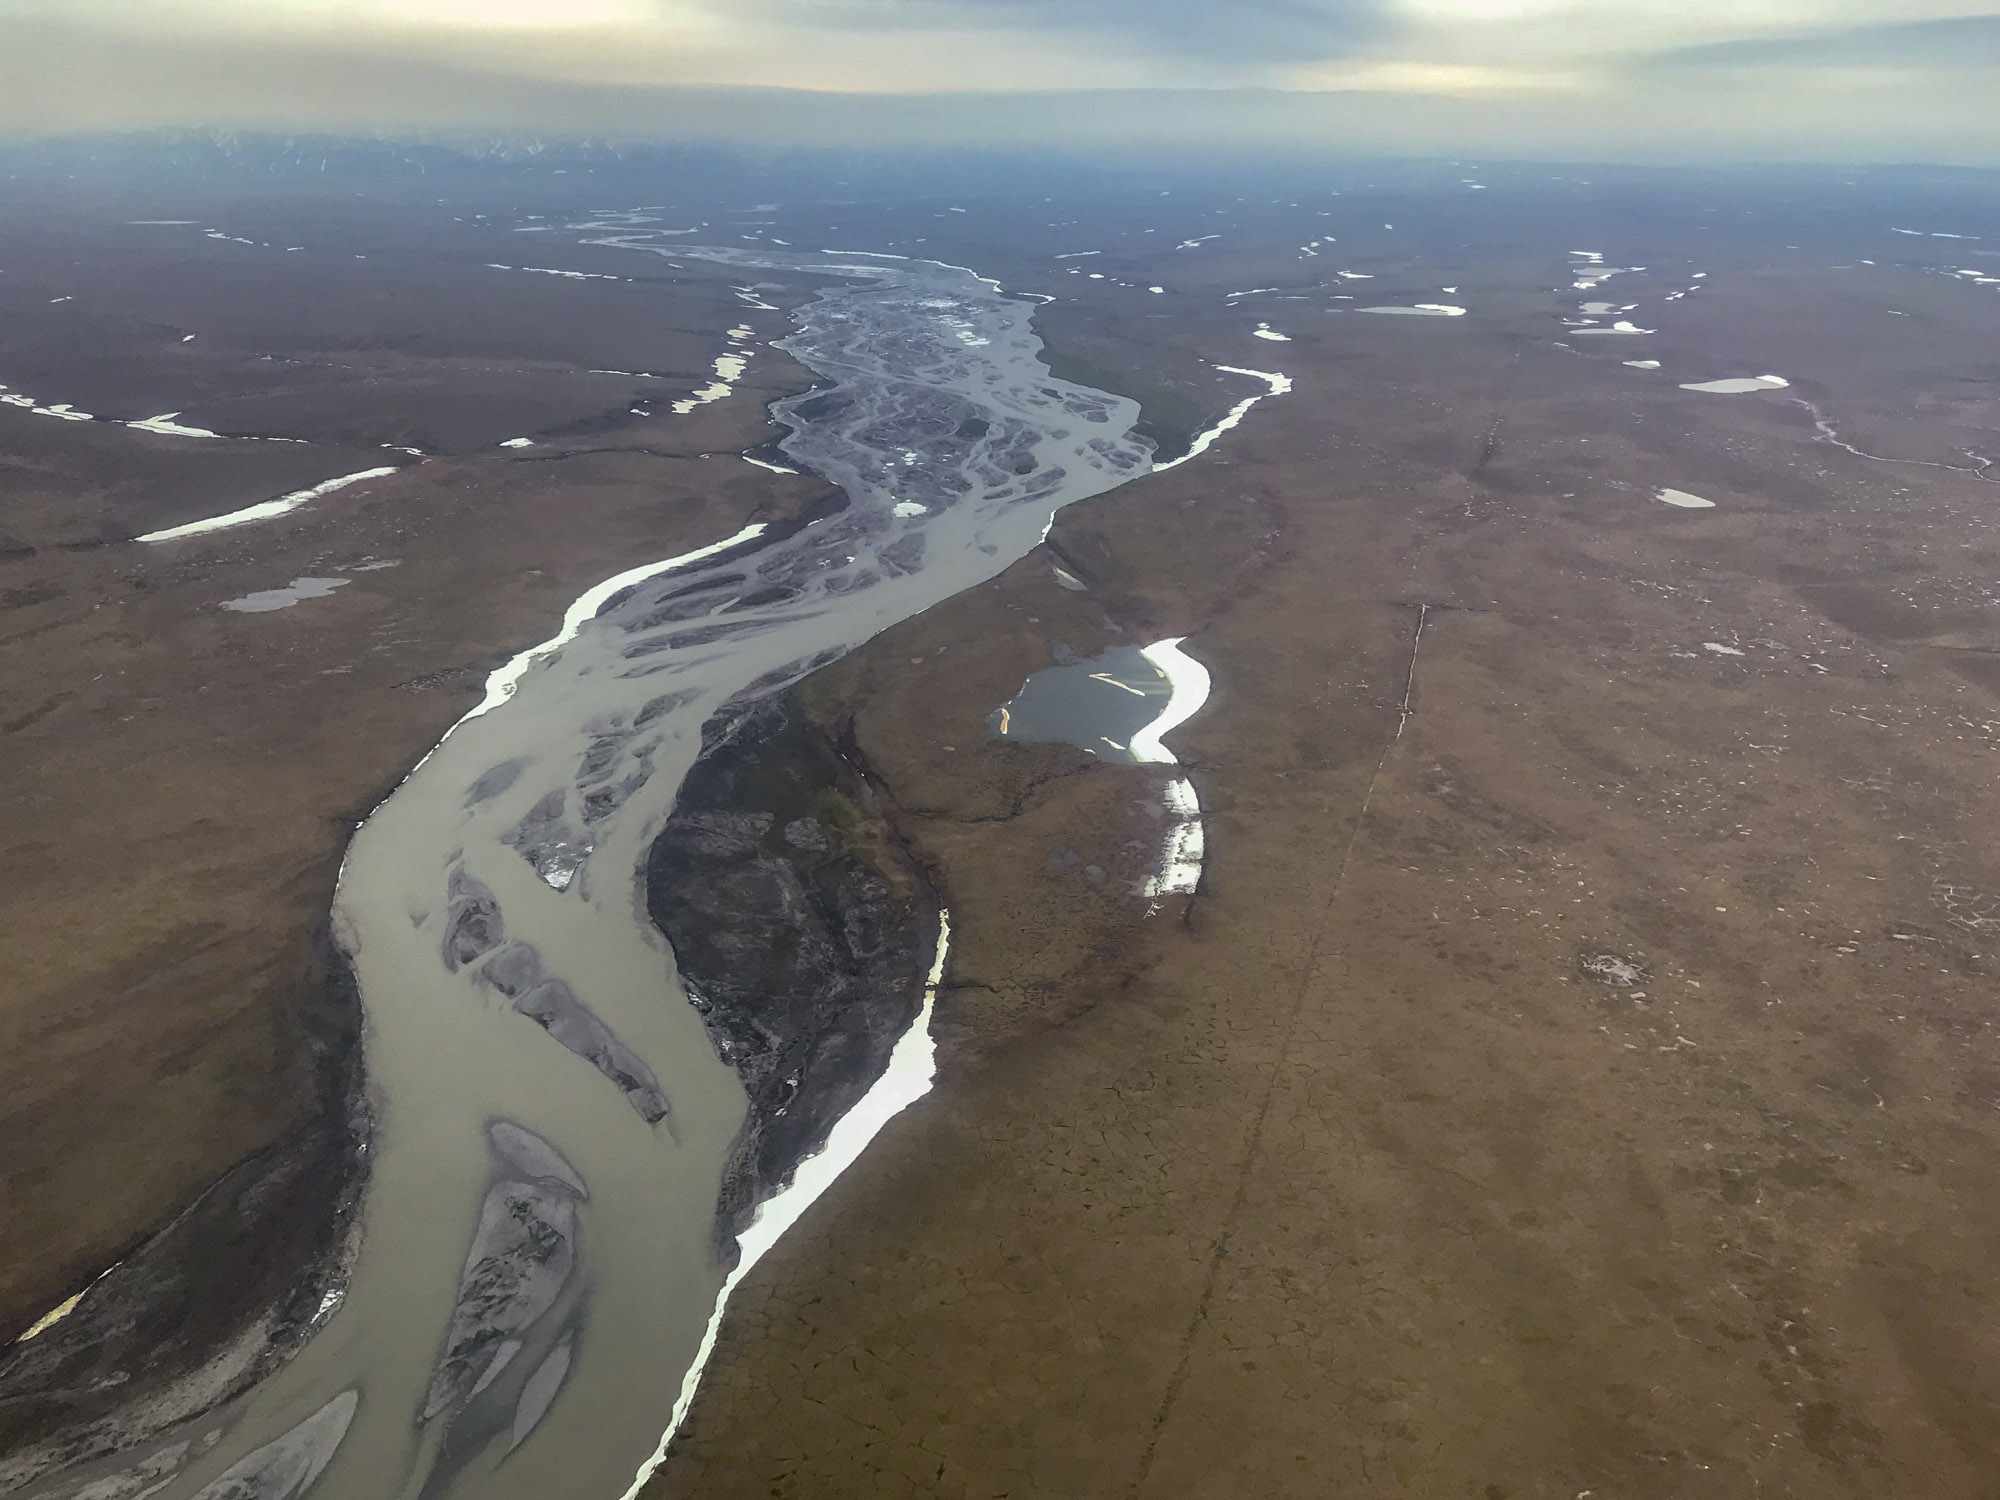
The Hulahula River Delta is the largest along the Arctic Ocean coast in Alaska despite being one of the smallest watersheds. The reason is that it is fed by glaciers. These glaciers supply huge amounts of fresh water and sediments which form this delta, which in turn supports a huge community of freshwater invertebrates. Thus it is due to the glaciers that the migratory shorebirds come to this location from around the world each summer. One aspect of my research over the years has been wondering what will happen to these birds once the glaciers disappear. I’ve been mapping the size and shape of this delta over the years to help figure that out.
My focus now was getting the area around Barter Island mapped. This region is probably the worst in terms of mapping weather in the entire 1002 Area, because it is notoriously covered by a persistent low fog. Today however, it was in the clear so we spent several hours mapping the initial lines there. I started slightly inland than Barter Island itself, as I’ve already mapped the main island and its barrier islands several times, I wanted to focus on new area first and then return there to re-map when I have time. Work went well and we also visited one of my favorite tundra sites along the Jago River before returning to Kavik to settle in and catch up on sleep.
I spent many, many nights camped at this spot over the past 15 years in support of my research here, but this is the first time I landed there myself. Those who say this place is a wasteland simply haven’t looked closely enough at the details.
The forecast looked promising for the next day, July 3rd, but reality was somewhat worse. The ceiling was high enough, but there were a lot of rain squalls and random foggy clouds in our area. The main reason why ‘cold’ and ‘wet’ go together here is that at cold air temperatures the dew point temperature is usually the same, meaning that the air is fully saturated with moisture and condenses into fog and rain. So I mostly hope for fronts to move in that either bring dry air or warm air and those typically last about two days. We ran a few lines just to give it a go in case conditions improved, but it continued to get worse through the day, so we took the scenic route home and called it a day.
Conditions deteriorated throughout the day and night, such that it wasn’t even worth launching the next day, Indpendence Day. I realized too late that I forgot to bring fireworks, though it was questionable whether we could even light them in these conditions.

I know that feeling…
Kavik is also currently home to a bunch of geologists who have been working in and around the Refuge for many years, but even helicopters need some visibility and ceiling.
Conditions did not improve much in the Refuge on the 5th, but gradually improved throughout the day to the west, so we headed to Deadhorse to drop Joy off to head back to the real world. I rarely get to fly with a co-pilot and it was refreshing to see the Refuge through new eyes. Afterwards I headed south to visit Matt and Emily at their place on the Ivishak River to enjoy their beautiful view, before heading east back to Kavik in preparation for what I hoped would be a good day of mapping starting the next morning.
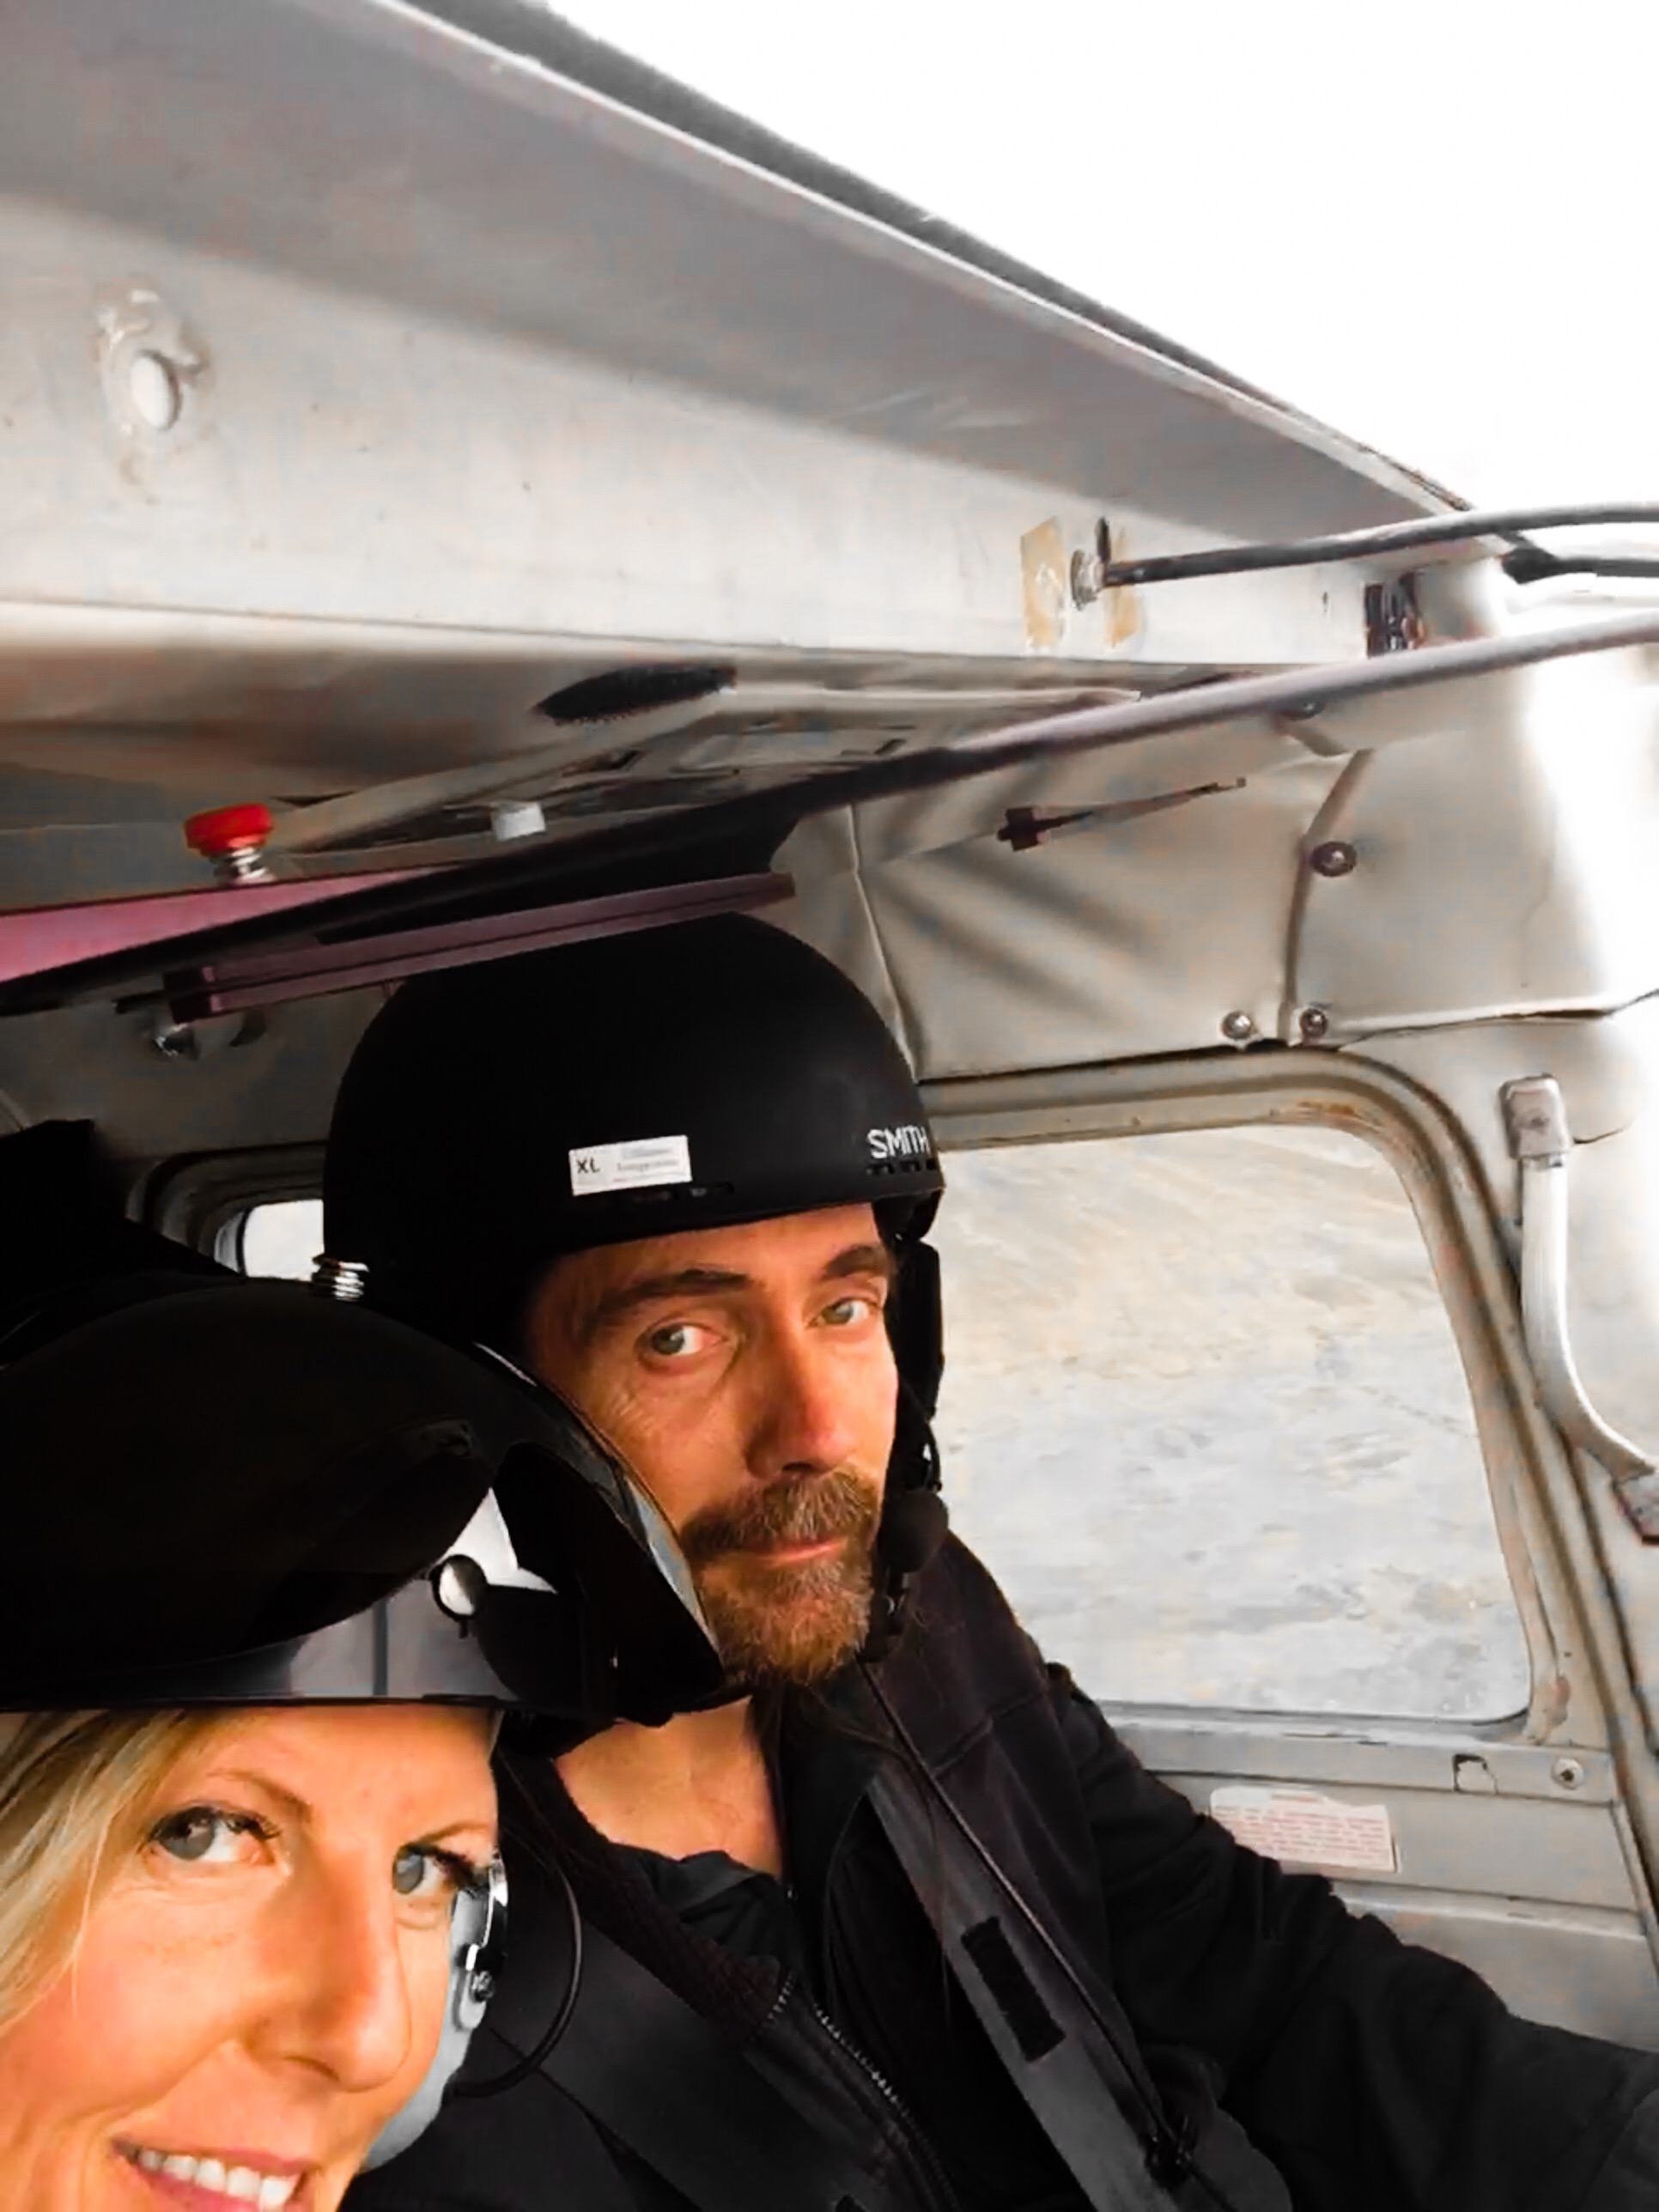 It was nice to have a copilot for a while.
The weather did improve the next day in many ways, but worsened in others. A huge wind came up from the southwest over the mountains, causing turbulence that was visible in the clouds above. Out on the coast plain, it switched to more directly west, but it was unclear how smooth or wet it was. So I launched about 10AM and found it workable on the western side. I continued as far east as I could, stopped by rain squalls, but underneath I could see it gradually improving there. The more lines I did, however, the closer it brought me to the mountains, where the turbulence began. By early afternoon, I was low on fuel and tired of getting bounced around, so returned to Kavik to freshen up with a full load and map in the Barter Island area. By late afternoon the rains had stopped there, but the winds remained strong, blowing about 40-45 knots from the west. Fortunately it was mostly smooth, so I just accepted the huge differential in speed going from one line to the next and enjoyed the view and flew late into the evening for about 9 hours of mapping that day.
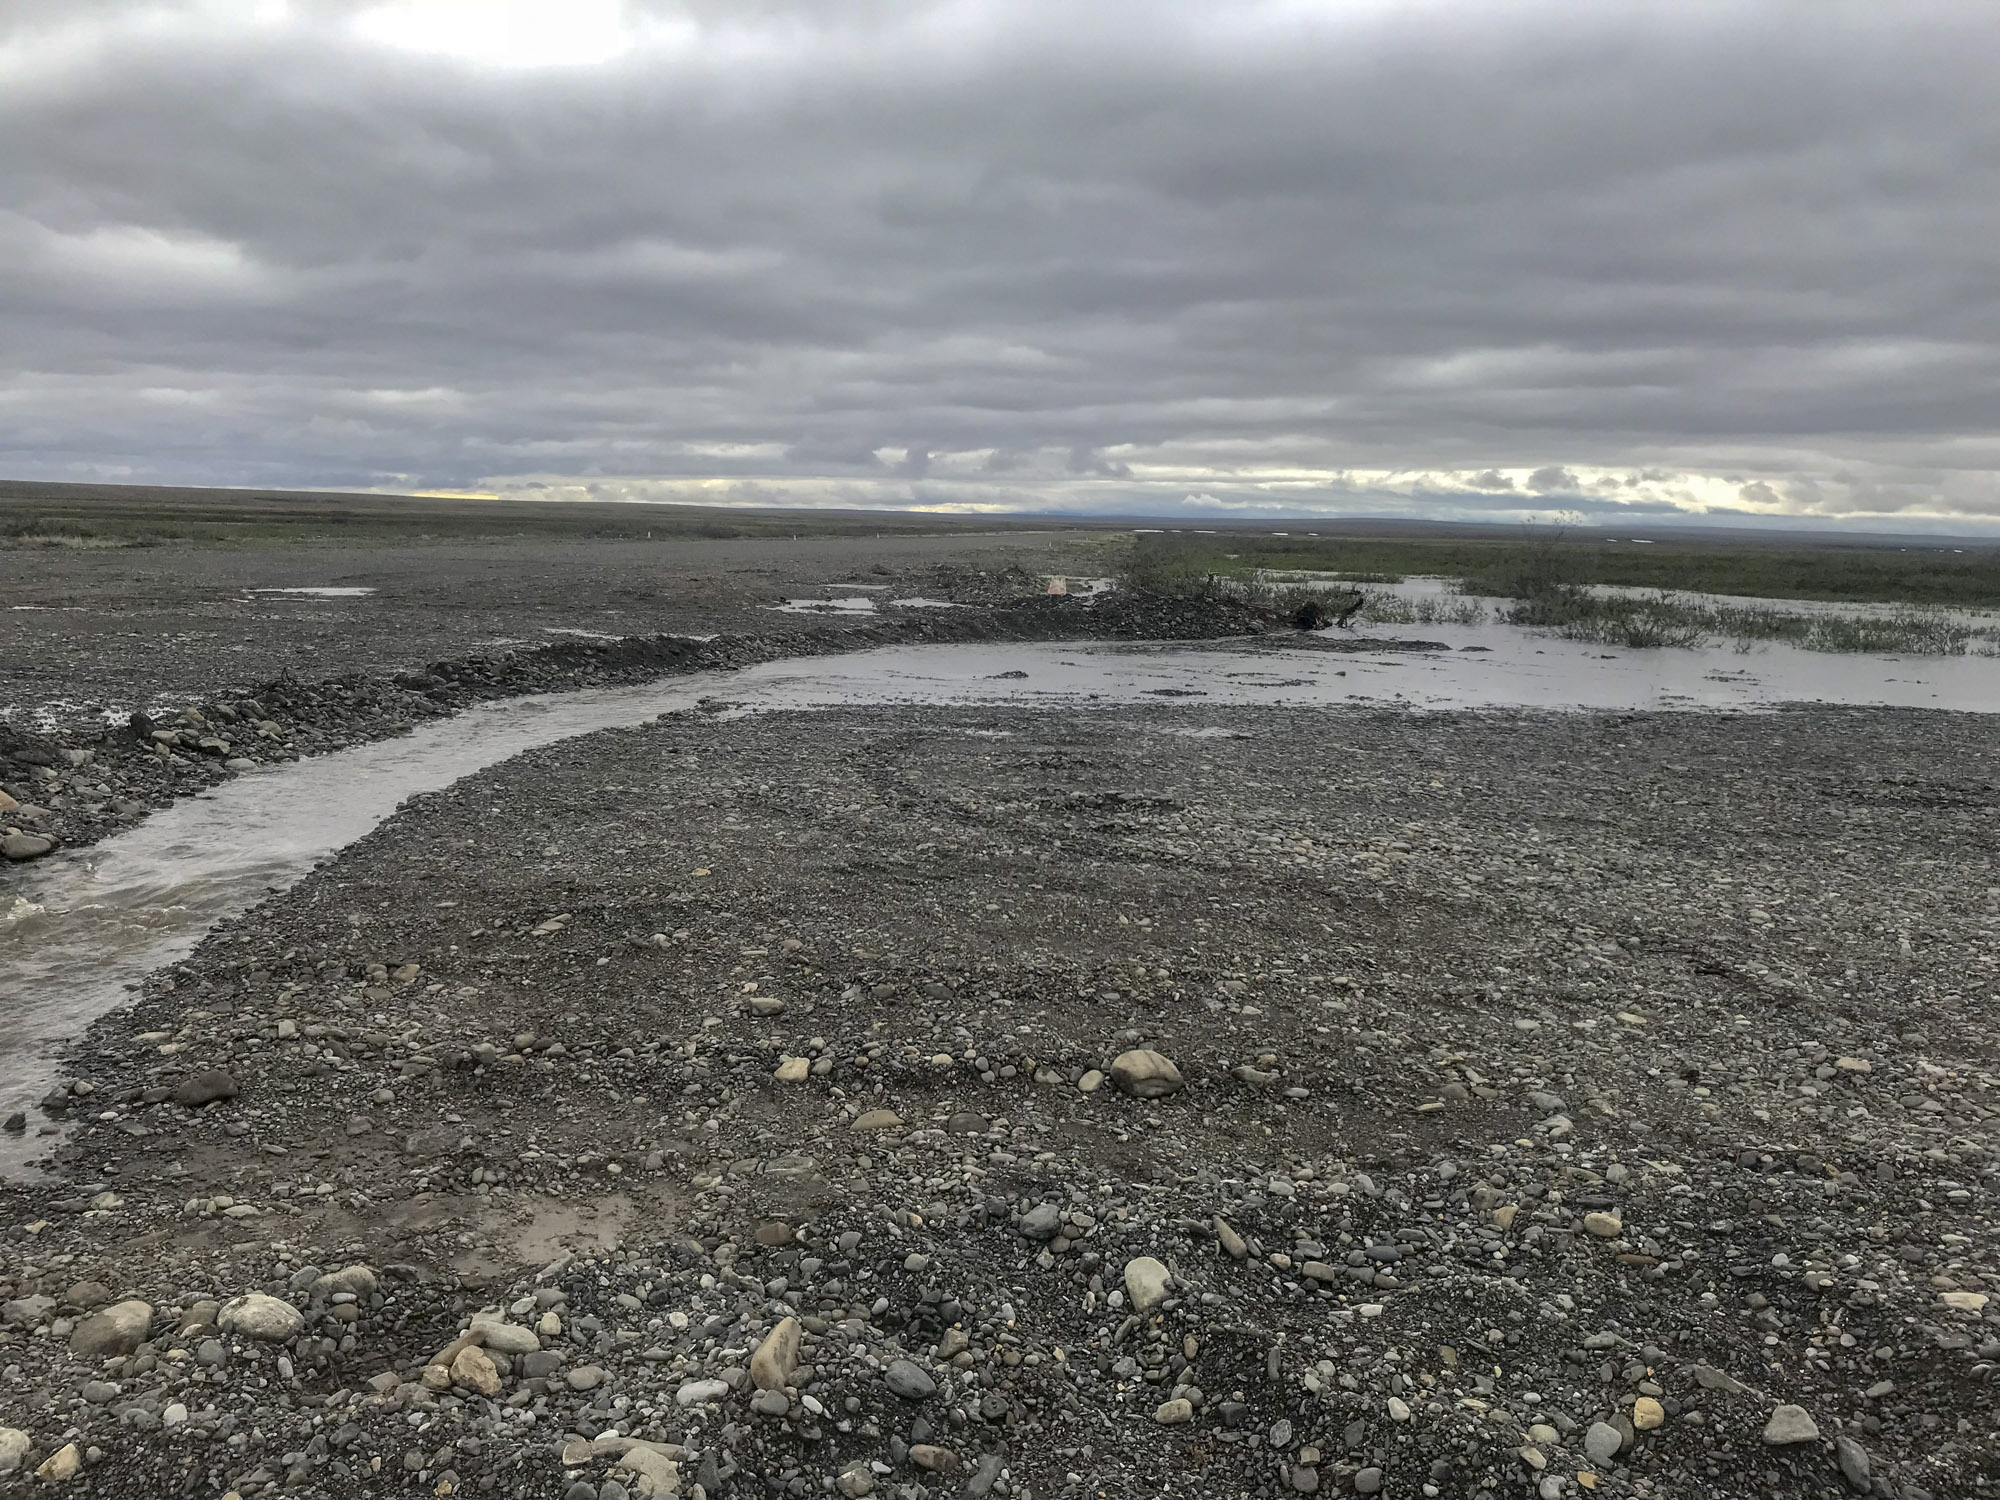
This small river is running between the runway and ramp at Kavik, draining the lake that formed during the previous days’ rain. Rick has to break out the loader to build a bridge to let planes in and out at times like these.
The next day the lake had drained and the ramp was reconnected, but in the distance near center you can see the turbulence caused by the strong mountain winds as revealed by the clouds. Fortunately I was able to stay to left of that nastiness.
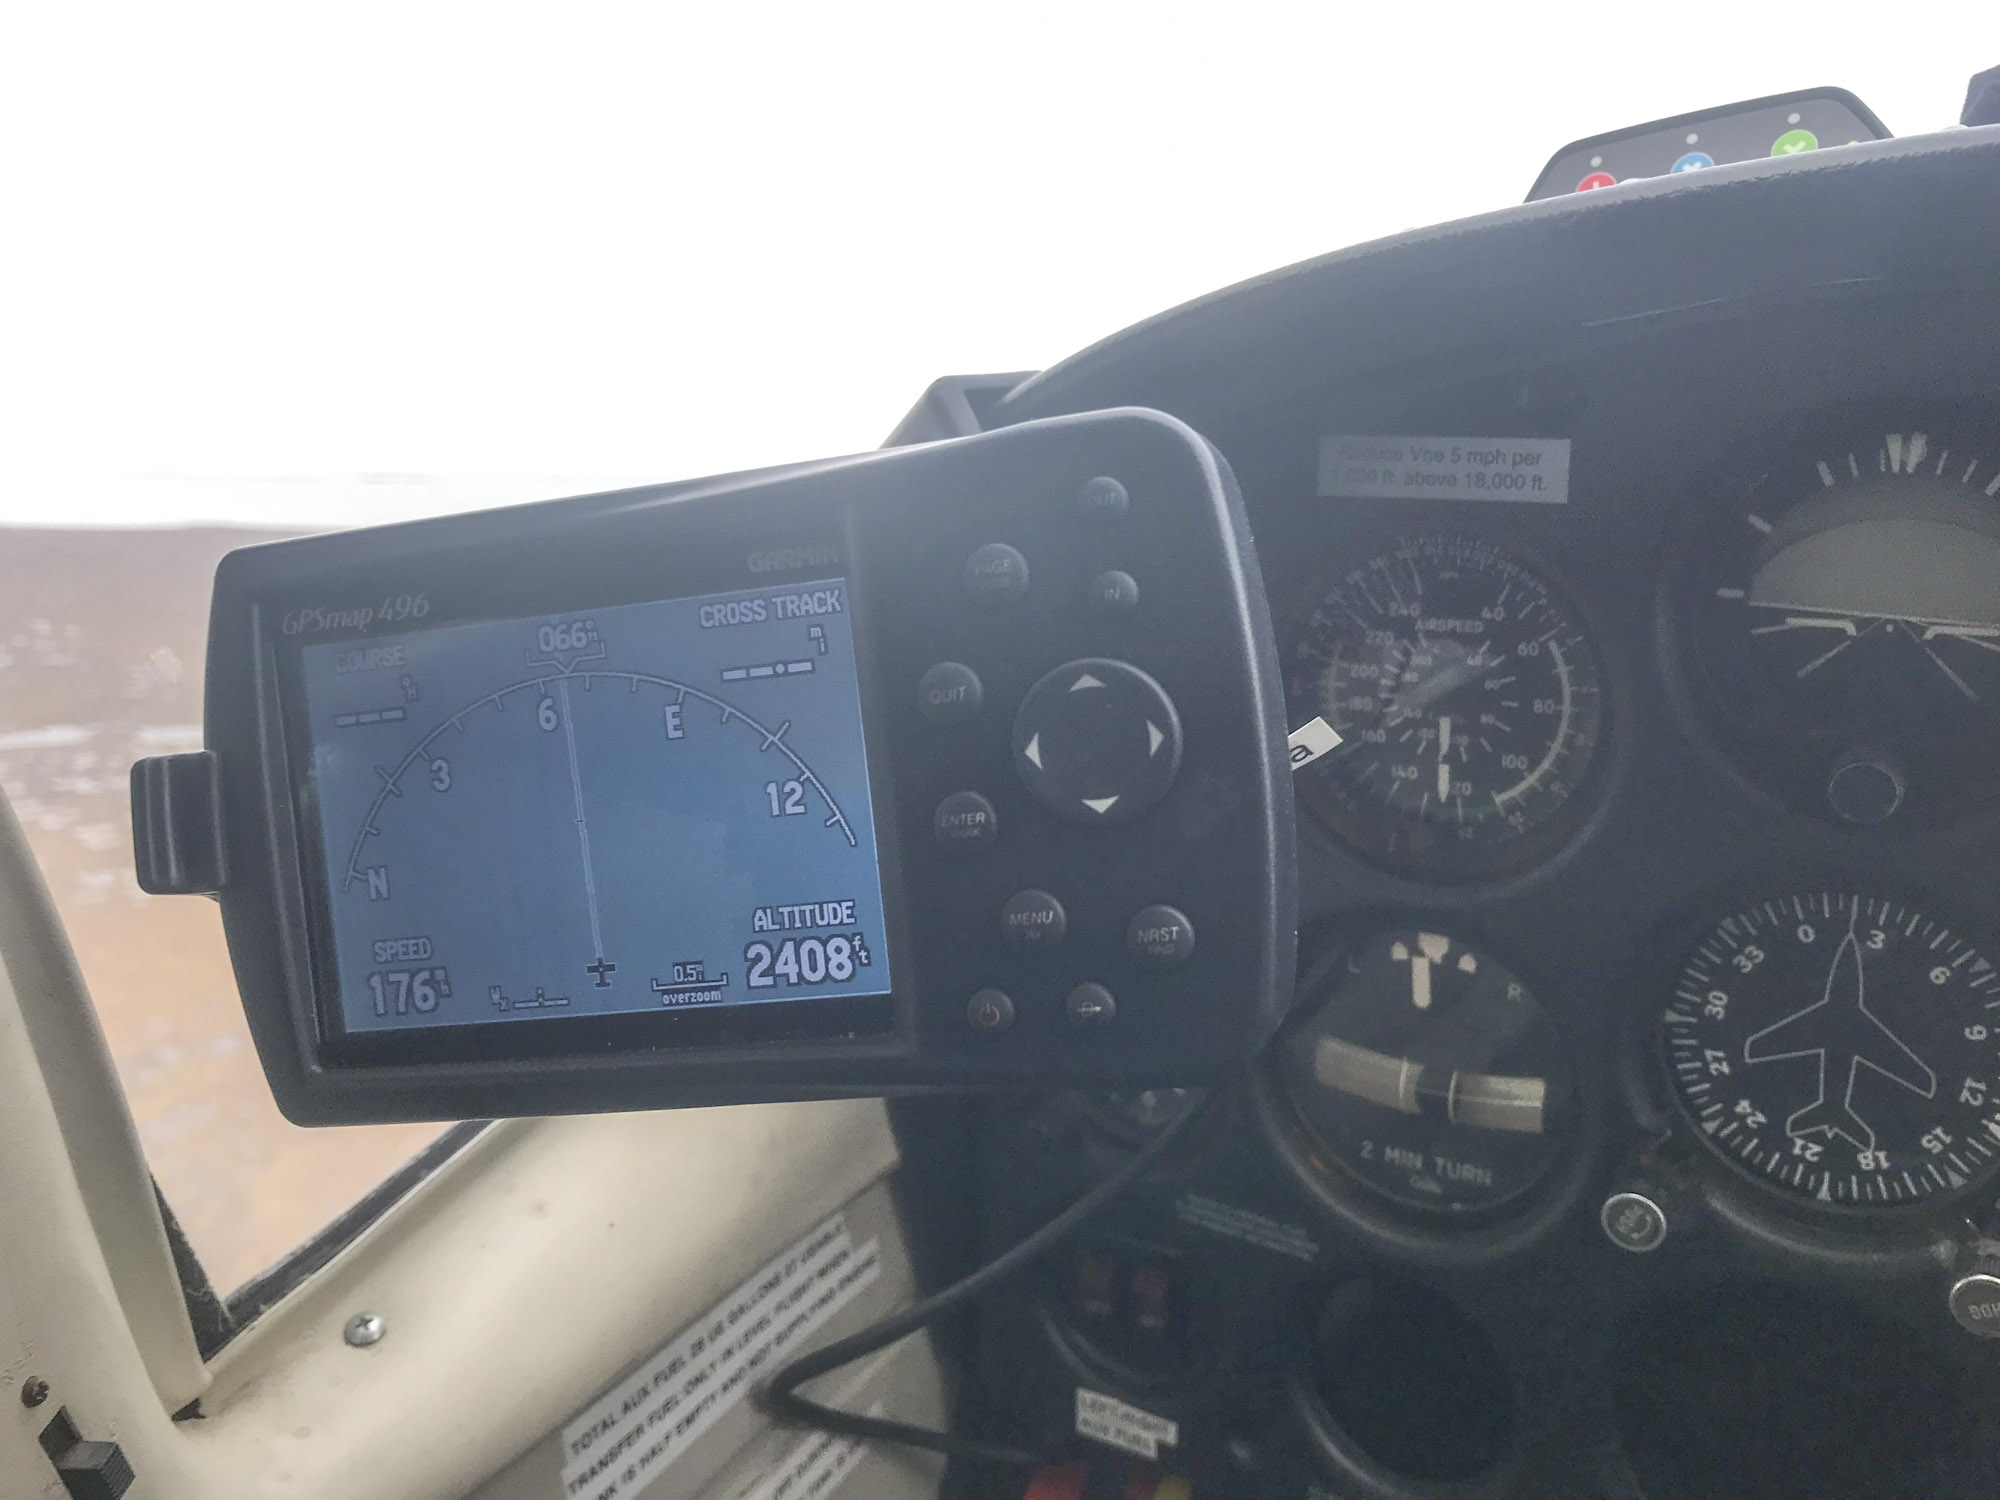 At left you can see my GPS indicated a ground speed of 176 mph, but my airspeed indicator to the right of it is indicating about 125 mph, meaning that I’m getting a 50 mph push from the air.
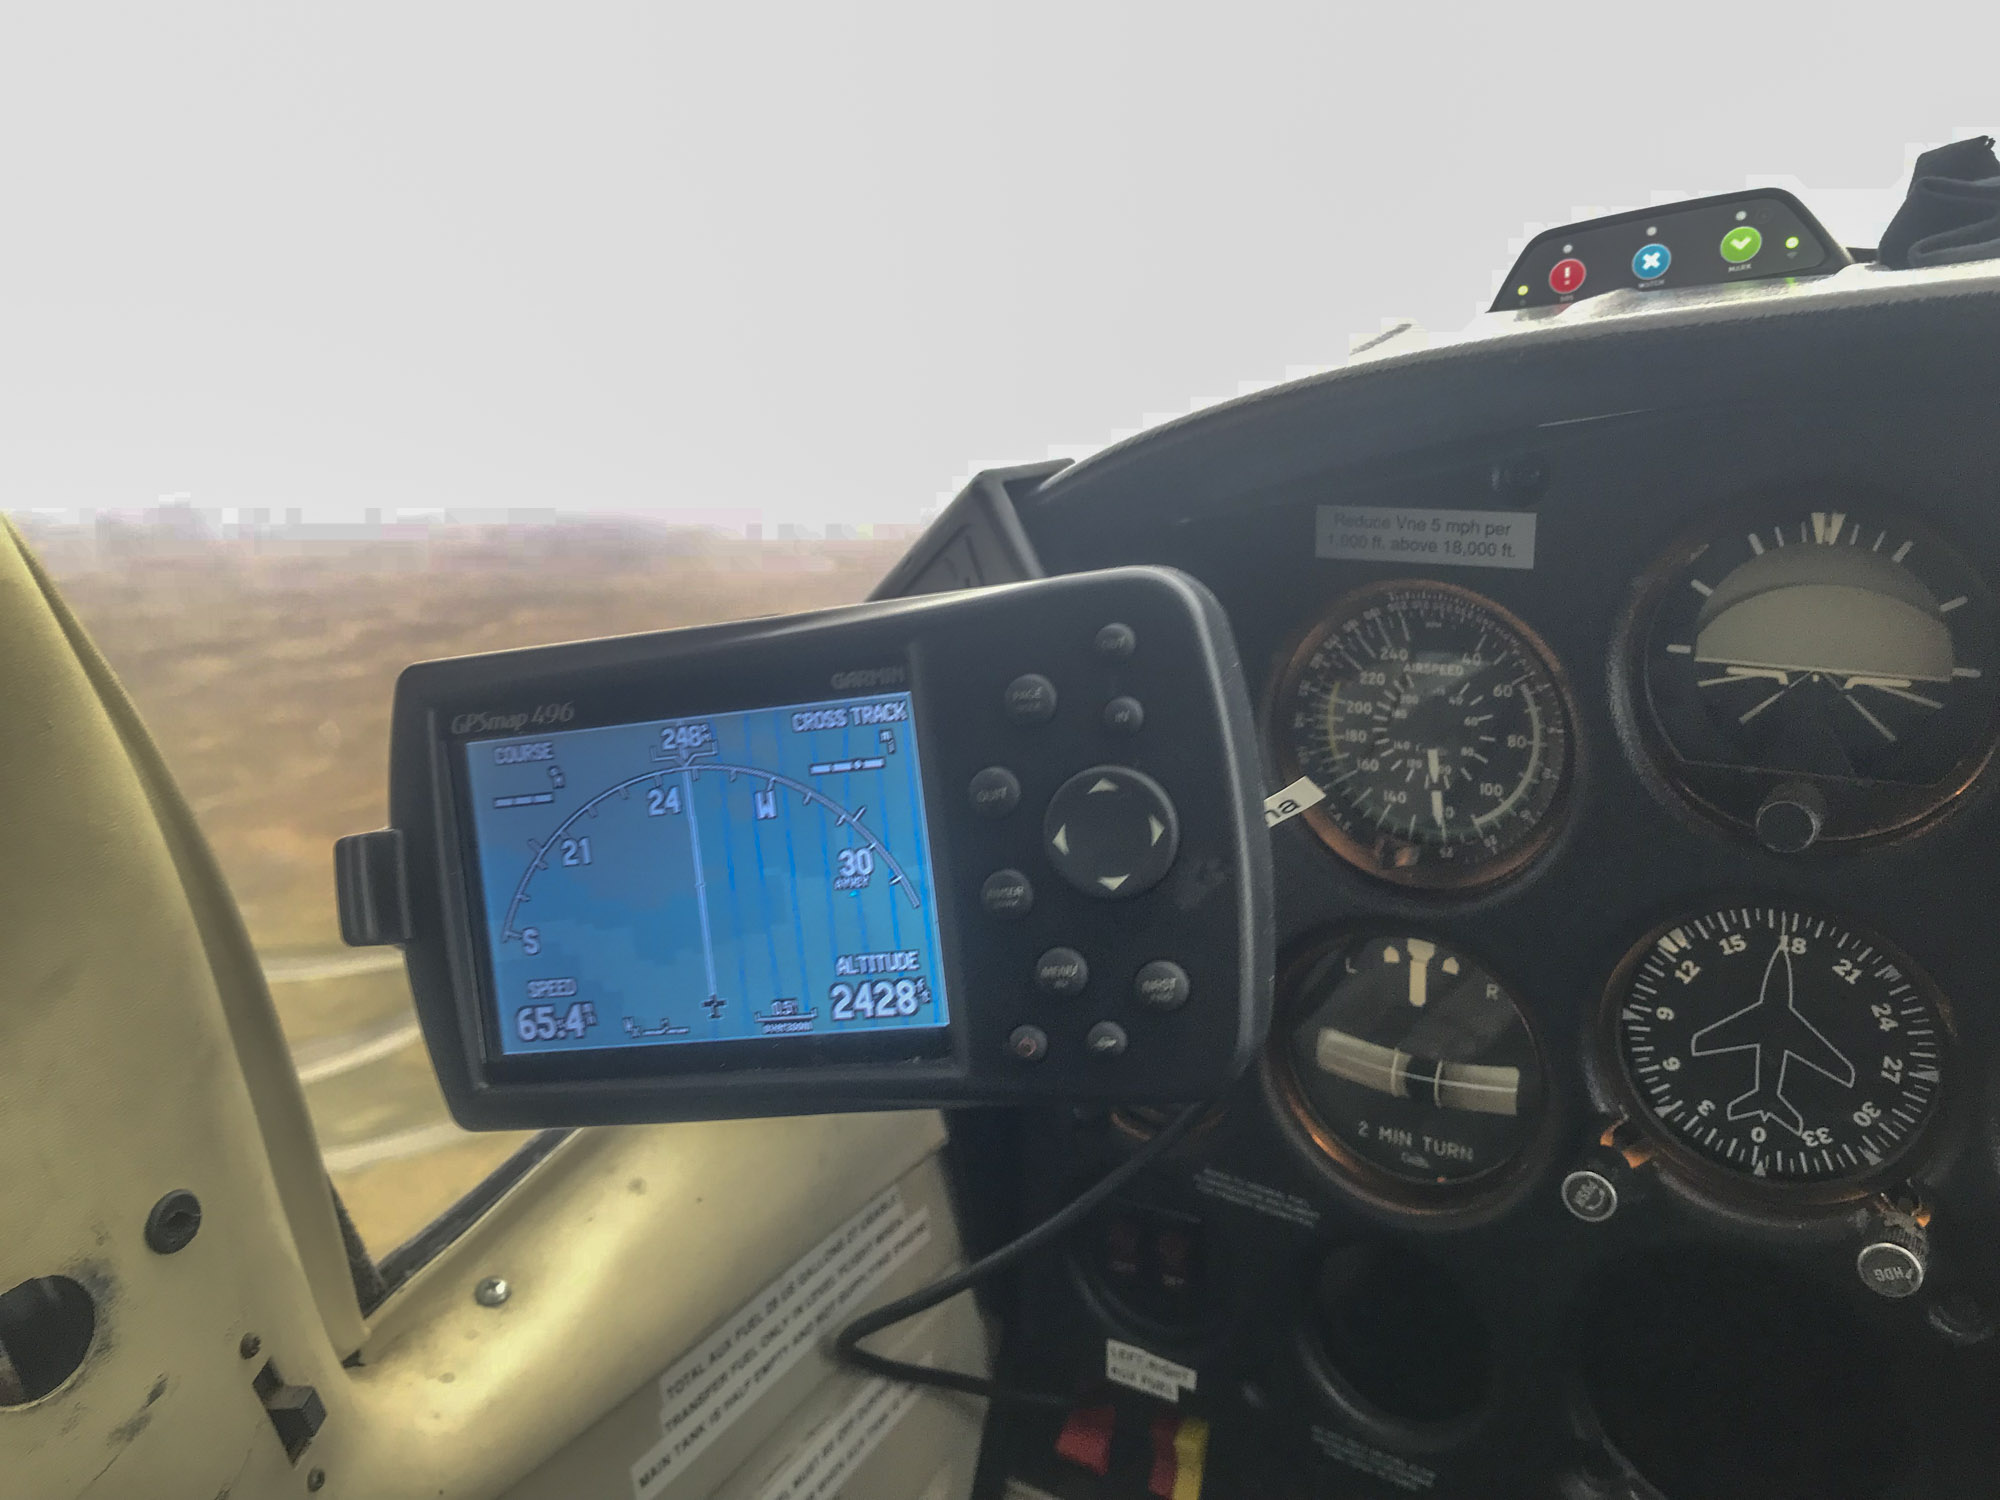 Heading the other way, I’m getting slowed down by over 50 mph. It more or less ends up a wash in terms of flight time, but mapping at 180 mph requires a lot more focus because even minor deviations in heading quickly get you far off course.
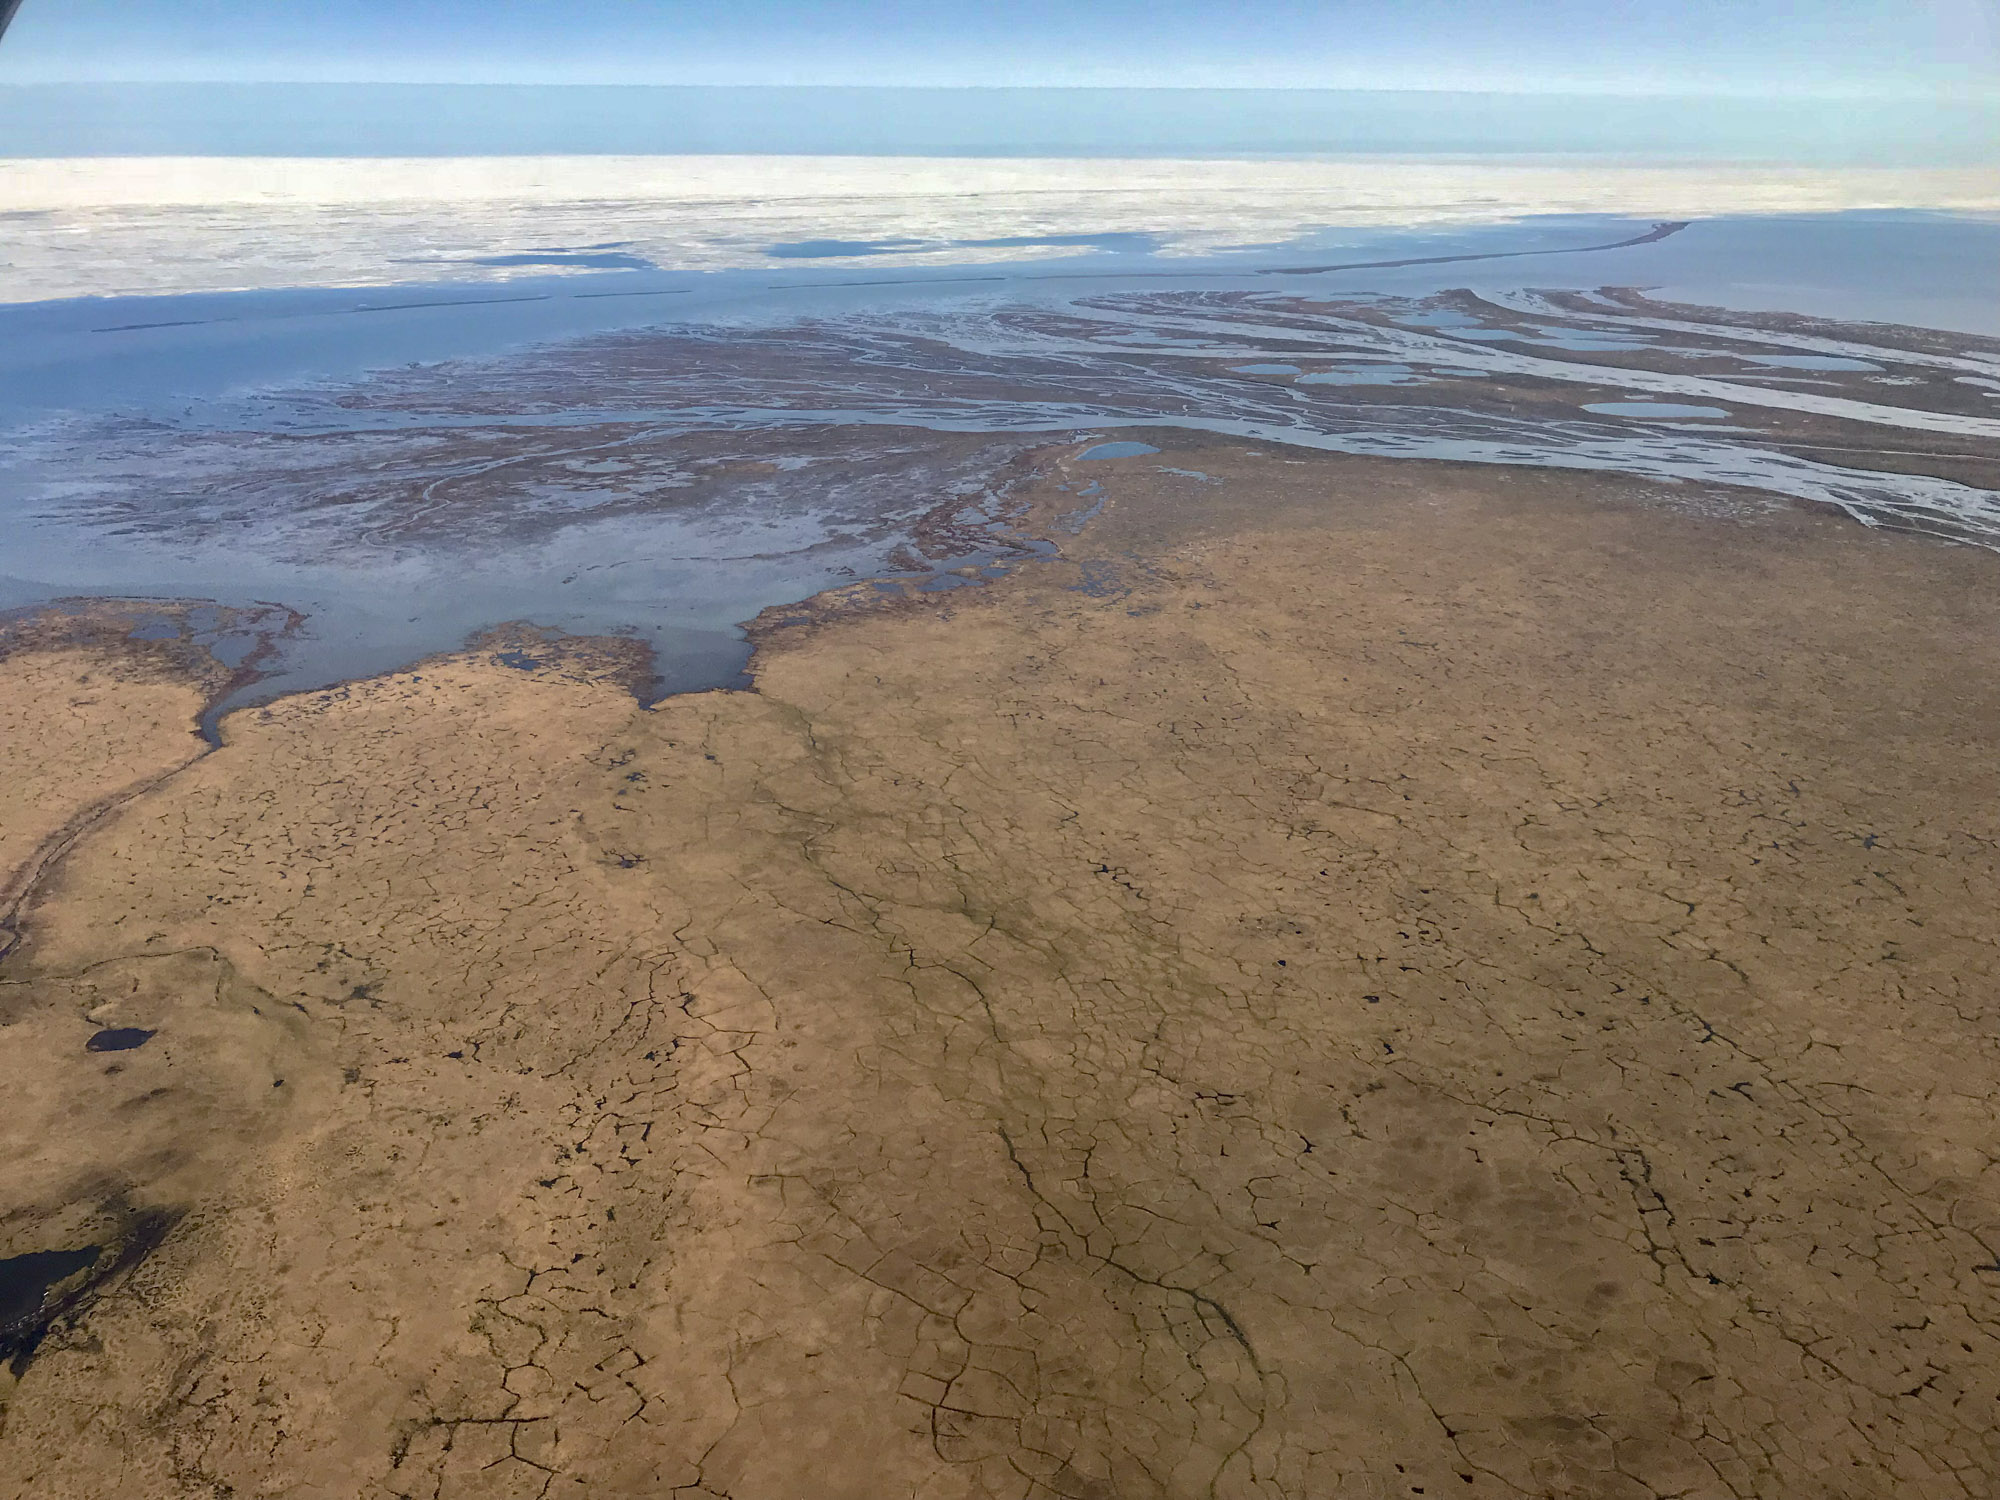
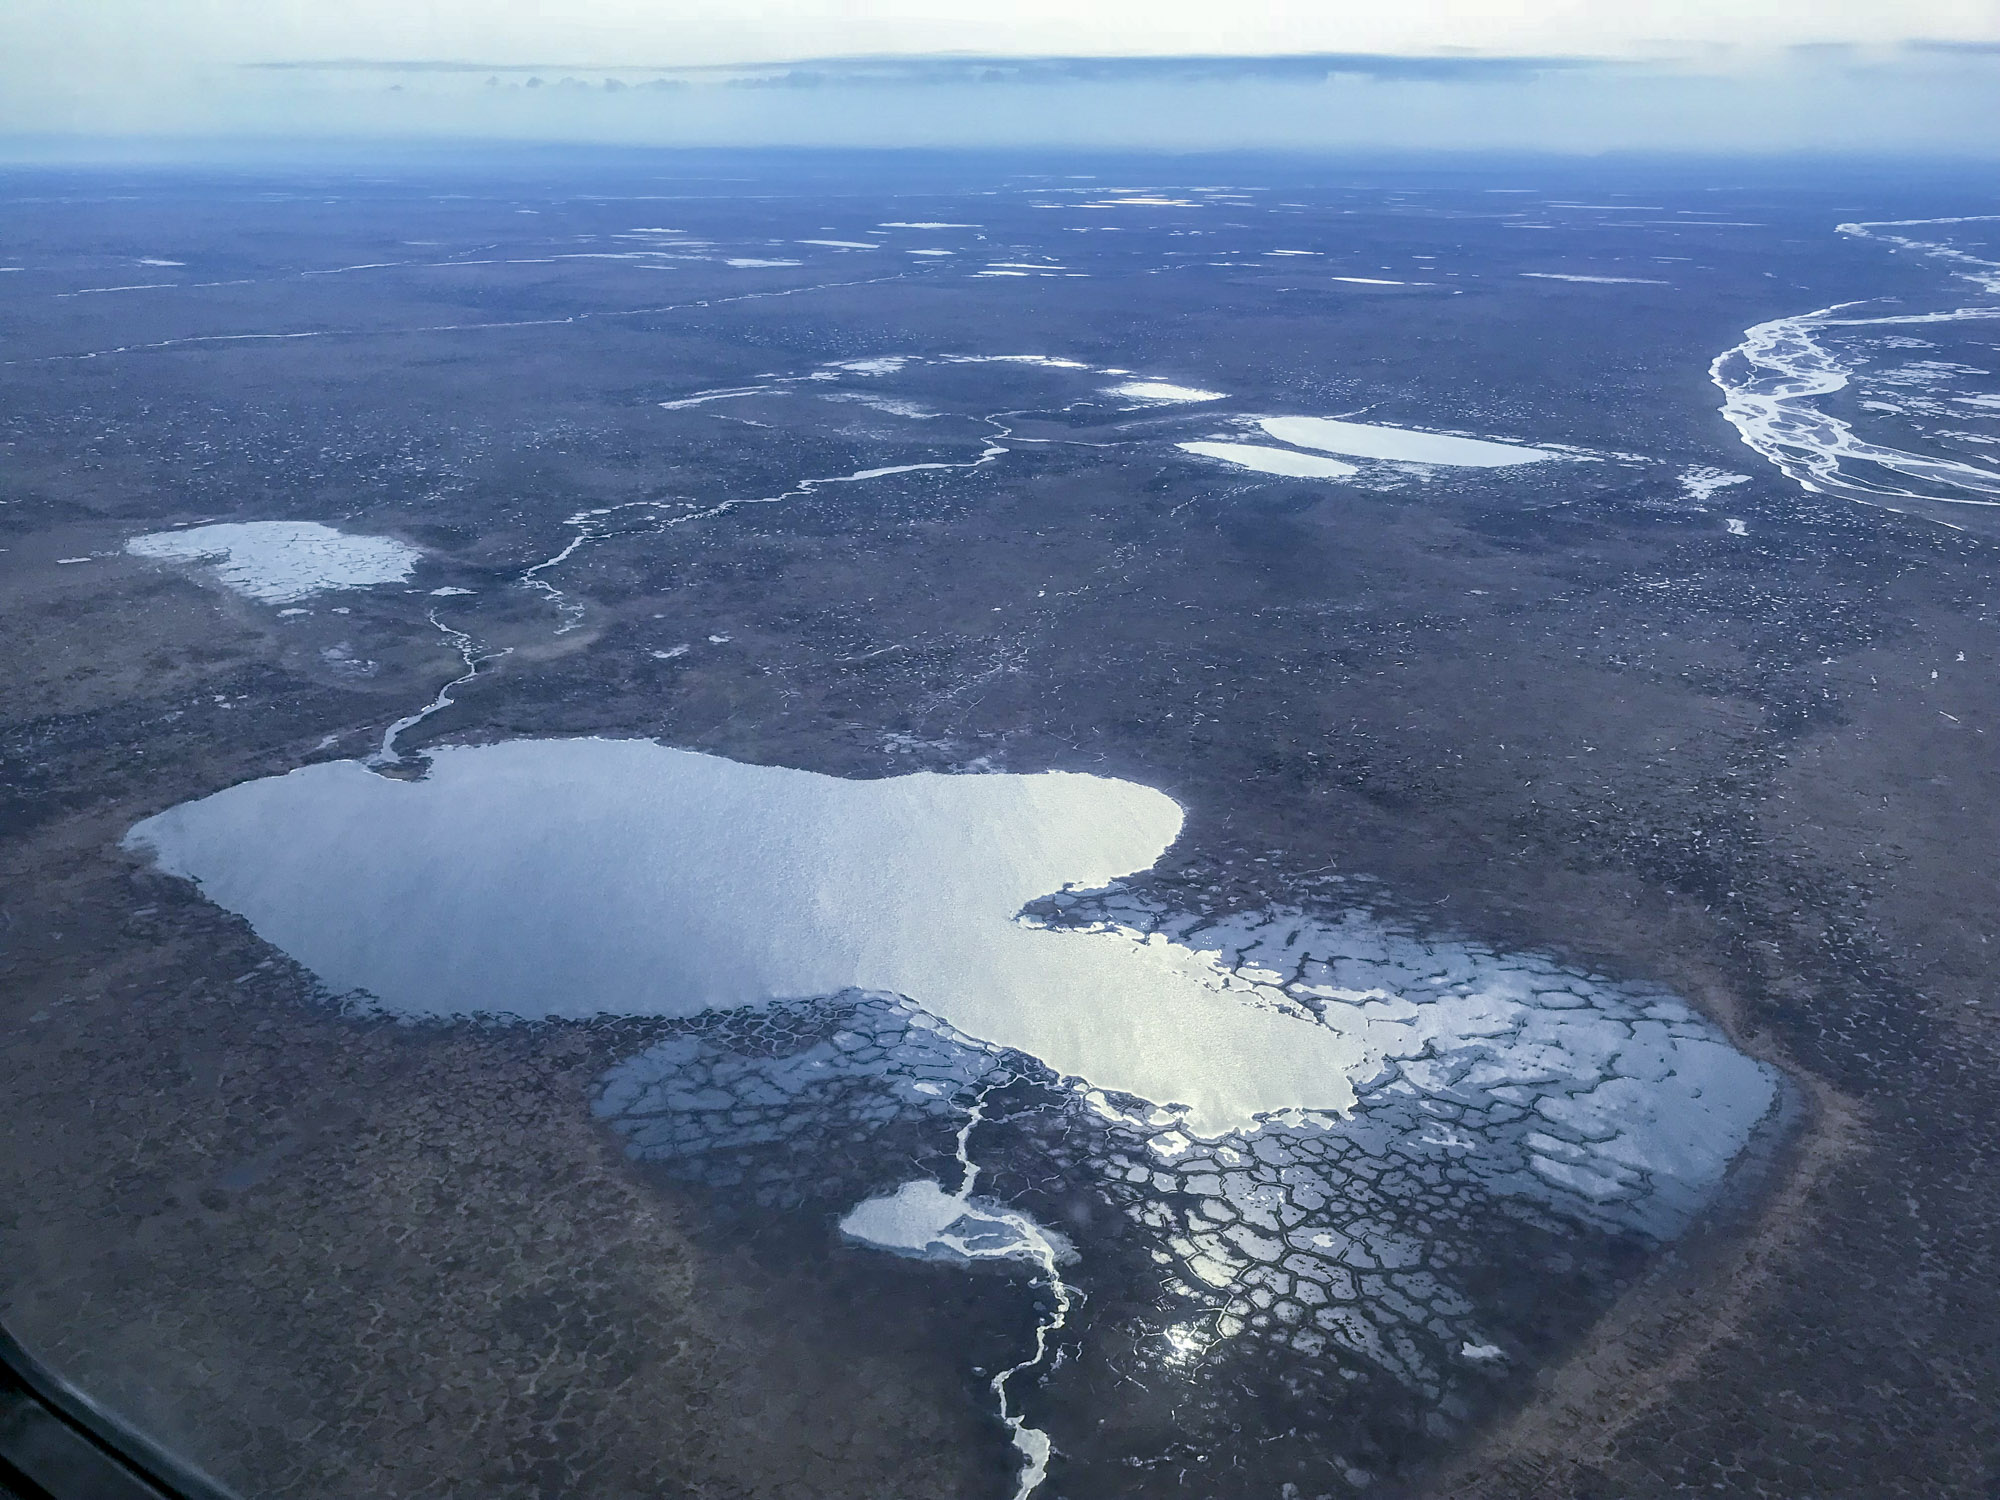
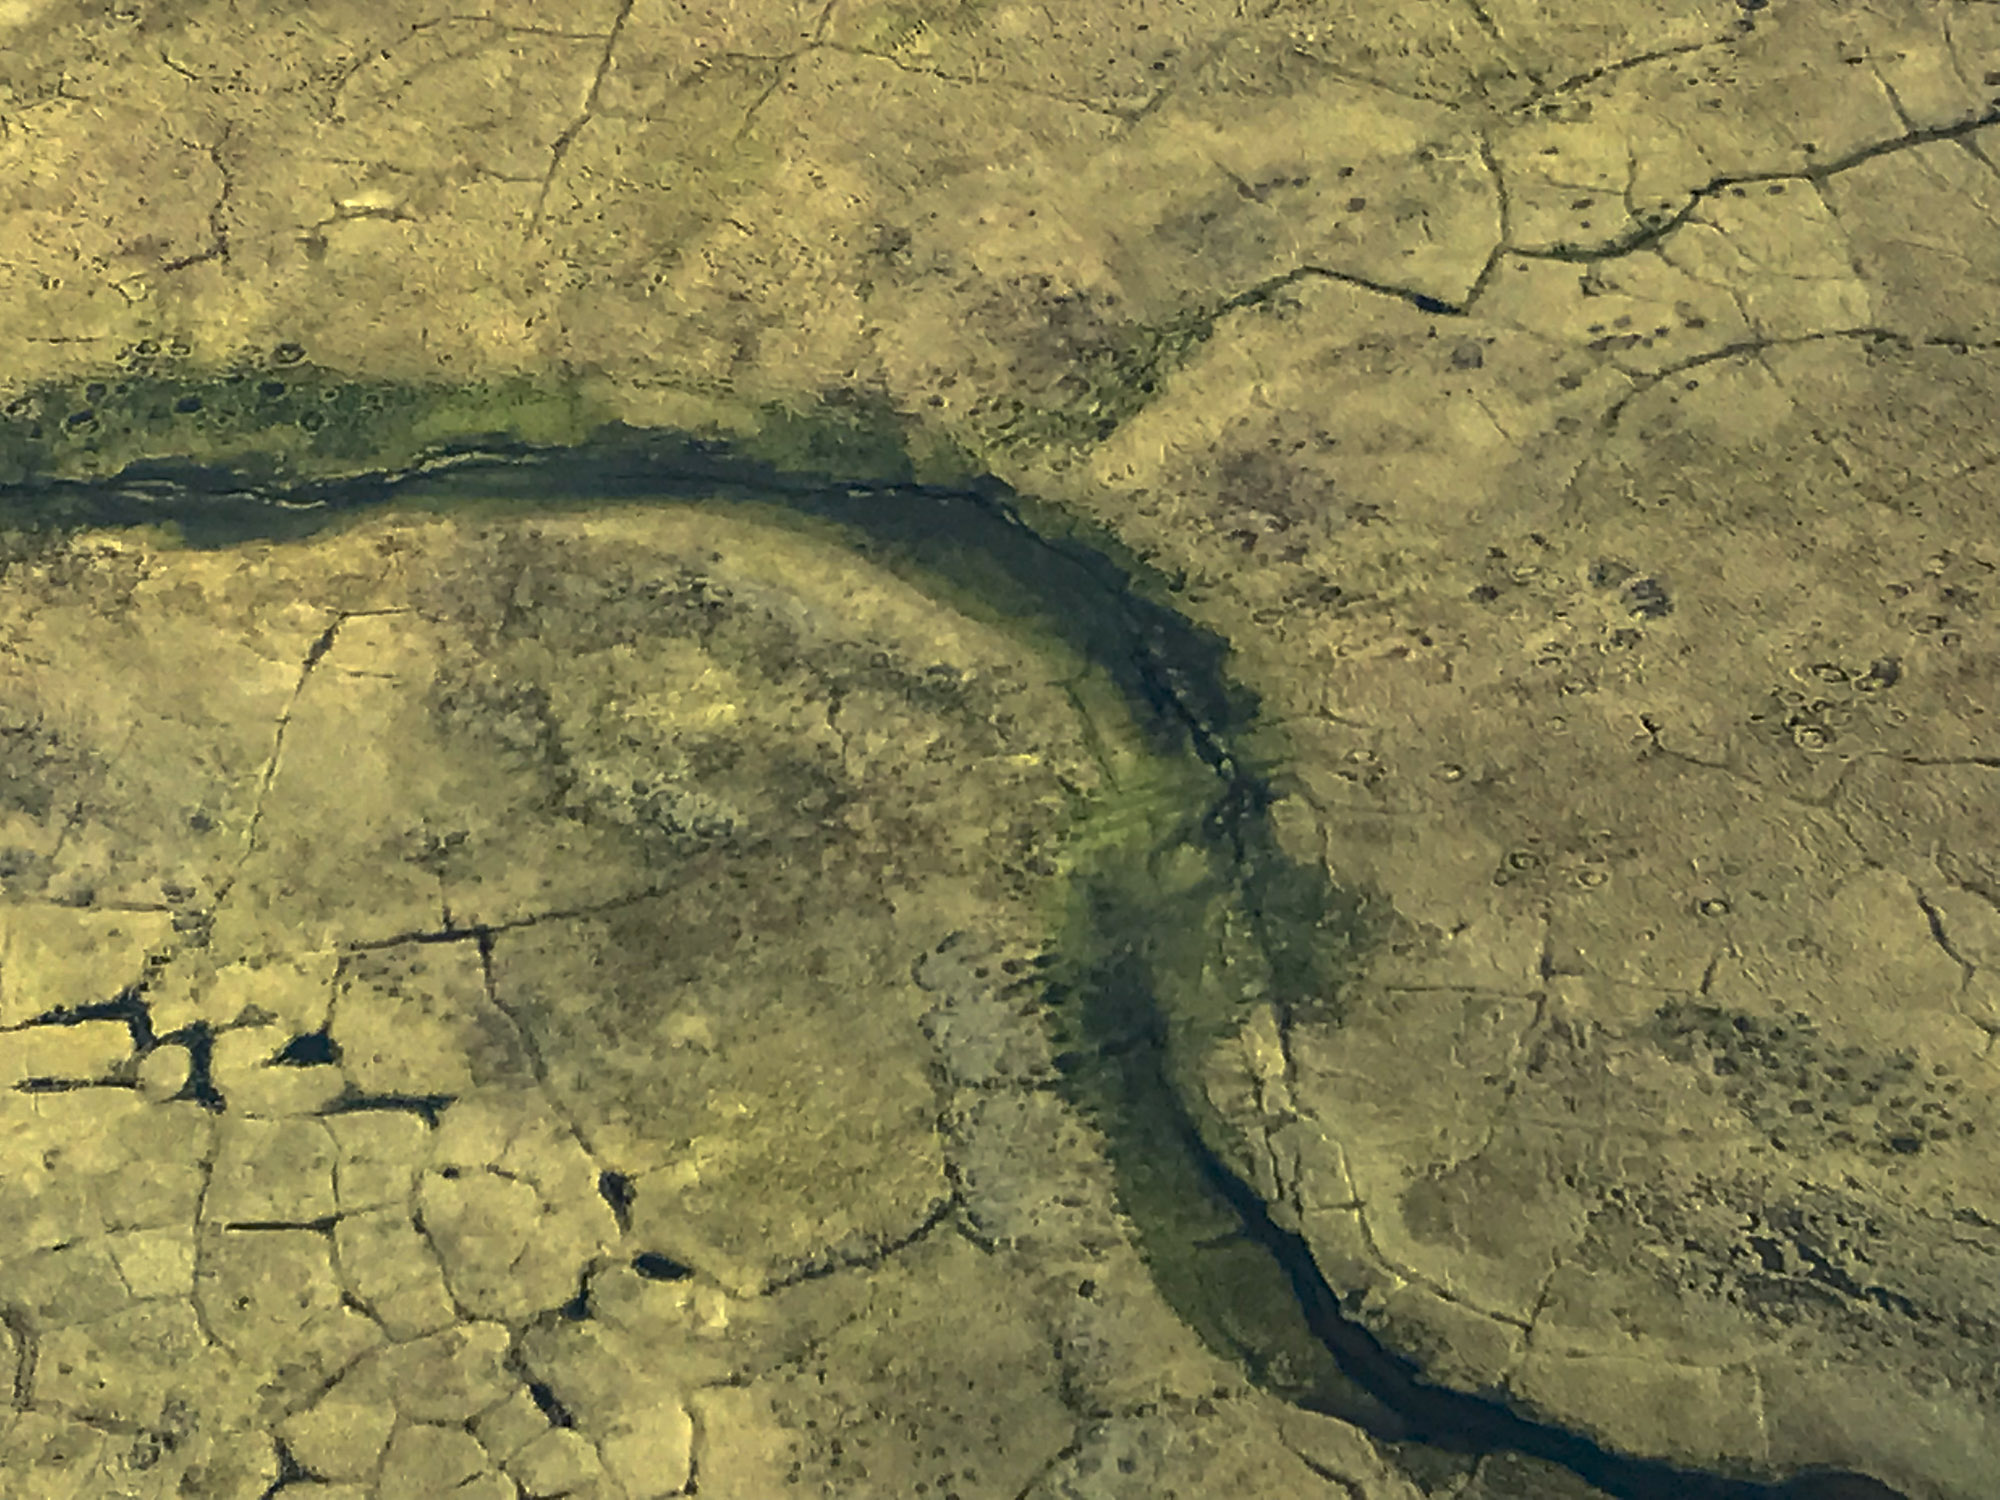
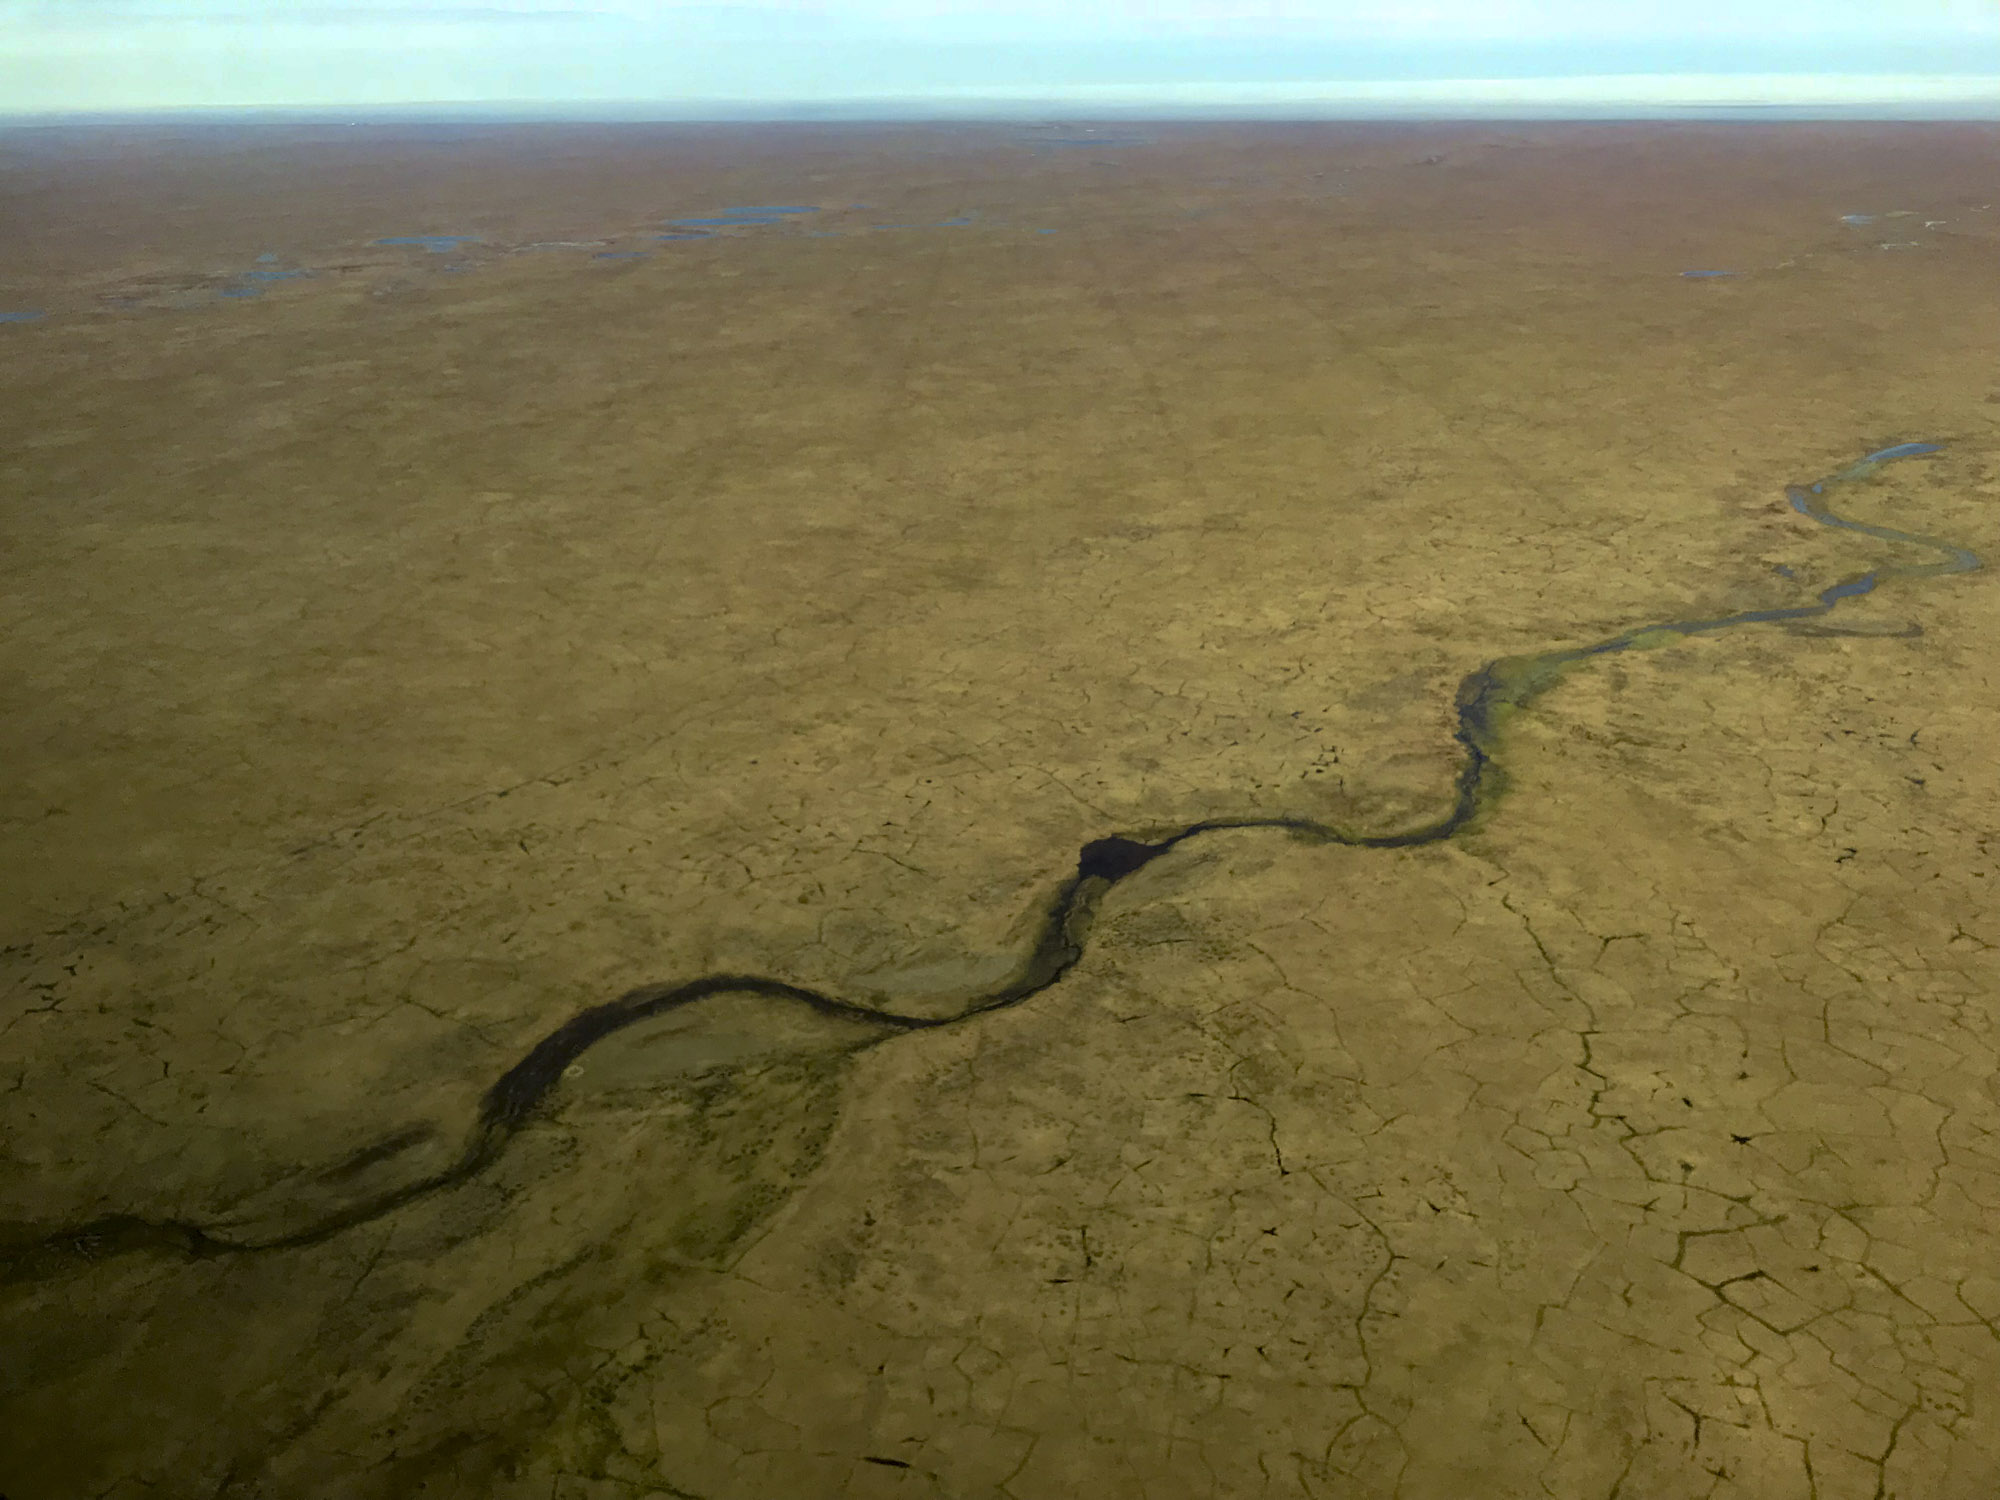
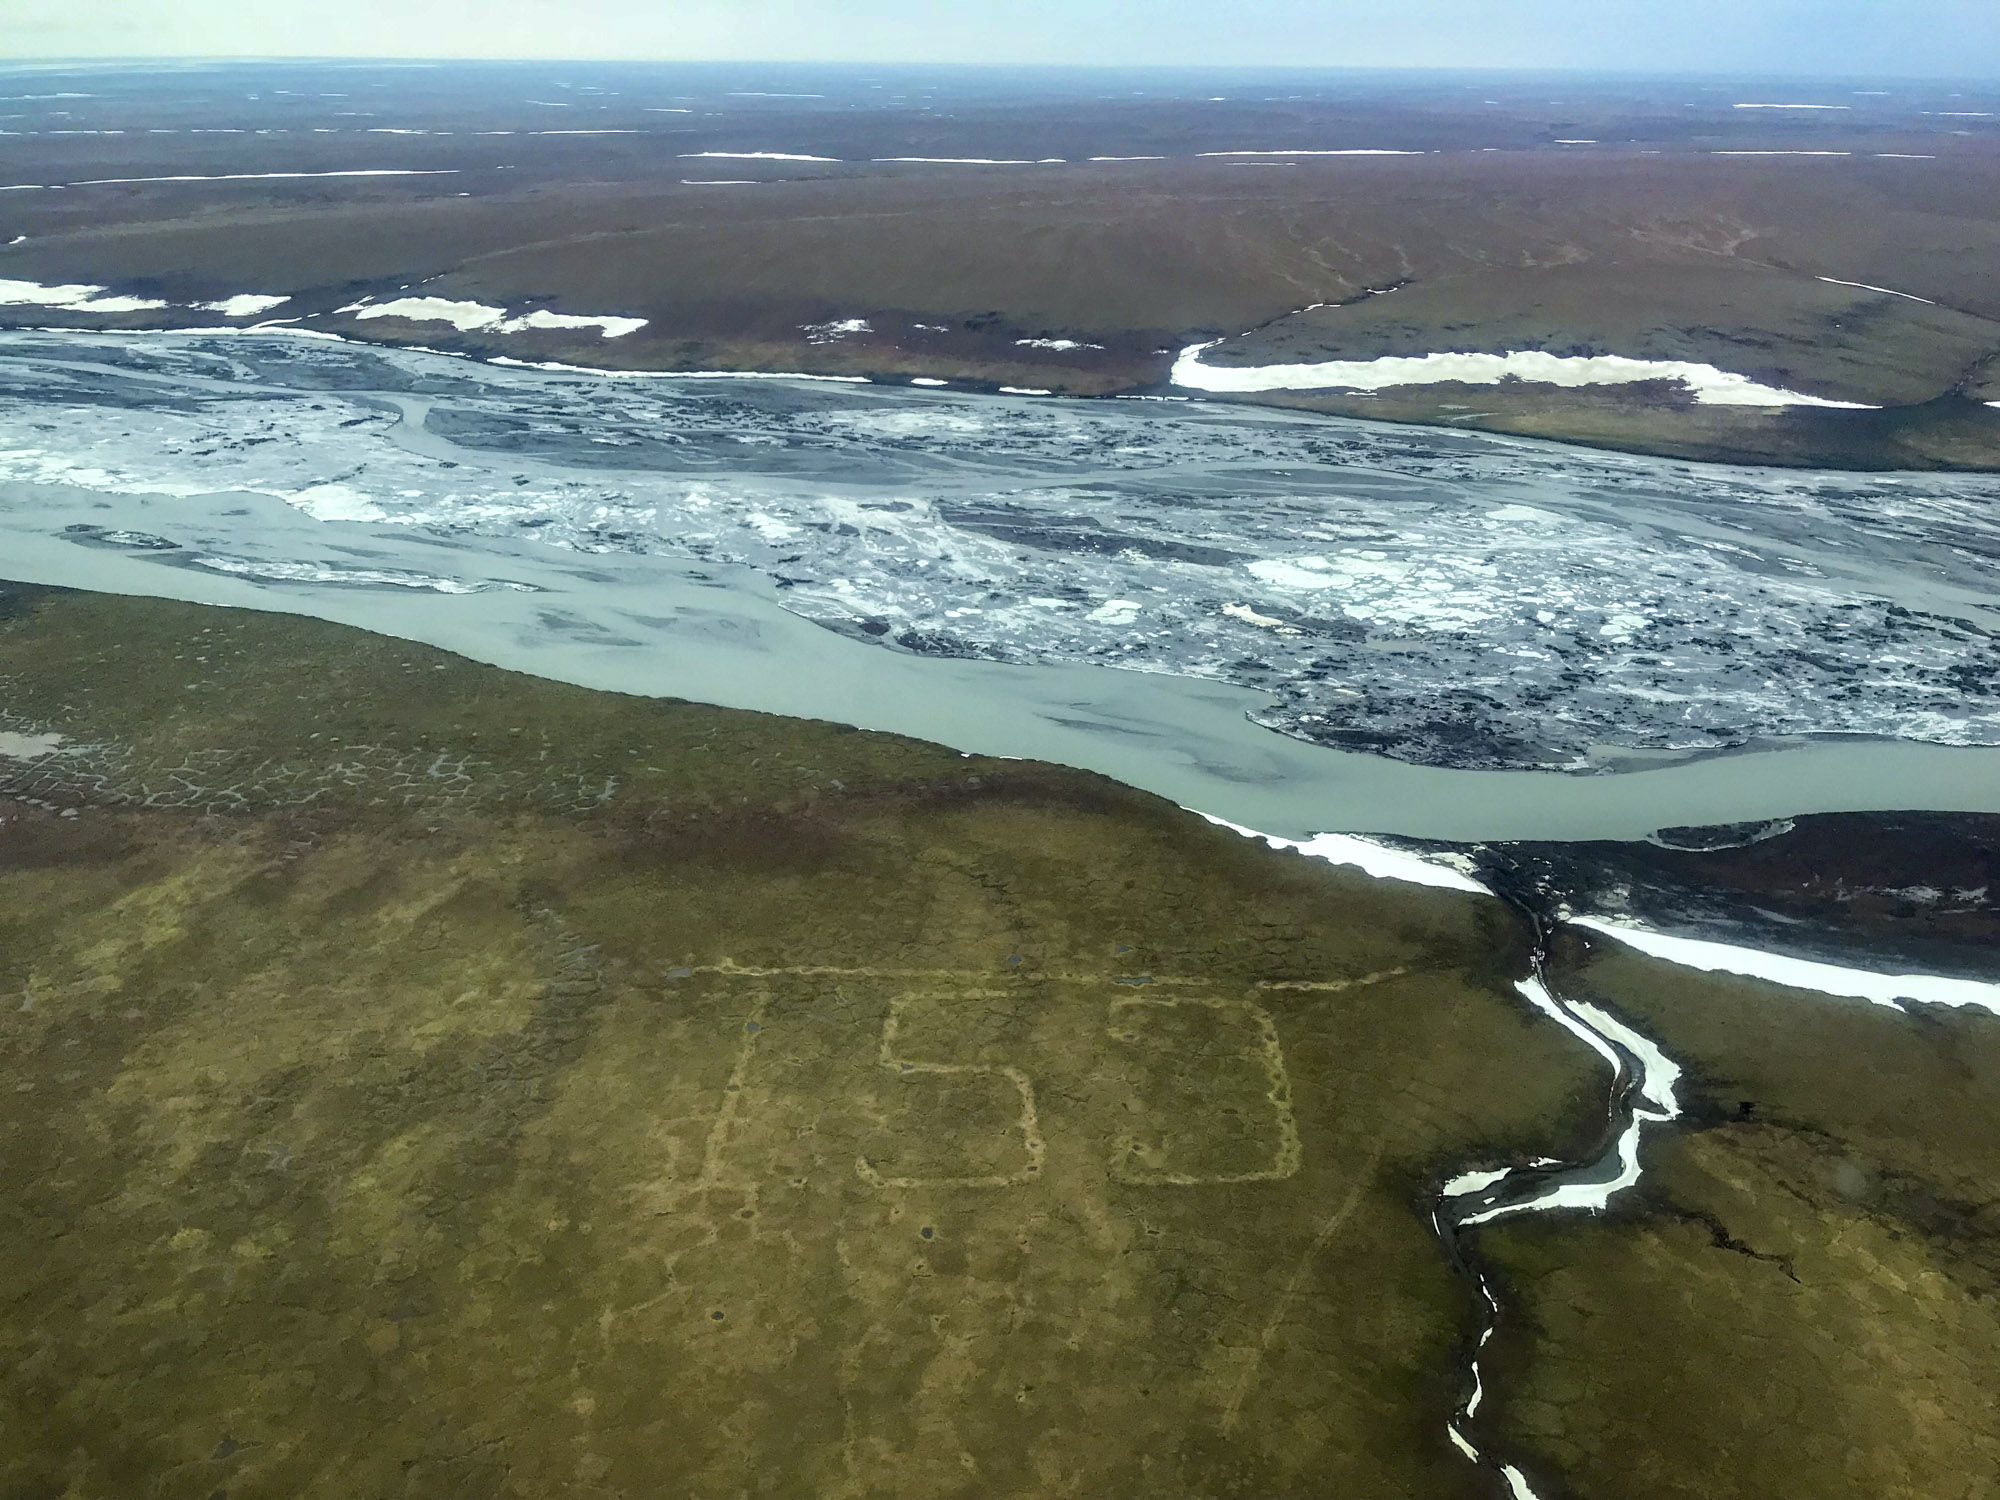
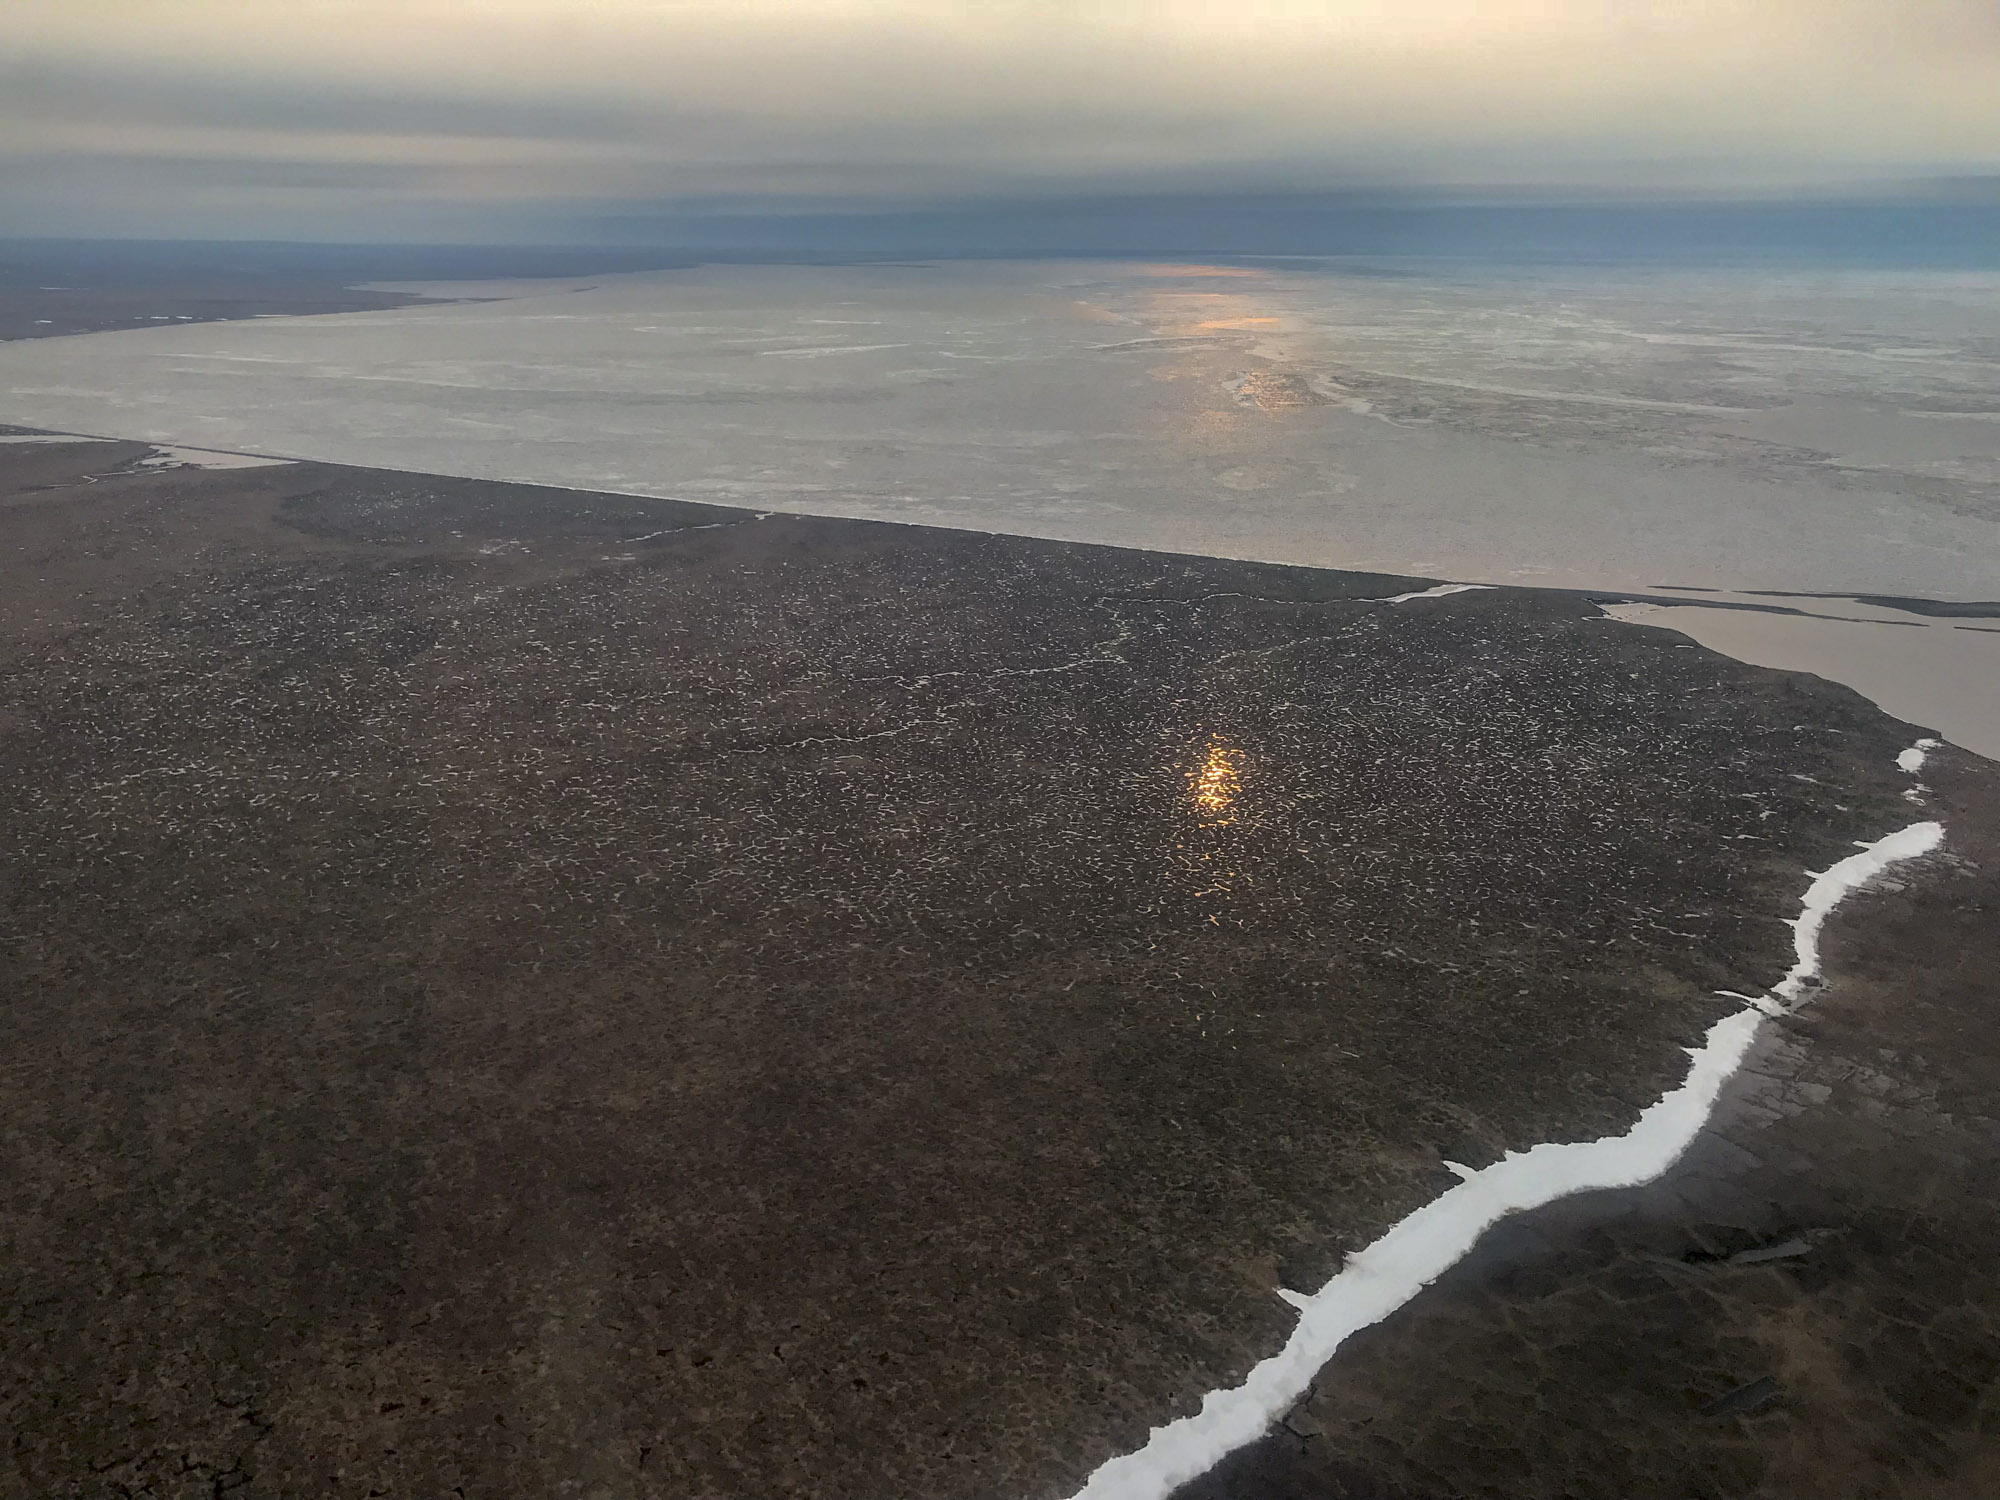
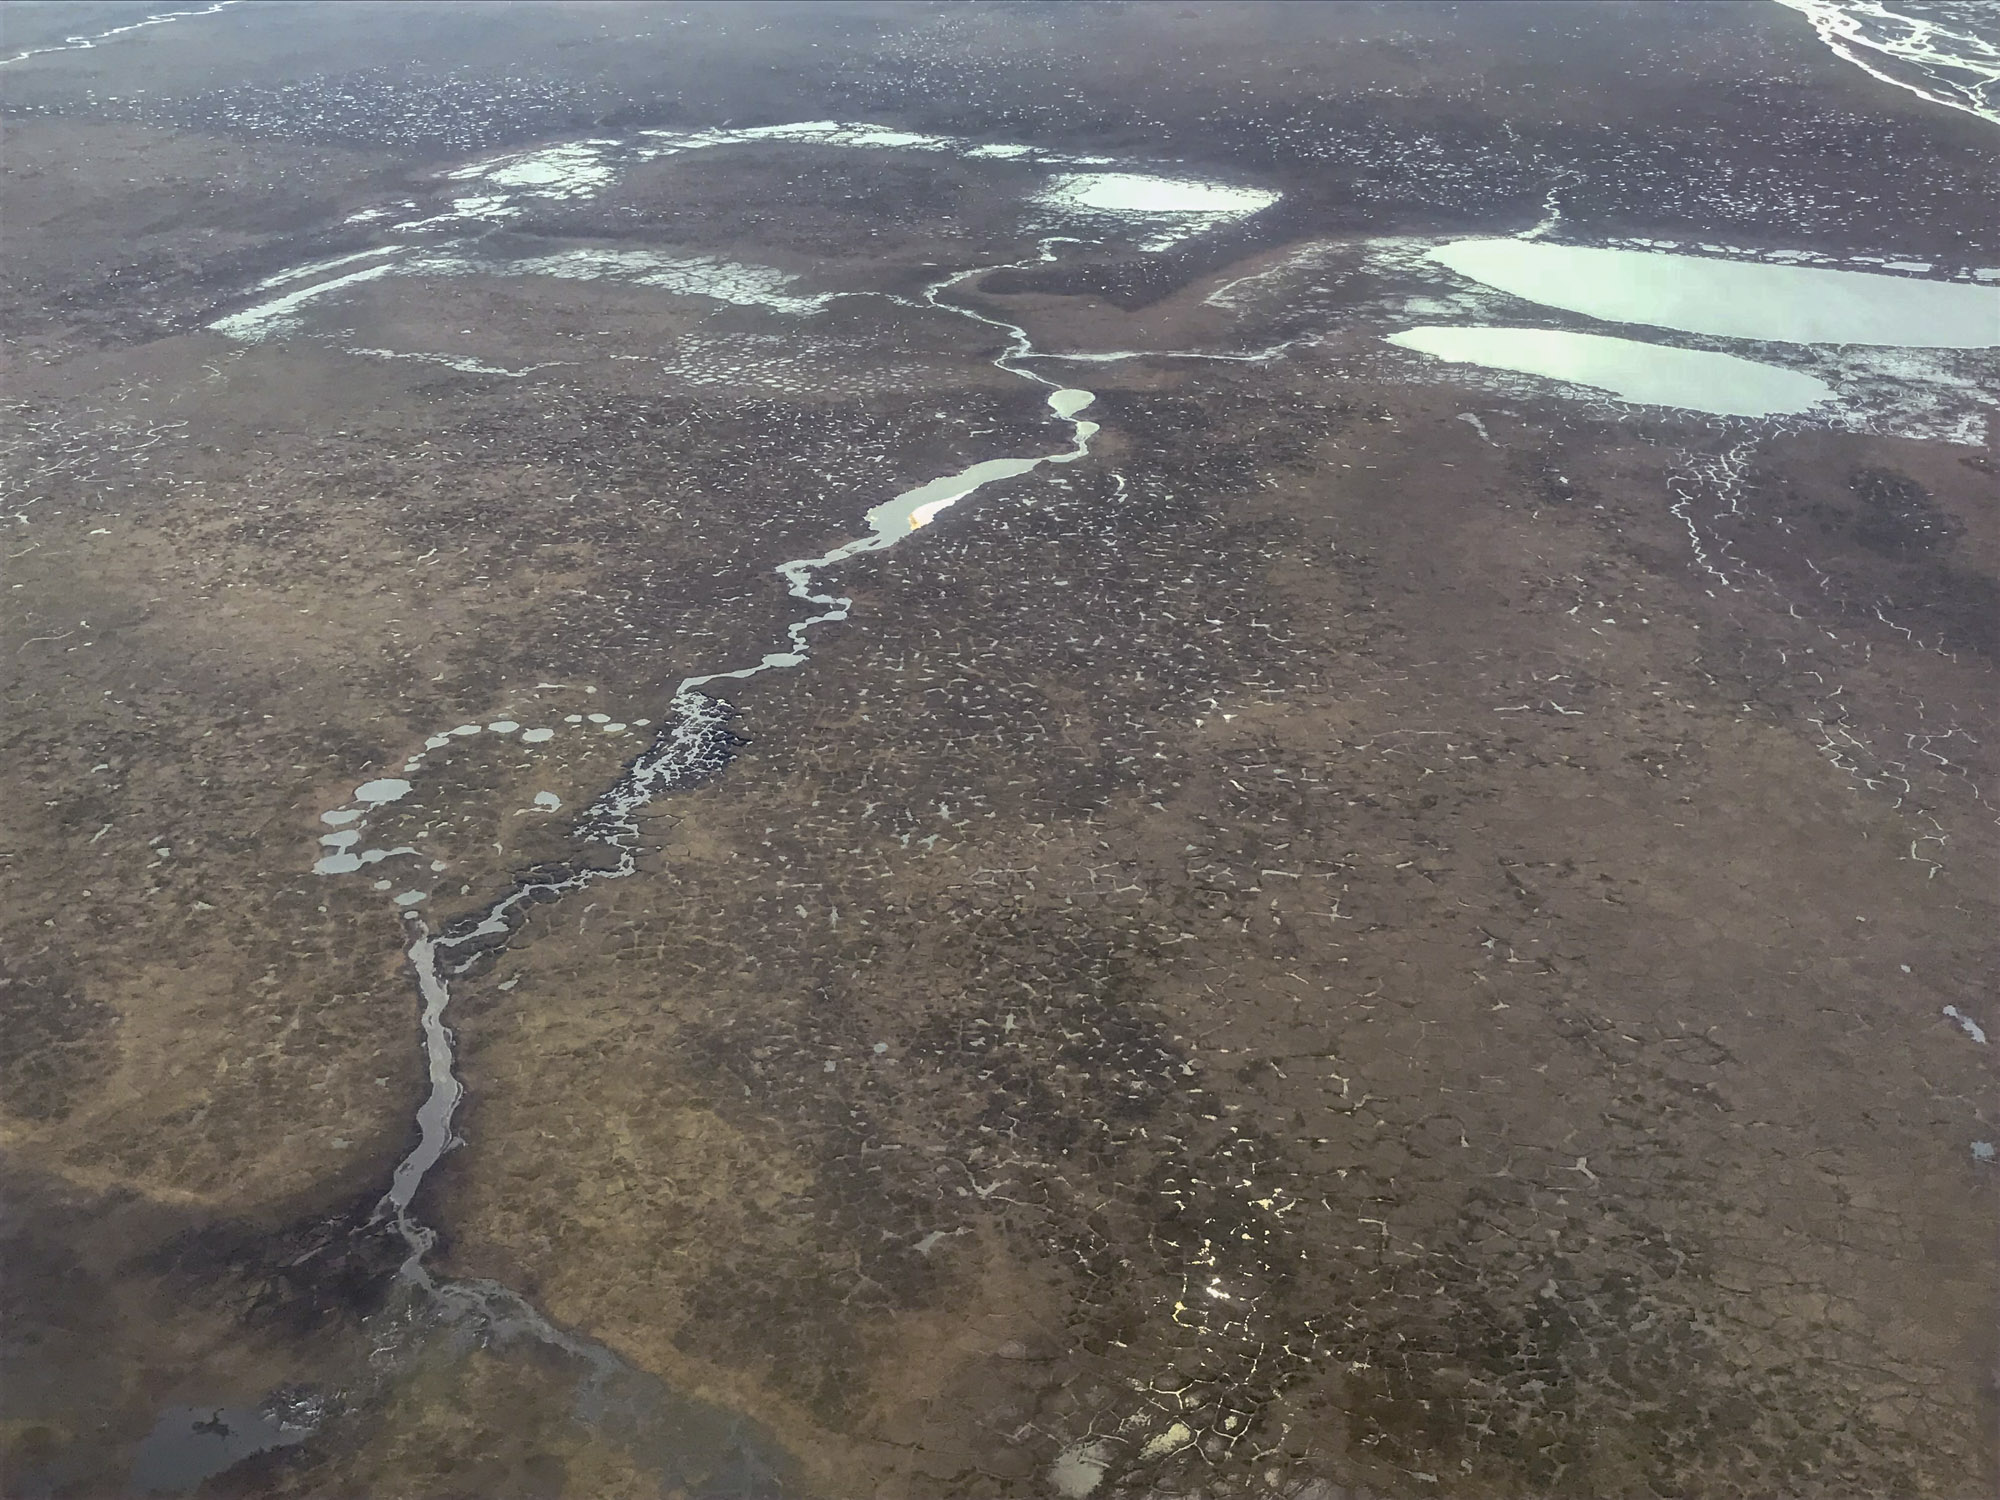 Each watershed in this area is unique and has a variety of subtle processes ongoing. Here you can see that a large lake has been drained by natural processes, where the tops of ice wedges surrounding polygons have conspired to link together and form a stream, gradually widening itself until its flow was large enough to thermally erode the ice wedges, lowering its bed beneath the depth of the lake and draining it, leaving behind several stranded pools. These dynamics are cool, but still not fully understood; here is a literature review I did on them 13 years ago, funded by the oil companies to help understand the potential impacts of pumping these lakes to make ice roads in winter. Despite appearances to some, I fully realize that there are many great and sincere scientists working in the oil companies and government, but I also realize there are forces well outside their control that prioritize short-term gains over responsible decision making, so it’s these scientists I’m trying to help.
 That stream then drained into another lake, which had already been drained by a similar process.
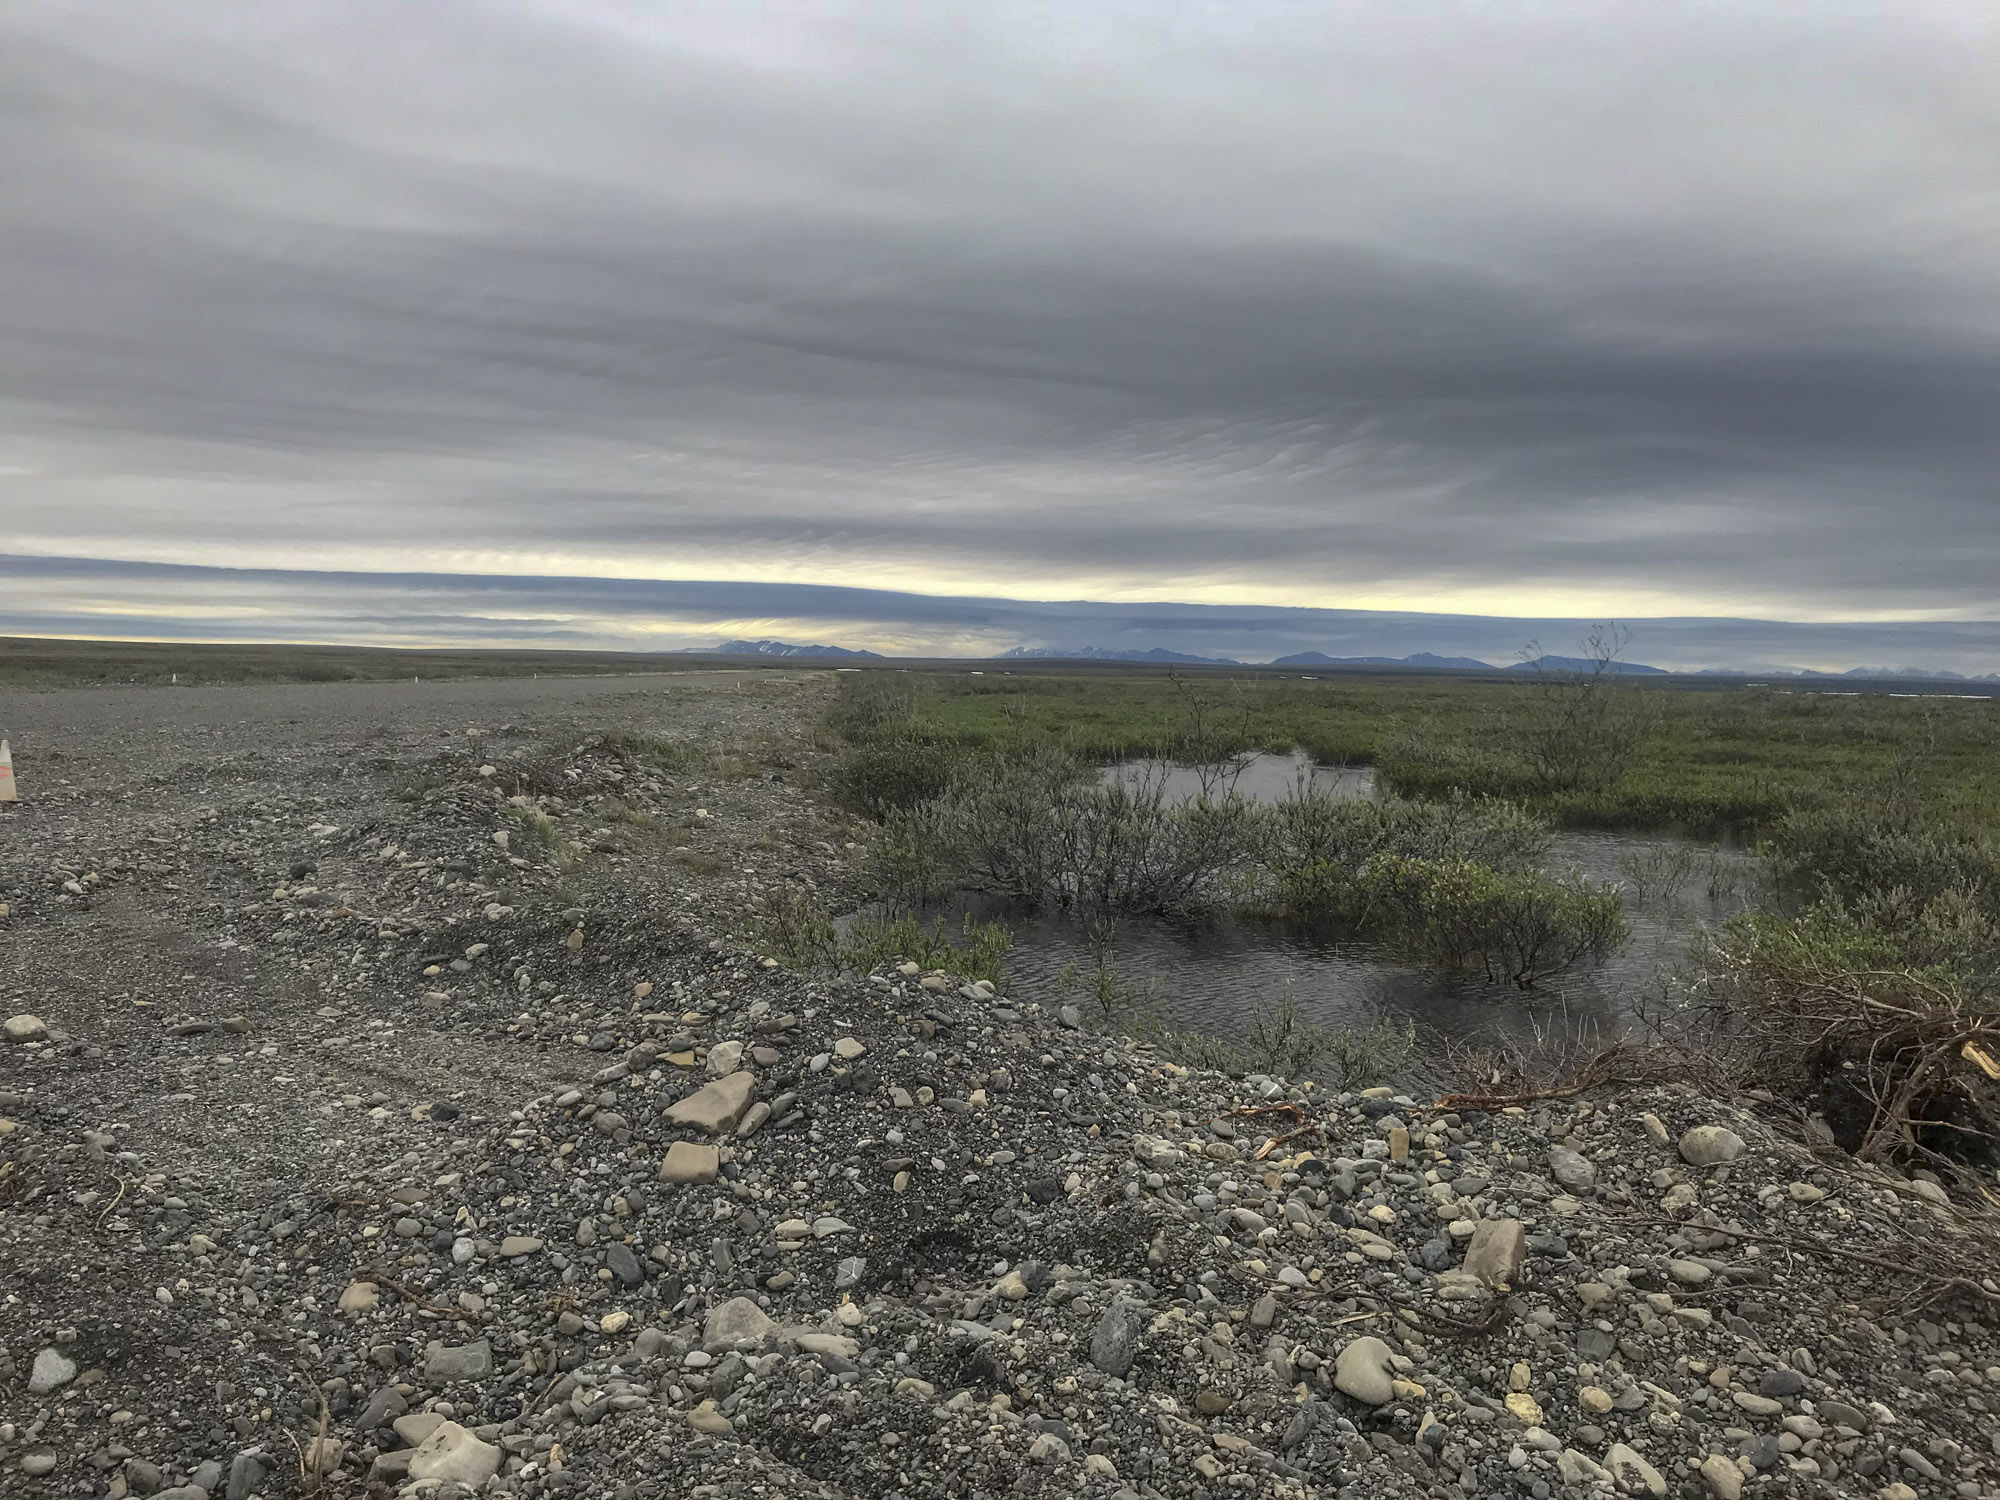
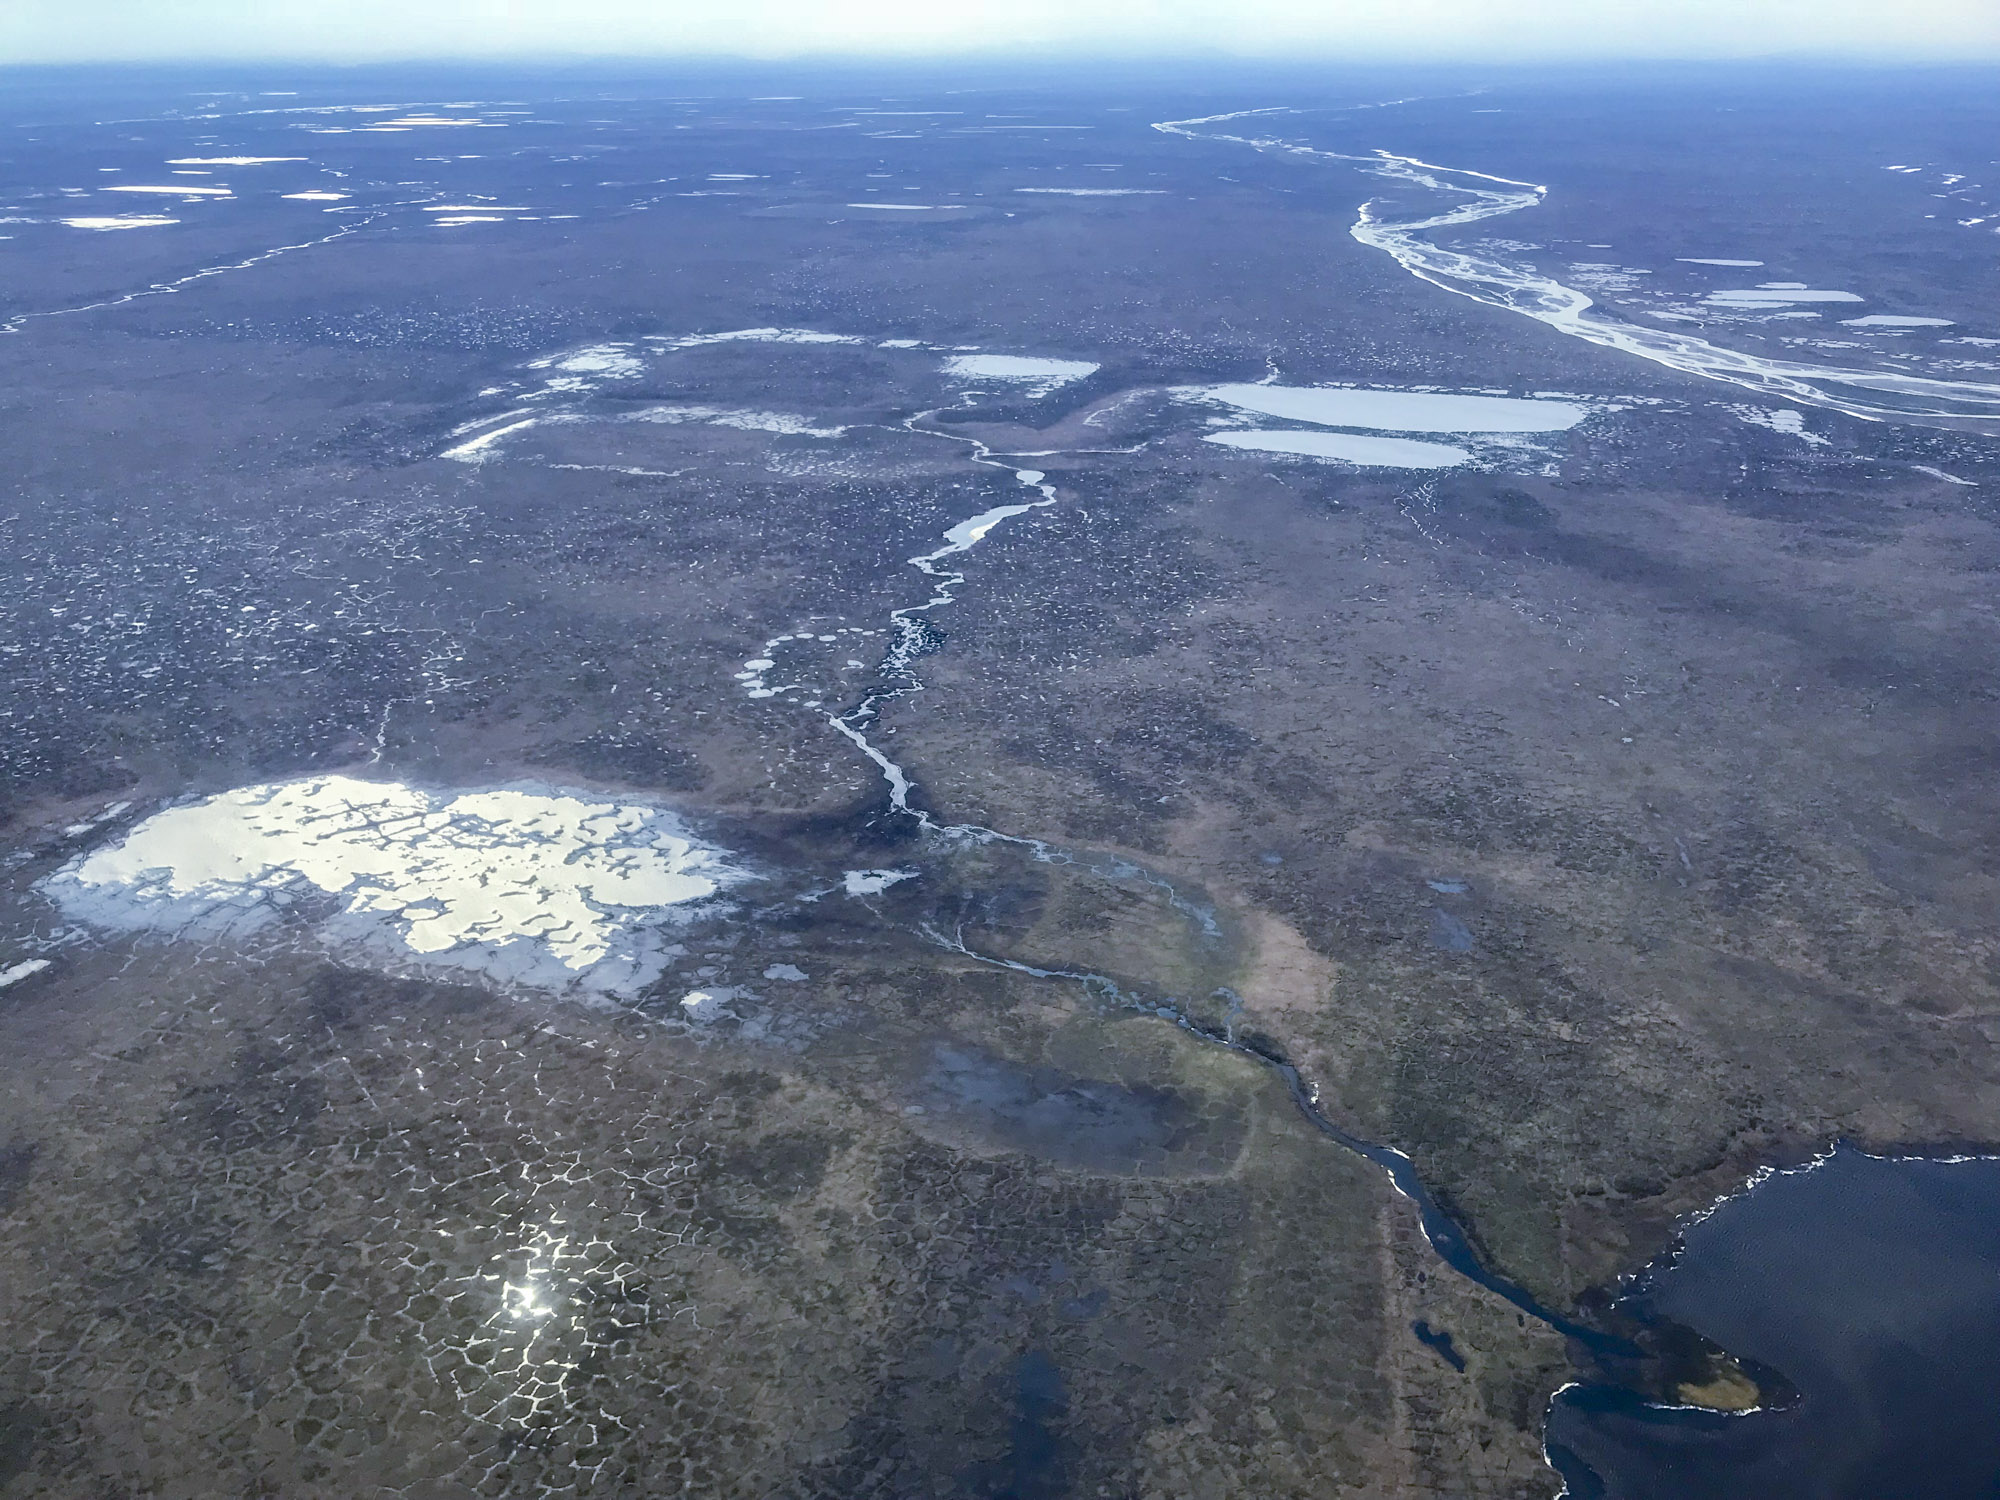
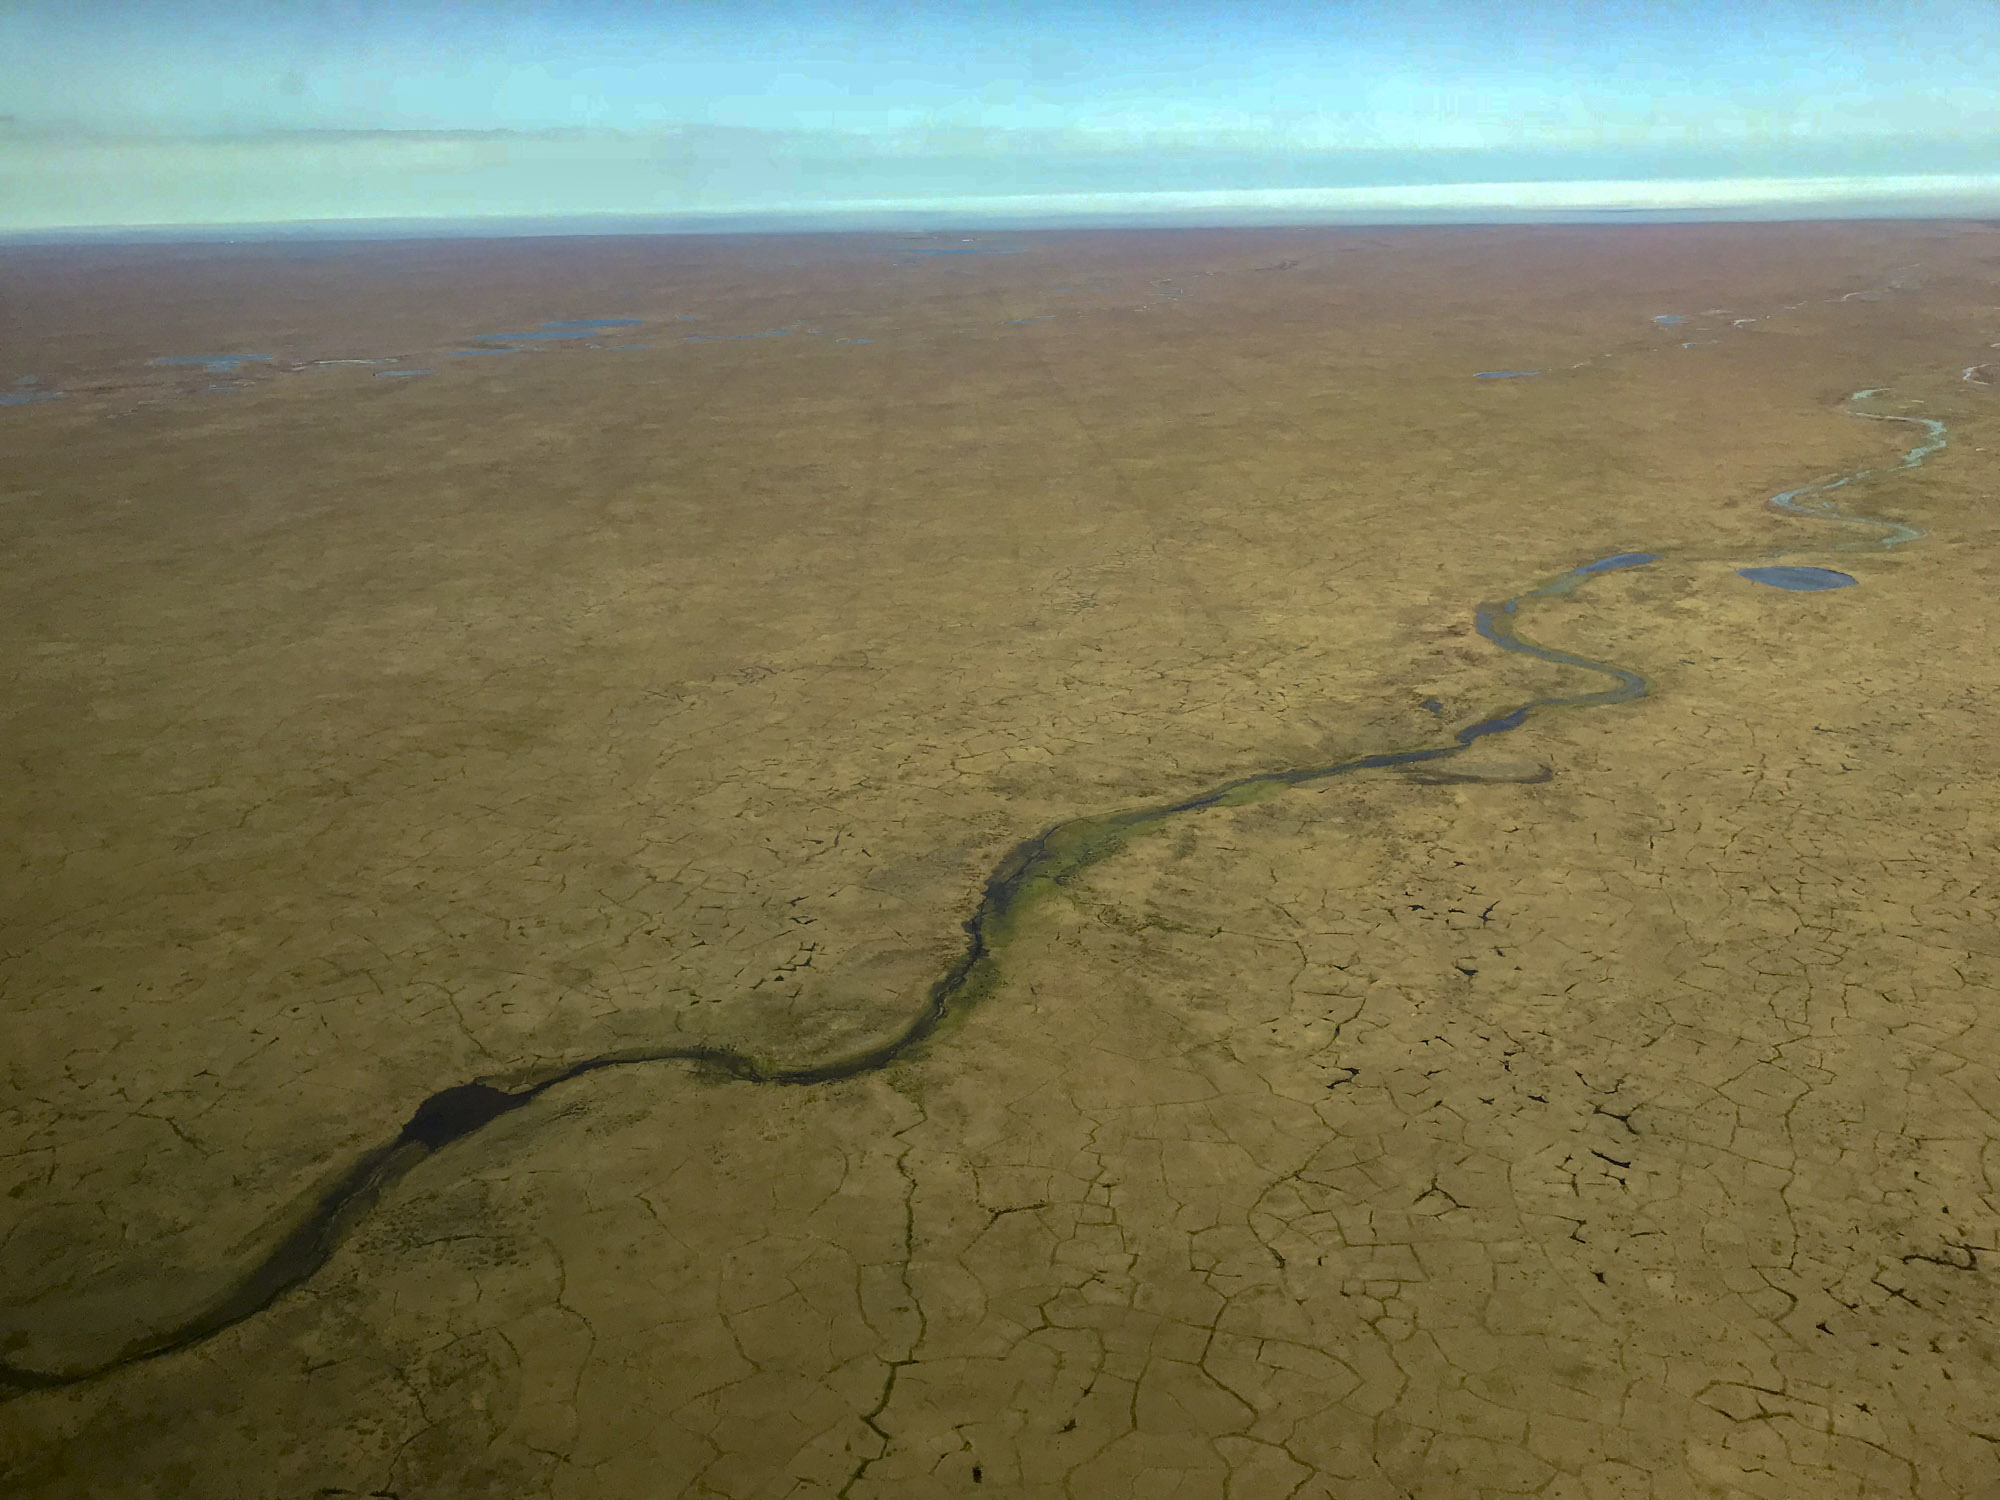
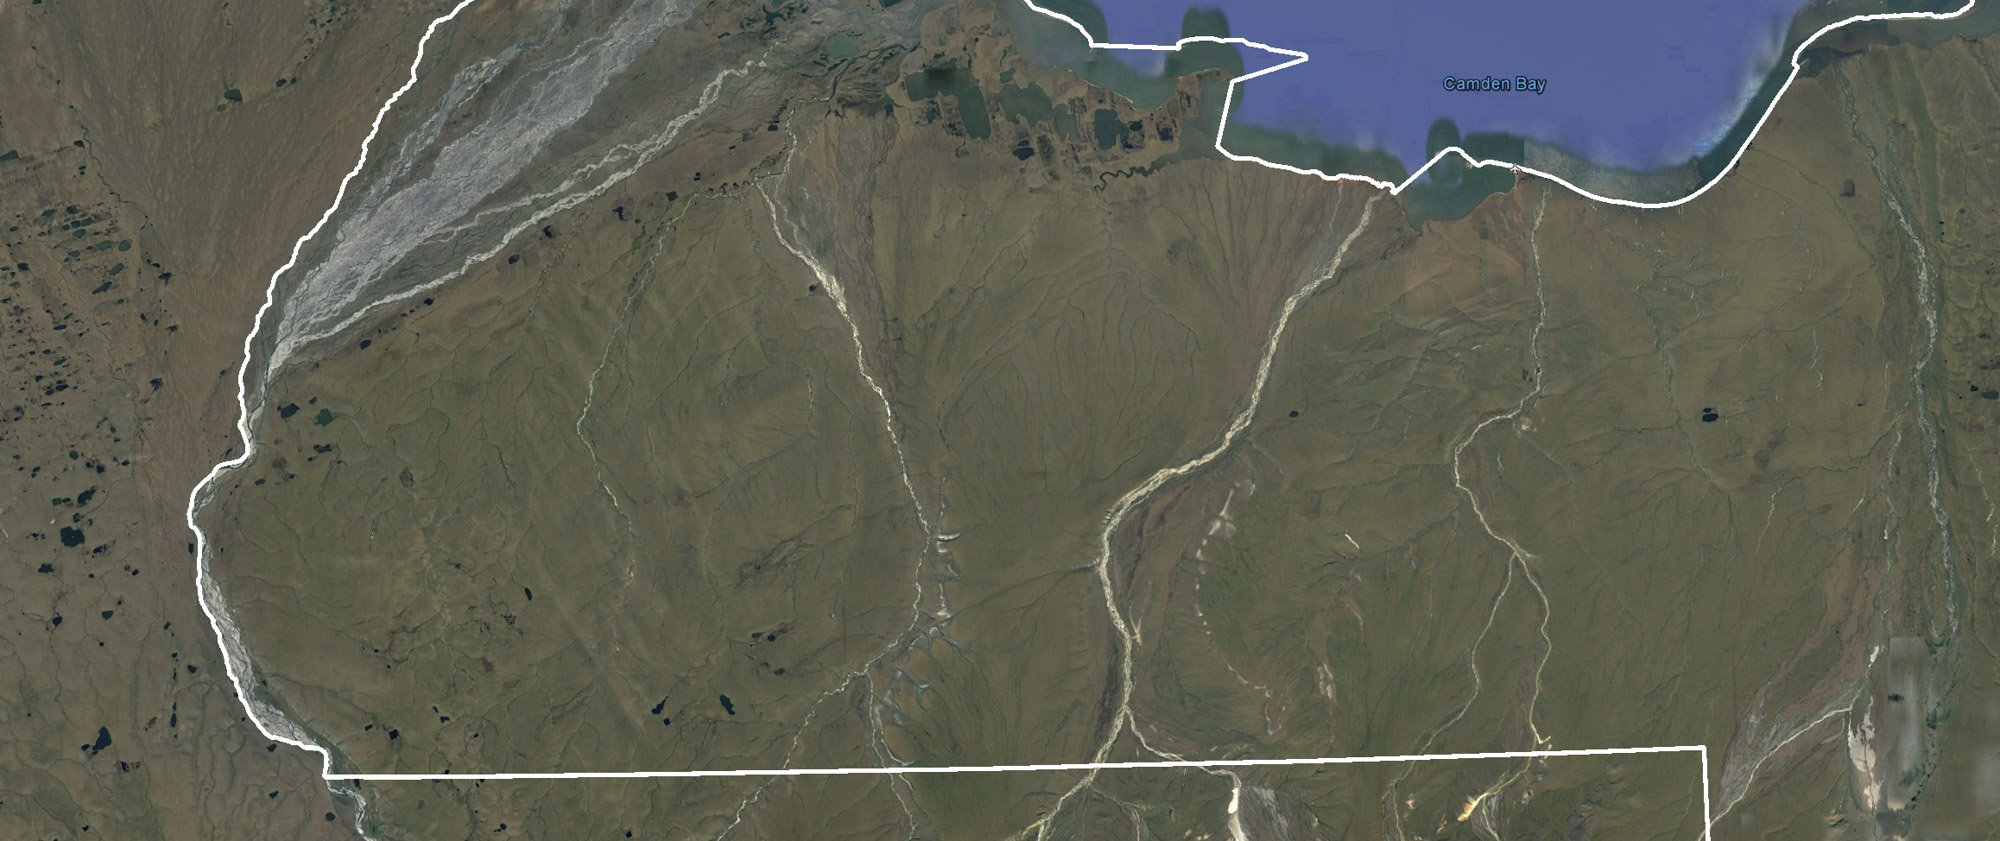
 Those streams, and the watersheds they now drain, then filled another previously drained lake, overflowing its diminished area and flooding another old lake bed. Though the hydraulic gradients here are low, they are still much steeper than the lakes that dominate the oil fields to the west. That steepness is why there are so few lakes here — it is simply not as flat. The map I’m making can determine these gradients and help understand the sensitivity of the lakes here to disturbance, as well as help understand these natural processes.
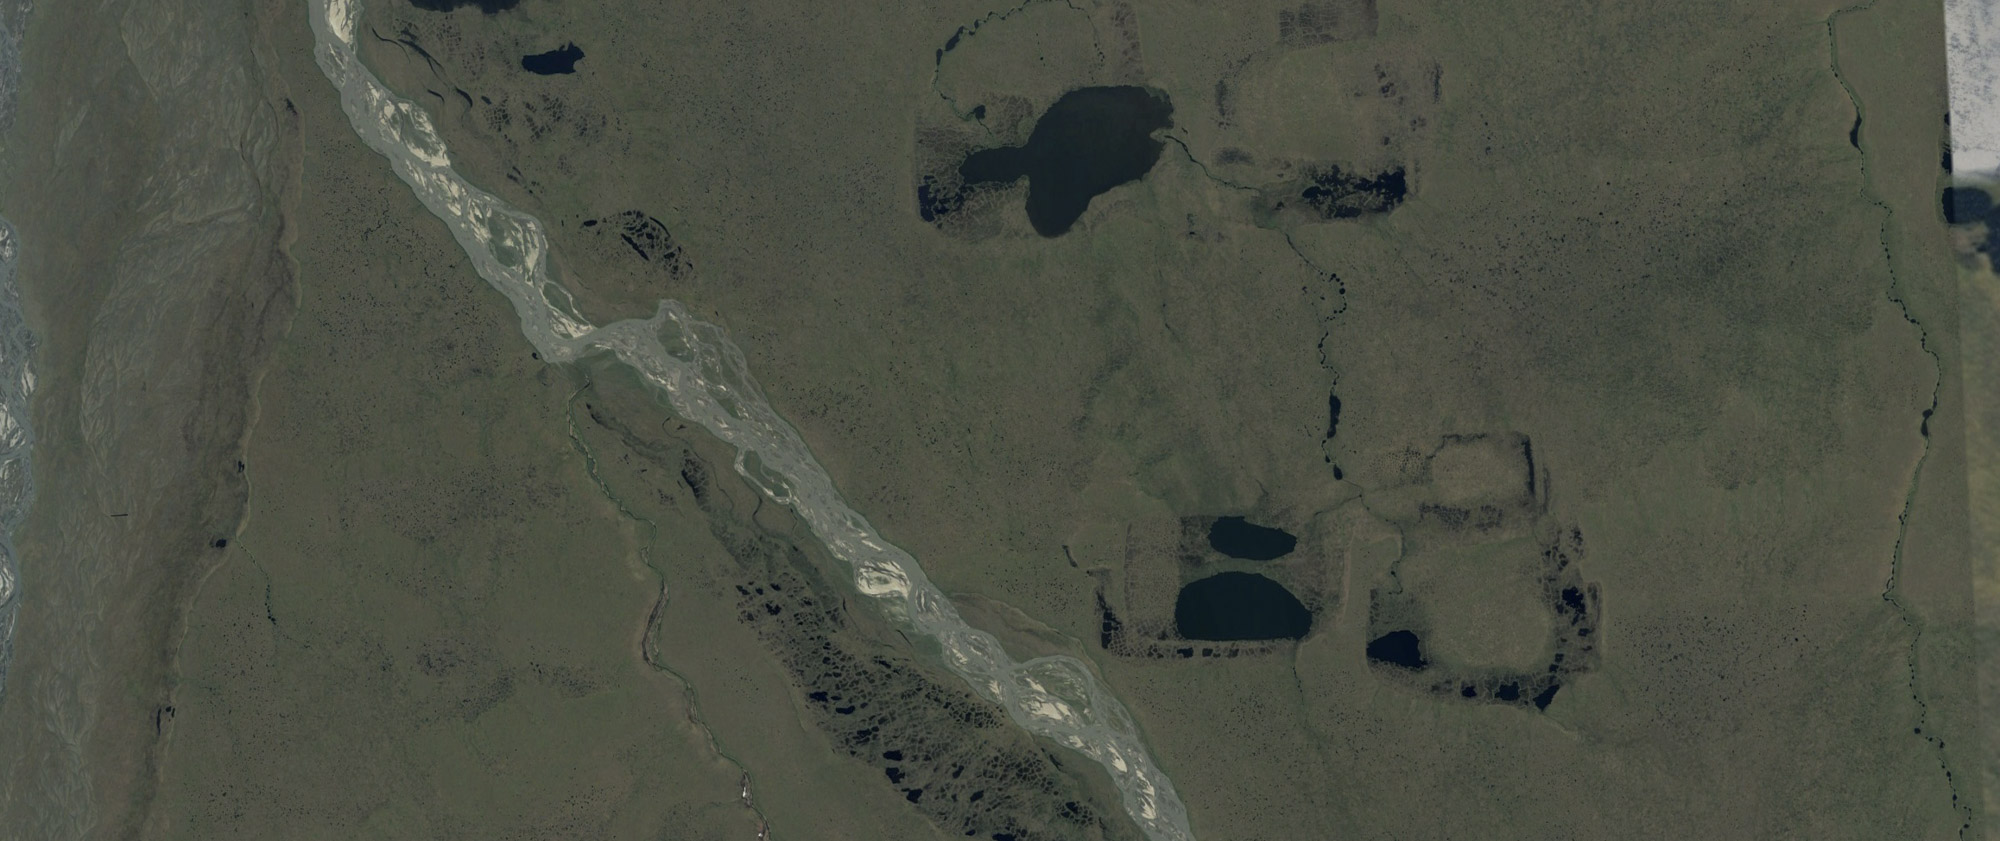
These lines are what’s leftover from the seismic exploration in April near Pt Thompson, just outside the Refuge, using the best practices of 2018. The visual impacts are faint, but they are still there. I don’t want to see this checkerboard in the Arctic Refuge, a few miles away, and I think it’s possible to prevent this and still get the seismic data needed, through use of fodar.
Near the center of the photo, you can see the tire tracks from the previous image where they cross a small stream. Even though these tracks are tiny, in the wrong place they can divert huge amounts of water on this landscape, such as in the example lakes I showed a few slides ago. So it’s not just a visual issue, these lines using 2018 techniques have potential to cause physical impacts to the landscape.
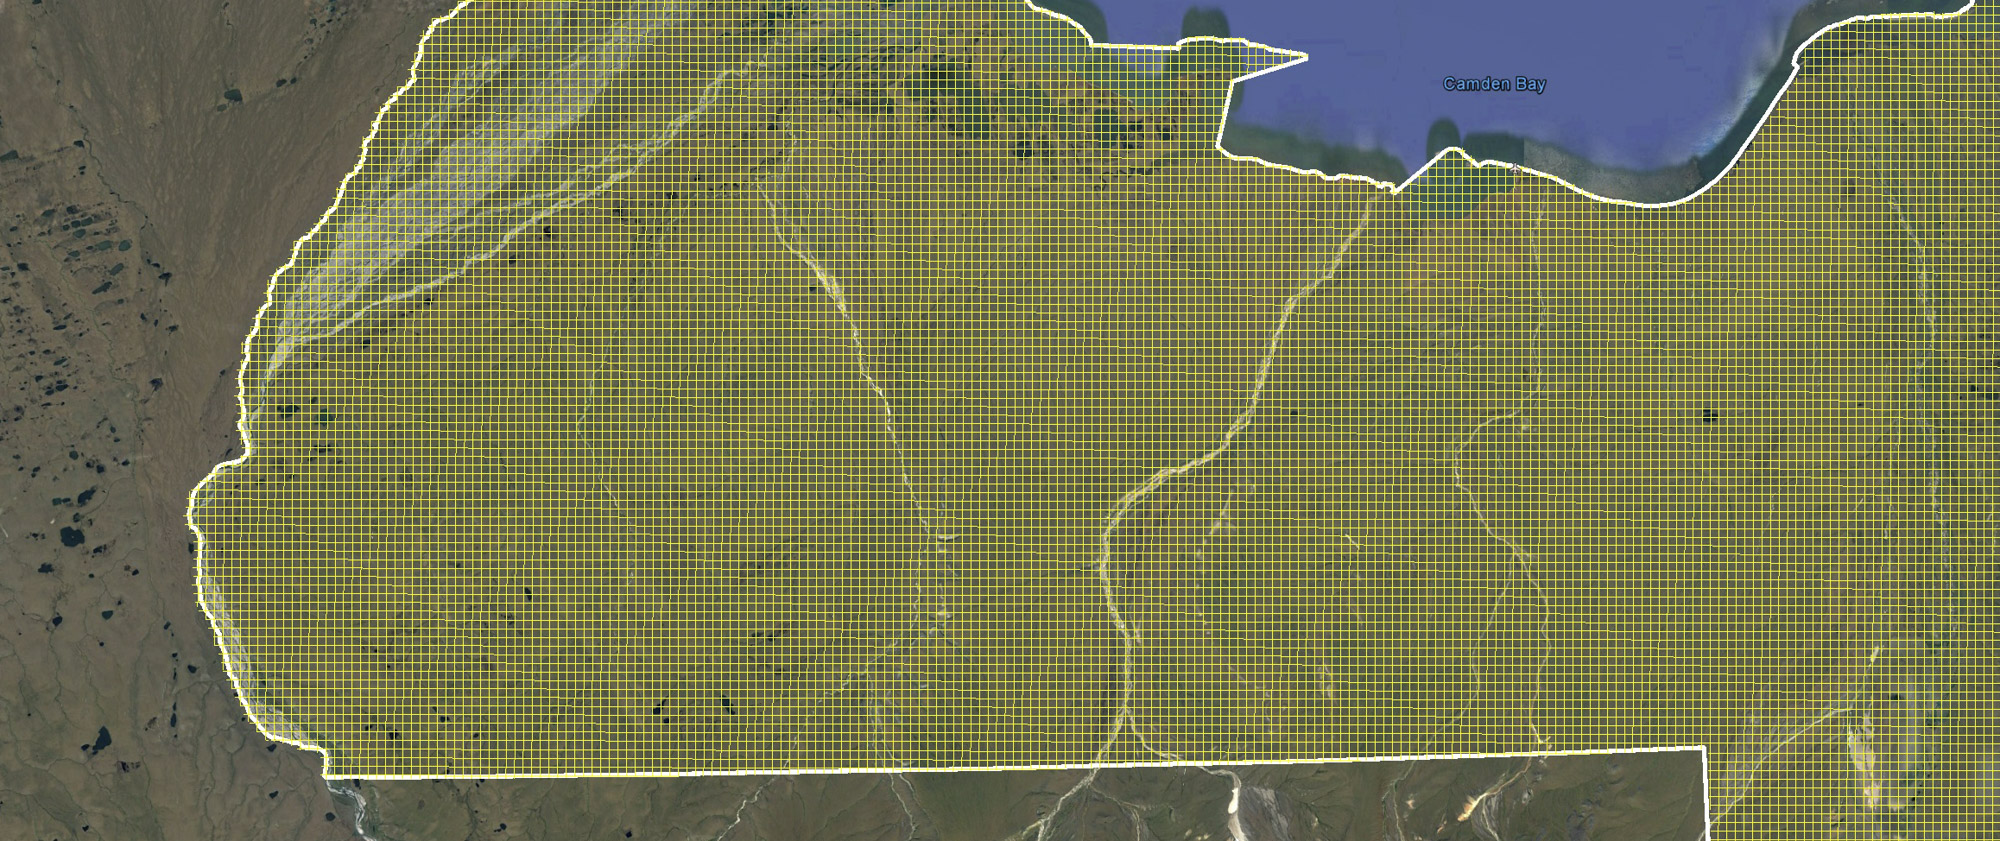
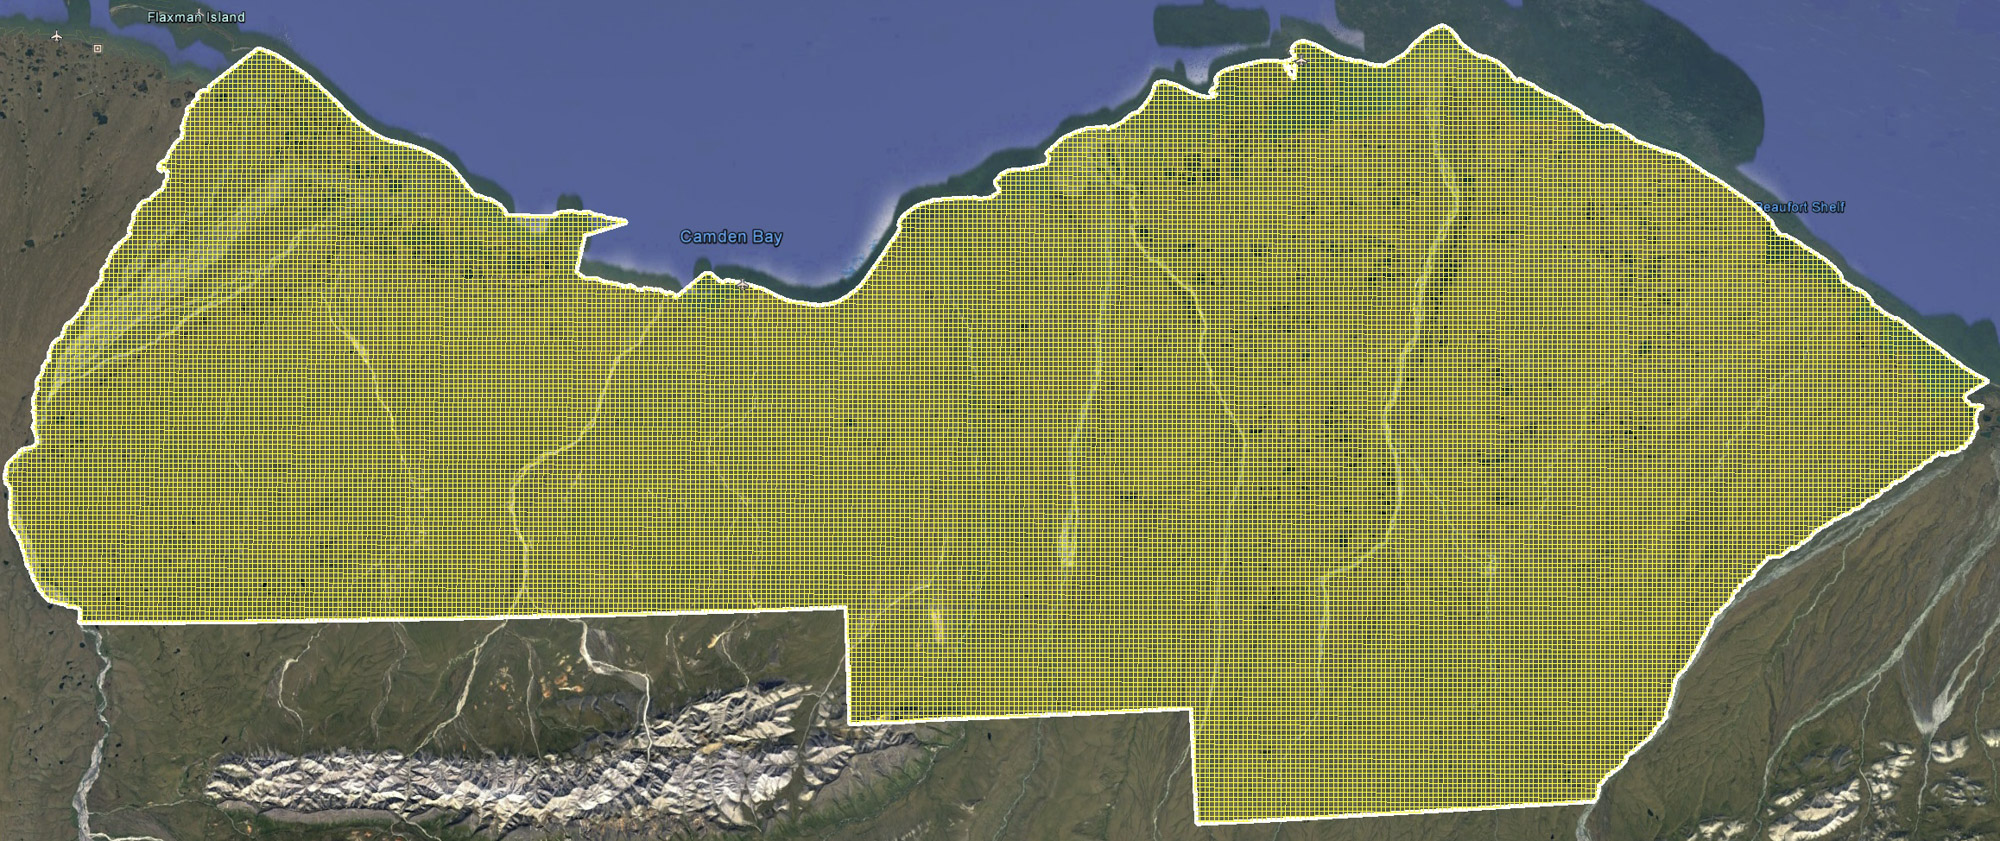
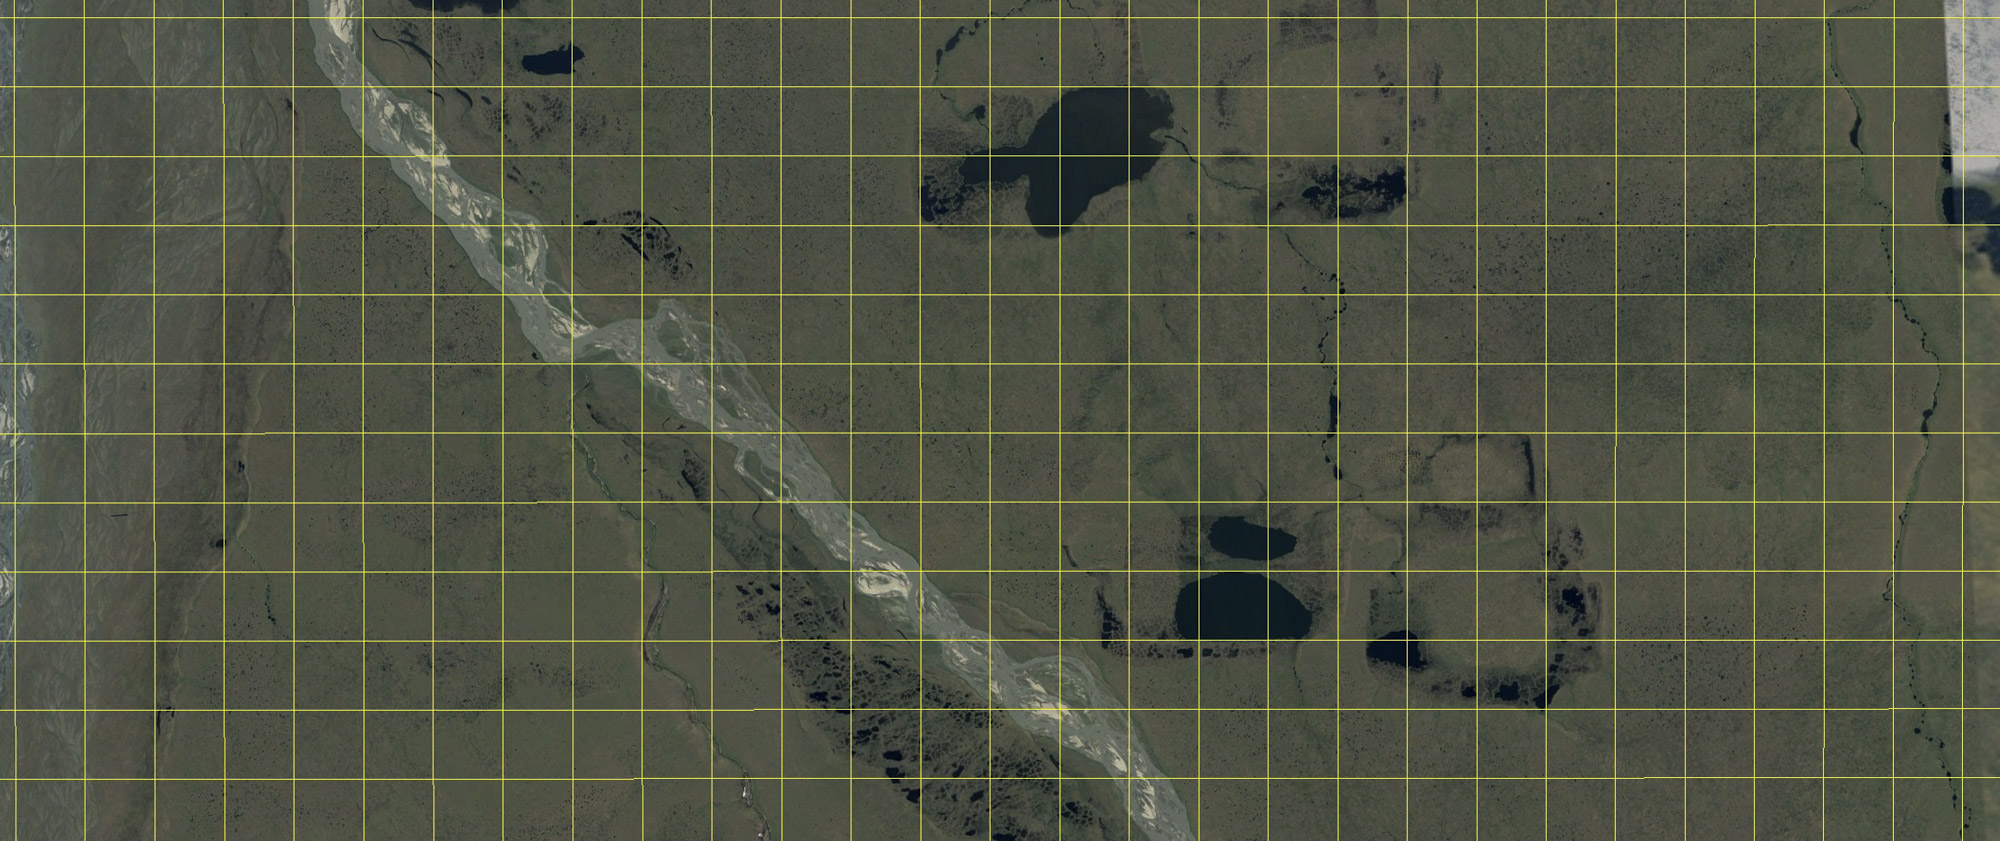
Here’s what a 400m x 400m grid looks like over the entire 1002 Area, to give a sense of what the seismic checkerboard could look like. In total, that’s about 32,000 km (20,000 miles) of lines, noting that this is only half as dense as what was used this spring at Pt Thompson (200m x 400m). I measured the trails left behind there at 20 m wide. If we use only half of that here (10 m), that creates 320 km2 of seismic trails, or about 5% of total area of the 1002 area; another way to get to 5% is to consider 10 m of trail for every 400 m (10/400=0.025) running in both directions (0.025×2=0.05, or 5%). That’s about 80,000 acres of seismic line trails, which is about 40x more than the 2000 acre surface impact as limited by law. That’s why I’m more concerned about the potential impacts of seismic work than the drill pads themselves — best practices of 2018 are leaving visual impacts and potentially structural ones. We can do better, and I believe my data can help with that.
The weather continued to hold overnight, but was forecast to begin degrading by afternoon and turn into fog and rain for the next several days after that. So I made the decision to map as much as I could before it turned, then bug out to Fairbanks while the weather was good to see my son Turner’s next play, the Merry Wives of Windsor, his first time acting in a mainstage production at the Fairbanks Shakespeare Theater. The forecast proved true, and I was able to knock out a large block of lines before the fog rolled in, extending outside the Barter Island air traffic zone and also mostly out of the coastal fog zone. I think one more good day of mapping in this area, and I’ll largely be free of coastal fog influences, except perhaps in the far easternmost part of the 1002, which I do not believe gets as much fog as Barter. Once out of mapping fuel, I returned to Kavik to shuffle gear, refuel, and head home. The flight home was largely uneventful, though strong winds aloft and smoke from the south gave me white knuckles more than once. After nearly a week in the cold and wet zone, it was a shock to step out of the plane into the heat of Fairbanks summer. But it was also a relief. And it is also so much more productive for me to spend bad weather days in my office than in the field.
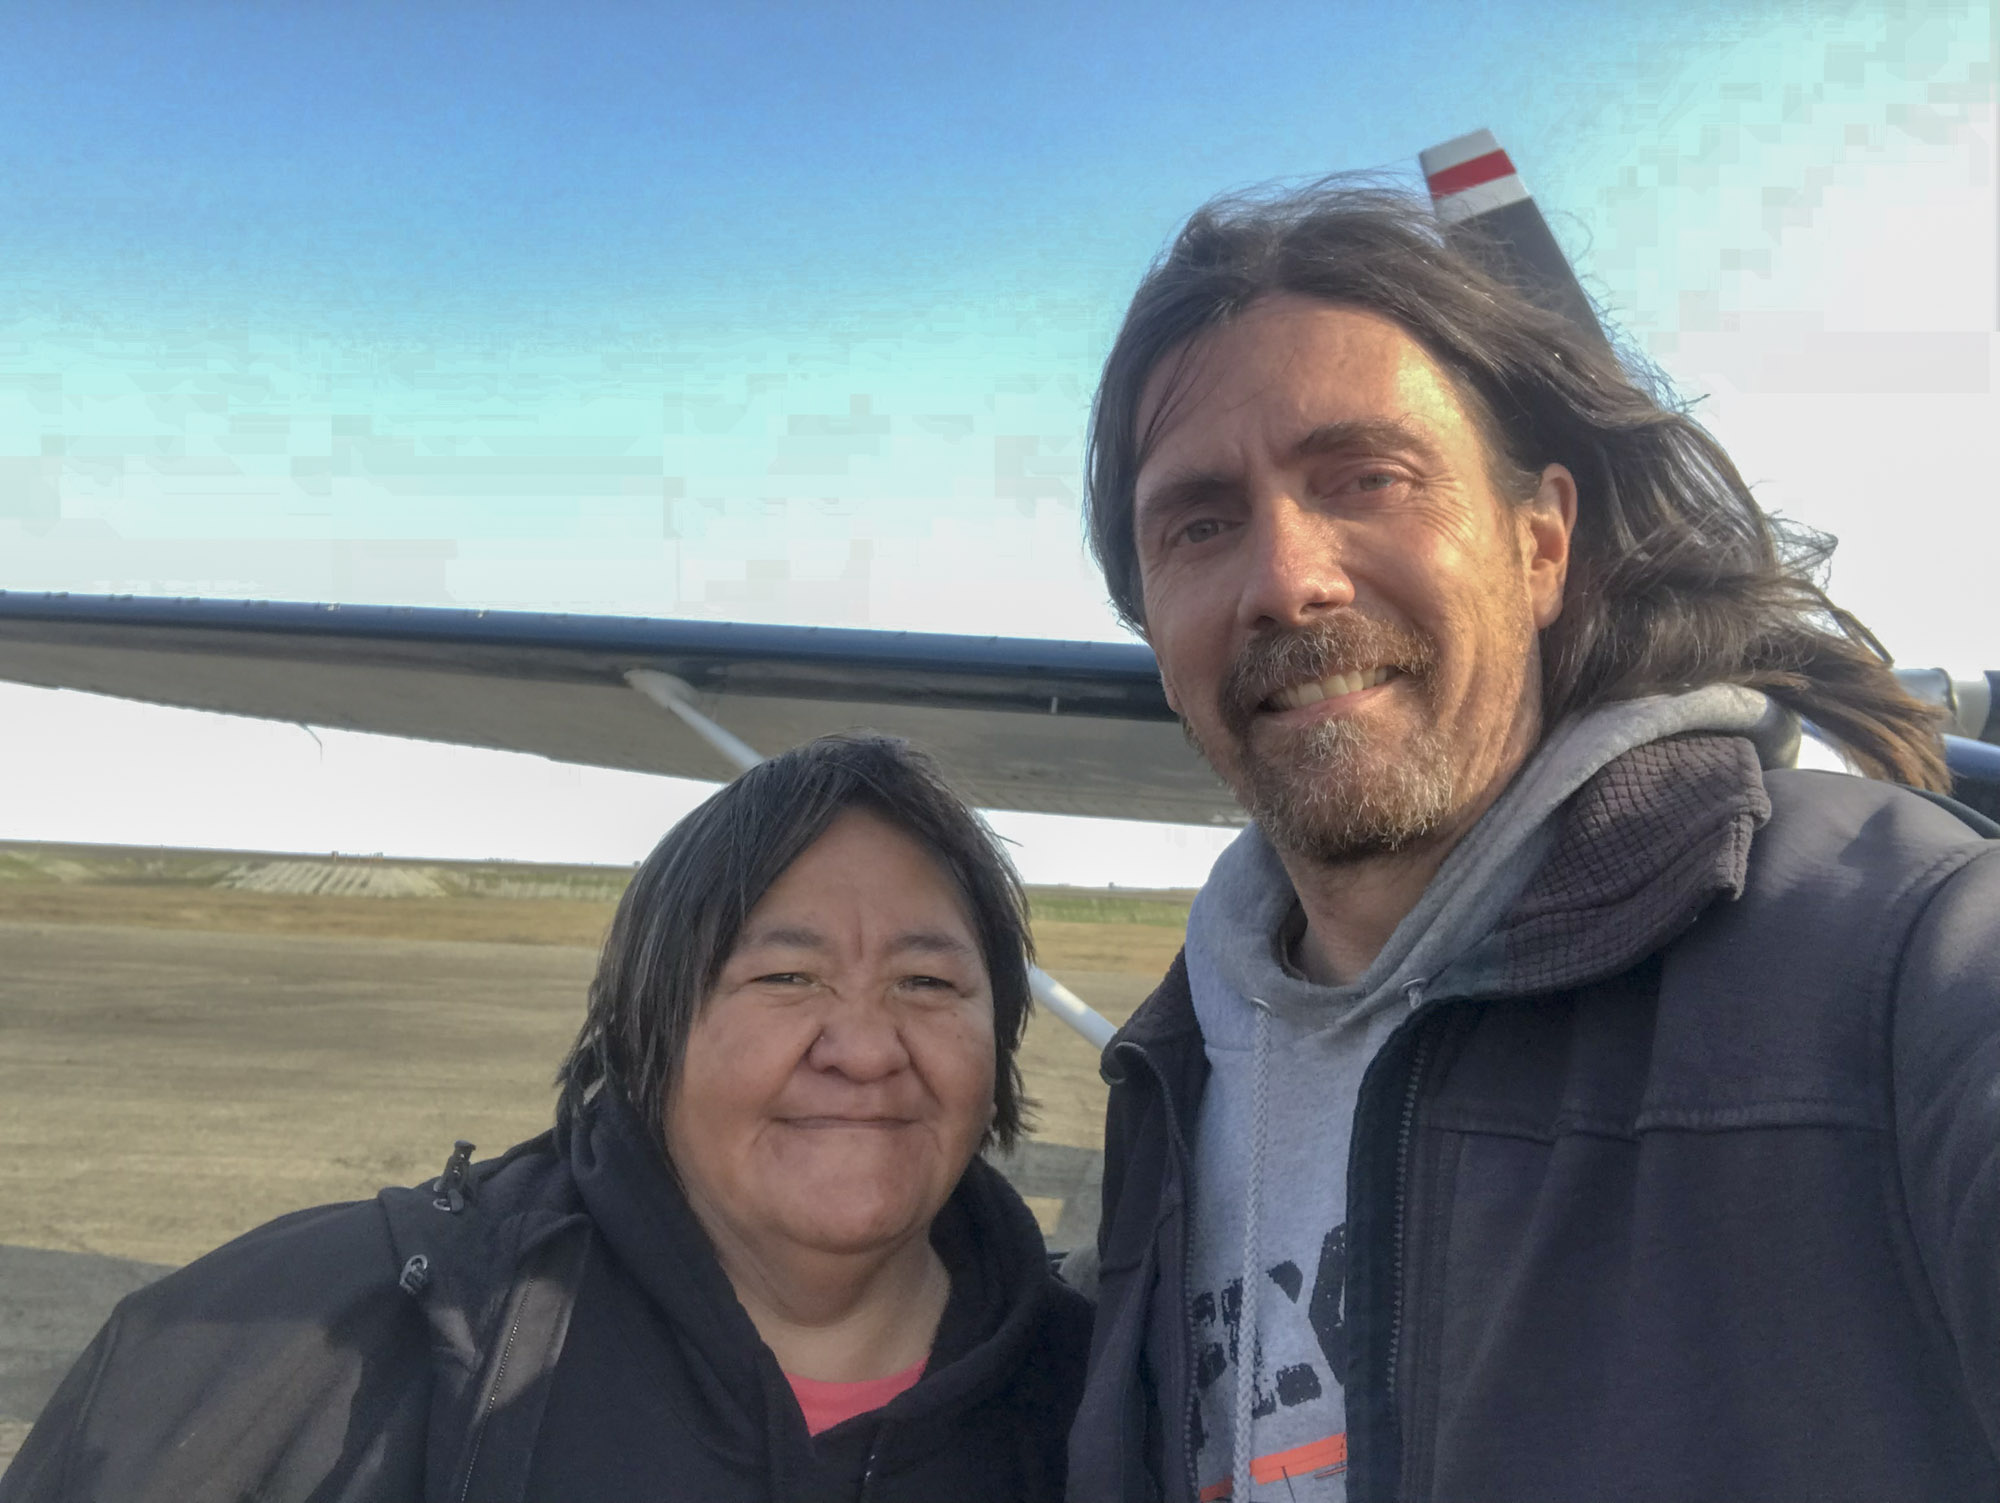 Susan came out to the airport in Barter to meet me when I landed to splash in some more fuel. Brought back some memories of when we lived there.
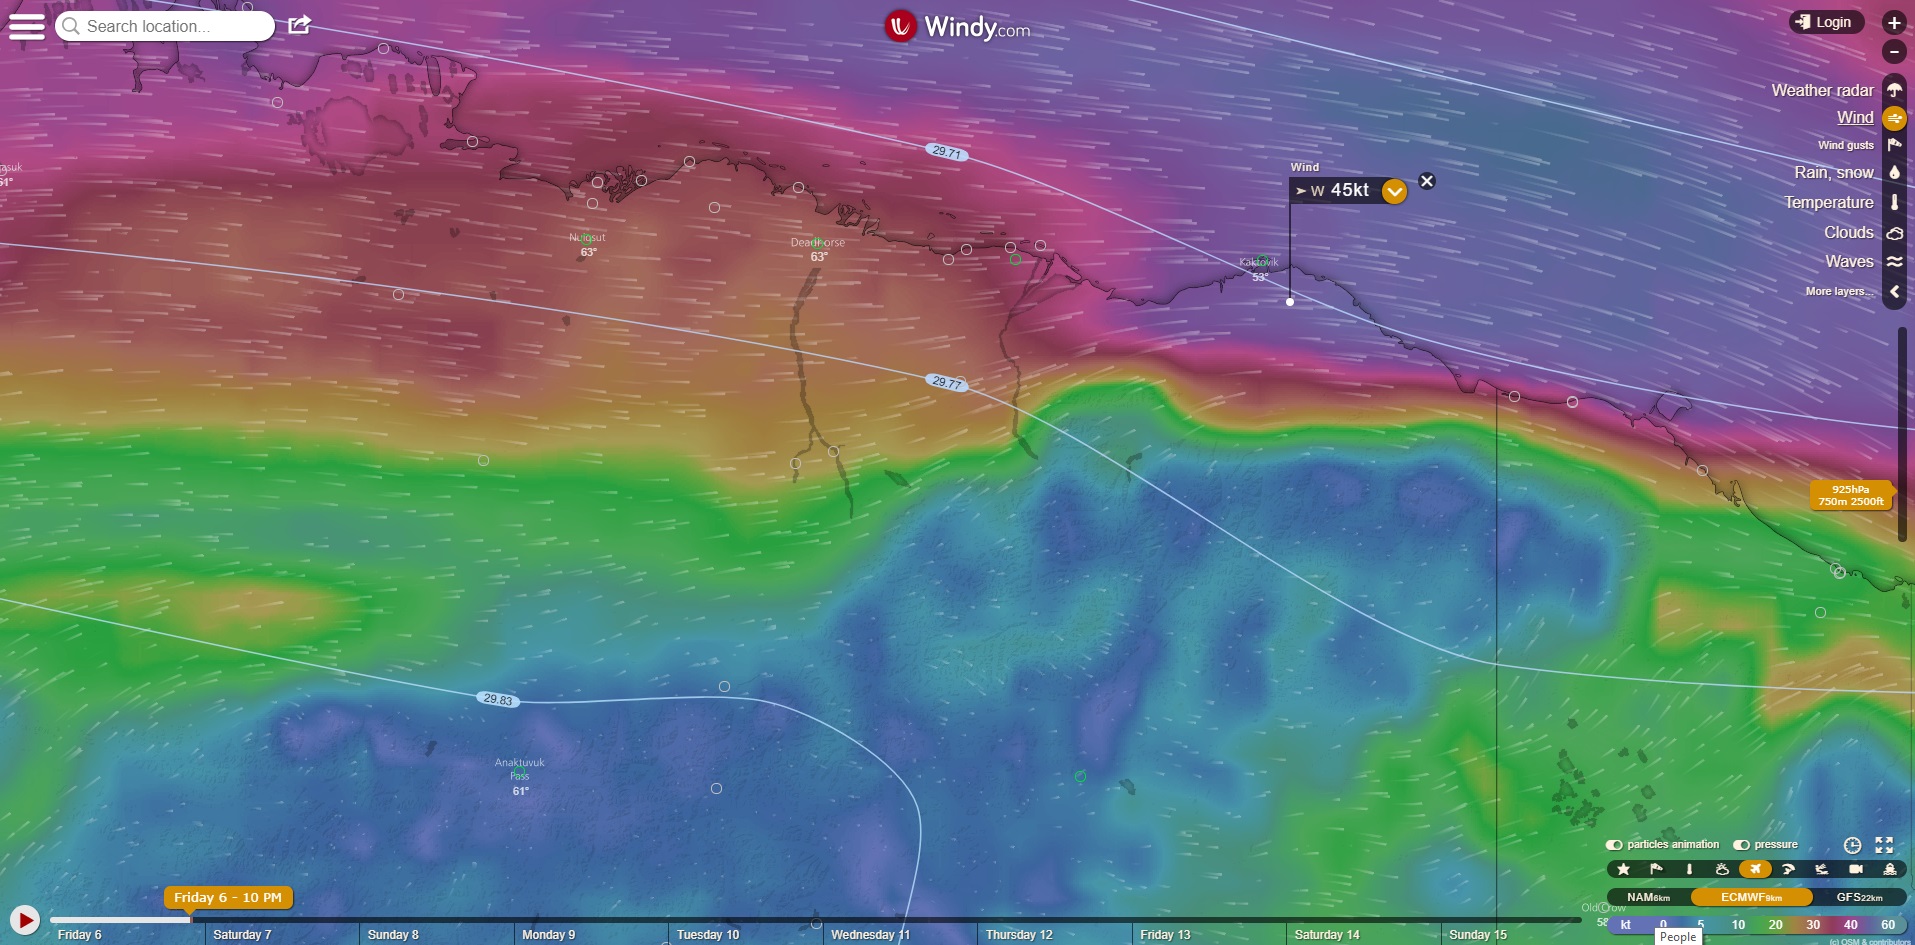
Windy.com is my favorite weather tool, has just about everything a pilot could ask for. Except better weather. Here was the forecast for where my flight lines were, which proved spot on.
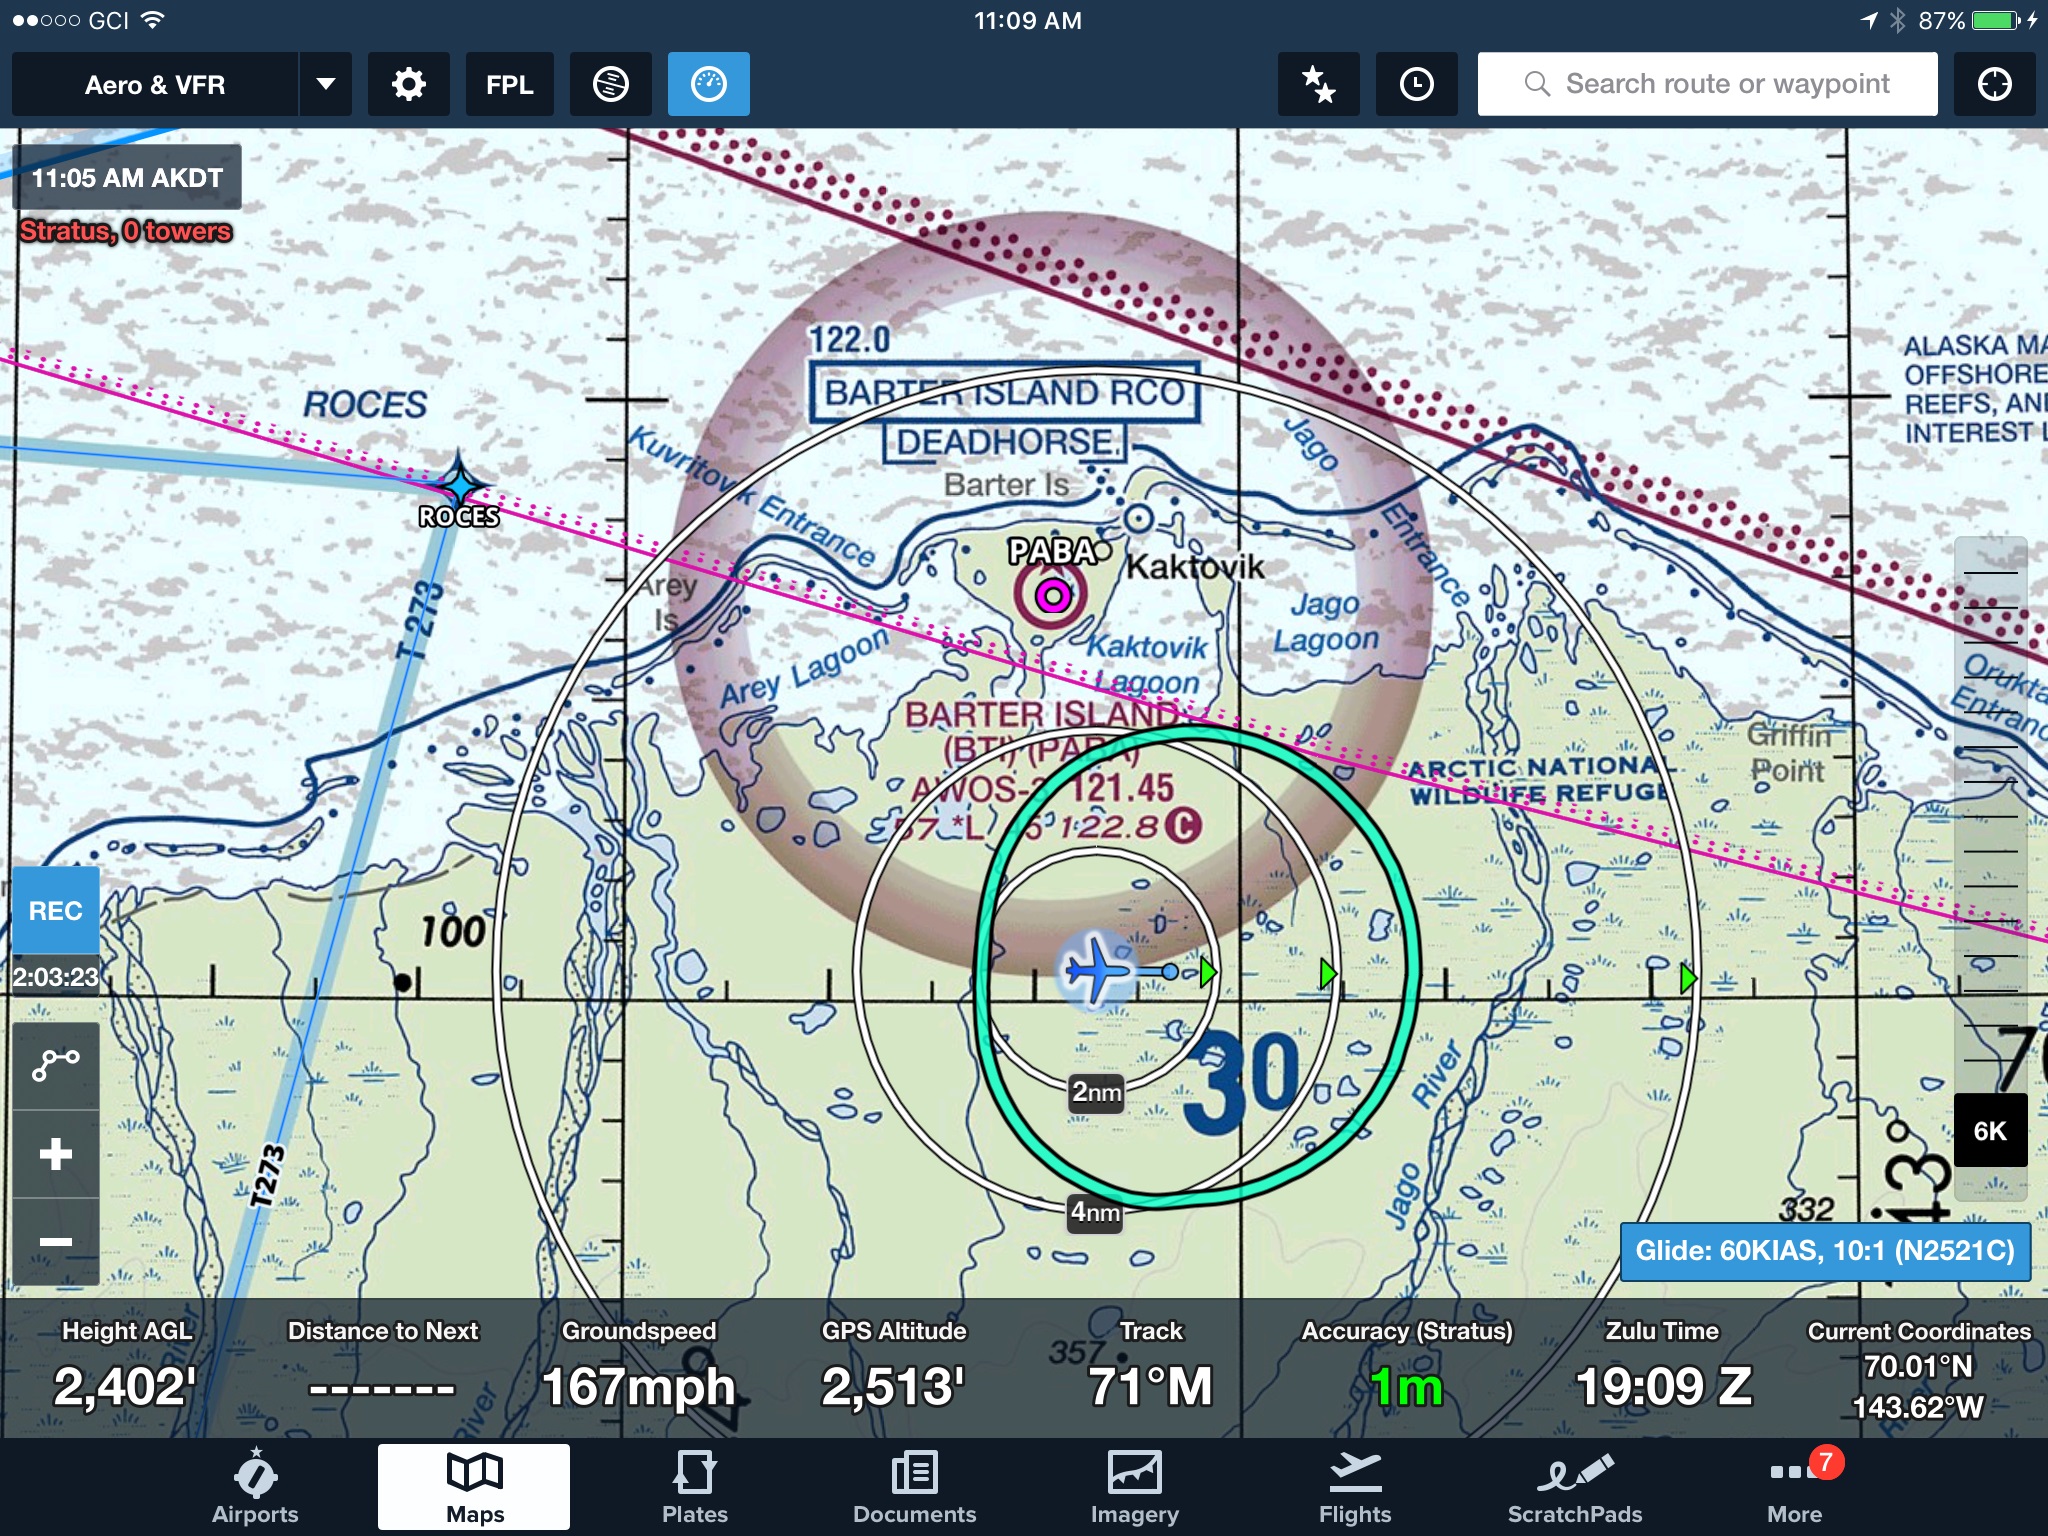
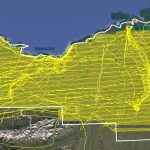
Here you can see my flight lines have now extended south of the Barter airport control area, which is a good thing because I could not map there when a fog covered the airport despite it being clear everywhere else inside the purple circle. The green circle is my navigation software’s estimate of my glide range in case of an engine failure, note how it is elongated and compressed based on the strong winds blowing from the west (left).
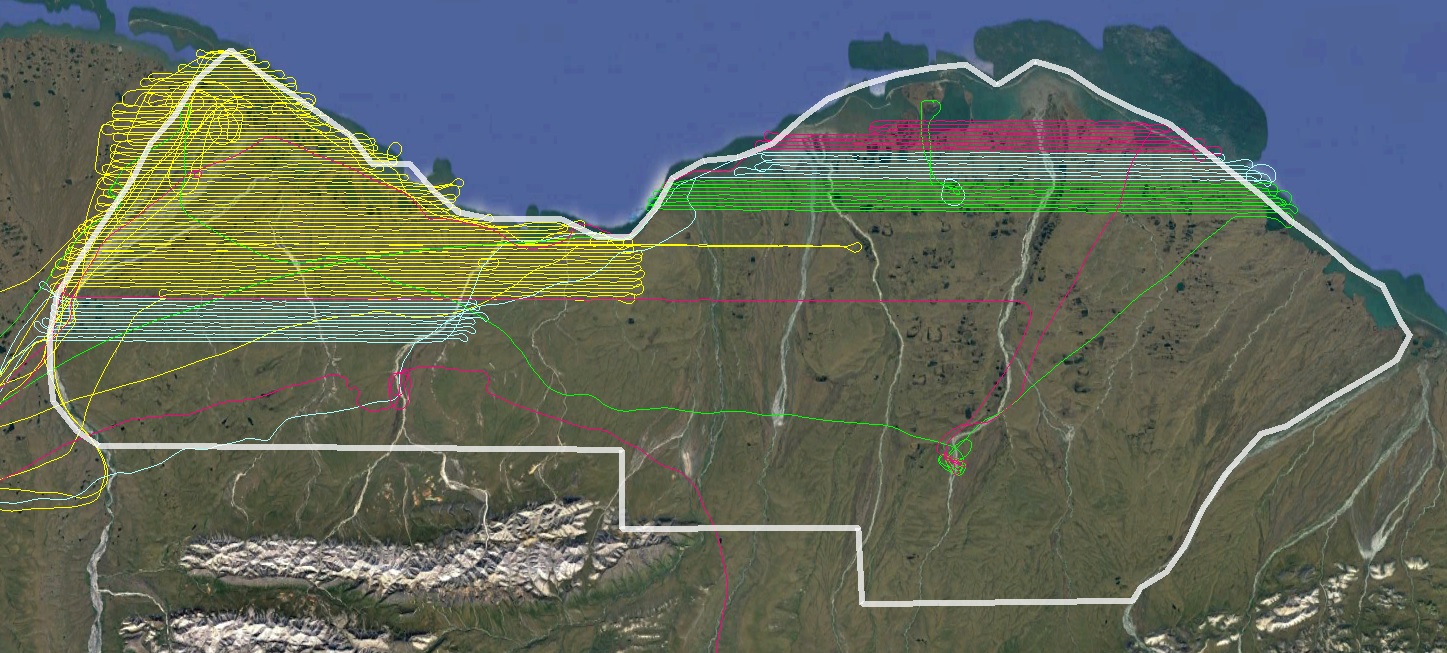
The yellow lines are my flights from week one, the colored lines are what I added this week.
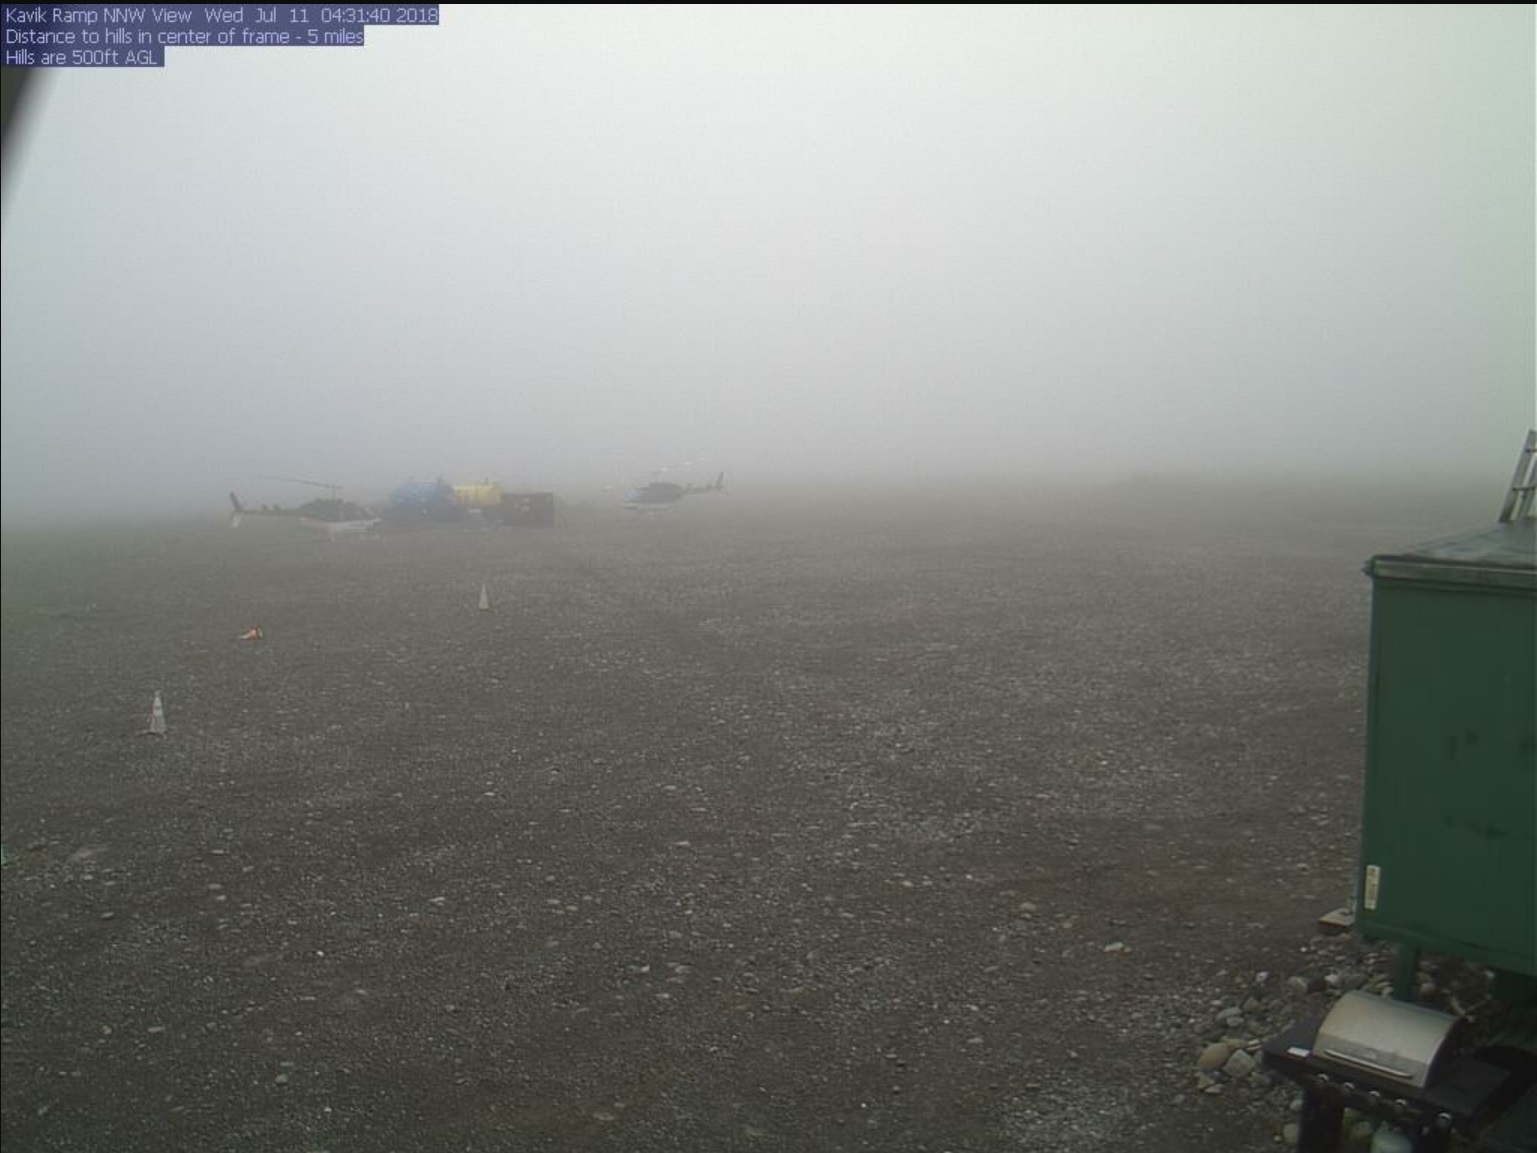
The web cam at Kavik on the day I wrote this post, from the comfort of my office in Fairbanks. Doesn’t look like I was missing much…
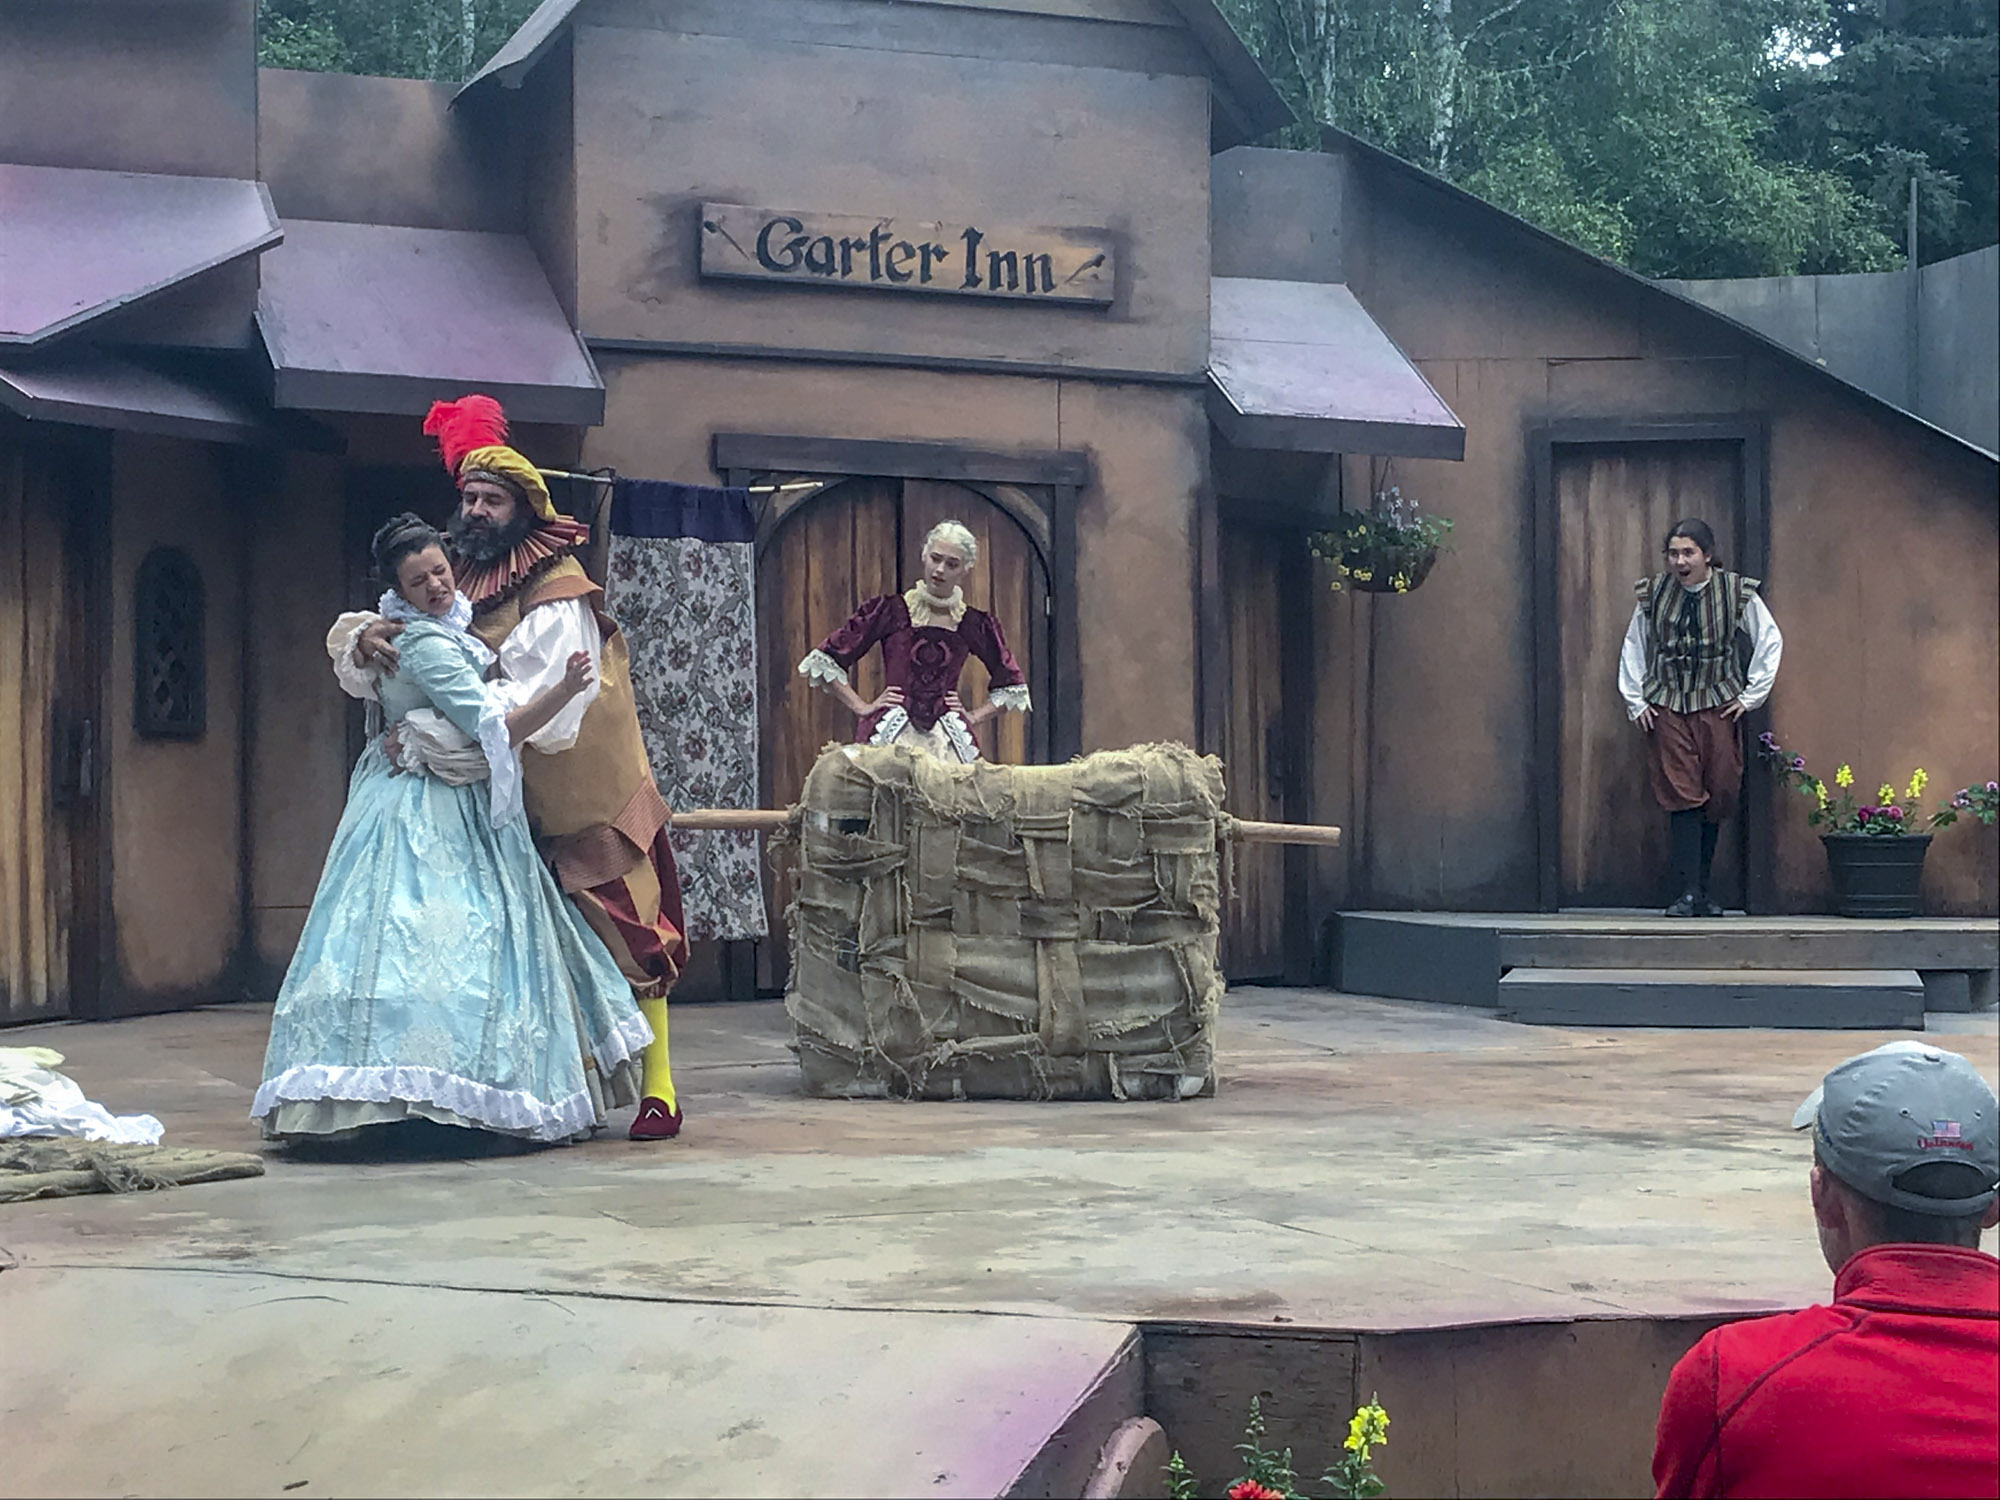
Turner had a minor, but expressive, role as Falstaff’s page in Merry Wives of Windsor.
Once back in the land of fast internet, I fully processed my airborne GPS data and was quite happy with the results. I’ve been doing this now for almost 10 years, but am always pleasantly surprised when it all works as planned, or better. The upside with a system like mine is that the initial buy-in cost is quite low, the downside is that because I’m in charge of integrating components I’m also in charge of making everything work — the buck stops here. I’ve published the basics of my methods here, but I’m always improving them and this spring I made another leap in progress mostly with this project in mind. Now I’m able to locate the position of my photos to within half an inch in the air, and it is this accuracy that allows my system to outperform the competing technologies at a fraction of the price. And price should not be overlooked a system specification in terms of capability — it is this price that allows me to make this map out of pocket and it is the main reason no one else has ever made a map of this resolution and accuracy here before and why no one else probably ever will.
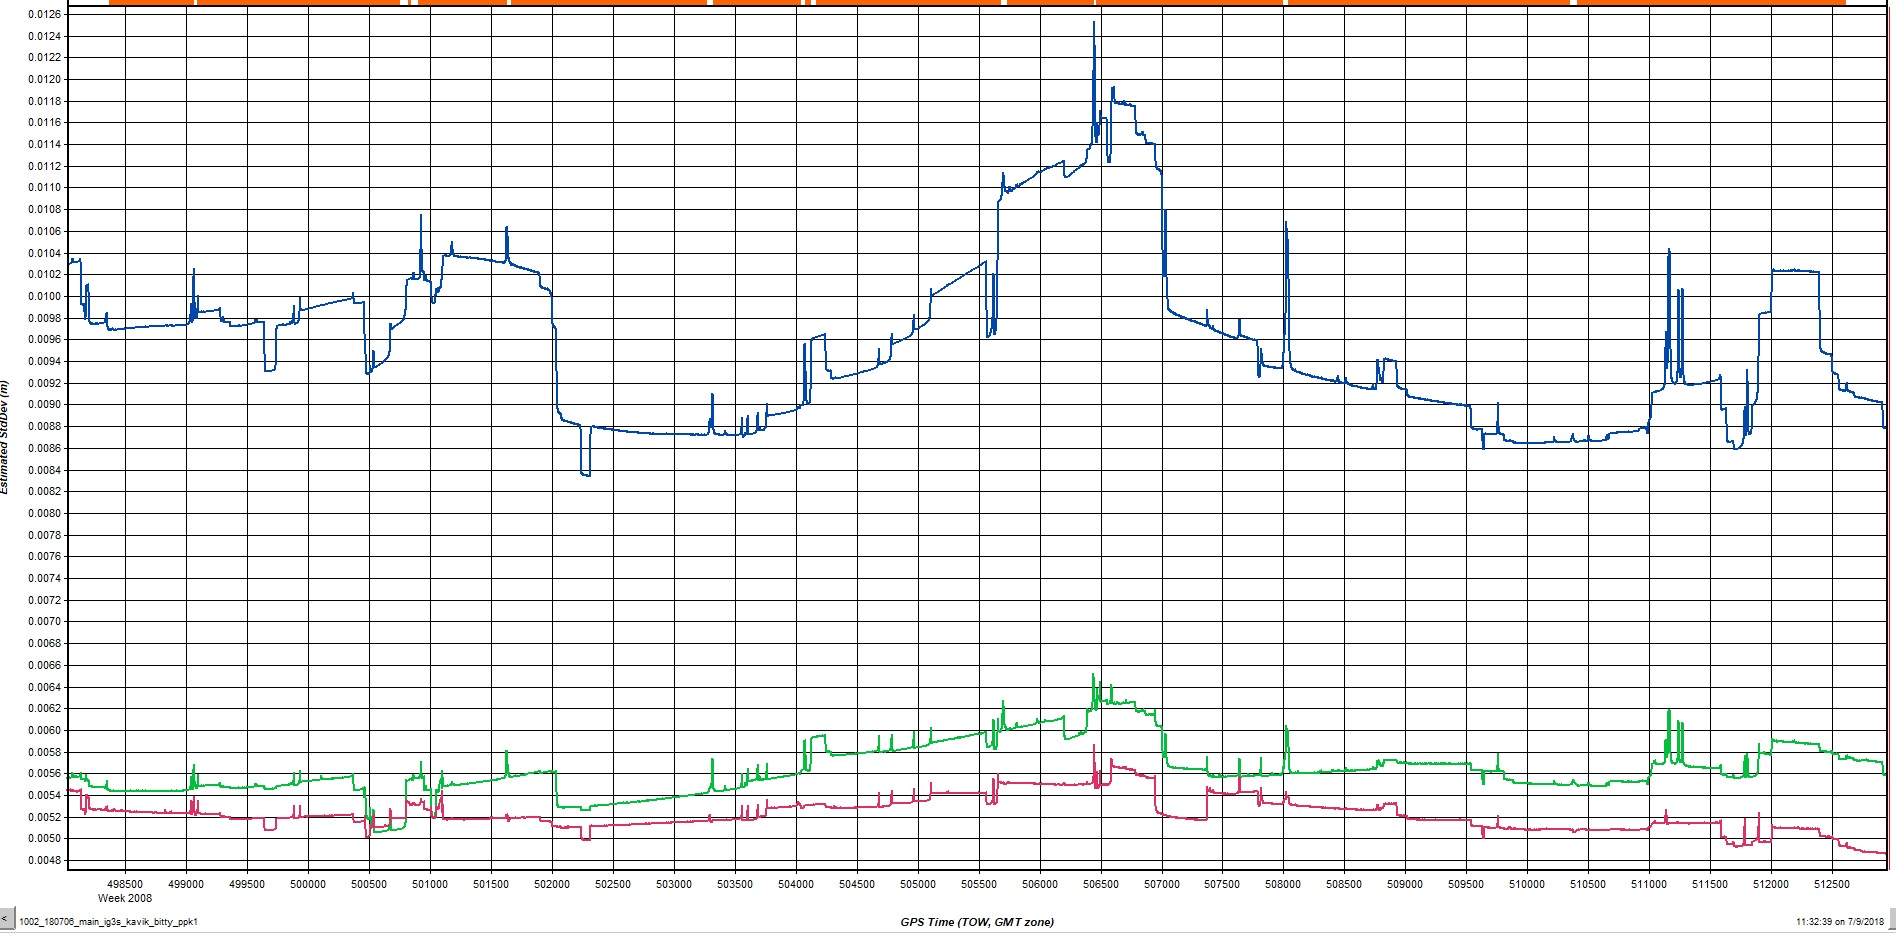
The colored lines here are an estimate of my position accuracy during one flight. The red and green are horizontal accuracy and are within about 1/4 inch, and the blue line is vertical accuracy, within about 1/2″. These numbers are probably a little optimistic, but still impressive for a plane moving 180 mph at times. What appear to be large fluctuations in the blue line in this graph are actually only +/- 2 mm.
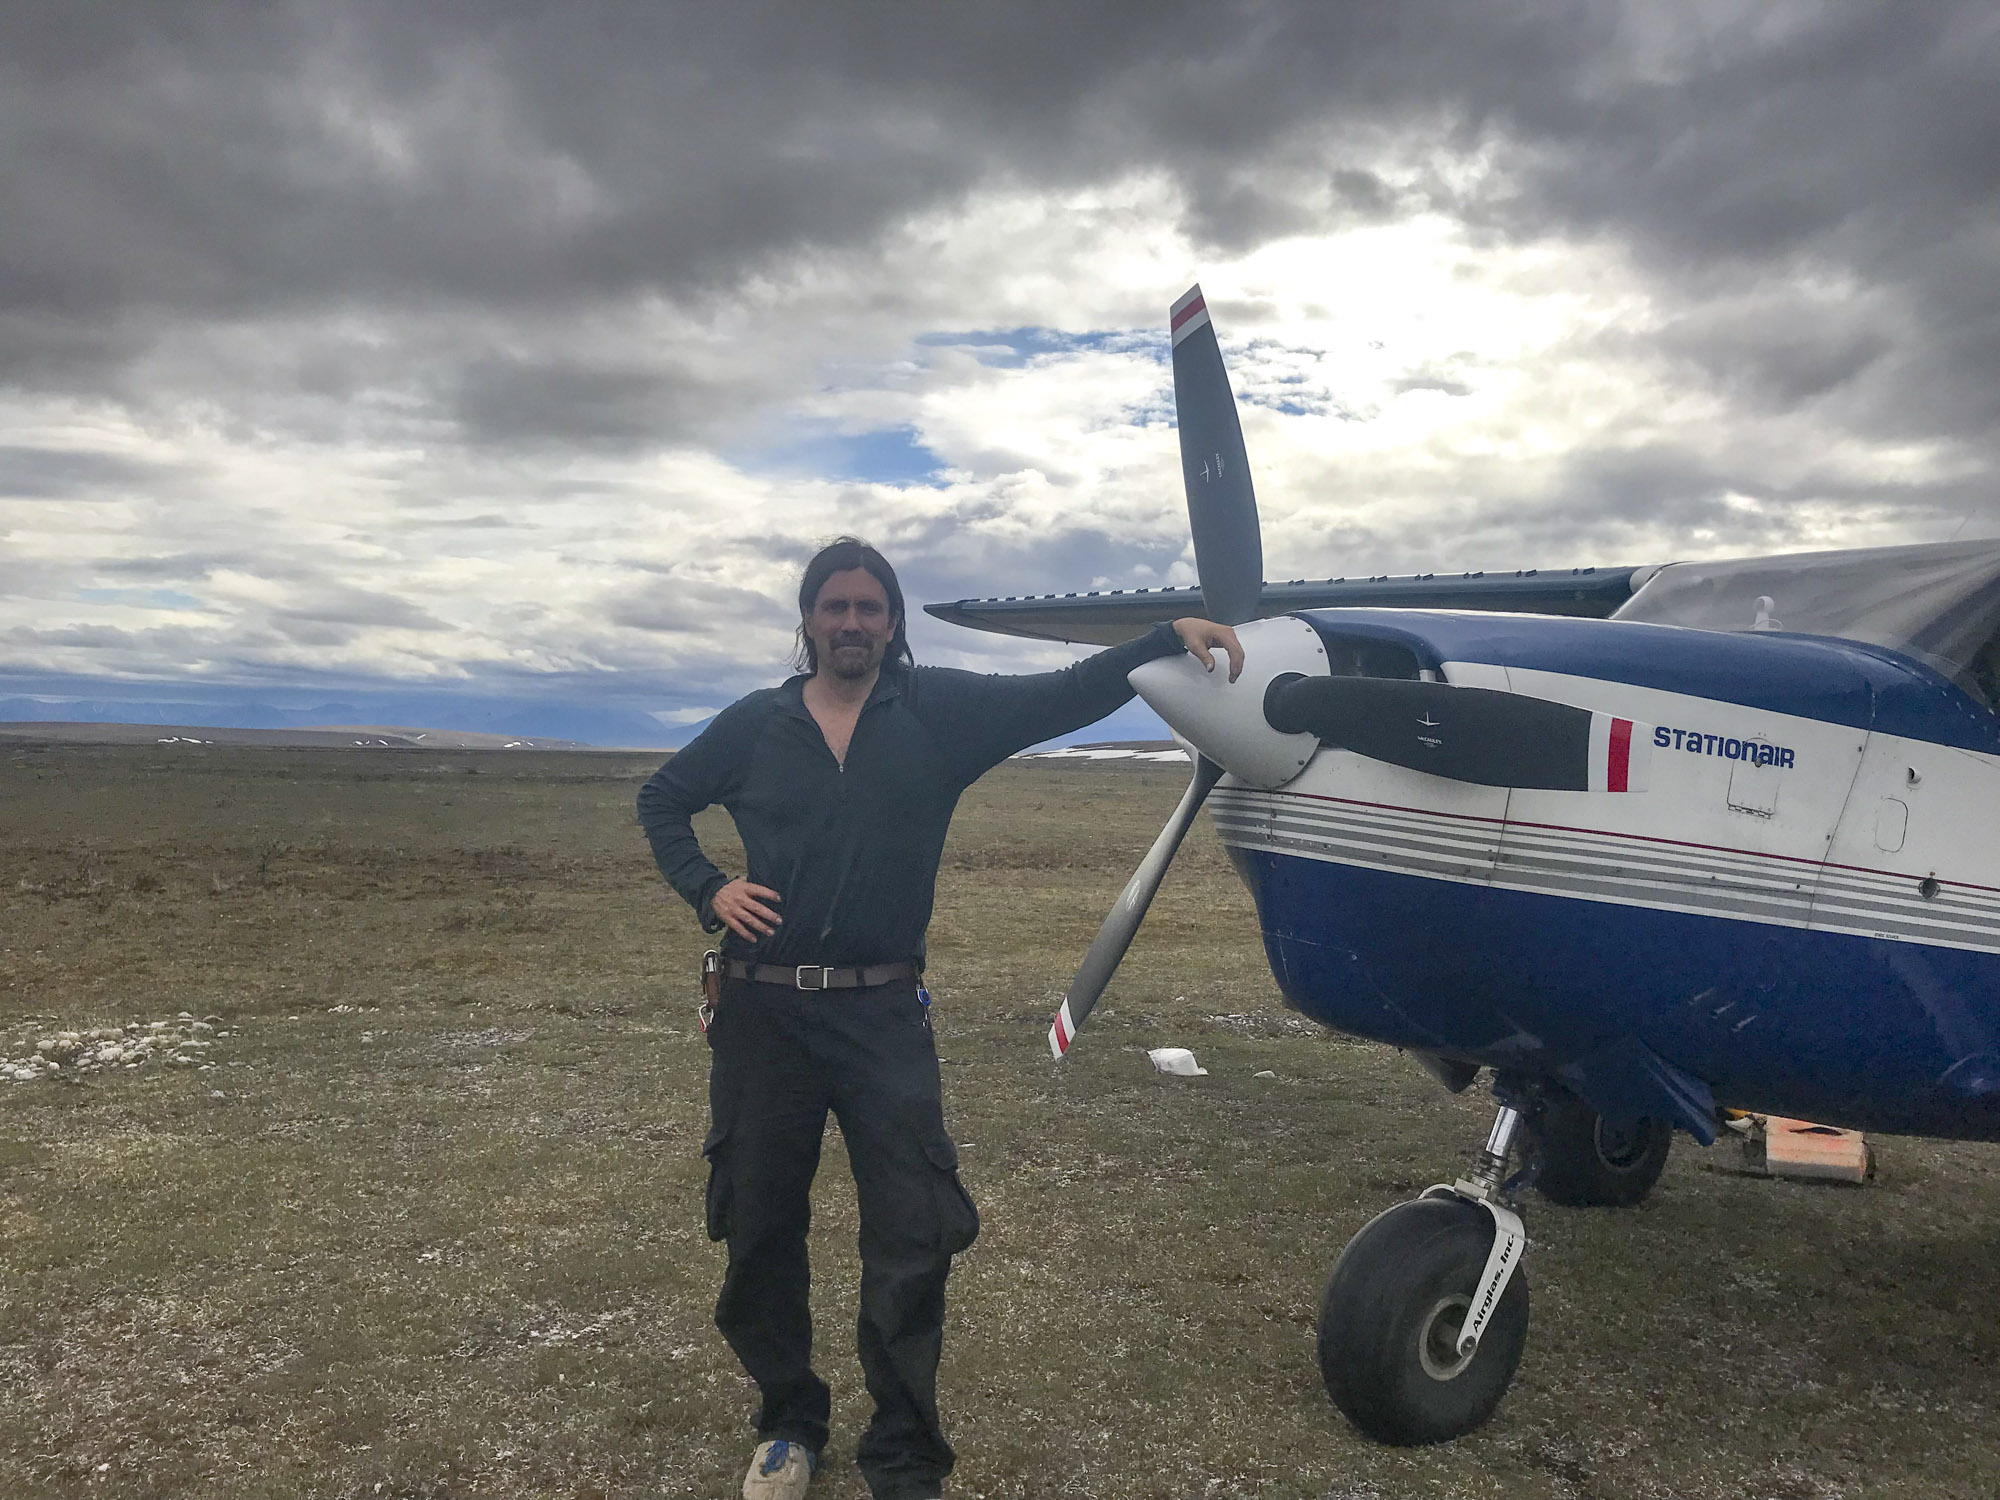
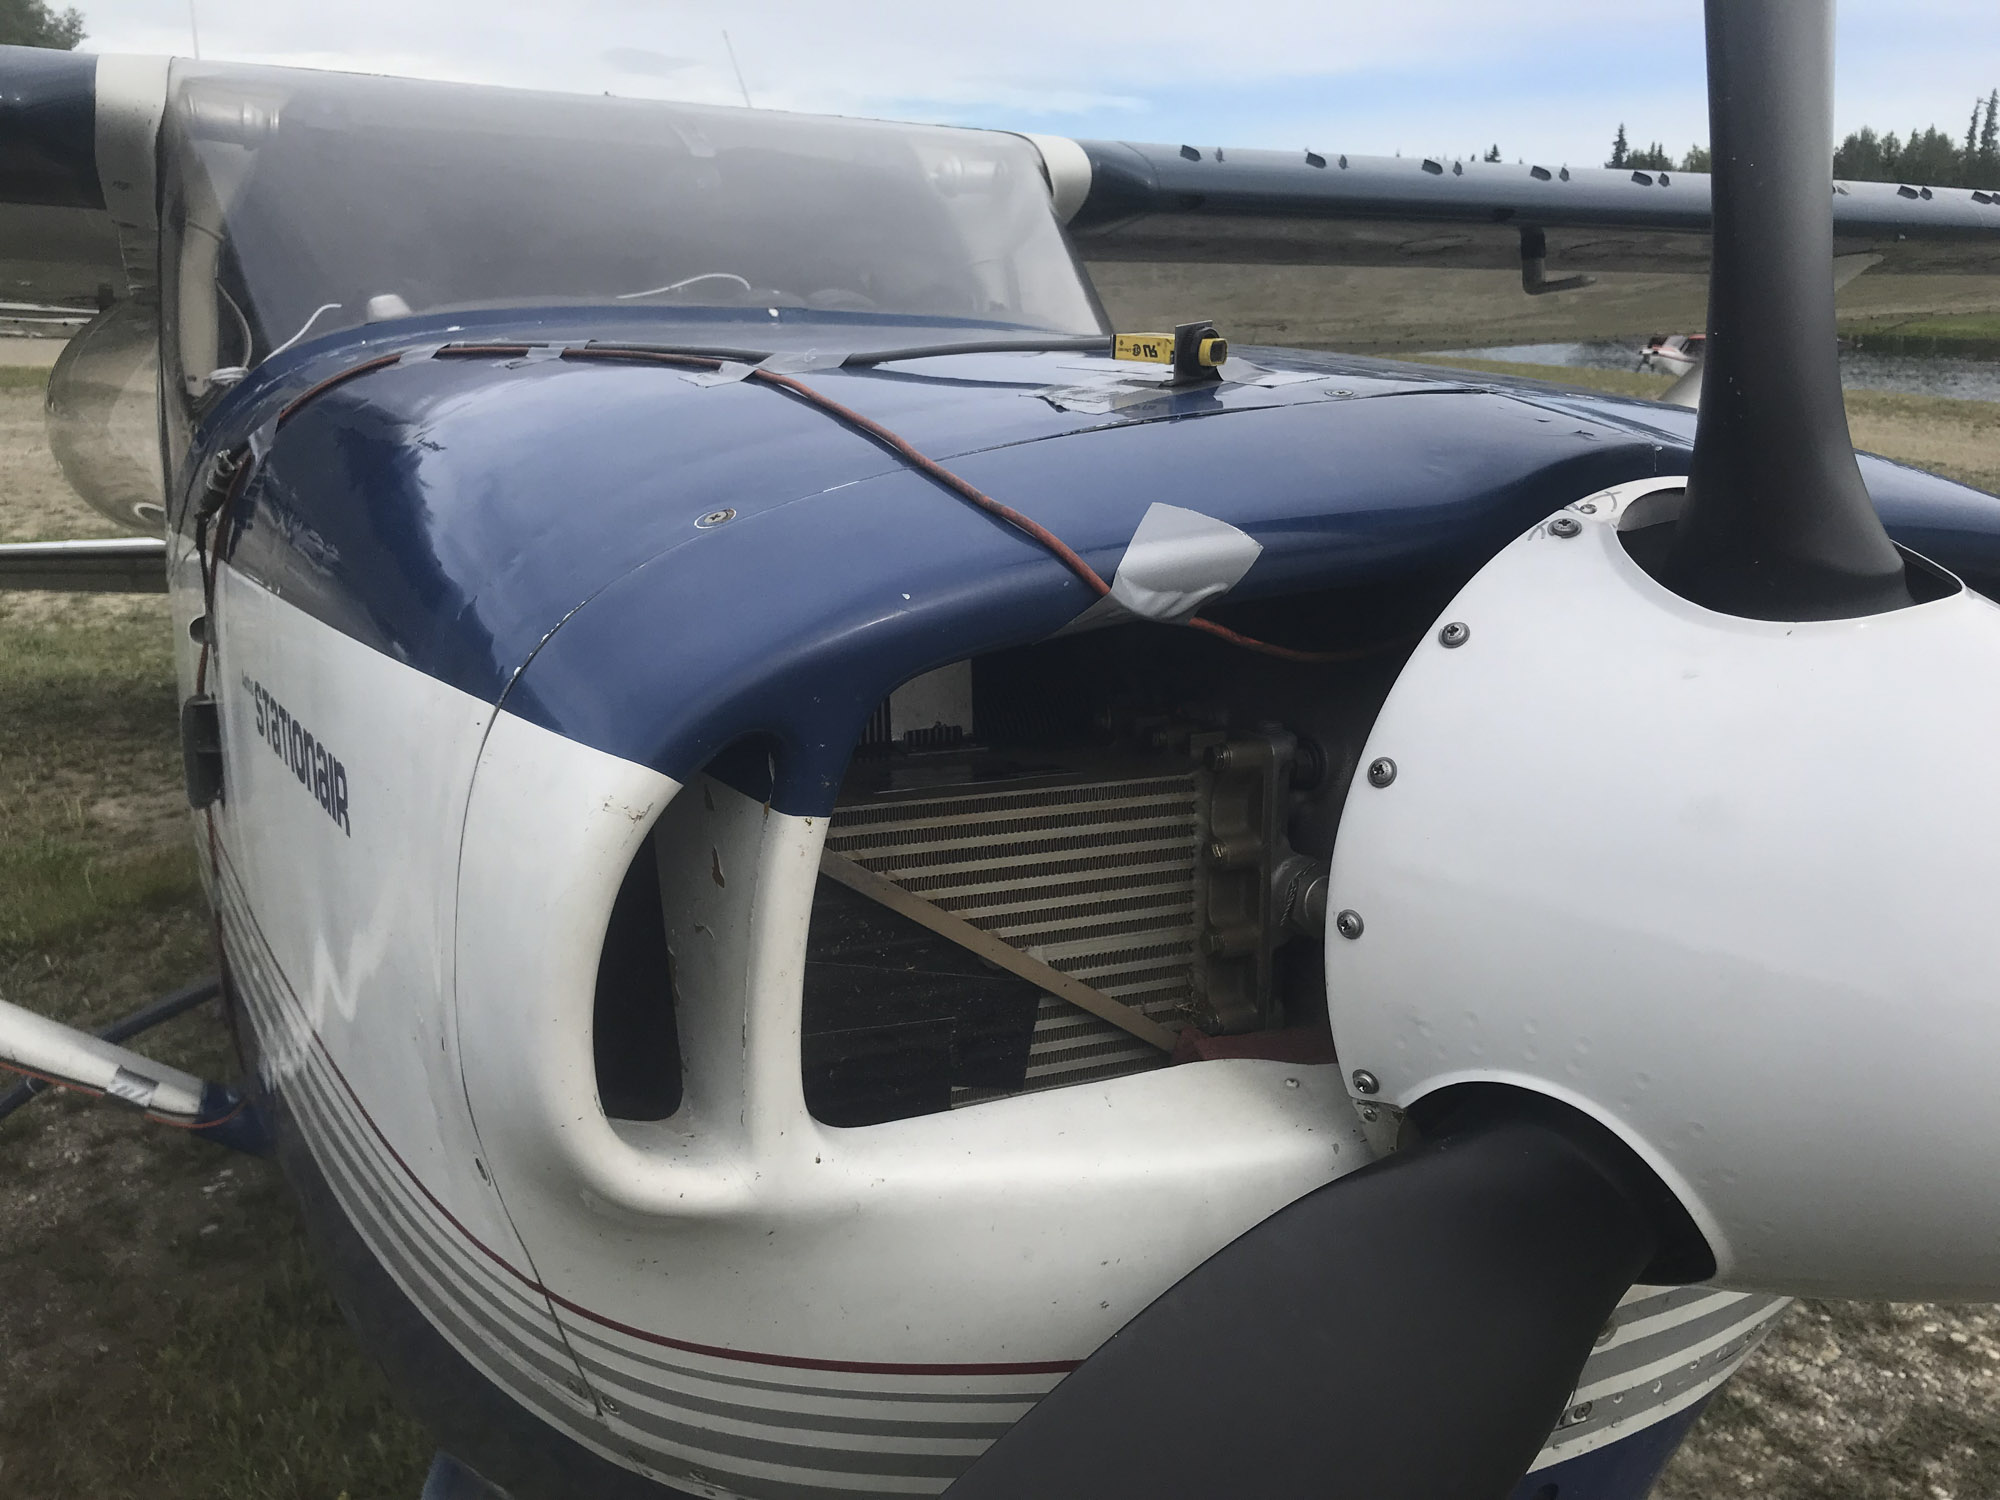
I also got some airplane maintenance done while here. Most bush planes in Alaska are many decades old, and mine are no exception. And running them out here on gravel and tundra is simply hard on them. In my case, running a nosewheel plane has been very hard on my prop. It’s painful to keep whittling it down to smooth out new nicks caused by rocks, and time consuming and expensive to keep rebalancing it to ensure the best photographs. But that’s the job and they are doing what I expect of them, so I can’t complain.
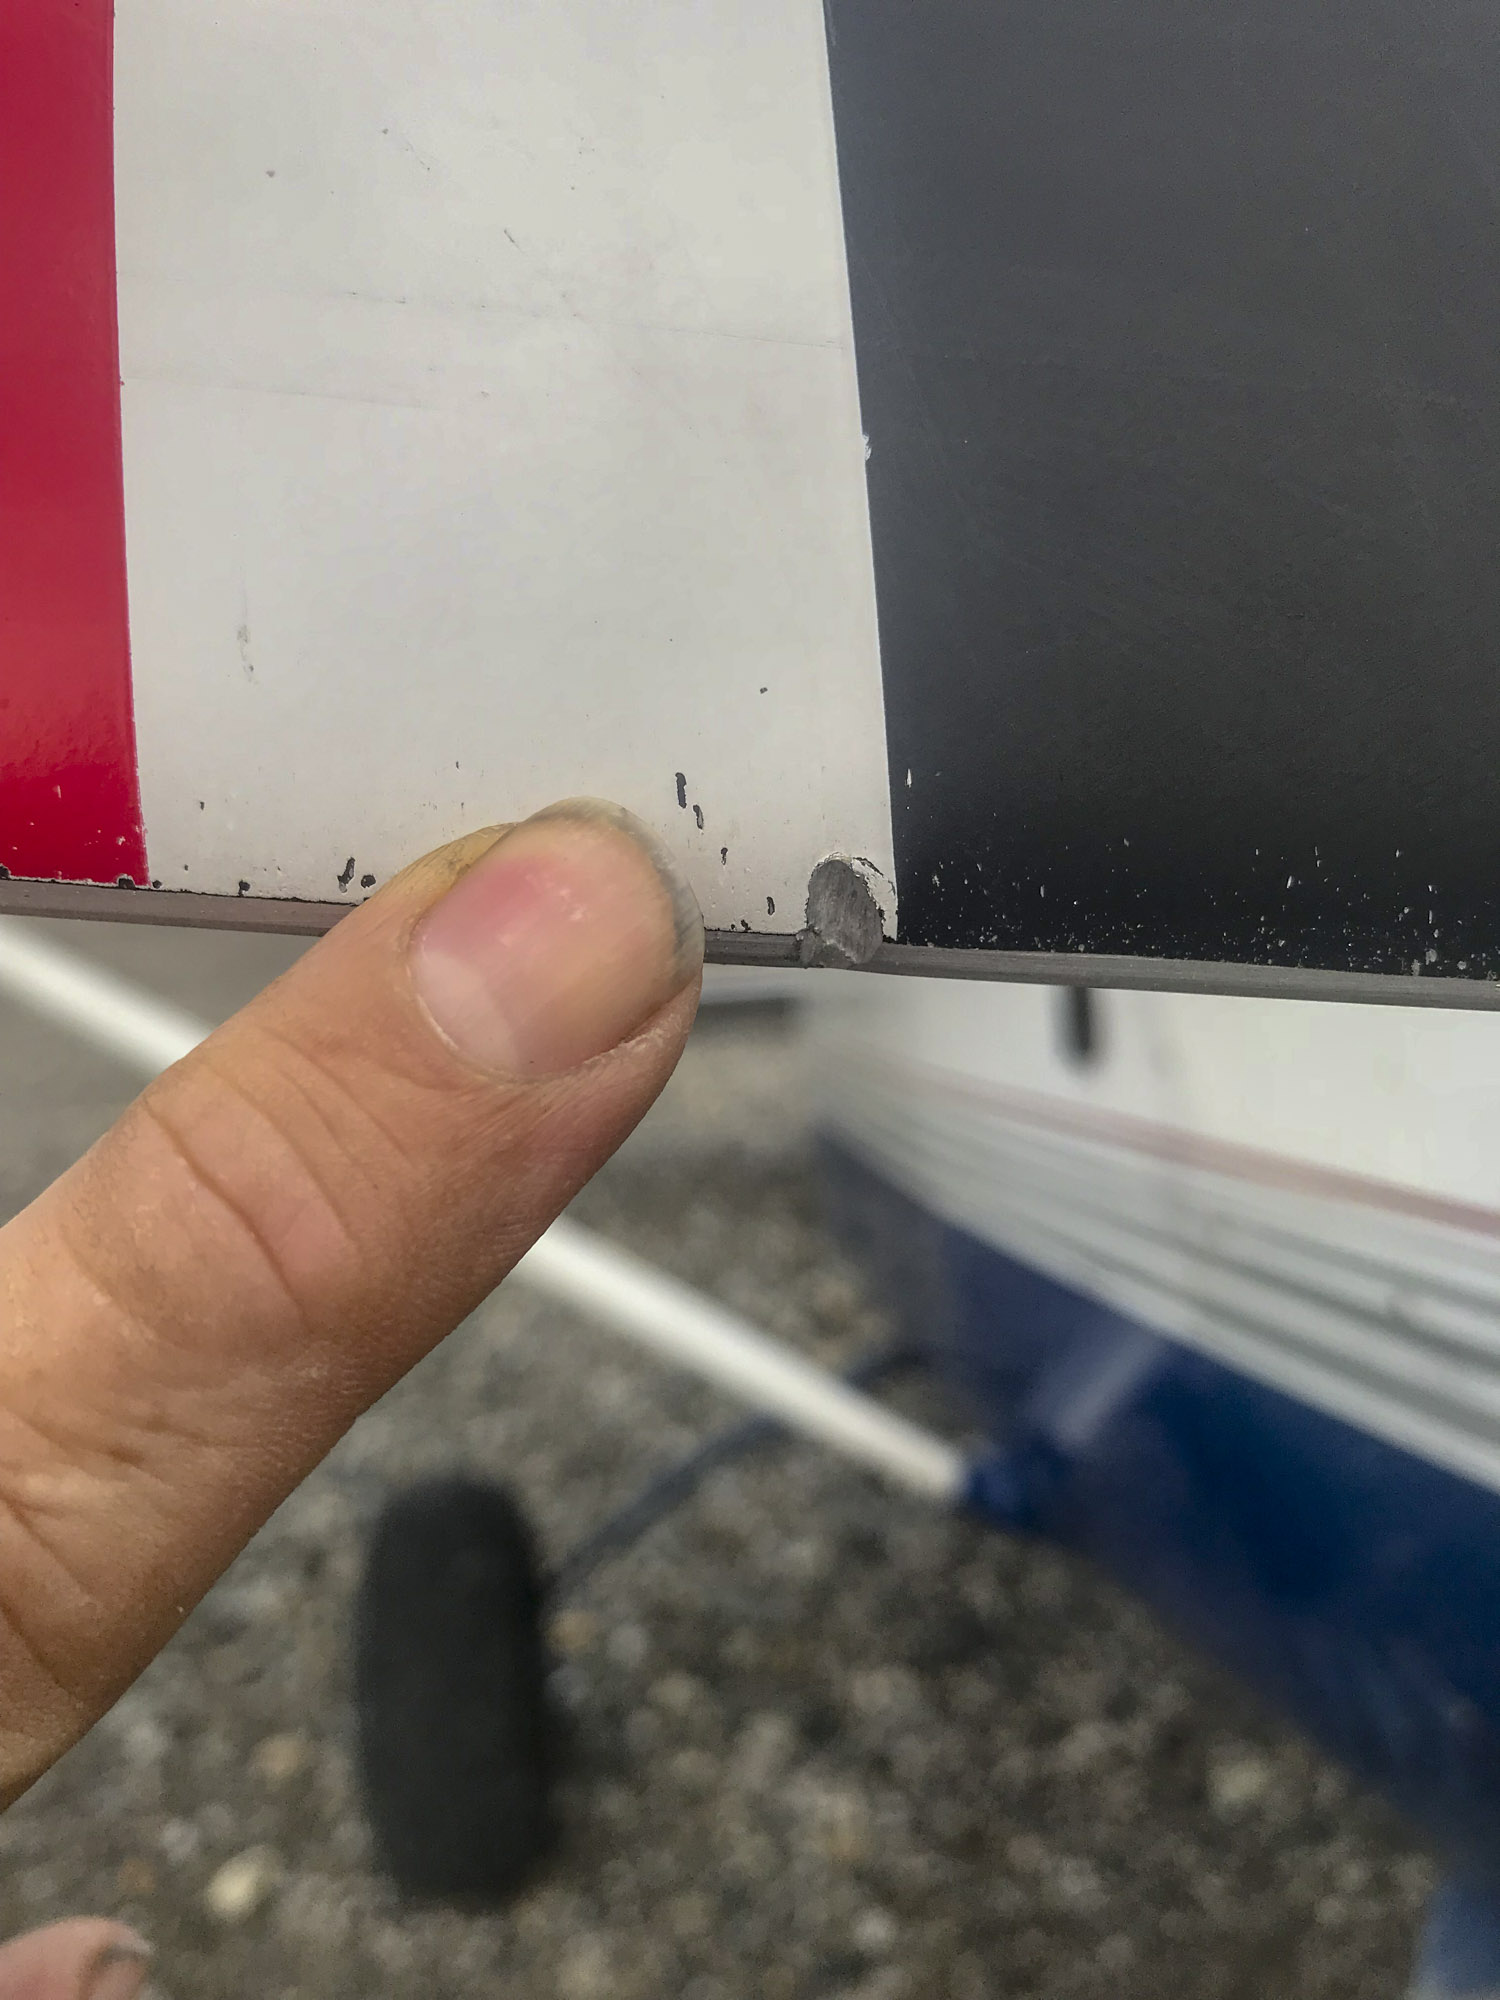
One of the larger dings to my prop, but not the largest. Also reminds me I need to pack a nail clipper…
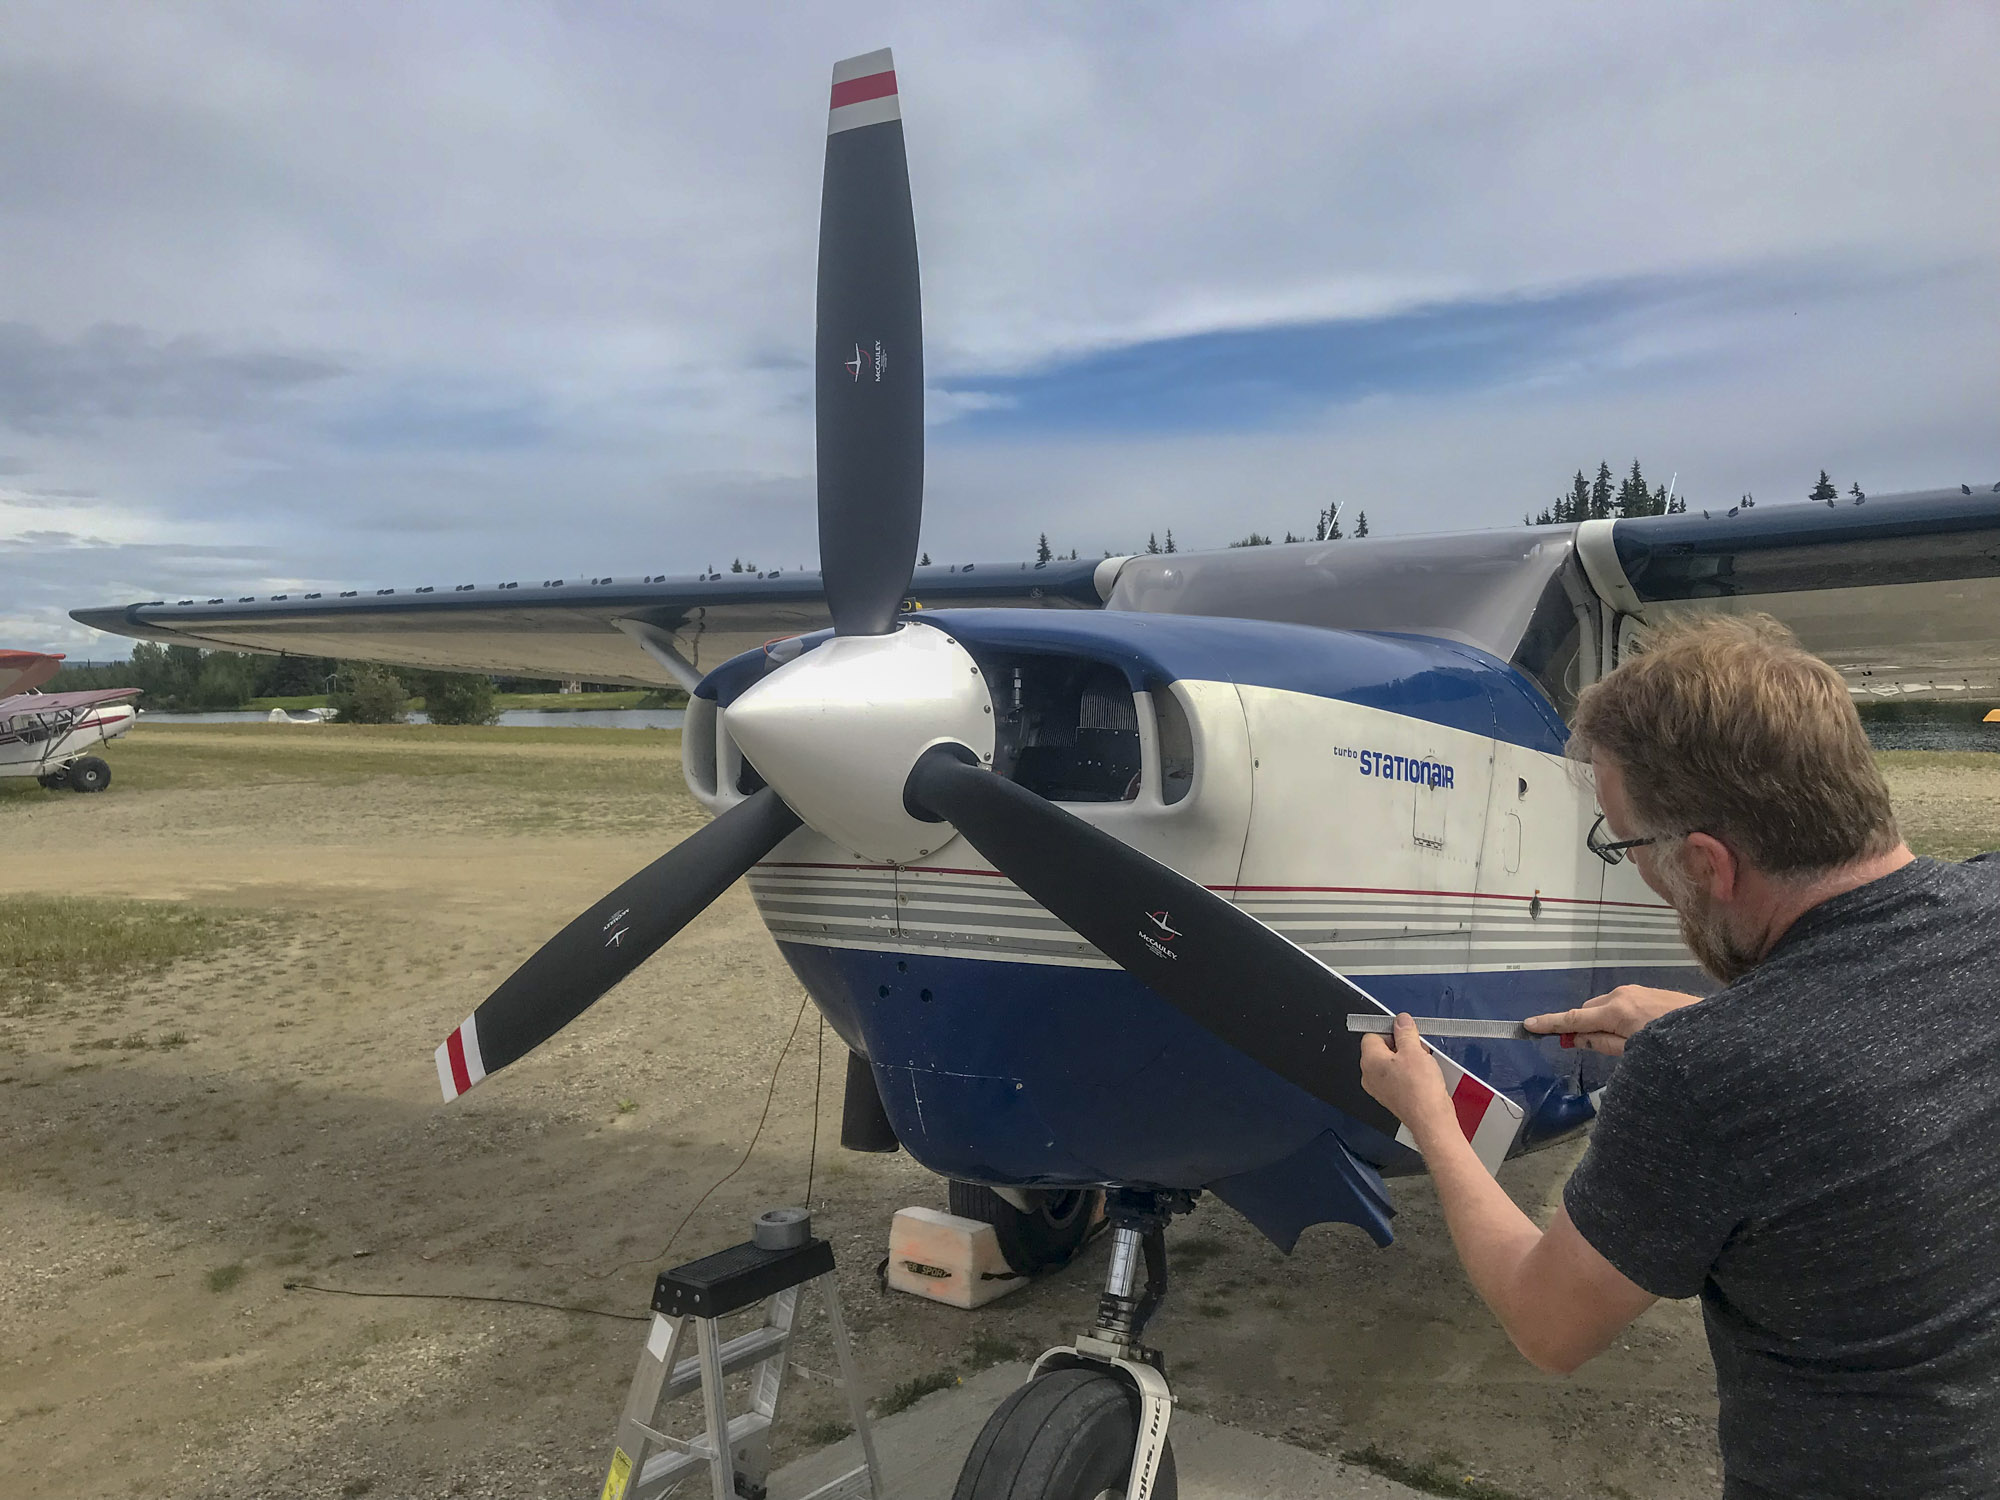
Seeing the metal fly off my blades to smooth them out is painful — props are expensive!
Prop balancing is time consuming but needed — just a tiny bit of weight makes a big difference in photo clarity.
My last blog post highlighting fodar’s ability to measure the physical and visual impact of seismic trails got responses to it ranging from (literally) “Eat shit and die” to “Great job”, with a lot in between, mostly on the negative side. It was certainly interesting to see how passionately some people hate anything they perceive as a threat to what they see as progress without considering whether it is a threat or not. In terms of the oil drilling debate, as I’ve always said I’m not weighing in on that, my goal here is simply to push towards making the most responsible decisions possible, especially when it comes to preventing long-term impacts caused by seismic exploration. So while I am very opposed to seeing a checkerboard grid laid over the 1002 Area by seismic exploration, I am not at all against seismic exploration itself if it can be done with no lasting impacts, either visual impacts or impacts to the form and function of the ecosystem. What I demonstrated in my last blog with the seismic work done several months ago fortuitously adjacent to the Refuge to allow me to map them is that my system can map these subtle impacts such that we can study them better than was ever possible before, and thereby potentially eliminate them. That is, because I can measure snow depth from the air at tire-track resolution, I can compare the thickness of snow pixel-by-pixel to the impact left behind to determine what snow depth is required to prevent such impacts; then I can map snow depth in advance of future seismic work that can be used to plot routes that cause no damage. I also have a method for measuring the depth of freeze beneath the snow that I developed to measure soil mositure from satellites almost 20 years ago now that I can now use from my plane to use in basically the same way as snow depth — measure the depth of freeze before new work is done on a pixel-by-pixel basis, measure the impacts afterwards, determine the minimum depth of thaw required to prevent any long term impacts, and then apply this knowledge in advance of future work. What we learn might mean that in some winters seismic simply is not possible — but so what, the oil is only getting more valuable the longer it sits there and this is a risk that for-profit companies can decide to take or not. The Arctic Refuge simply requires a higher standard of care in terms of impacts, both because it’s surface is more fragile and less resilient to impacts than the coastal plain further west and because by law it is was established with requirements for a higher standard of care than the Naval Petroleum Reserves to the west.
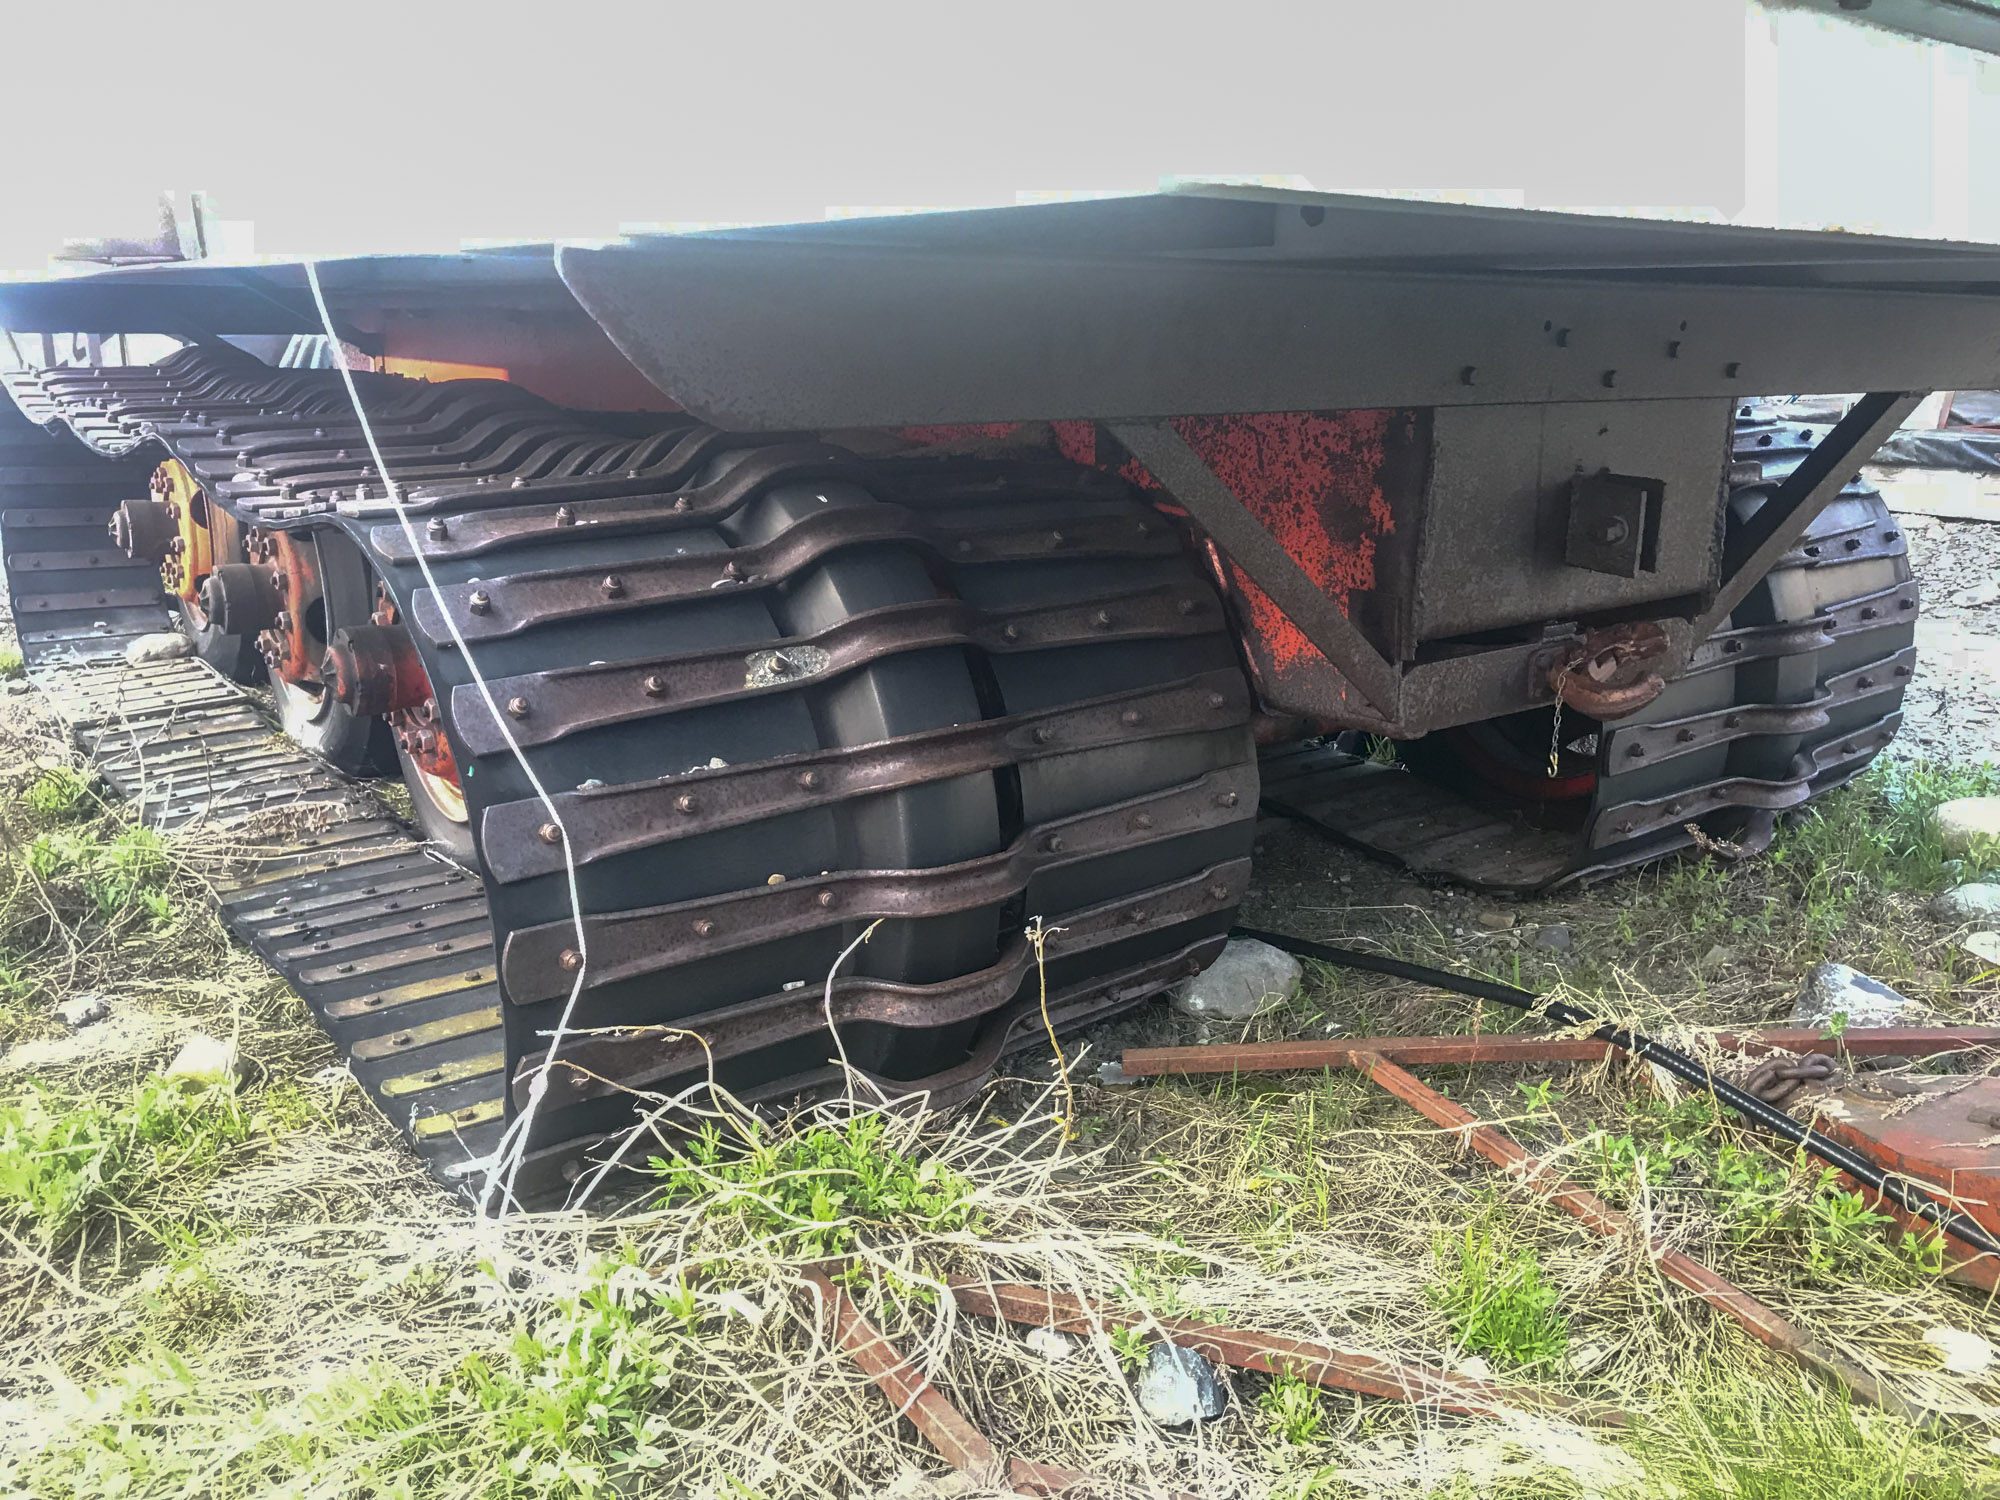
Here’s an example of the old school tires used in overland transportation in summer and winter. The metal lugs are designed to chew into the landscape. Using such equipment was the best practice of the day.
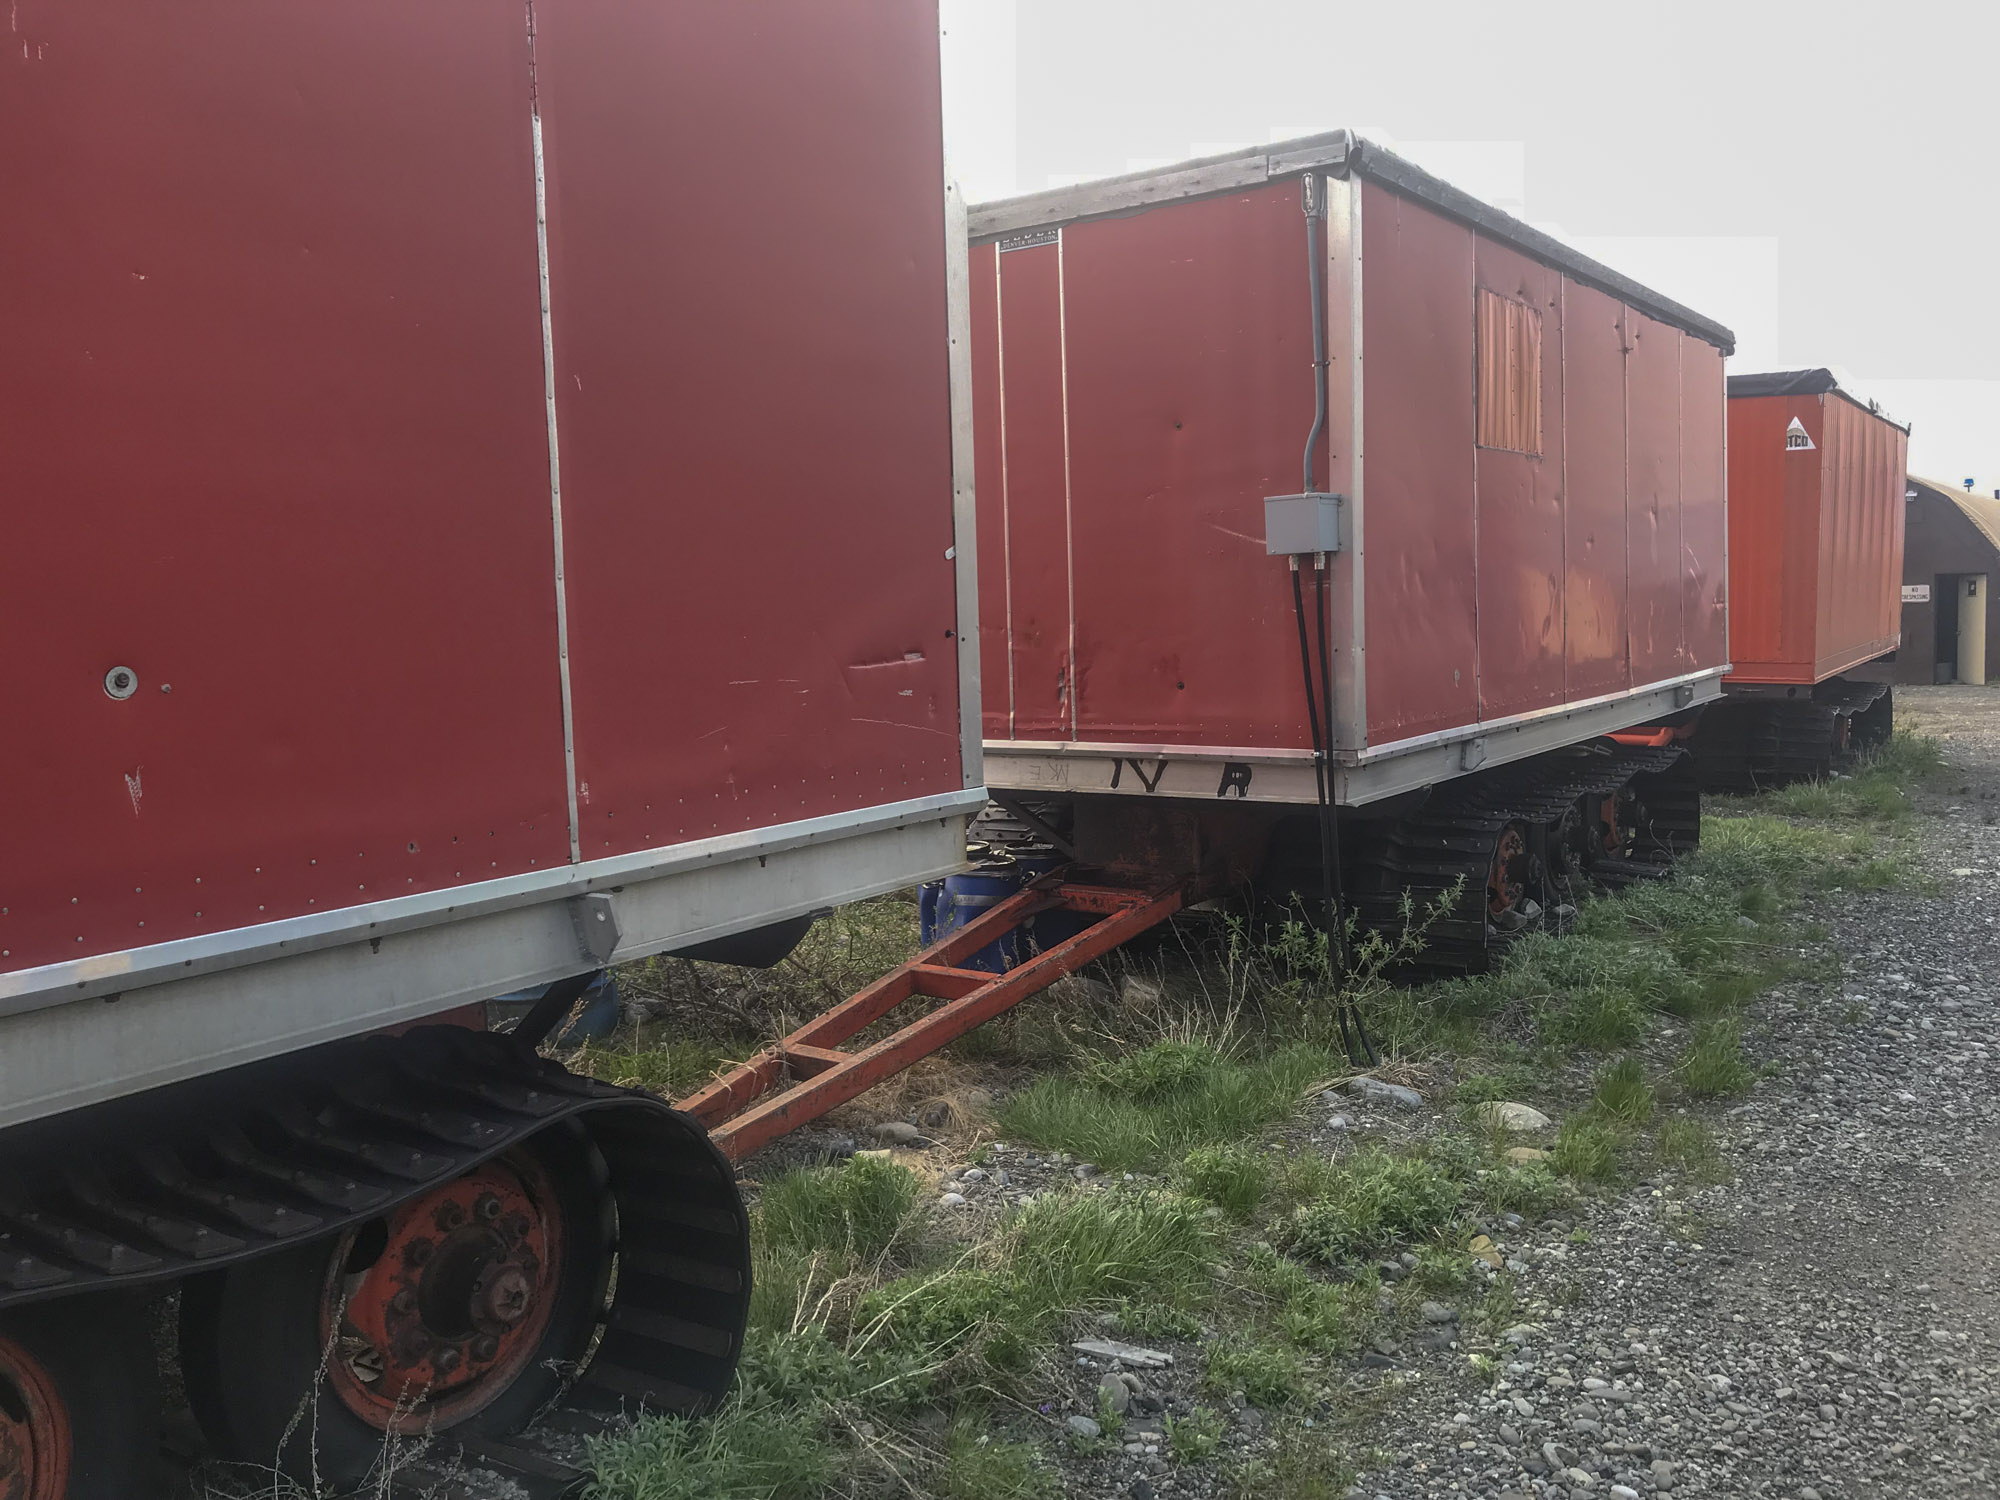
These are like the Arctic equivalent of a trailer park — mobile homes that never move again, recycled and repurposed as the main lodging at Kavik River Camp.
Here’s an example of the scars left by tracked vehicles like this decades ago.
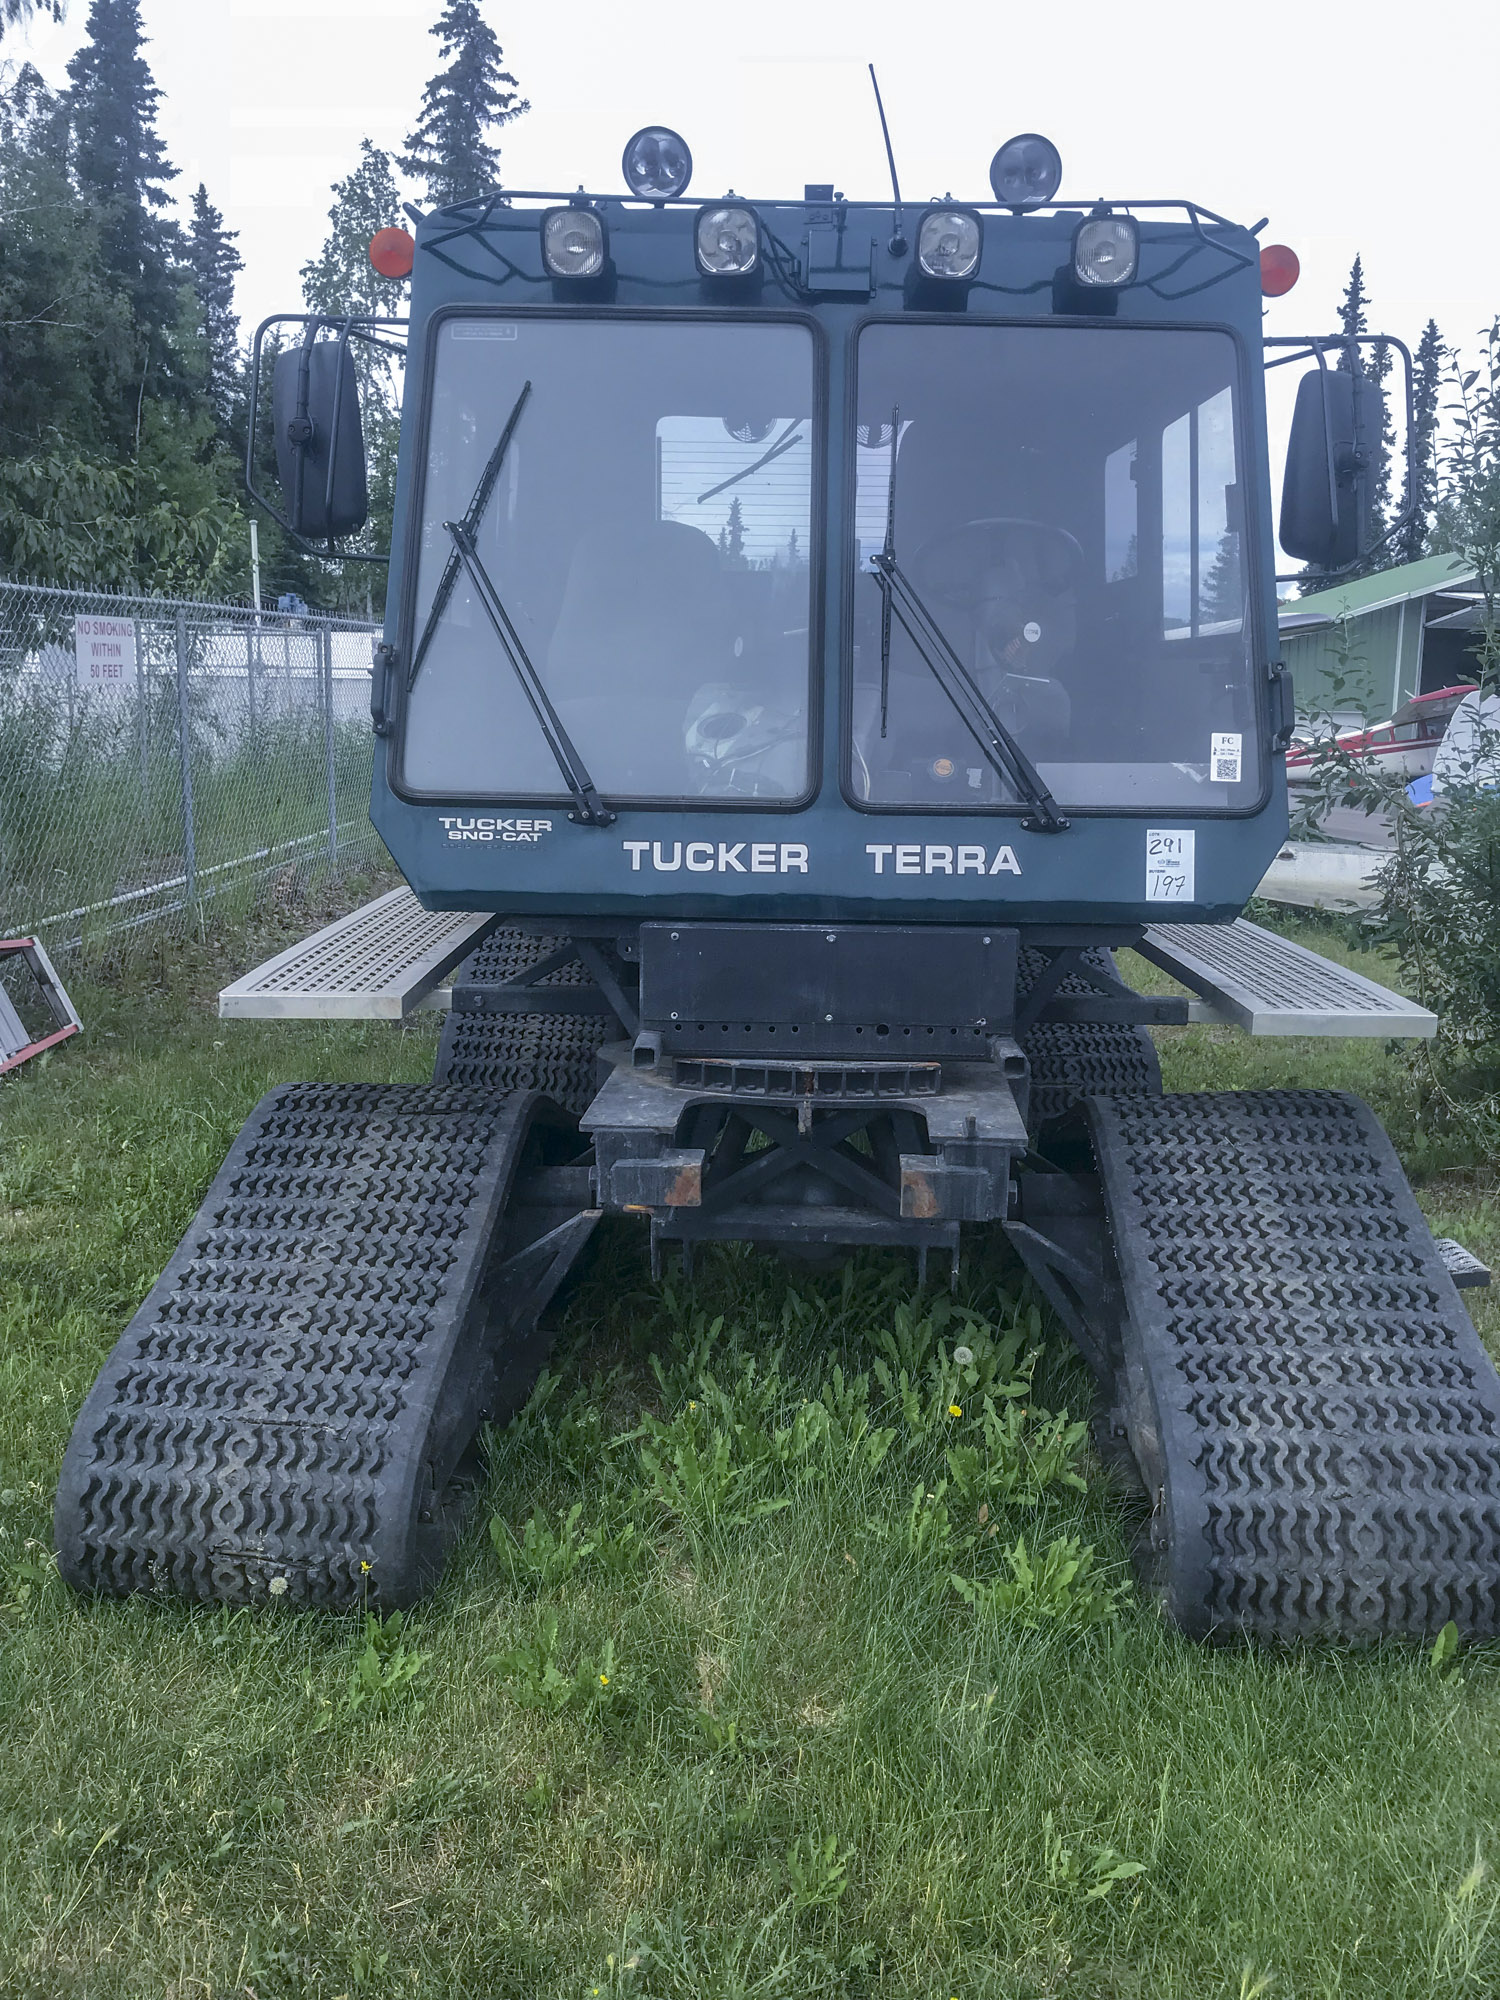
Here’s an example of the type of vehicles used in seismic exploration today in winter.
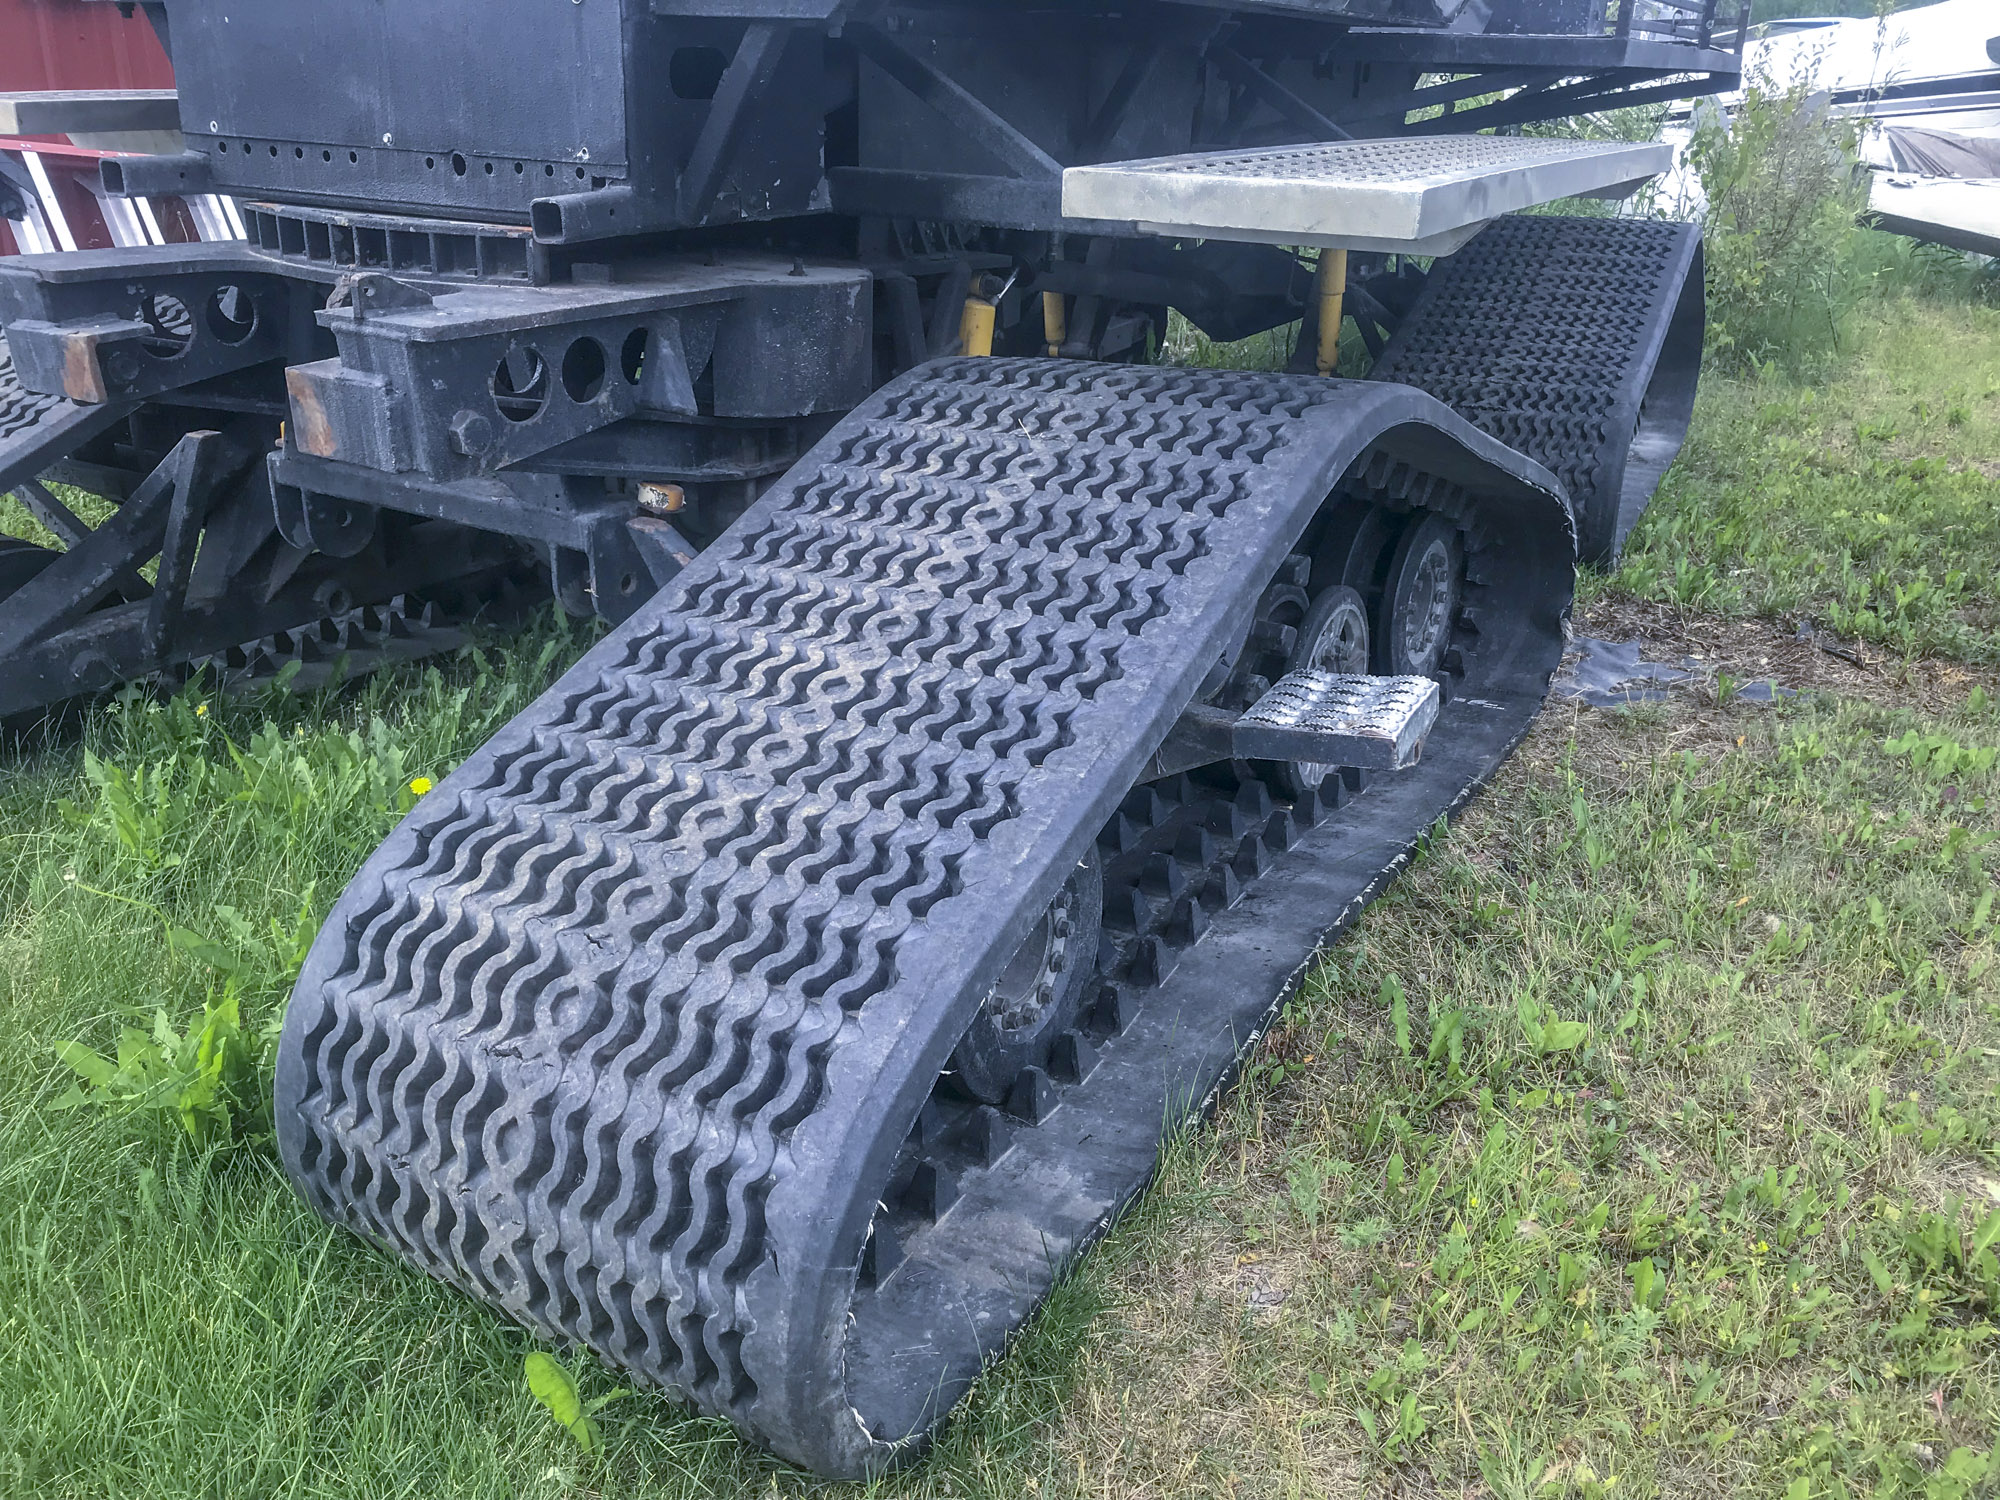 These are the tires used on the Tucker Terras — a huge improvement over the metal lugs. However, just because they are huge improvement over the previous generation is, in my mind, no reason to not continue making improvements. Once we get to the point where there are literally no impacts, visual or structural, why not map the hell out of the subsurface geology?
 While 2018 methods are much, much less destructive, I do not see that that’s any reason to not continue to improve them until they truly do leave no trace or to override the purposes for which the Arctic Refuge was founded and protected for 60 years. We can do better.
But no matter what you do, you can’t fix stupid. Probably over 50 years ago, someone riding a bulldozer thought it was a good use of their time to carve these initials (GSI) into into the tundra, just across the Canning River from the Arctic Refuge. To their credit, they did a nice job with the proportions and leading, but it does go to show how fragile this ecosystem is as it will certainly be decades more, if not centuries, before these impacts disappear. Piles of oil drums are stacked nearby and a variety of old seismic trails lead directly to this location, so while the graffiti could have been avoided it was essentially made with the same best practices at the time that made the trails we see leading up to it. Hopefully using new methods that actually leave no trace can at least minimizes the potential for such stupidity that is deliberately trying to leave a trace.
And just in case it helps others understand my perspective and my goals, I see nothing hypocritical about applying a different standard of care to oil development in the Arctic National Wildlife Refuge than in NPRA — it is simply a matter of zoning and understanding bias that we already take for granted in our every day lives. Does it make me hypocritical to use a flush toilet but not want the raw sewage dumped into the nearest river? Then why is it hypocritical to burn avgas making a map to prevent harm to a protected landscape? These are examples of proper zoning and regulation, where different standards are applied to different circumstances, and the ANWR zoning and regulation is no different. Does it make me a snowflake to not want convicted pedophiles allowed to run day care centers despite them saying they’ve learned their lesson? Then why would I be a snowflake for not wanting to allow oil companies and their economically-aligned counterparts to define the state-of-the-art in seismic exploration impacts given the scars they’ve left in the past using the state-of-the-art at that time? These are examples of understanding human bias and providing appropriate checks and balances. The Arctic Refuge was created based on the instigation of scientists like me, largely to let nature’s dynamics unfold without the direct influences or installations of man, where man becomes a visitor rather than a direct manipulator of the landscape or its ecosystems on a scale large enough to support migrating caribou herds. It is true that 20 years later when the Refuge was expanded that oil exploration was allowed as a possibility, but that was never meant to say that oil companies or their advocates should have free reign to fuck things up however they like in the name of that drilling — the values of the citizens that formed the Refuge should still prevail and this includes not leaving behind a giant checkerboard of seismic trails for decades to come. And whether you care about such laws or not, I hope everyone cares about showing your neighbors some respect — just because four-wheelers are legal doesn’t mean you should allow or encourage your kids to do donuts or carve their initials in your neighbor’s lawn, so just because oil exploration is legal doesn’t mean you should allow or encourage oil companies to turf up the ground that many of your neighbors see as their backyard. And I would think that even the staunchest of drilling proponents would understand this: if you allow this checkerboard to be laid over this protected landscape as the first oil-related activity taken here, the moral outrage felt by your neighbors could well threaten drilling operations here permanently. So as I see it, if oil is to be extracted here then we the people need to hold our politicians and corporate stakeholders accountable to a higher standard of care here that abides by the founding intents of the Refuge — unless we unite on this we all risk losing what we are after. I believe that my map helps both of these objectives for the Refuge — it improves our scientific understanding of nature’s dynamics without directly impacting them and it will hopefully allow us to meet the objectives of oil exploration without violating the intent behind the Refuge and the nearly 60 years we’ve protected it for this purpose. So believe me or not when I say I really don’t want to be in this position — while I’m making this map this summer on my own to ensure it exists before seismic exploration begins, I’ve been dreaming of making this map for years for purely scientific purposes to support my long-term research here and I’d much rather go back to digging out my tent in a blizzard and being chased by bears in the field than trying to educate Facebook trolls on responsible decision making…
So that’s the latest. Progress is being made and I’m hopeful for more to come. All I need now is a week of perfect weather to finish it off…
Not exactly Key West, but f you can’t find beauty here, I’d be surprised if you could find it anywhere.