
Two big days on the North Slope
After eight days on standby, the weather finally cooperated and we had two big days on the north slope of Alaska — 19 hours of flying, 7 projects, and over 8,000 photos totaling 350 gigabytes.
This has been a hot dry year in Fairbanks. So hot and dry, that a squirrel set my roof on fire 6 weeks ago and burned half my house down. Over 2 millions acres of Alaska are currently burning or smoldering in Alaska, creating A LOT of smoke, mostly in the Interior (or so it seems to us). Every day for the past week or so, I’ve been up at 5 AM checking weather and weather cams to see if I could make it to the north slope, but with no luck. The science team at Peter’s Lake was also up at 5AM sending me texts about conditions there. I tried to make it up there twice when it was sunny for them, but was turned around by smoke. Though I could see the ground and had legal visibility, the smoke was so thick that there was no horizon and it was essentially instrument flying, and that’s no way to be navigating mountain passes. But finally, some high pressure systems moved in and began blowing from the north, pushing the smoke in the opposite direction as I needed to go, and yesterday I made it up there.
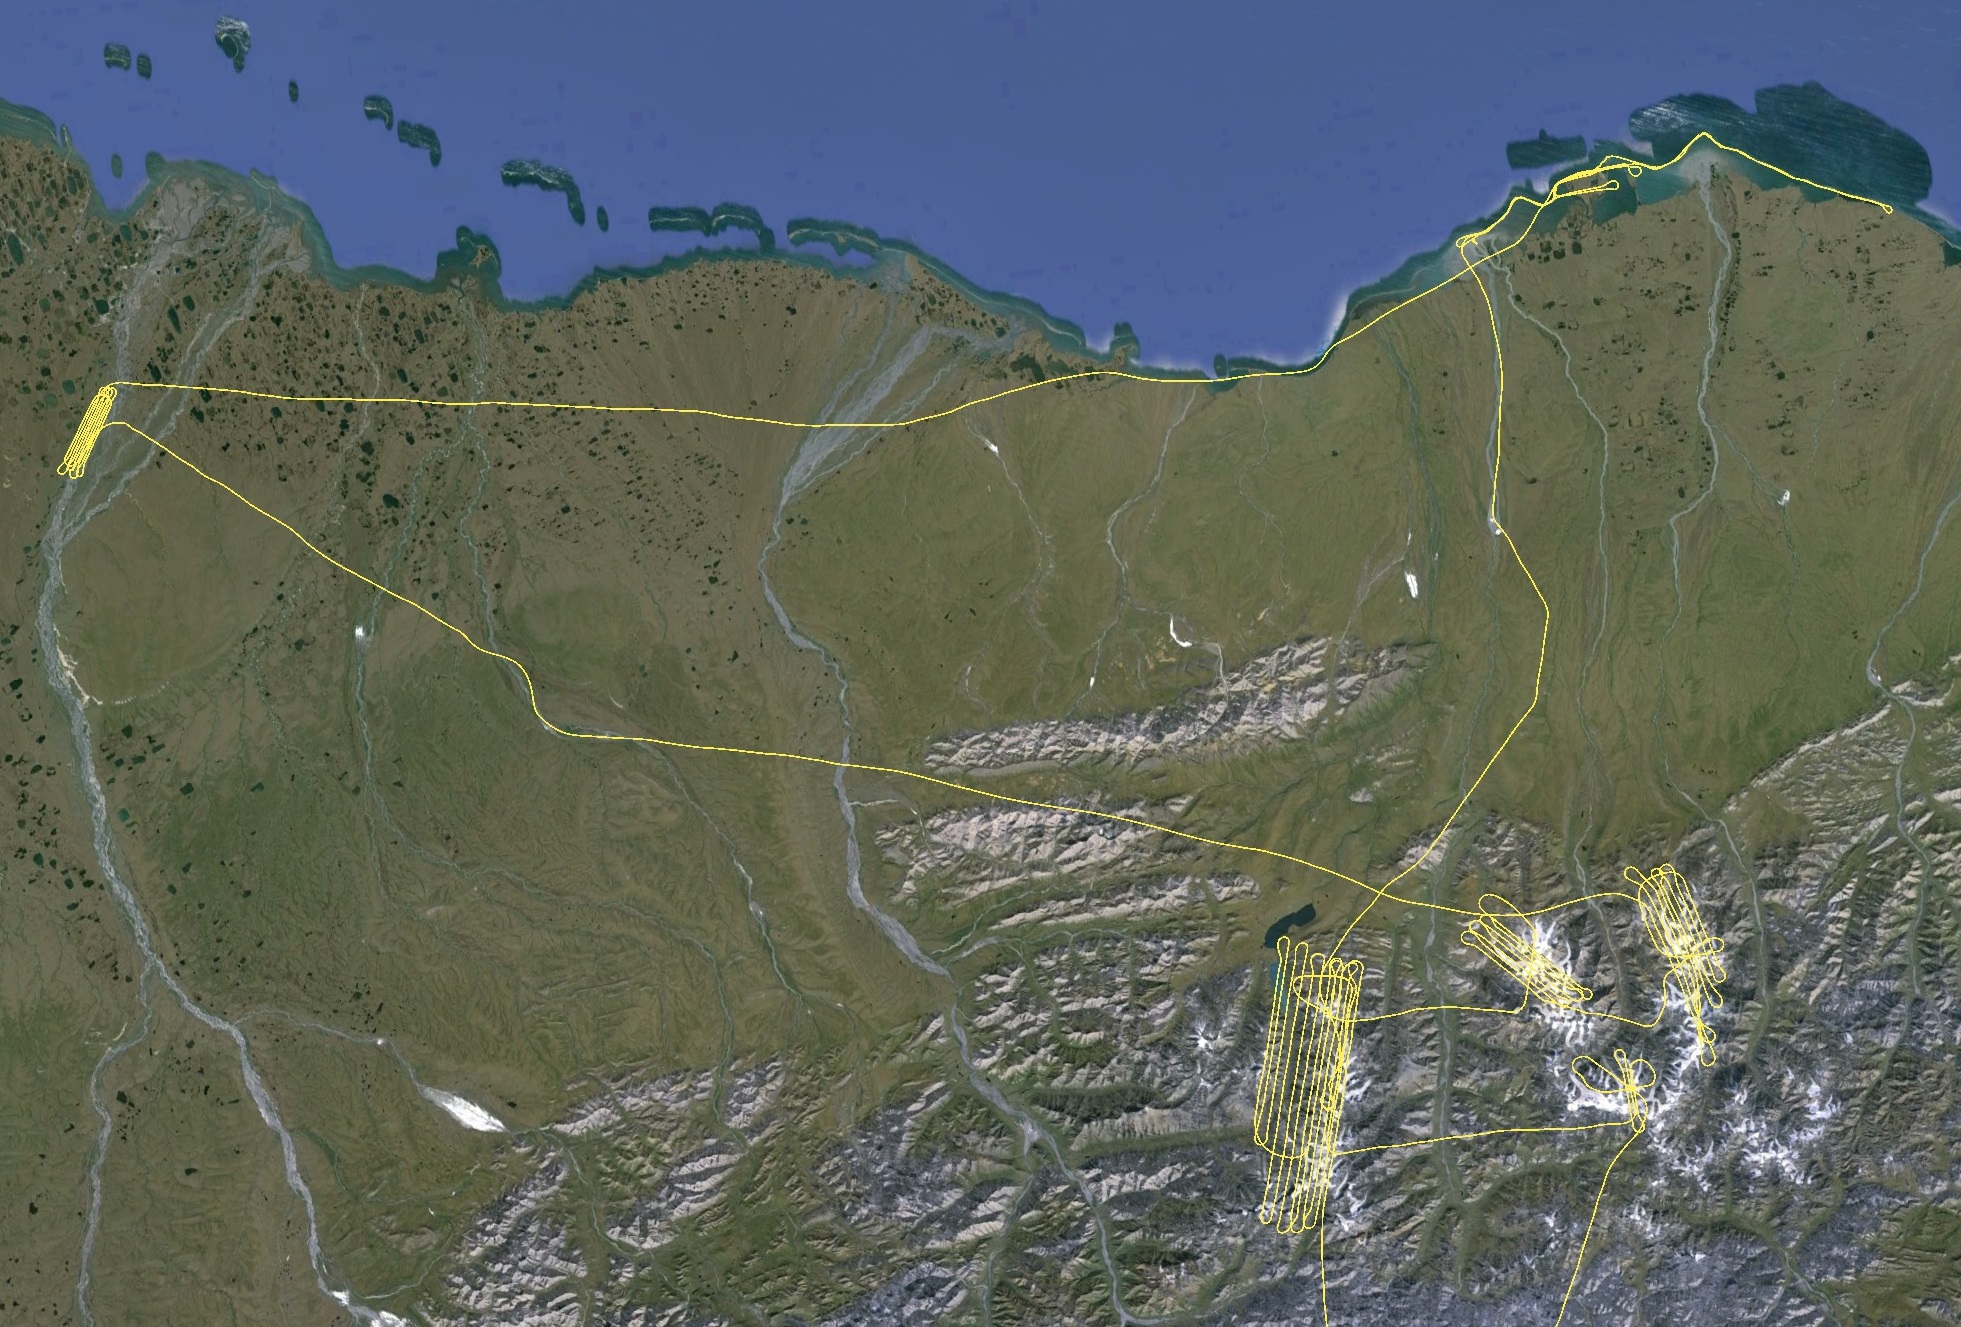
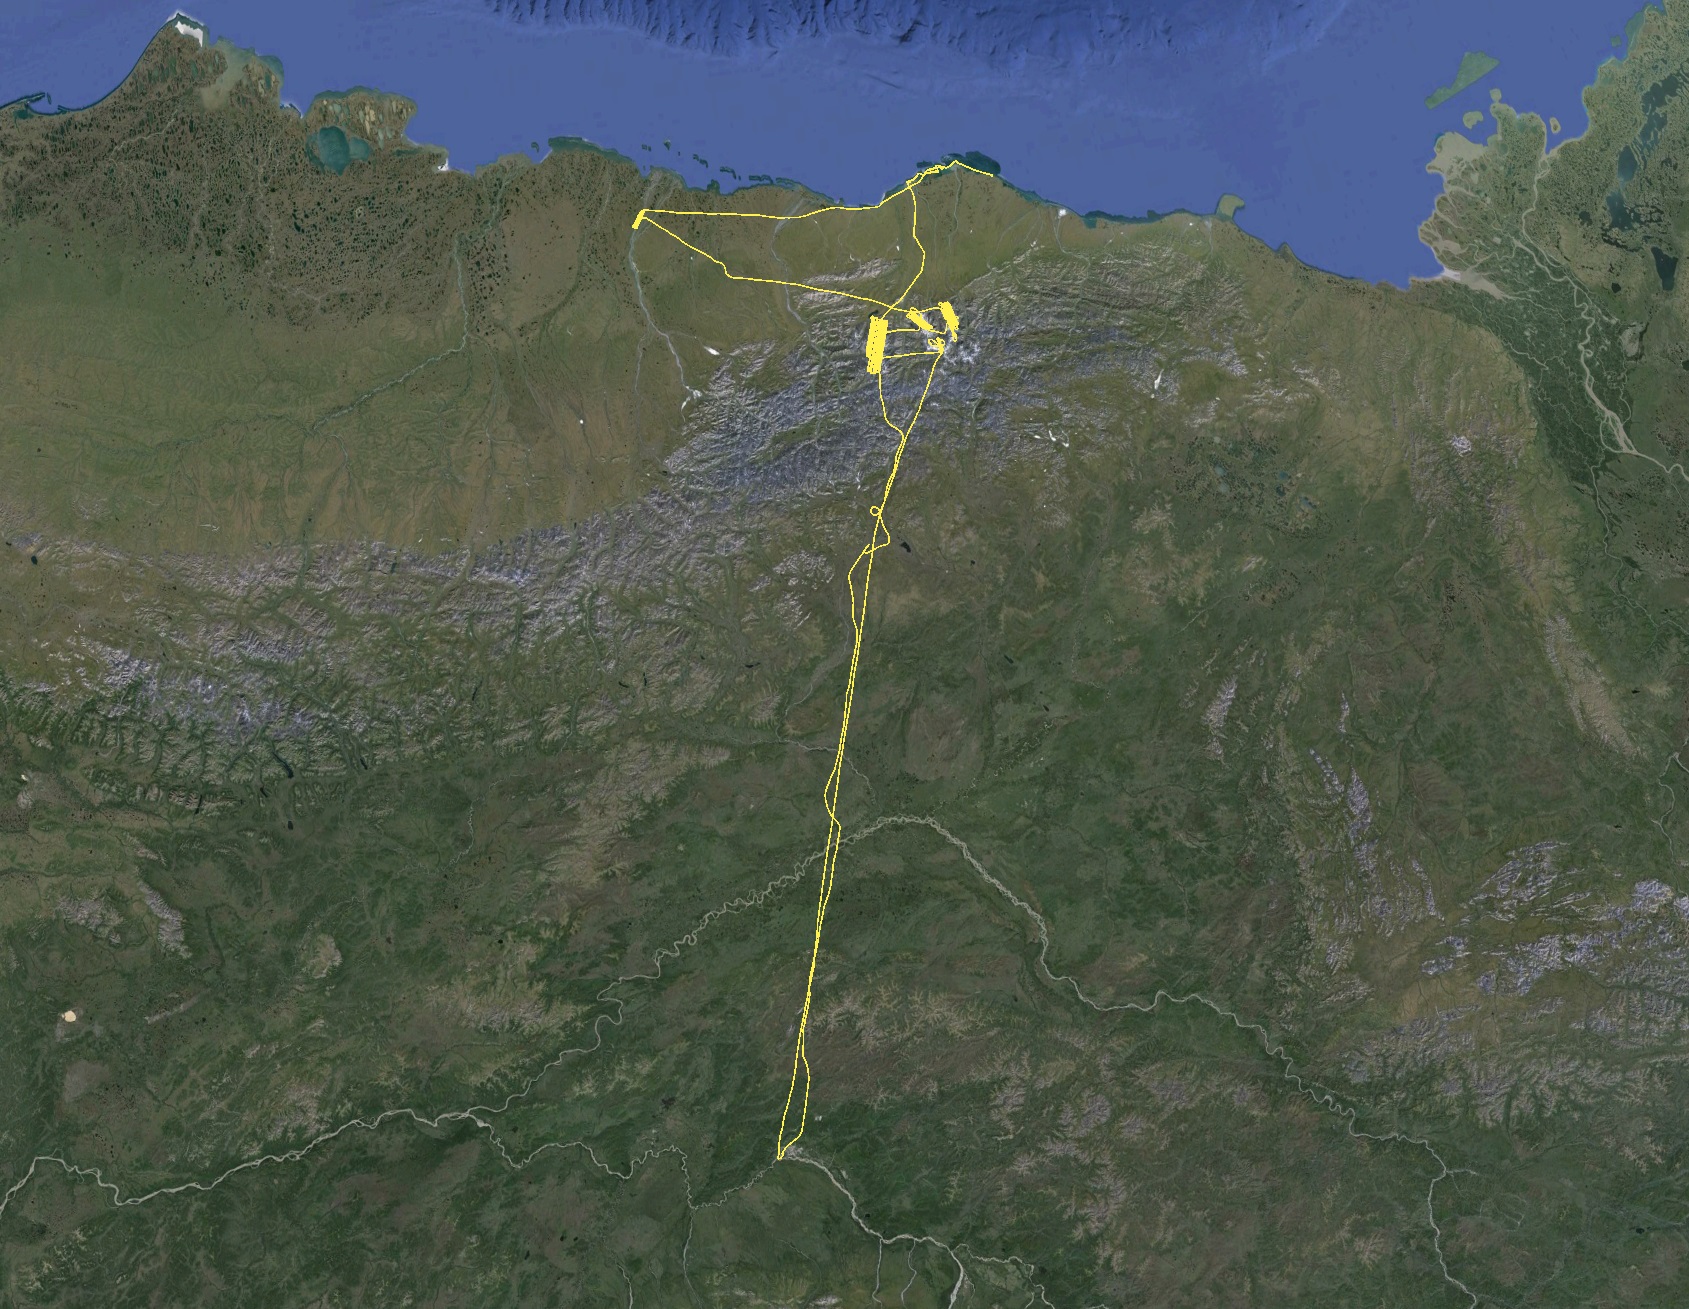
A closeup of my GPS track in Arctic Alaska over Google Earth imagery, showing the 7 projects I completed. The large block at bottom center is Peter’s Lake, with Esetuk Glacier, Mt Okpilak, and McCall Glacier in order to its right. North of them is the coast line near Barter Island, and at far left is a road construction project, all described below.
The first big project was to map the Peter’s Lake drainage. I did this once already in April. The project here is to understand the model hydrological cycle well enough to model it in the past, so as to better understand the paleoclimate clues we get from analyzing sediment cores from the bottom of the lake. My role in the project is to map changes in glacier melt and snow melt, so that we have a direct measurement of these things to use in validating models of it. I had previously mapped this area with lidar in 2008 and 2011, as part of my studies of all glaciers in the eastern Brooks Range and our long-term field project on McCall Glacier. The current project piggy-backs on all that research, including my weather stations on McCall Glacier over the past 13 years. In terms of glaciers, the general idea is to model glacier melt during the period in which we know the right answer, and then use this model to predict glacier meltwater inputs to the lake in the past. Then, combining this with snow melt and rain, we will have a sense of where the water feeding the lake comes from. By measuring sediment transport into the lake today, our goal is to match sediment inputs with water inputs to build a relationship between them that will allow us to determine where the sediments in our cores came from in the past, as this will tell us something about whether it was rainier or drier, hotter or colder, etc over the past hundreds of years. Fairbanks Fodar was hired by the National Science Foundation to make three of these maps this year, for direct measurements of glacier melt and snow melt within the entire watershed, something that I dont think has ever been done before. That is, the normal approach is to make a few measurements along transects and extrapolate to the entire watershed. The general idea was to make one map at the end of winter, the next during mid-summer, and the last at the end of summer. This was the mid-summer map and it turned out to be perfectly timed, with the mountains largely snow-free and the glaciers about half snow-free. Having snow on the glaciers is important because we want to understand whether our glacier melt-modeling is capturing the timing of snow melt well enough, and now we have the perfect validation data (again, I’m not sure this has ever happened before, but its certainly uncommon).
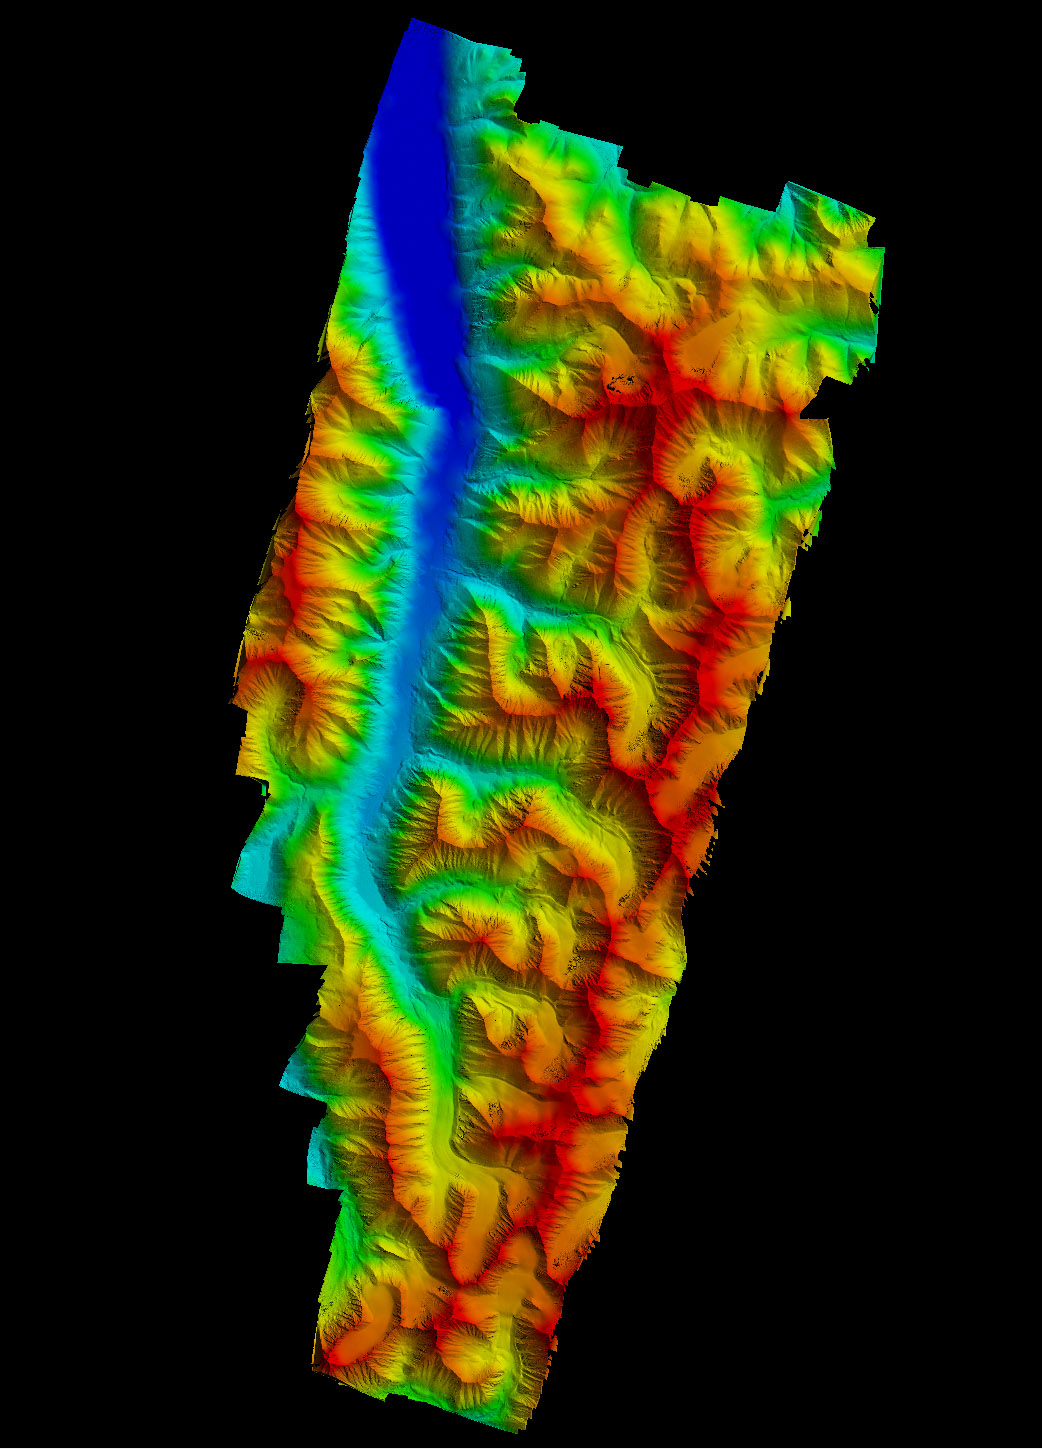
Here is the topographic map I made of the Peter’s lake watershed in April. Mouse-over to see the associated image.
Here is a difference image, created by subtracting my map from one I made with lidar in 2011. Note how the glaciers pop out — everything orange/red had no change in elevation (the mountains) but the blues, greens and yellows show how the glaciers have melted during this time (about 10-12 meters at their tips).
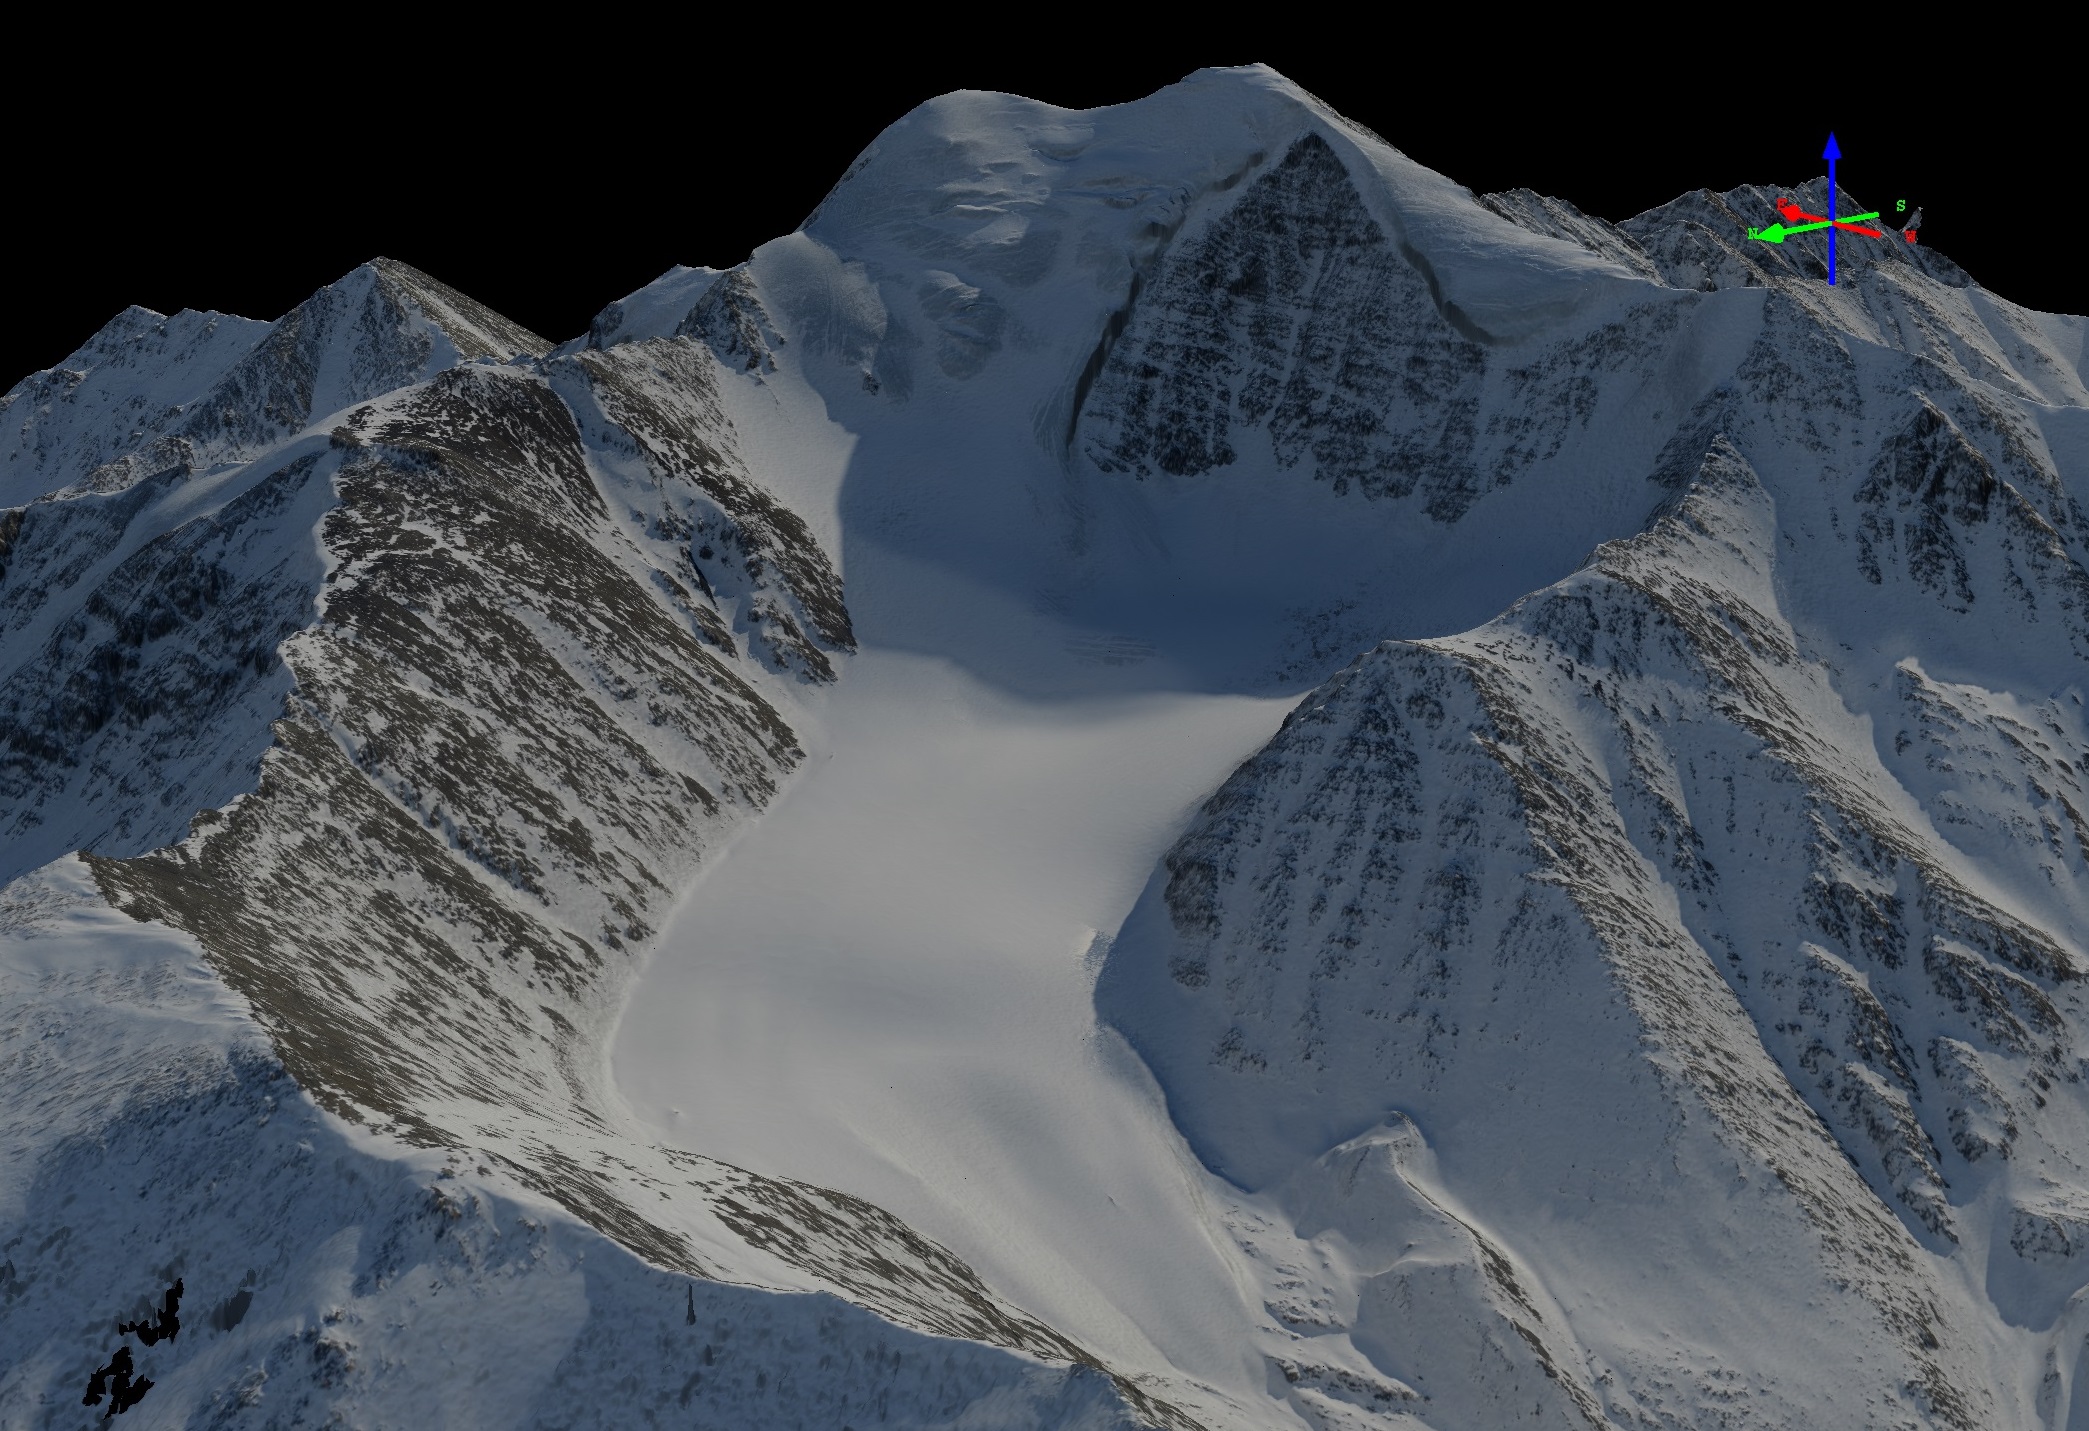
Here is Mt Chamberlin, one of the five tallest peaks in the Brooks Range, shown as 3D visualization of my data. This glacier is the main study glacier for this project.
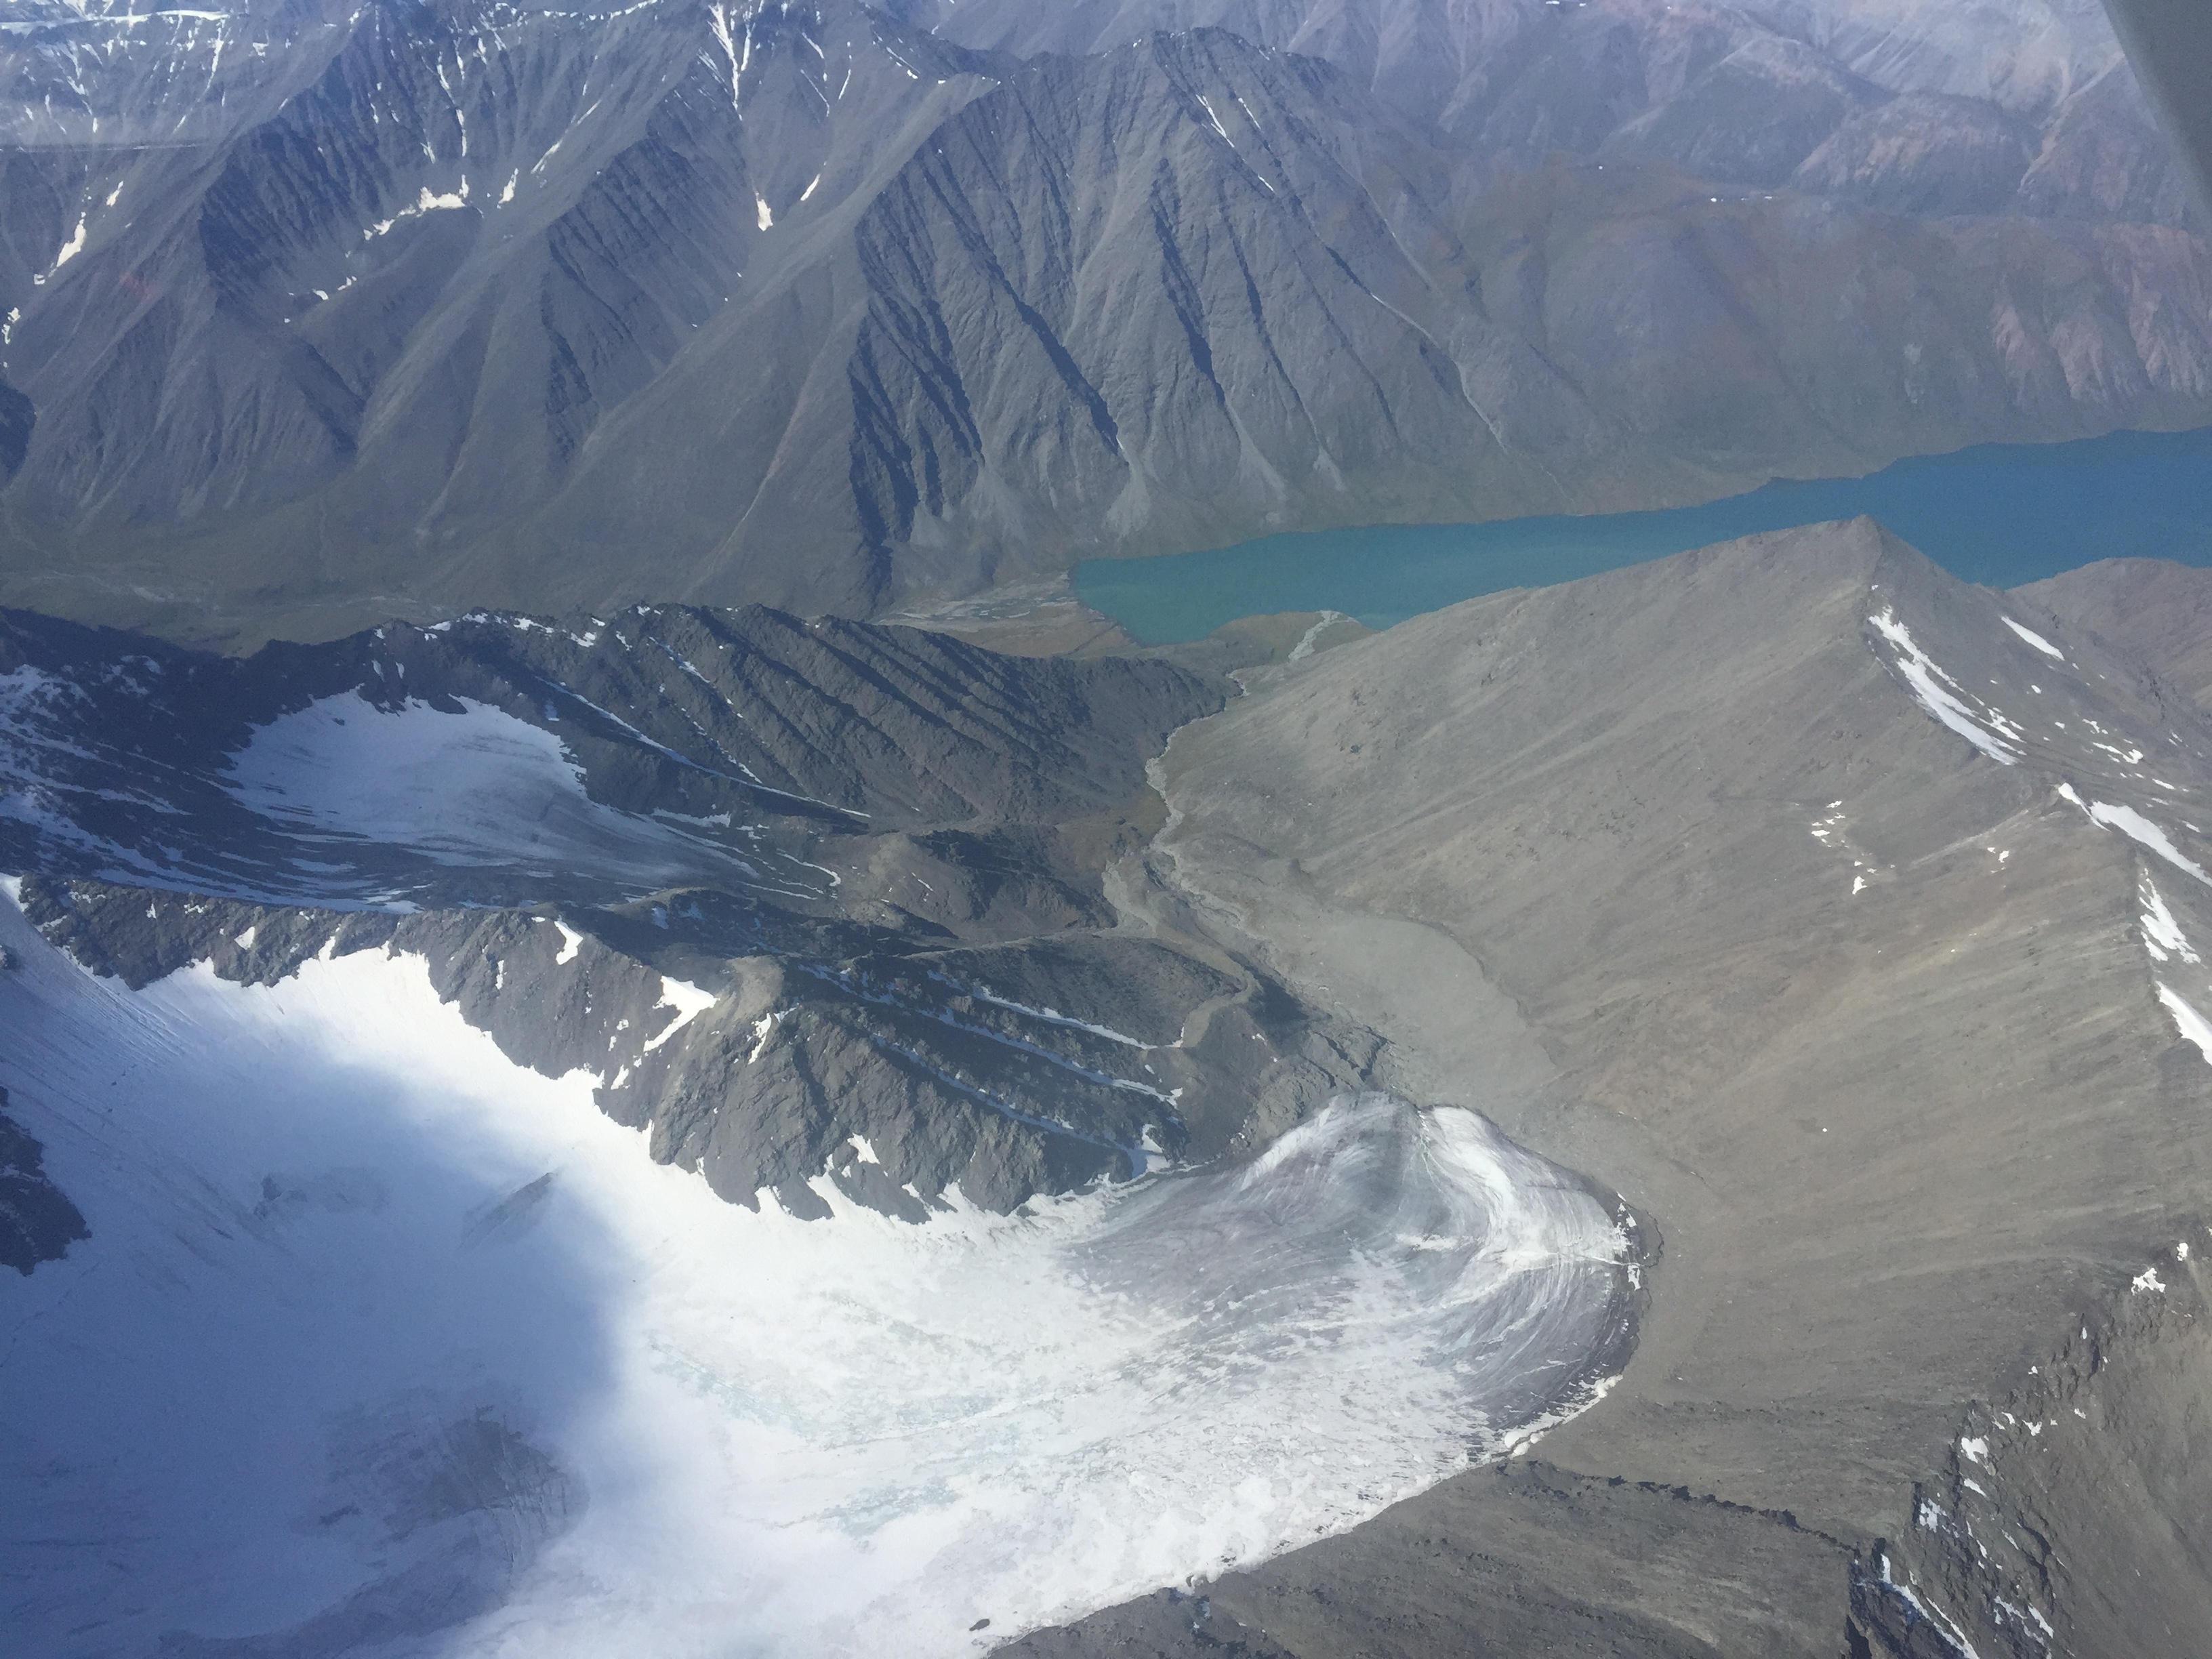
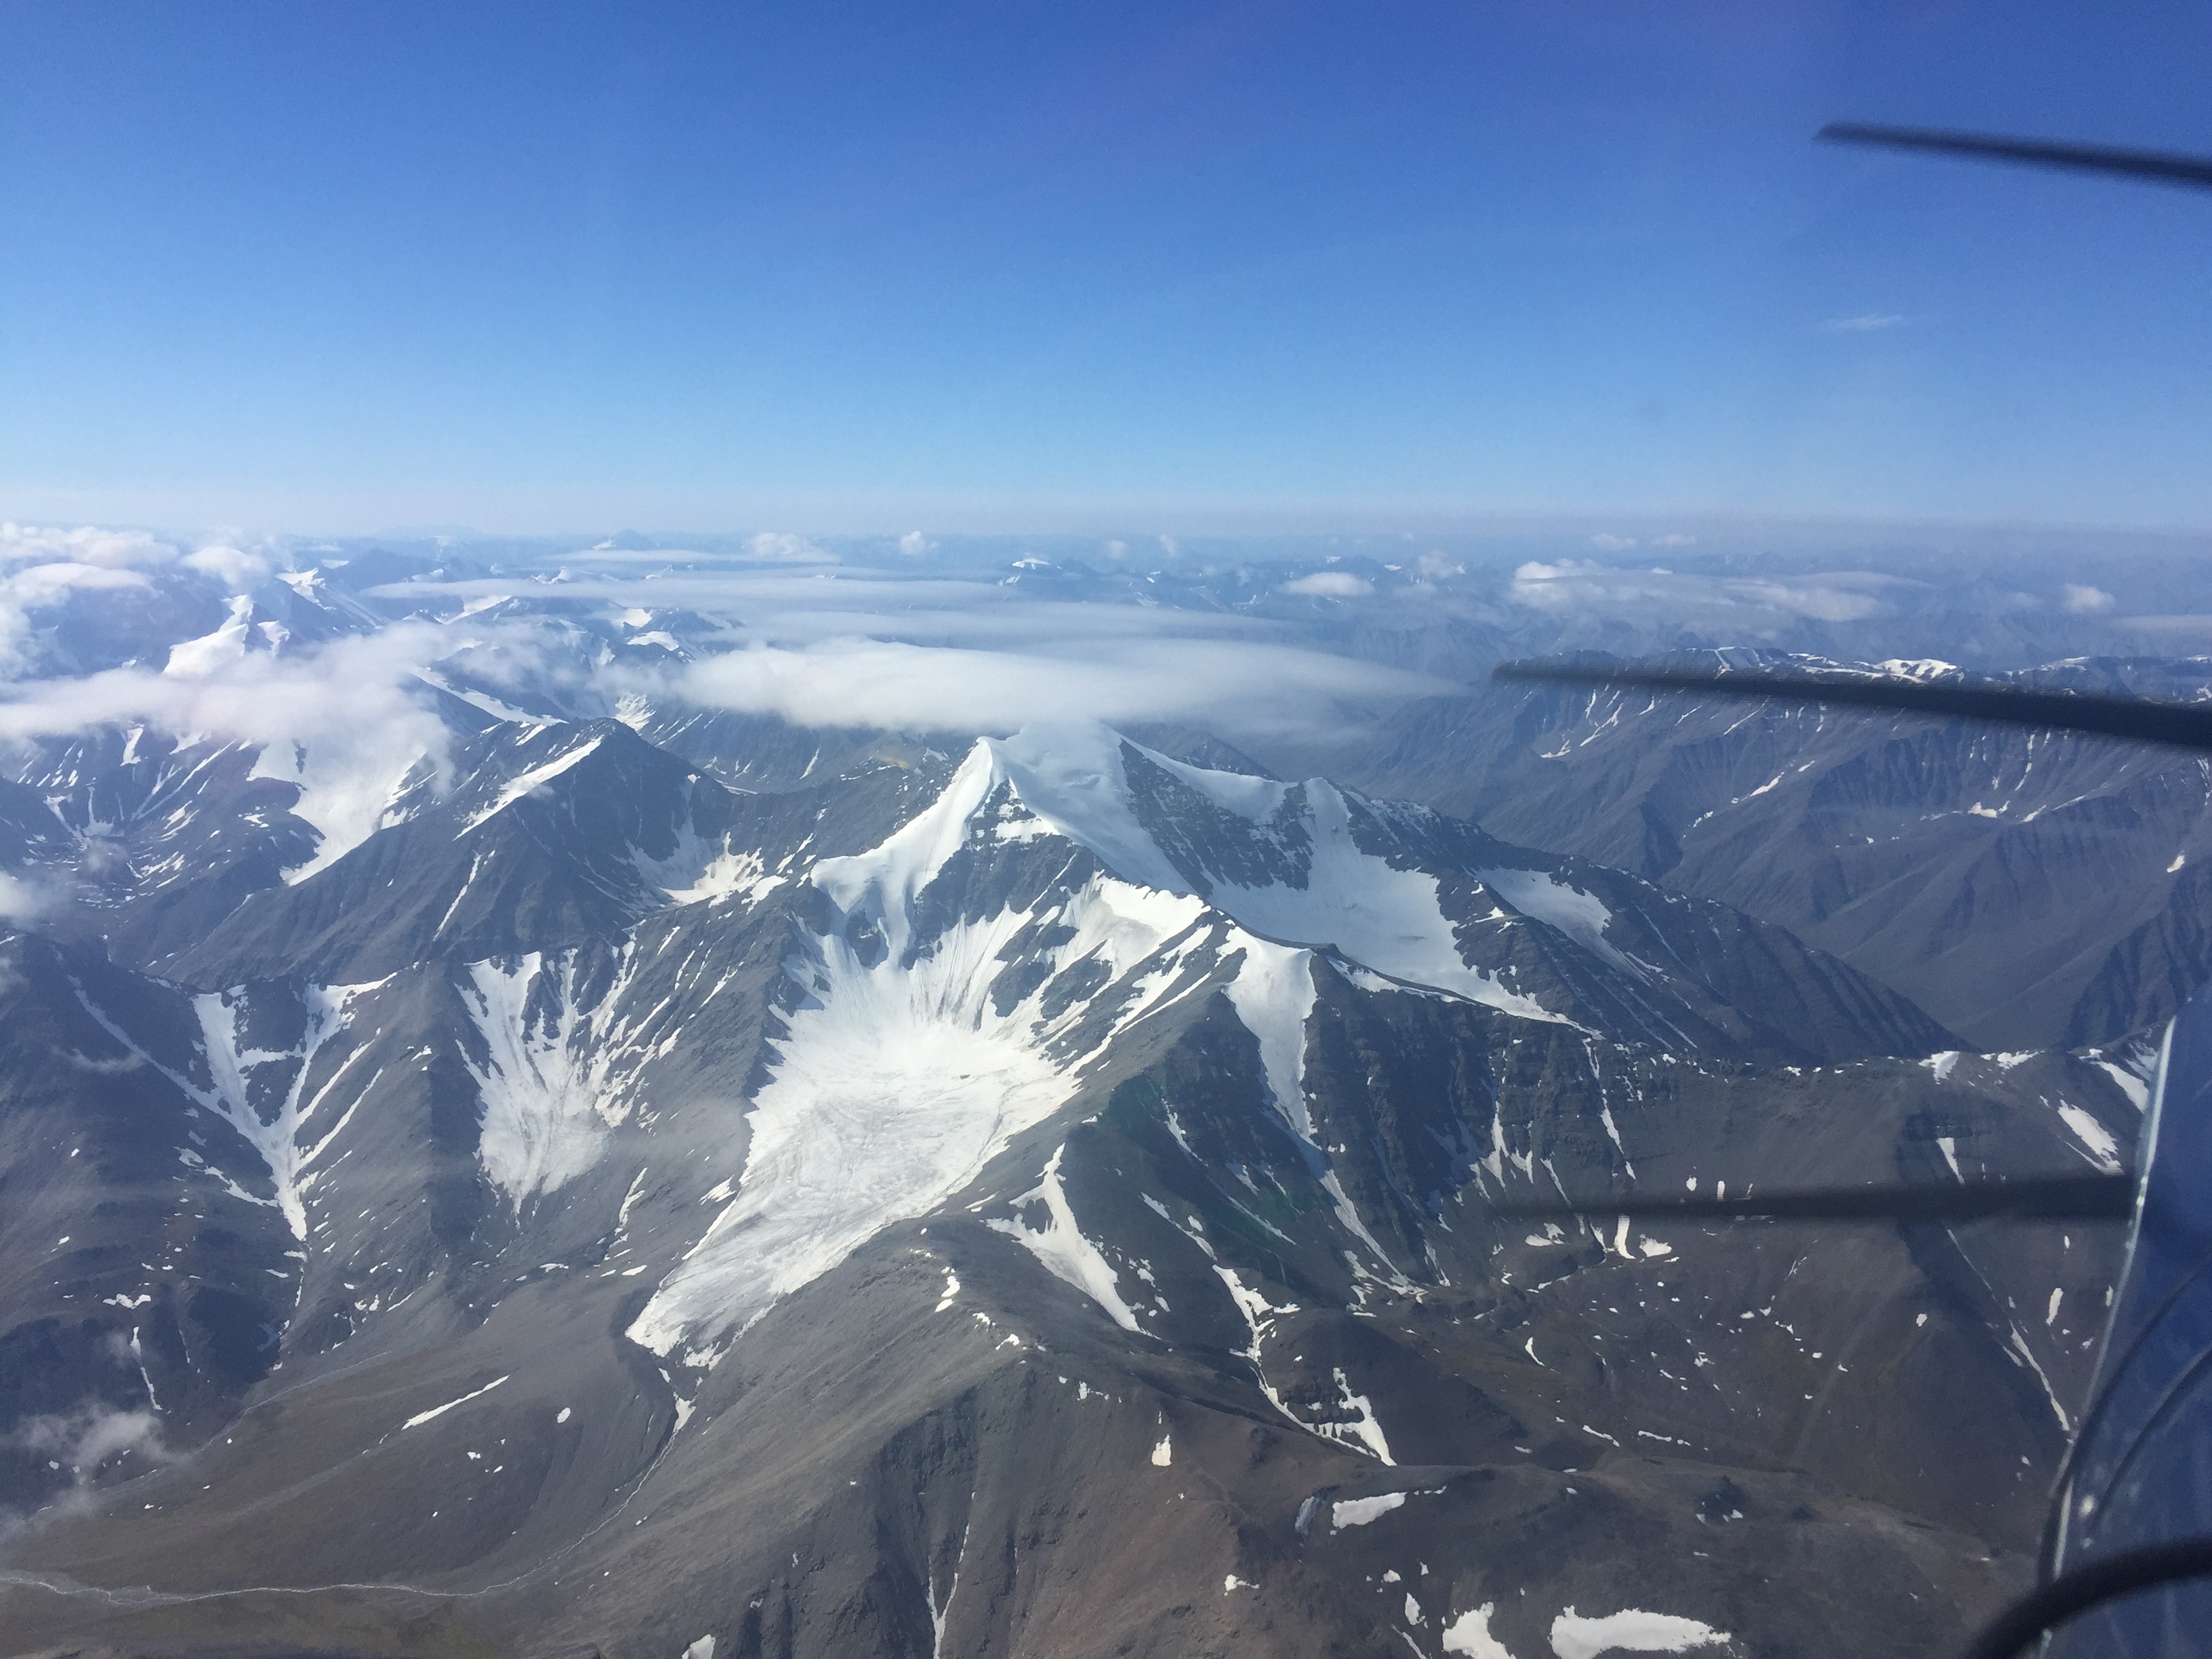
Here is Chamberlin Glacier yesterday, seen with about half its snow melted away, draining in to Peter’s Lake.
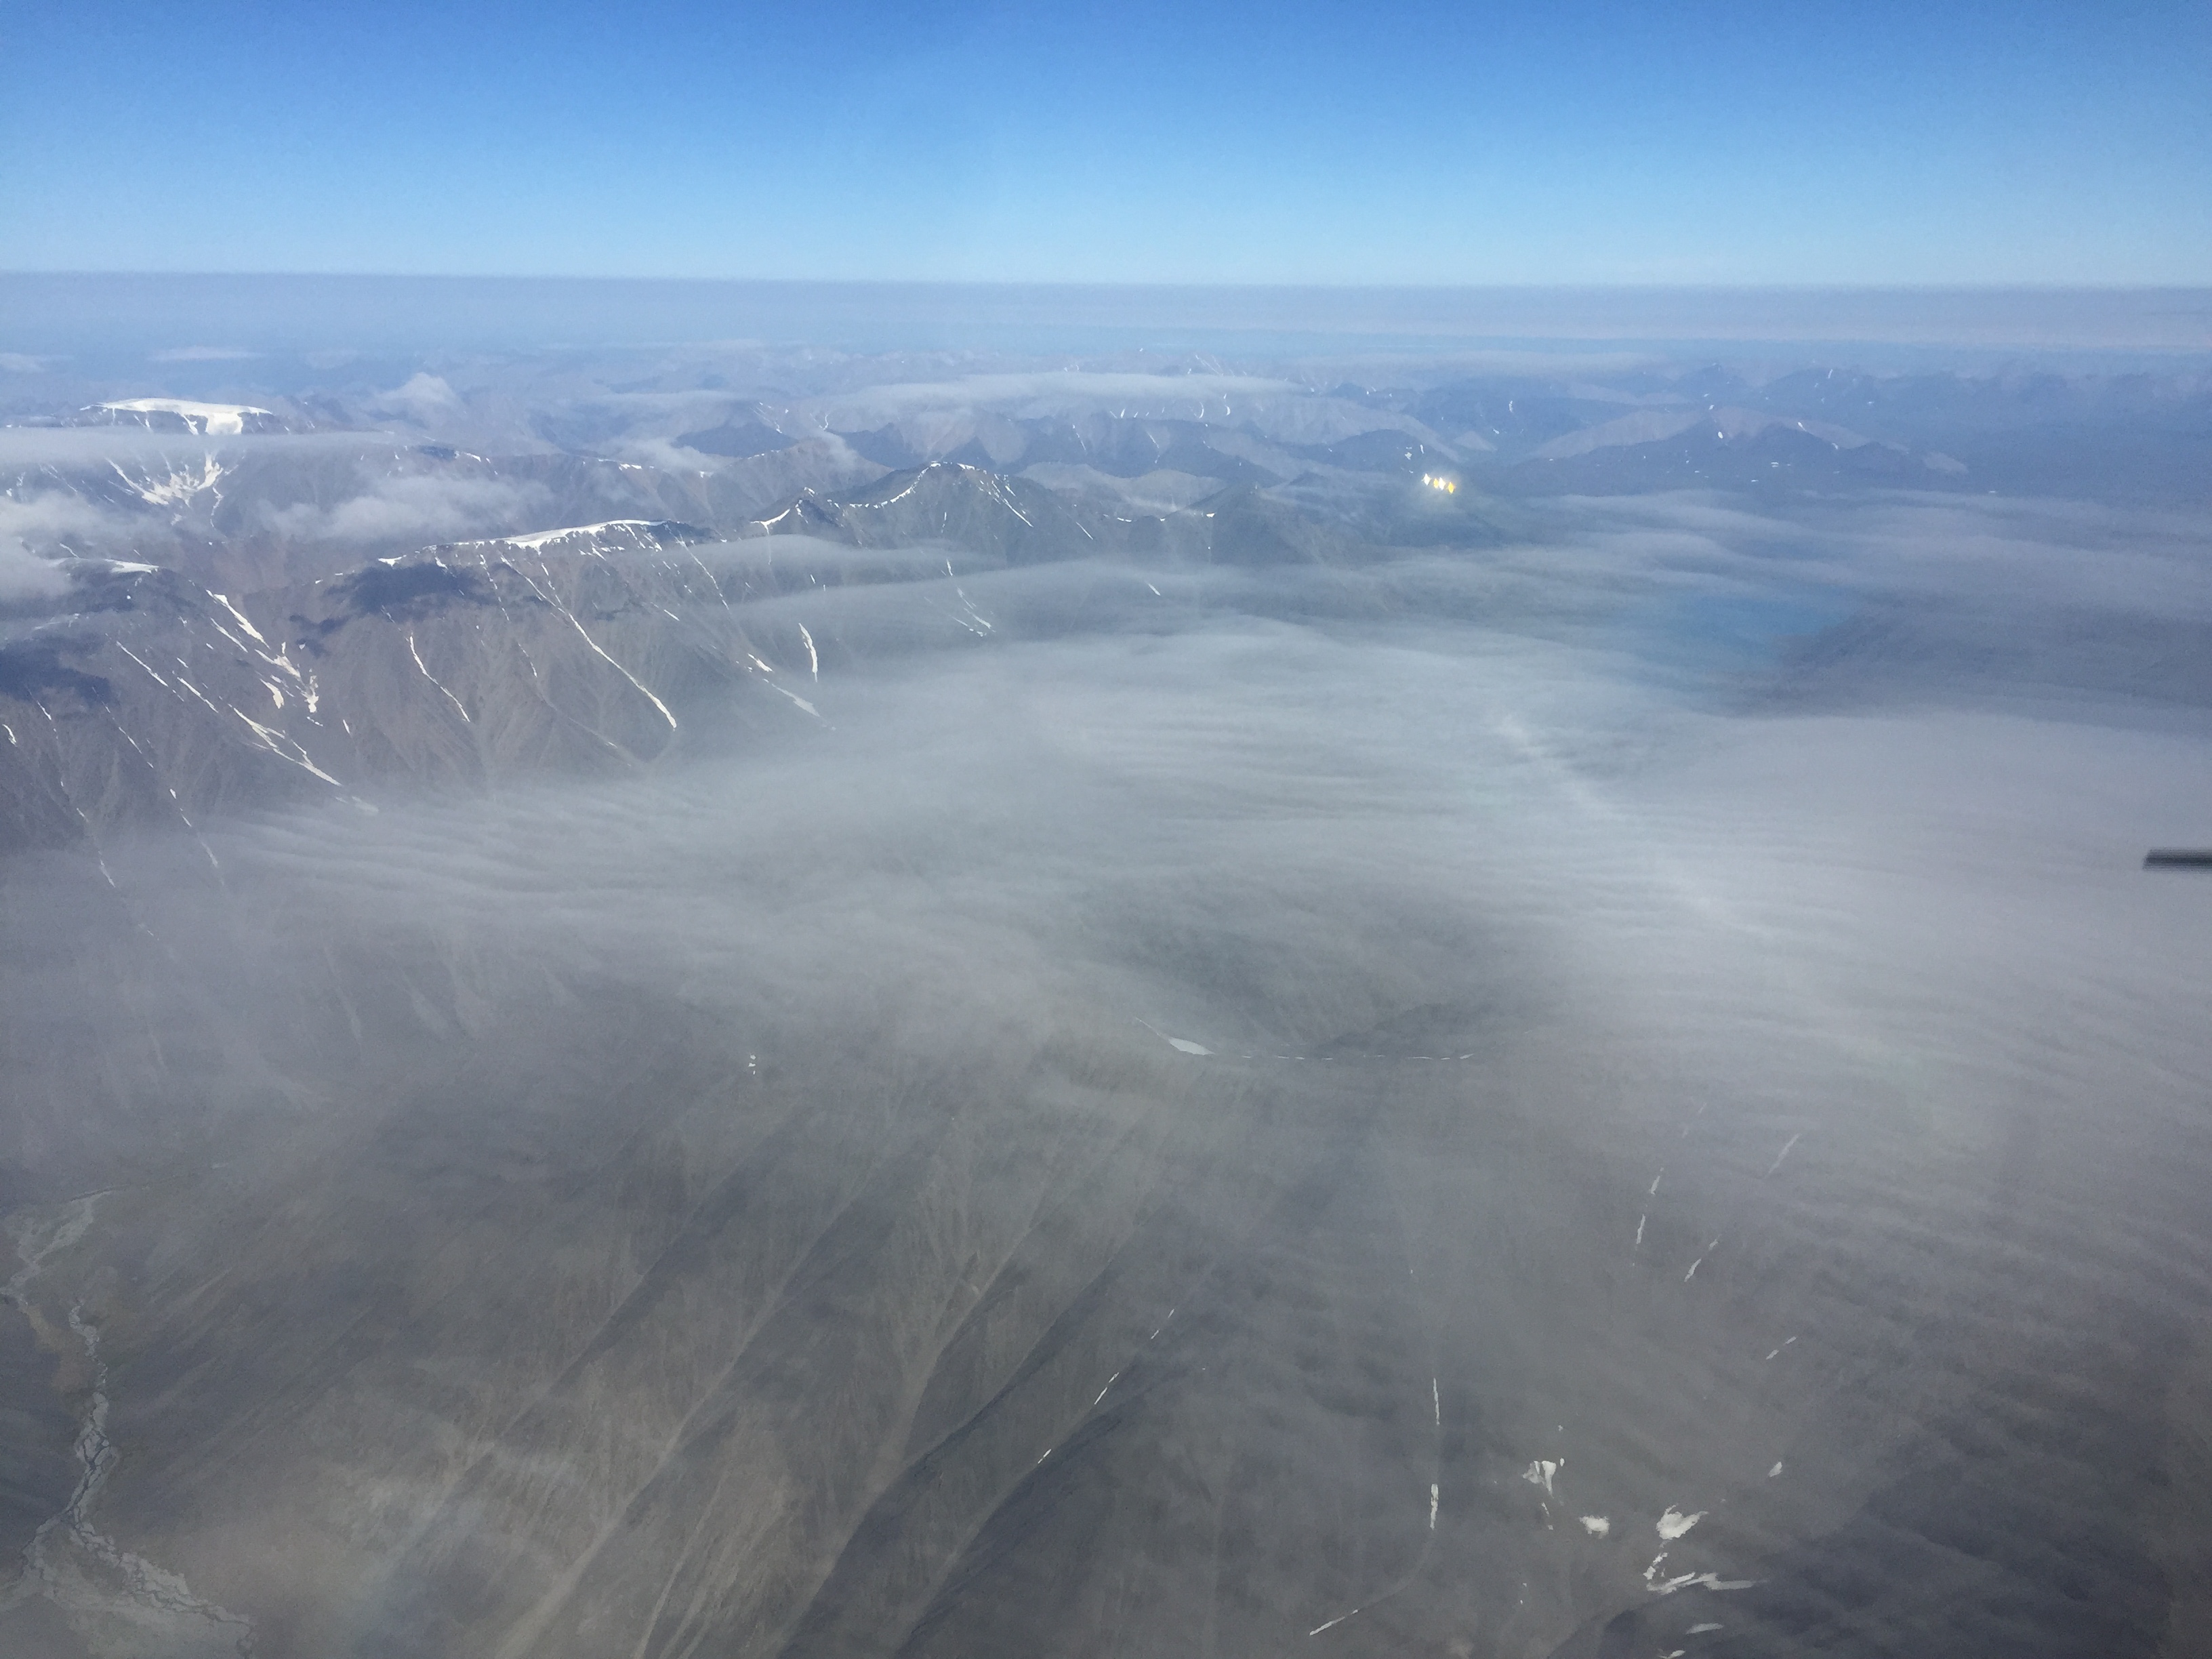
Just as I arrived, a thin cloud layer began to materialize beneath me.
By my next flight line, it had thickened into a solid layer. I continued on with lines anyway, as there was no telling when I could get back here and the west side of the study area remained largely cloud free. By the time I was done with all of the lines, these clouds had started to break up and I reflew those lines. I left Fairbanks about 6AM and arrived here about 9AM. I think as the sun came up and warmed the ground, a dew point was reached at that altitude, but as the sun continued to warm the ground, the air column warmed sufficiently to revaporize the liquid. So this project will be a pain to process, trying to pick and choose the best cloud-free images from each line, but it should work out in the end.
After completing the Lake Peter’s mapping, I headed to Kaktovik for some coastal mapping. Here I had two projects. First was to continue the time-series we started last summer on coastal erosion for the USGS. You can read more about that here. Second was a new pilot study to map eider duck habitats for the USFWS. Apparently they like to build their nests within driftwood piles, as this keeps them safer from predators. But the availability of driftwood may change over time, as dimishing sea ice changes the storm dynamics that piles the driftwood up (or more importantly removes it without warning). So the goal here was to see how well we could measure driftwood visually and topographically. Fortunately it was a beautiful day on the coast. While I was refueling from my new Turtle-Pac bladder, I got the chance to say hi to Susan and a few other locals. It was, unfortunately for me, 4th of July weekend there, and the festivities were still ongoing. As we recalled from our summer in Kaktovik in 2009, second day activities include target shooting on the beach. So after launching, I had to fly a bit higher over the beach thanI wanted, as 50 or so locals armed with local rifles watched me intently… Fortunately I think most of them knew that I was there helping them out and knew that I would I have to stayed for the fun if I had the time.
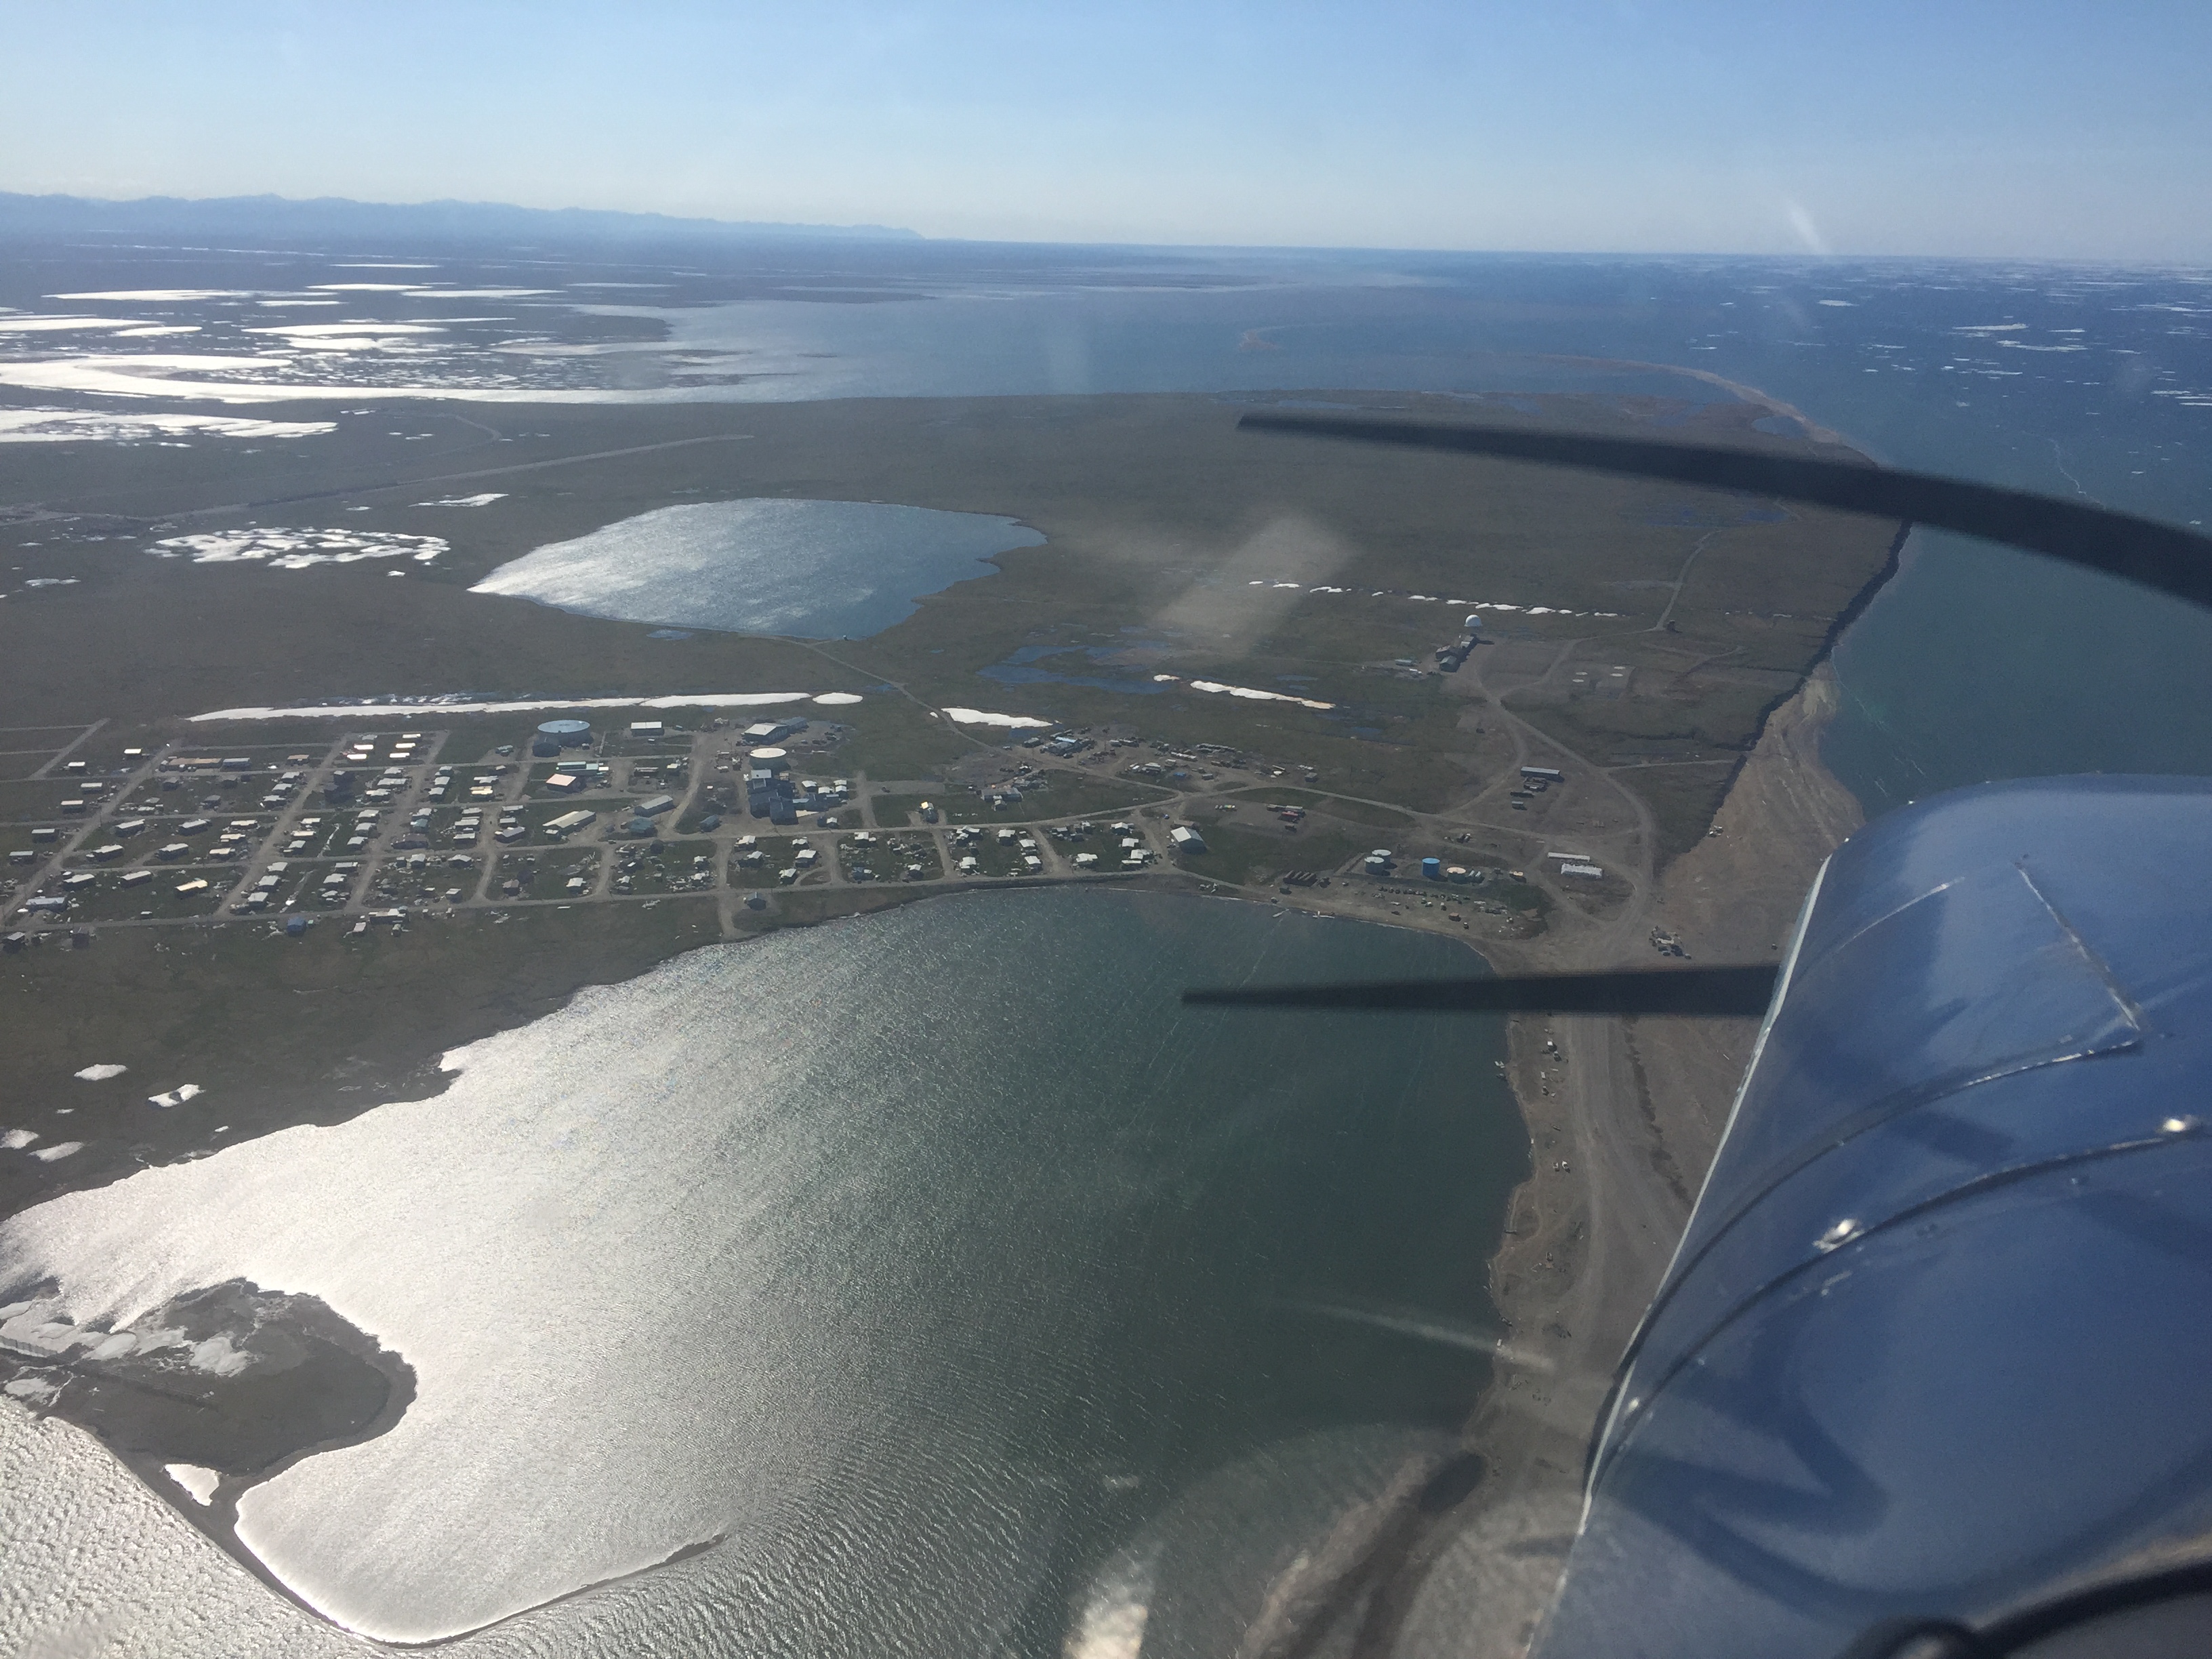
The Native Village of Kaktovik on Barter Island. That strip of coast in front of the prop is rapidly eroding away, and was the basis for this paper.
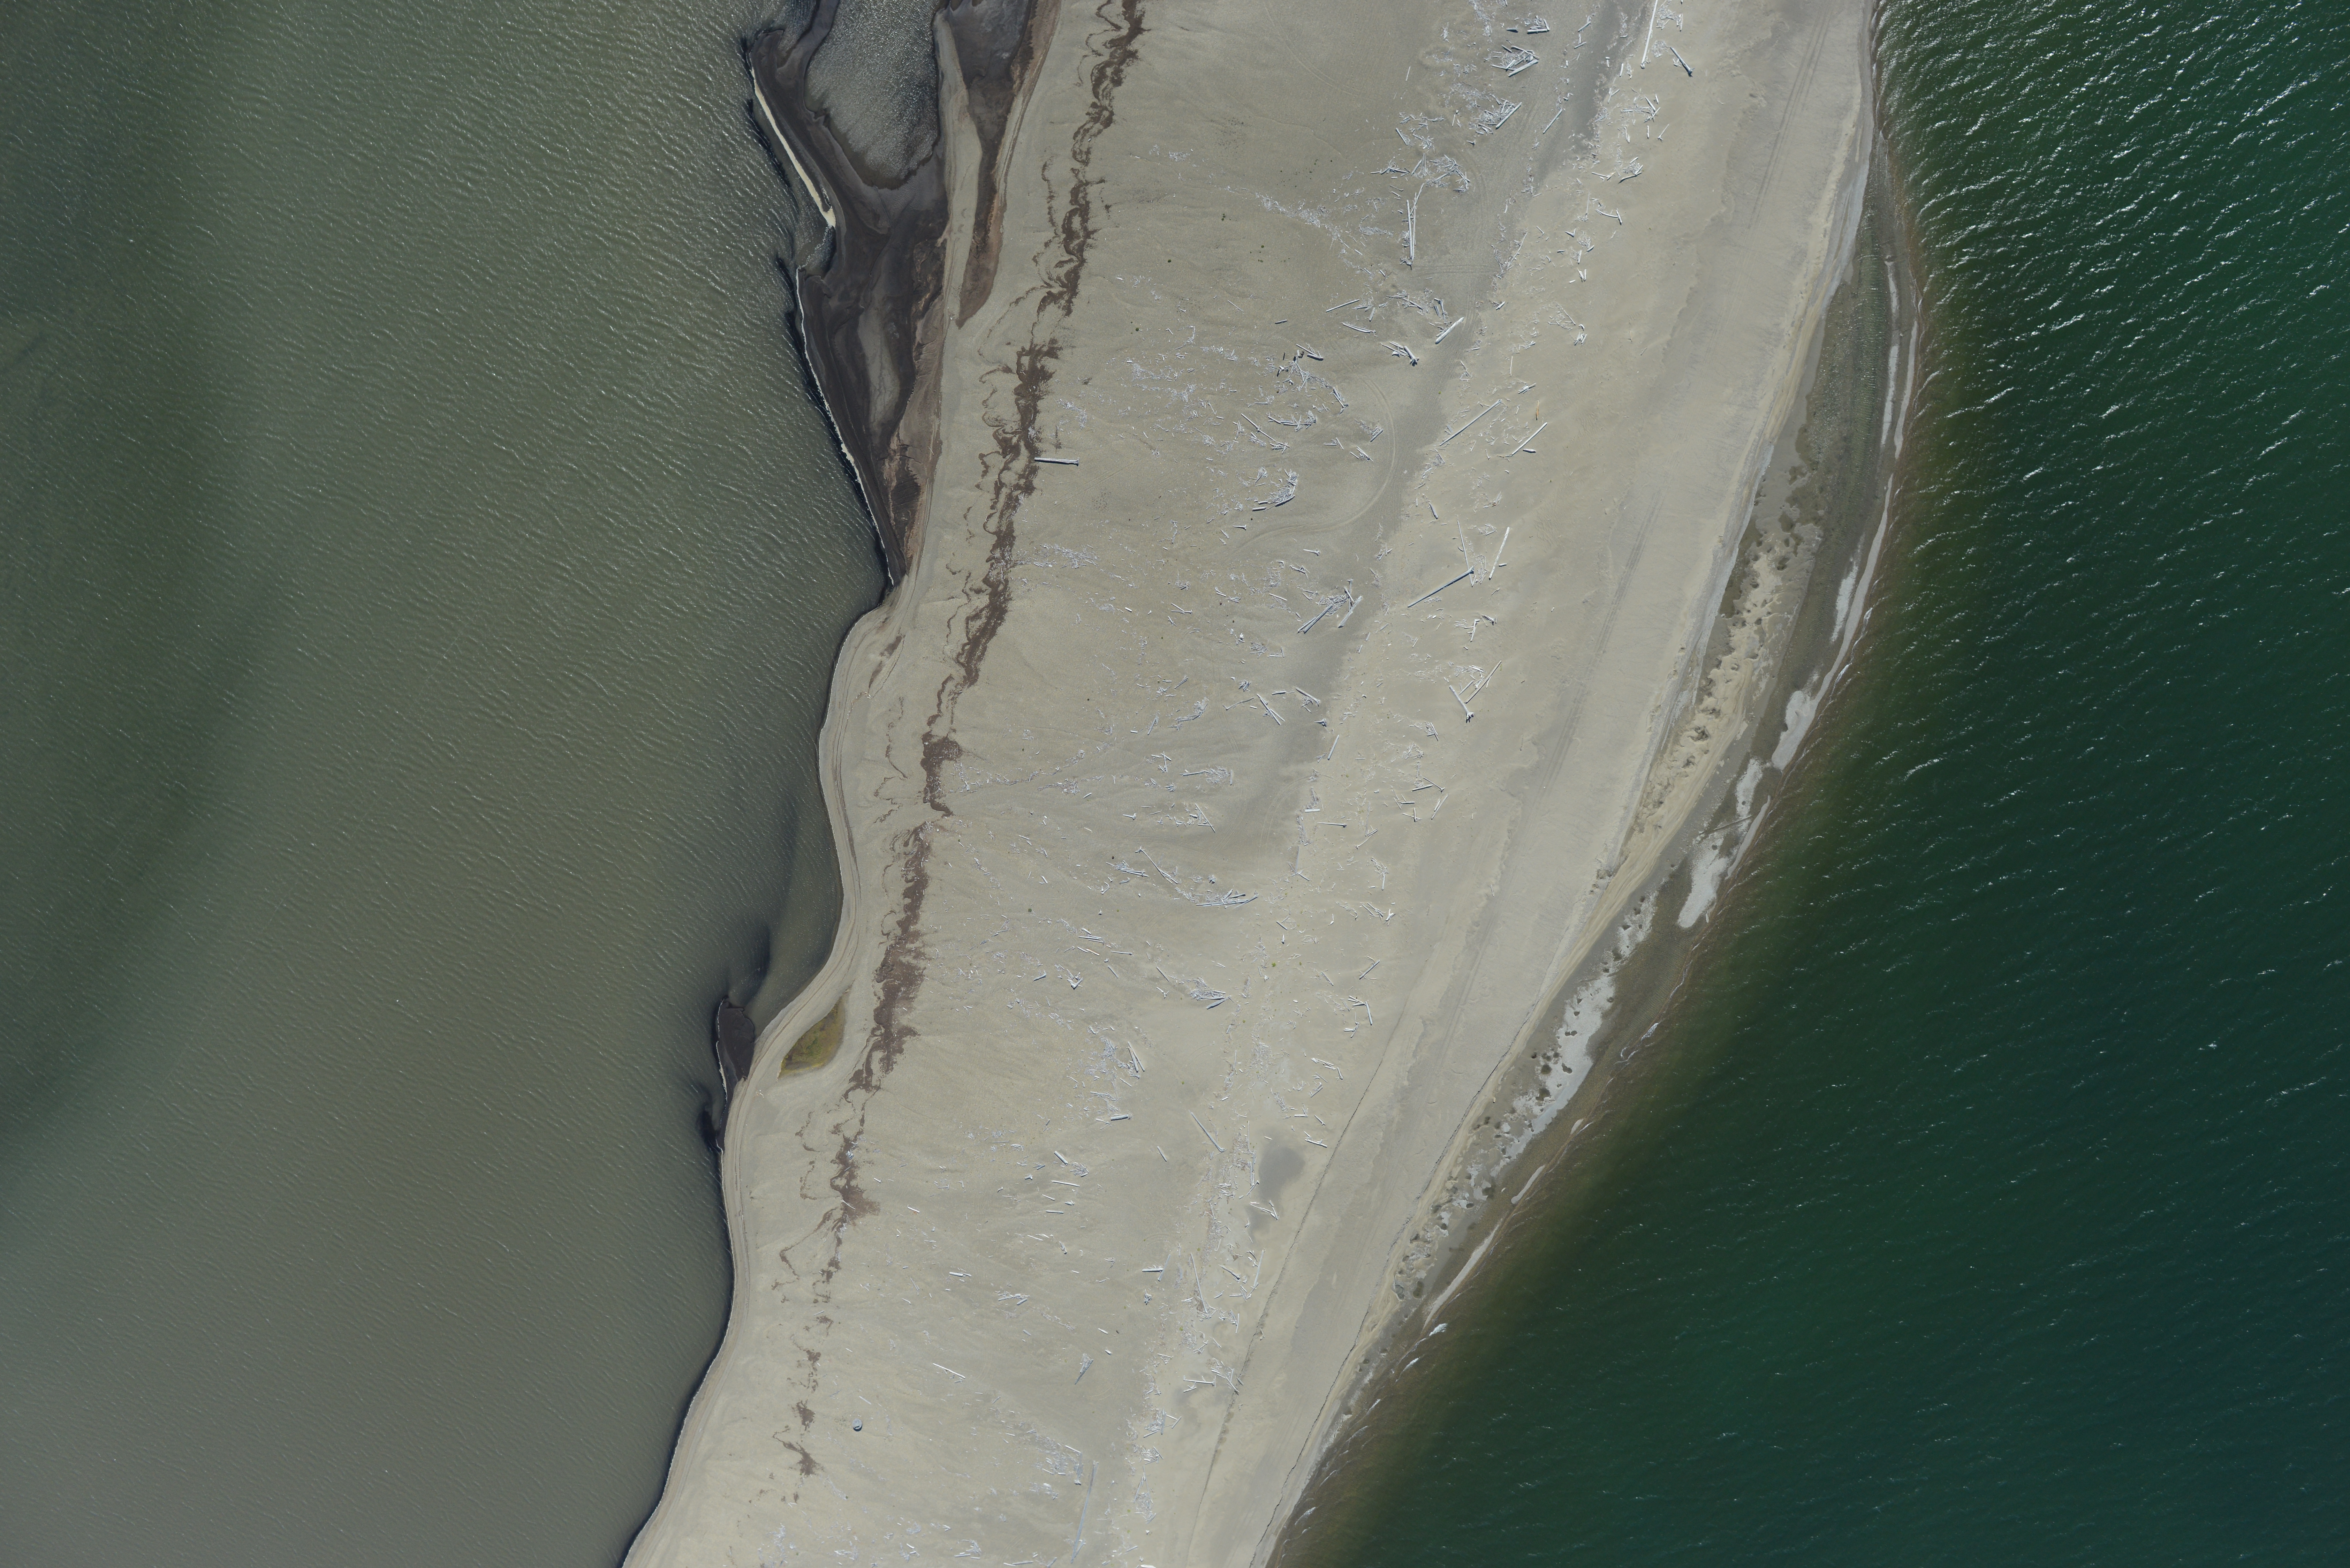
The mainland here is largely protected by long, thin barrier islands. Driftwood (from where?!) piles up here, and eider ducks apparently claim squatters rights. This pilot project was to determine how well we could resolve the individual pieces of driftwood so that we could assess habitat and habitat change remotely. Right-click on the image to download and see it at full resolution.
Given the excellent weather, I next headed over to Deadhorse for a small project along the haul road. Here we are studying the impacts of extracting gravel from the river bed to use in road maintenance. The materials for the roads here must come from somewhere, and the rivers are a convenient location. Any disturbance to the land takes hundreds of years to heal, but rivers are so dynamic that they heal almost instantly. The trouble is that healing can take the form of changing the course of the river which may then impact the road it helped to build, or in the meantime the biota that live in or depend on the river might not be so happy about the dynamics nature never intended. So this purpose of this project is to study the sediment dynamics of the Sag River along the ~100 mile stretch that parallels the road and is used for material extraction. Our maps over the coming years will provide before, during and after snapshots of how the river may have been affected by gravel extraction as well as help map permafrost and hydrological impacts on the road itself, for the Department of Transportation. The project yesterday was just quick one to capture a new materials site before any impacts occurred; the much larger study mapping the entire river begins in fall in coordination with other field work.

The big mud puddle in the foreground was only made in the past week, and forms a lagoon that gravel will be extracted from in the near future to support maintenance of the Dalton Highway and pipeline in the background. The idea is to keep the river out while this is going on, then let the river reclaim the area. This study is trying to understand the impacts of that reclamation. Deadhorse is only about 5 miles away from here, making flying the flight lines interesting.
So yesterday was a long day. Twelve hours of flying, four separate projects, and thousands of photos. The weather was forecast to stay good for another day, so I spent the night in Kavik, where I had the chance to catch up with Sue and learn a bit about geology from the USGS crew based there for the week.
As predicted, the next morning was stunning. Not a cloud in the sky and not a bump in the air. My goal today was to work on MY projects on the way home. The reason I developed fodar was to study changes to the landscape that were of interest to me. While all of the projects I do for others are certainly interesting and I learn a lot from them, they are not projects I would pay for out of my own pocket. Or in other words, the other projects are currently what fund the research that I’m personally interested in. In this case, my projects were mapping McCall and Esetuk Glaciers as part of my long-term research there and determining which is the tallest peak in the Brooks Range and what the order was for the Big Five there.
Having switched to my cruise prop for speed and not yet switched to tundra tires, I was a little hesitant to leave Kavik’s gravel strip at gross weight, so I only filled the wings with fuel, not taking any extra in the cabin. I knew this might mean not quite as much flying as I hoped, but I also knew I could get more fuel in Ft Yukon if I needed to, if the smoke wasnt too thick to land there… In any case, by the time I reached the mountains from Kavik, I was up at 11,000′ feet. The air was glass smooth, though there was a 20 mph wind from the north. My first target was McCall Glacier. I had planned lines that would give me the minimum coverage for the glacier, but it was such a nice day I added lines on either side to get the surrounding glaciers too. Glaciers near McCall sprawl out in every direction, so that complex of ice makes a nice study of the impact of solar aspect and shading on glacier melt and dynamics. McCall Glacier also descends from one of the Big Five. Unfortunately, until today I had never been able to make a good map of it, and it was the last one on my list. Every time I had been out here in the past, the weather was just not conducive to getting a good acquisition of Mt Hubley, either the clouds were too low, the turbulence too strong over the peak, or something, and I was able to create decent map but not an excellent one. But this time I got it. While I was at it, I extended some of my lines to the south and picked up Mt Isto, another of the Big Five.
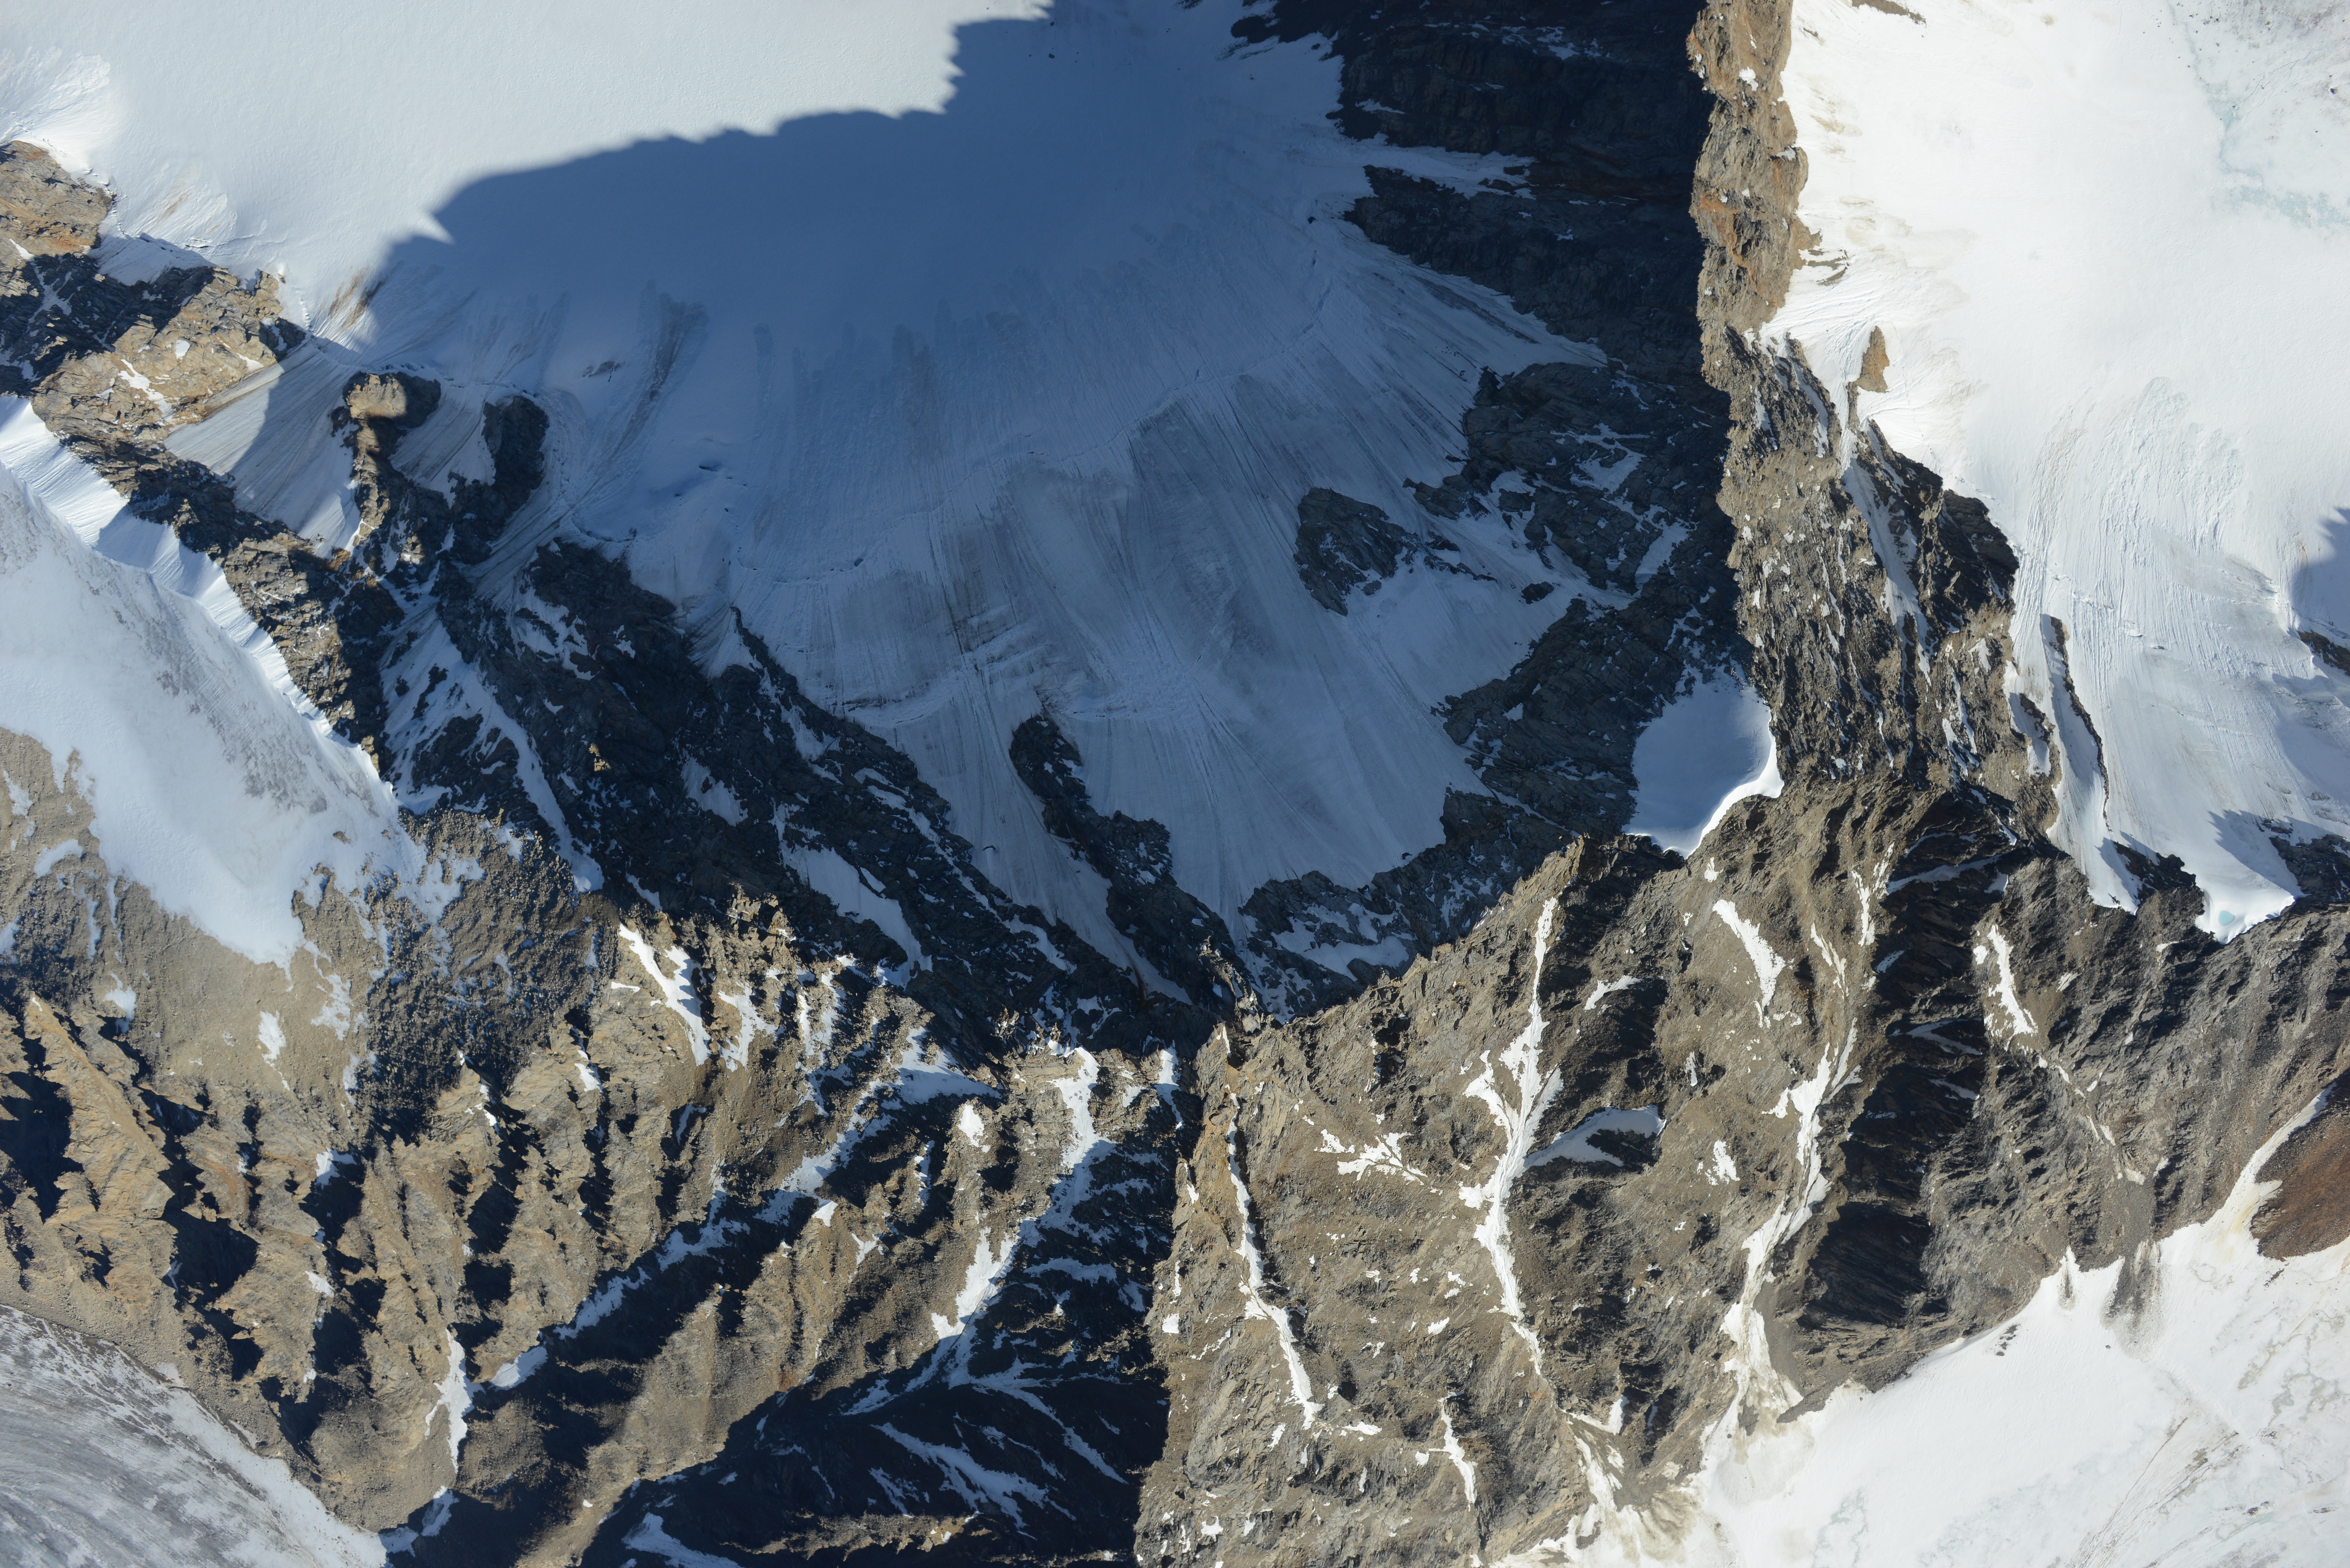
Mt Hubley, as seen from above. That’s McCall Glacier on the upper side of it.
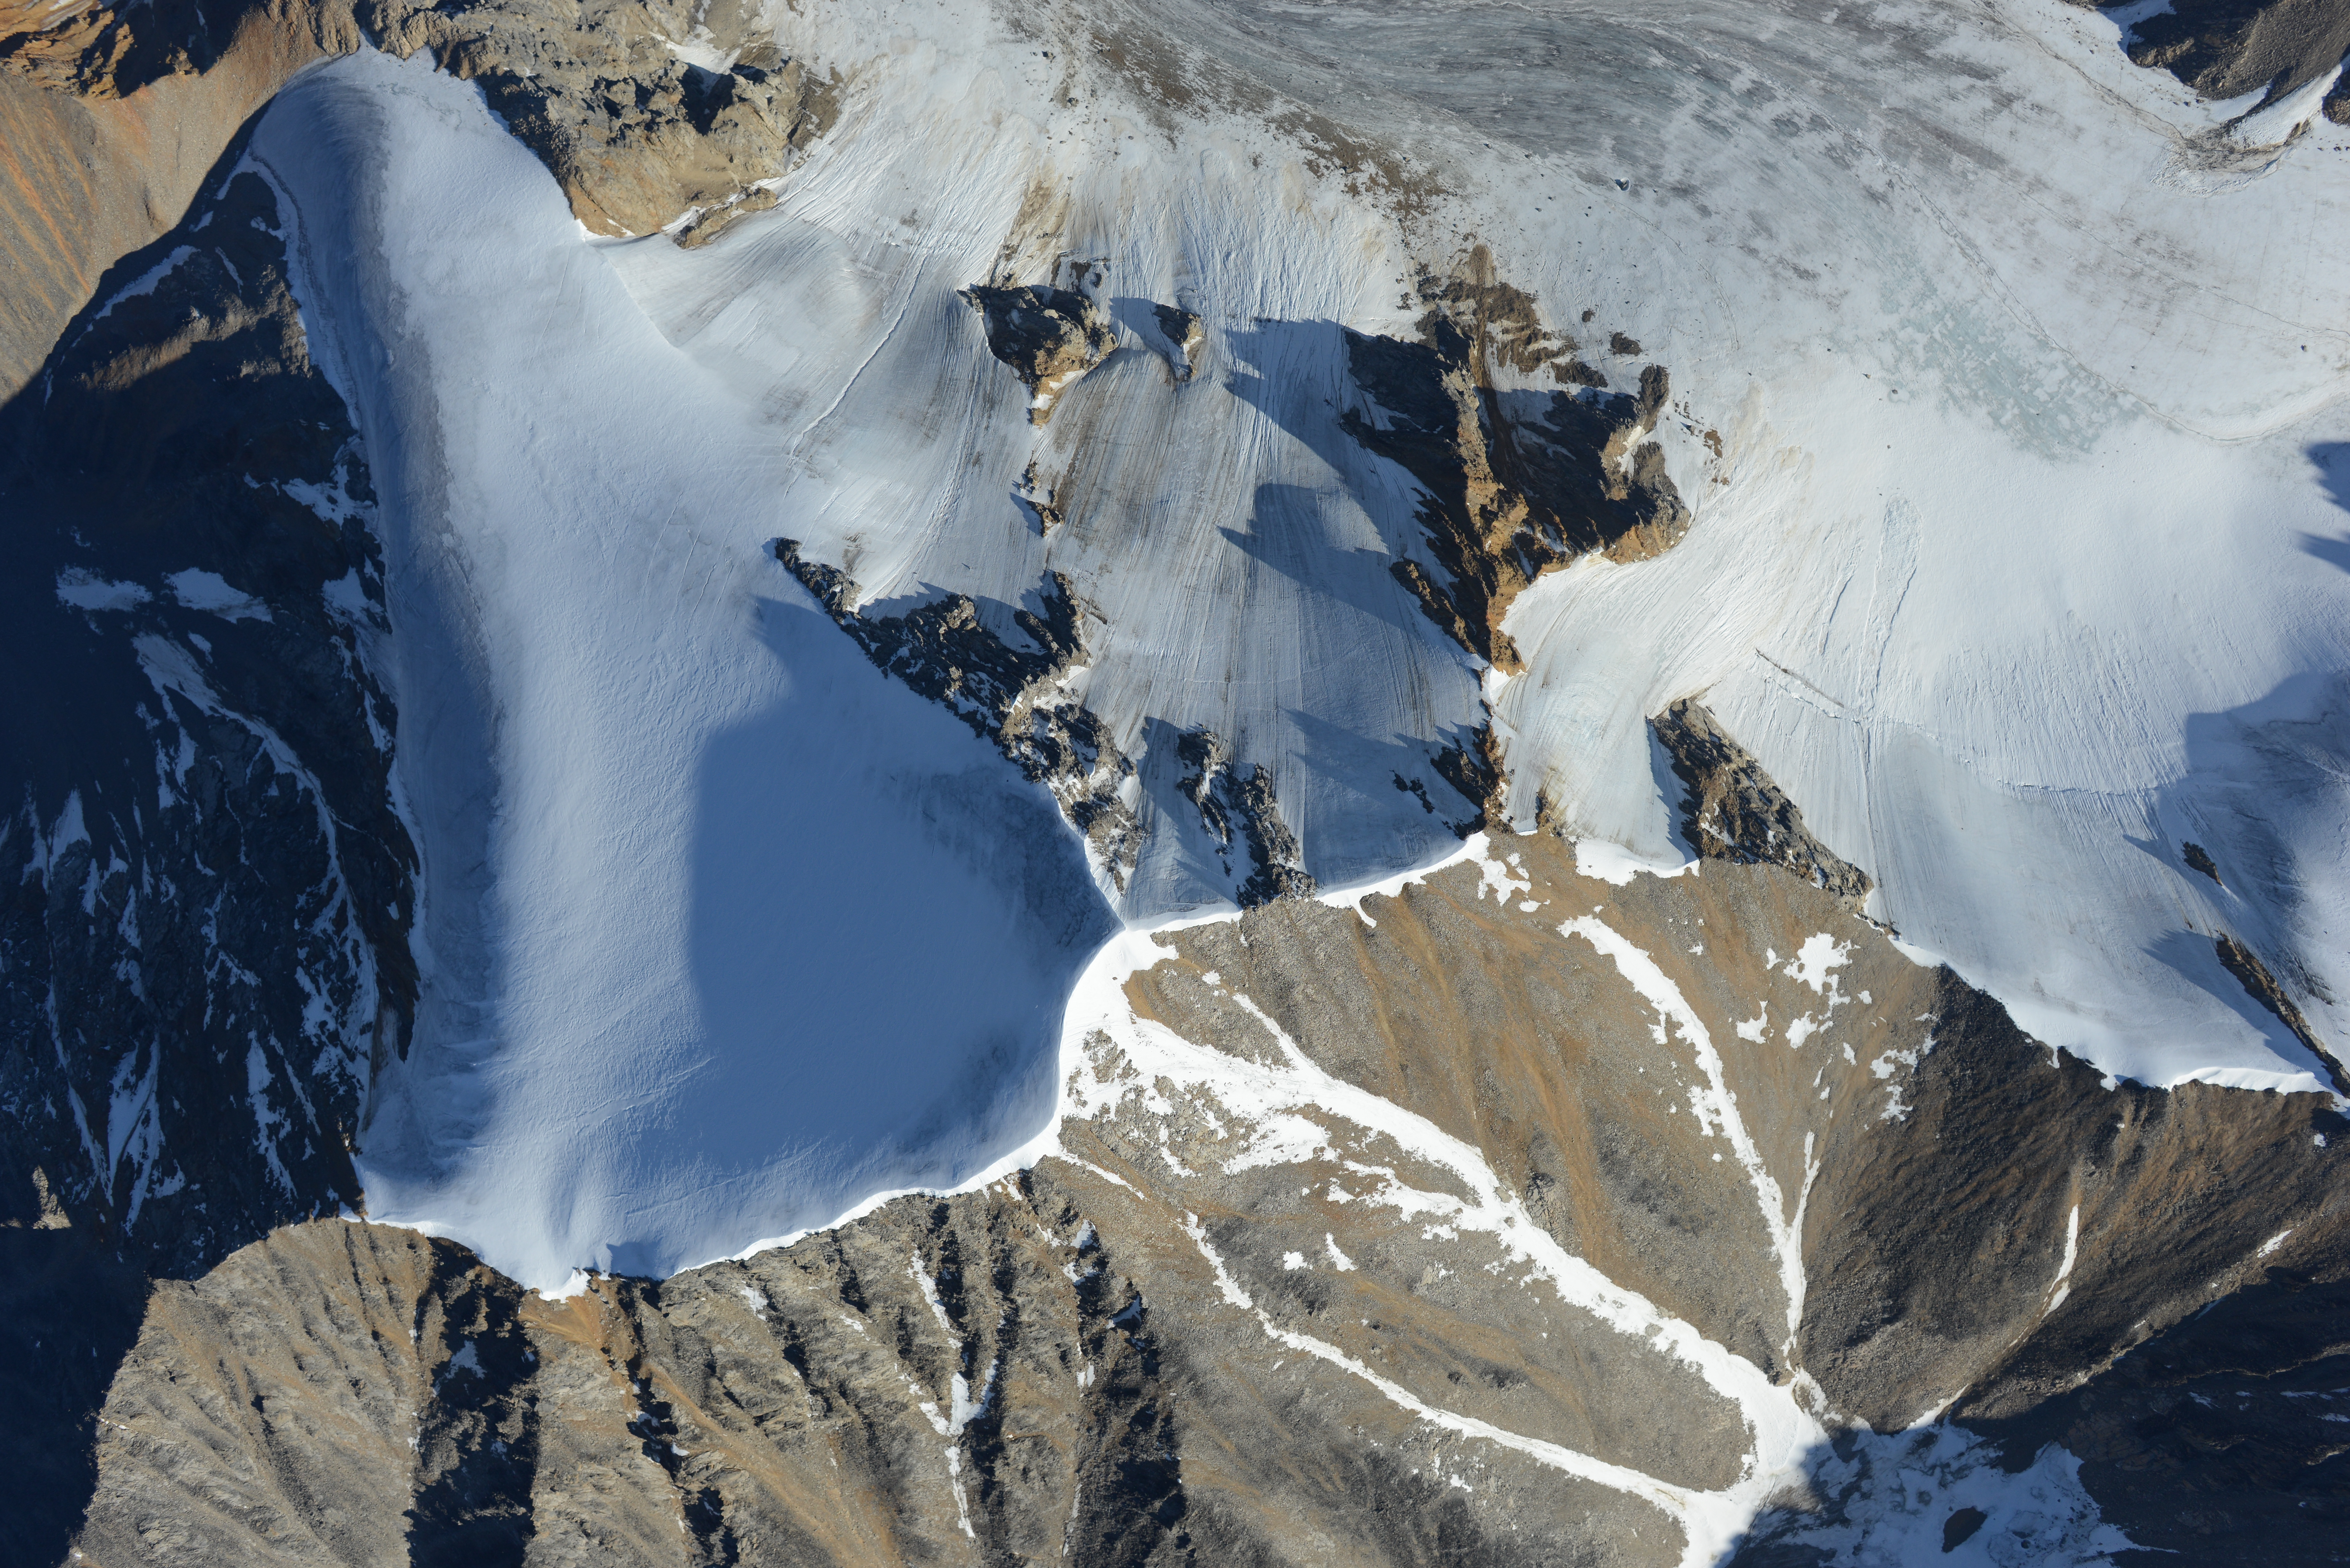
Mt Isto, as seen from above. We measured the tippity-top of it with GPS last year.
Next it was time for Esetuk Glacier and its neighbors. The weather remained stellar, and at 11,000′ I was sipping fuel, and it was only 8AM, so I added some lines here as well. Esetuk Glacier descends from another of the tallest peaks, Mt Michelson.
By this time, fuel was getting to be a concern. If I was sure that I could land in Ft Yukon, I would likely have stayed out there another hour or two, but given that a slight change in wind can cause it to go from sunny skies to unlandable, I thought I would hedge my bets by picking up a few more lines and heading back to Fairbanks with what I hoped was just enough fuel. So I flew over Mt Chamberlin once more and repeated one of the lines from yesterday that had a few clouds. With the wind from the north yesterday, the clouds were forming in the lee of Chamberlin, obscuring the peak a bit. So now I had 4 out of the Big Five for sure. With another 20 gallons of gas, I would have repeated the whole watershed to make a nice repeat-accuracy study, but as it was I think it was more than enough to make a great map there. Last on my personal to-do list was Mt Okpilak, an unnamed peak near Okpilak Glacier.
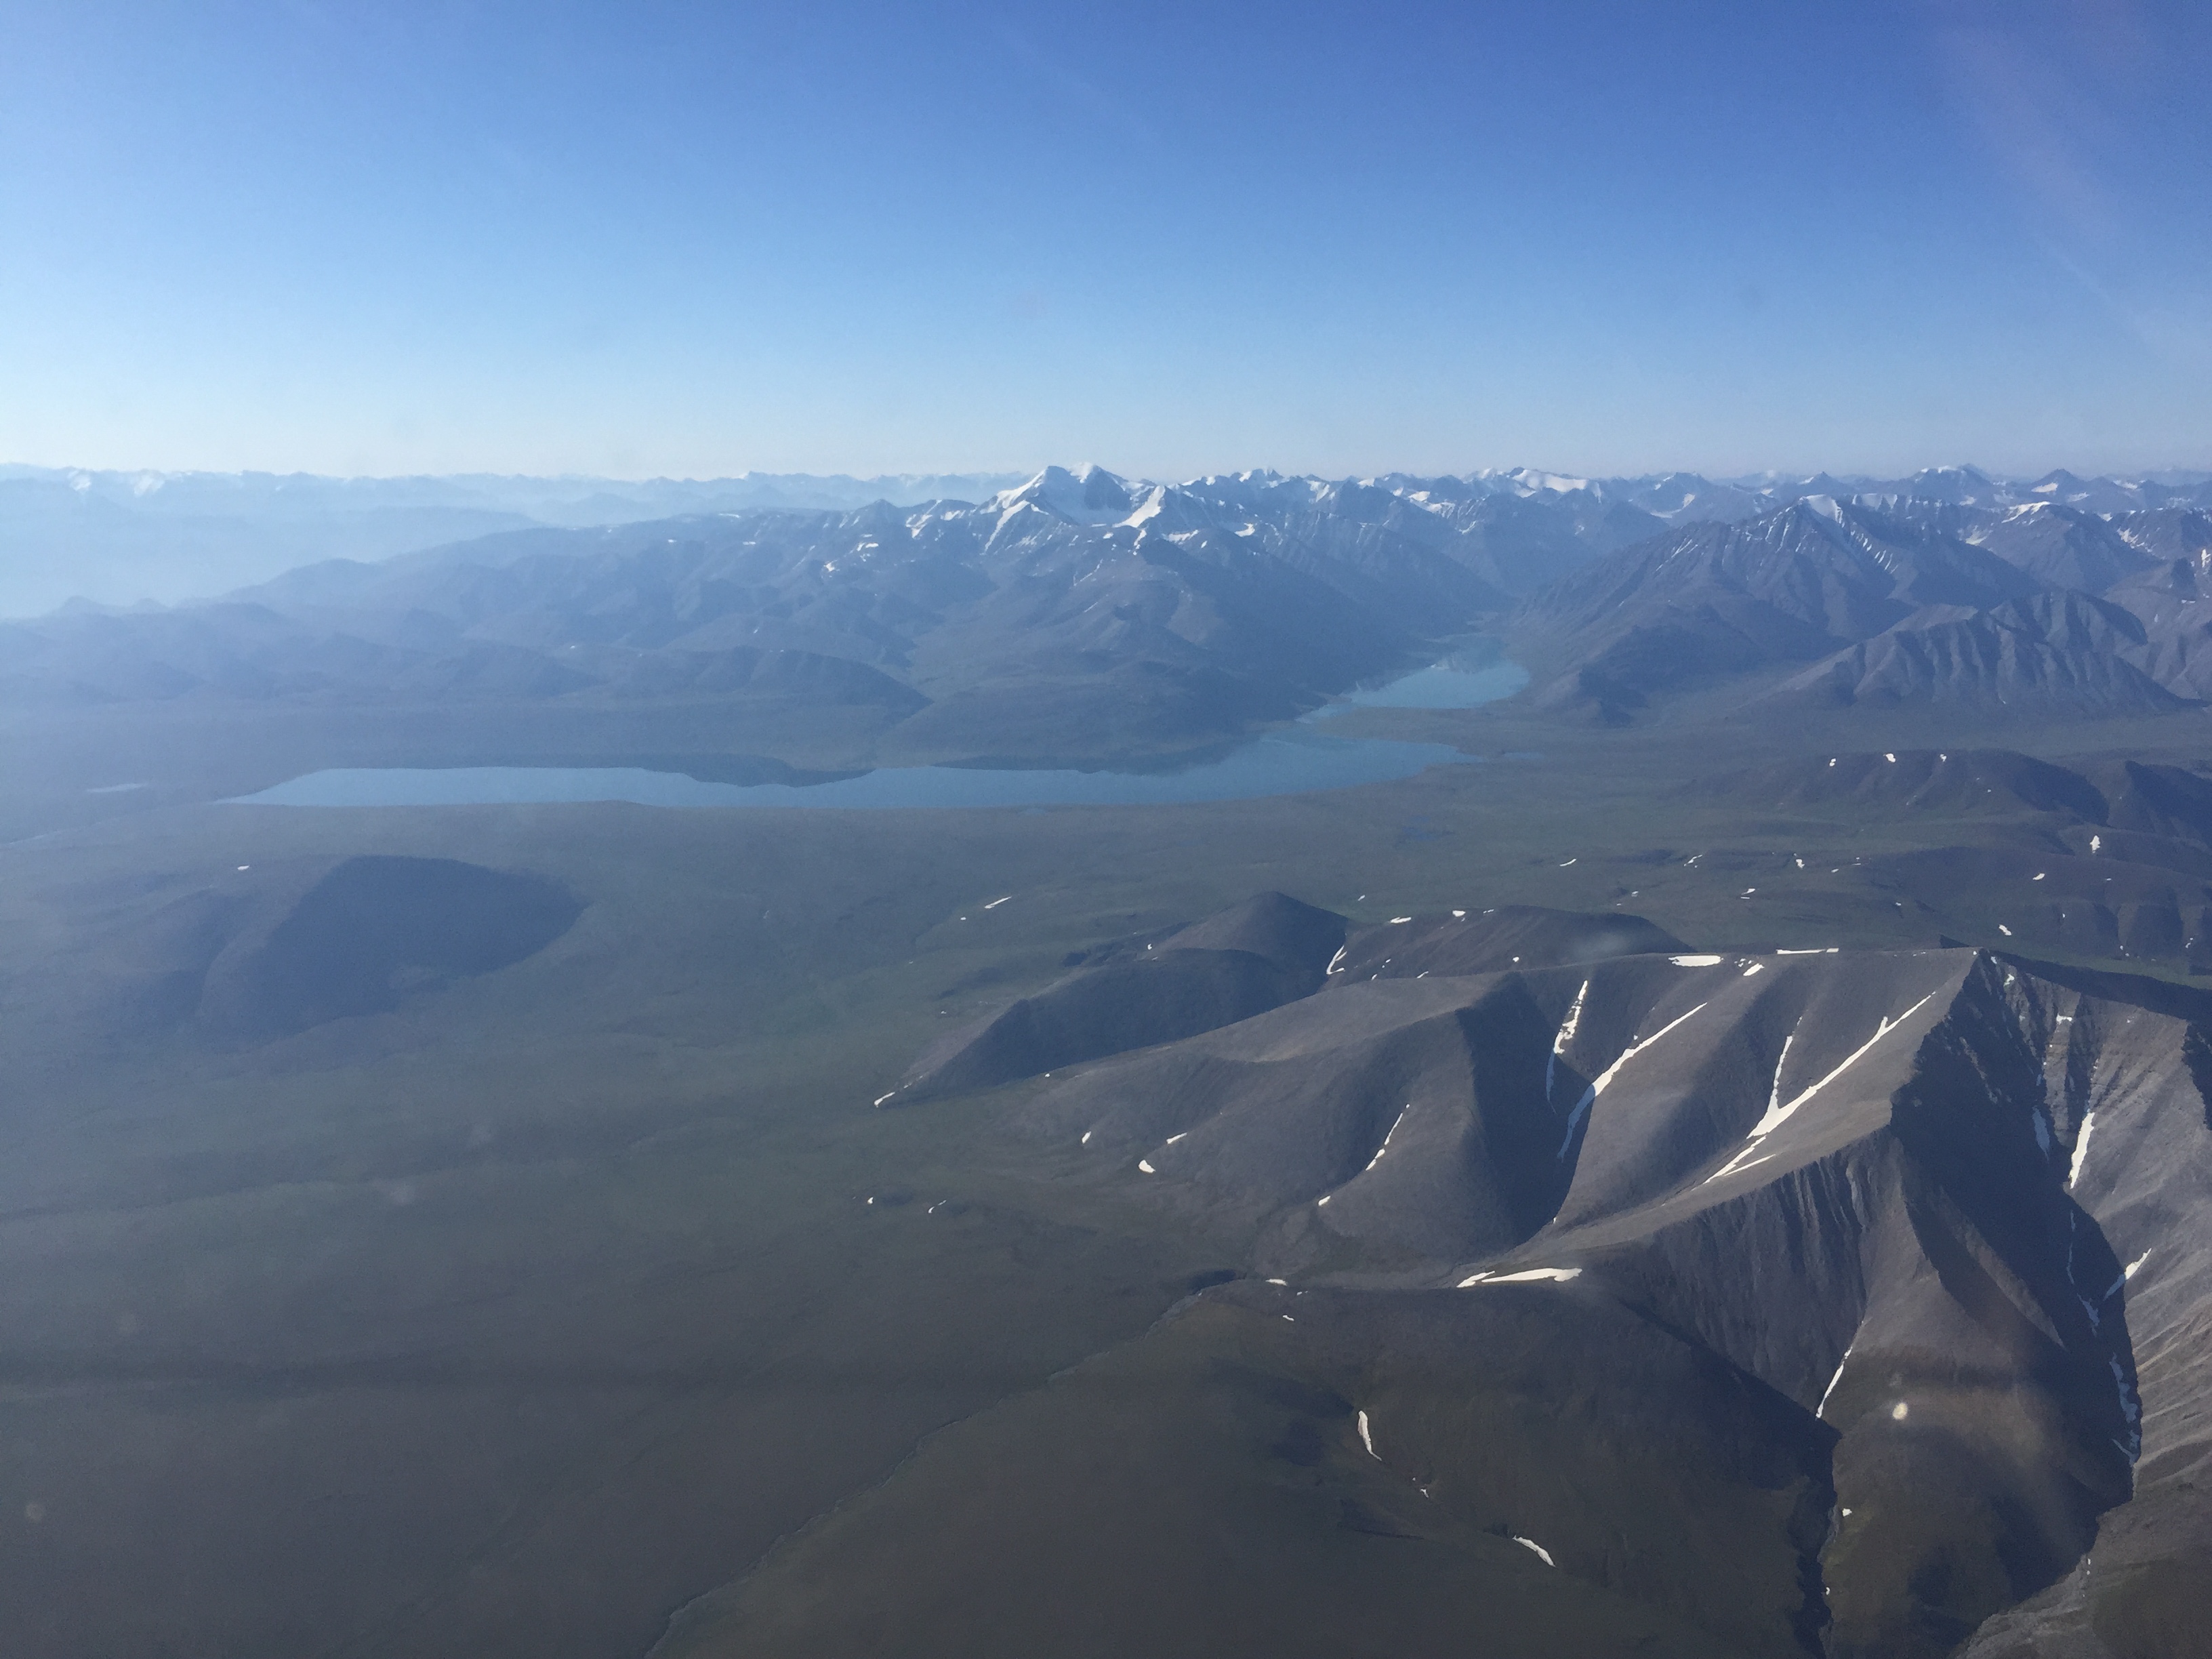
Shraders and Peter’s Lakes, with Mt Chamberlin near center. These are the deepest and biggest glacial lakes on the north slope (I think).
This whole deal with the Big Five began about 50 years ago. At that time, paper topographic maps were made using analog photogrammetry at two different map scales, 1:250,000 and 1:63,360. Though they used the same photographs, some of the peaks were measured as having different heights, causing some confusion as to which peak was the tallest. I mapped them all with lidar in 2008 and 2011, so I knew the right answer but hadnt gotten around to telling anyone. Plus there were some issues with the lidar that I wanted to resolve before putting out an official number. In the meantime, I developed fodar and had already begun mapping glaciers there with it. About this time, Kit Deslauriers had the bright idea to climb the peaks and directly measure their heights with a survey-grade GPS while I flew overhead and mapped them, and got some funding from the National Geographic society to put the project together. We did this for Mt Isto and Mt Chamberlin last April, and found that our measurements agreed to within about 10 centimeters. I also mapped a few other peaks that we didn’t survey. In the process of analyzing the data, I realized that the issue was more complicated that it seemed at first, because the mountains are covered in ice and changing in elevation over time and two of the Big Five were only a meter different in height, such that wind drifting from a single storm might make the difference in which was higher. Plus I wanted to get at least two (or more) measurements of my own from each mountain so that I knew I was getting the right answers. It was also a great test for the technique and something that likely would bring some attention to it.
So the last was Mt Okpilak. I had mapped it for the first time in April when doing Peter’s Lake the first time. The weather was still holding up, though as I flew south towards it I could see a wall of smoke forming on the south side. But it wasnt long before I had achieved all of my goals — great maps of my glaciers and great maps of the Big Five on the same day. The only question now was whether I had enough fuel to get home…
But in the end of course I did. As I left the mountains heading south, Kristin texted me to let me know she had a medivac flight to Arctic Village. I had barely passed Arctic Village on my way south by the time she landed there, flying in a much faster plane. And even though she was on the ground for an hour dealing with the patient, she still beat me back. I spent the rest of the afternoon processing data to ensure that it all worked as well as I hoped (which it did) so that I could sleep, and then wrote this, knowing that if I didnt do it now I would get swept away and never get back to it.
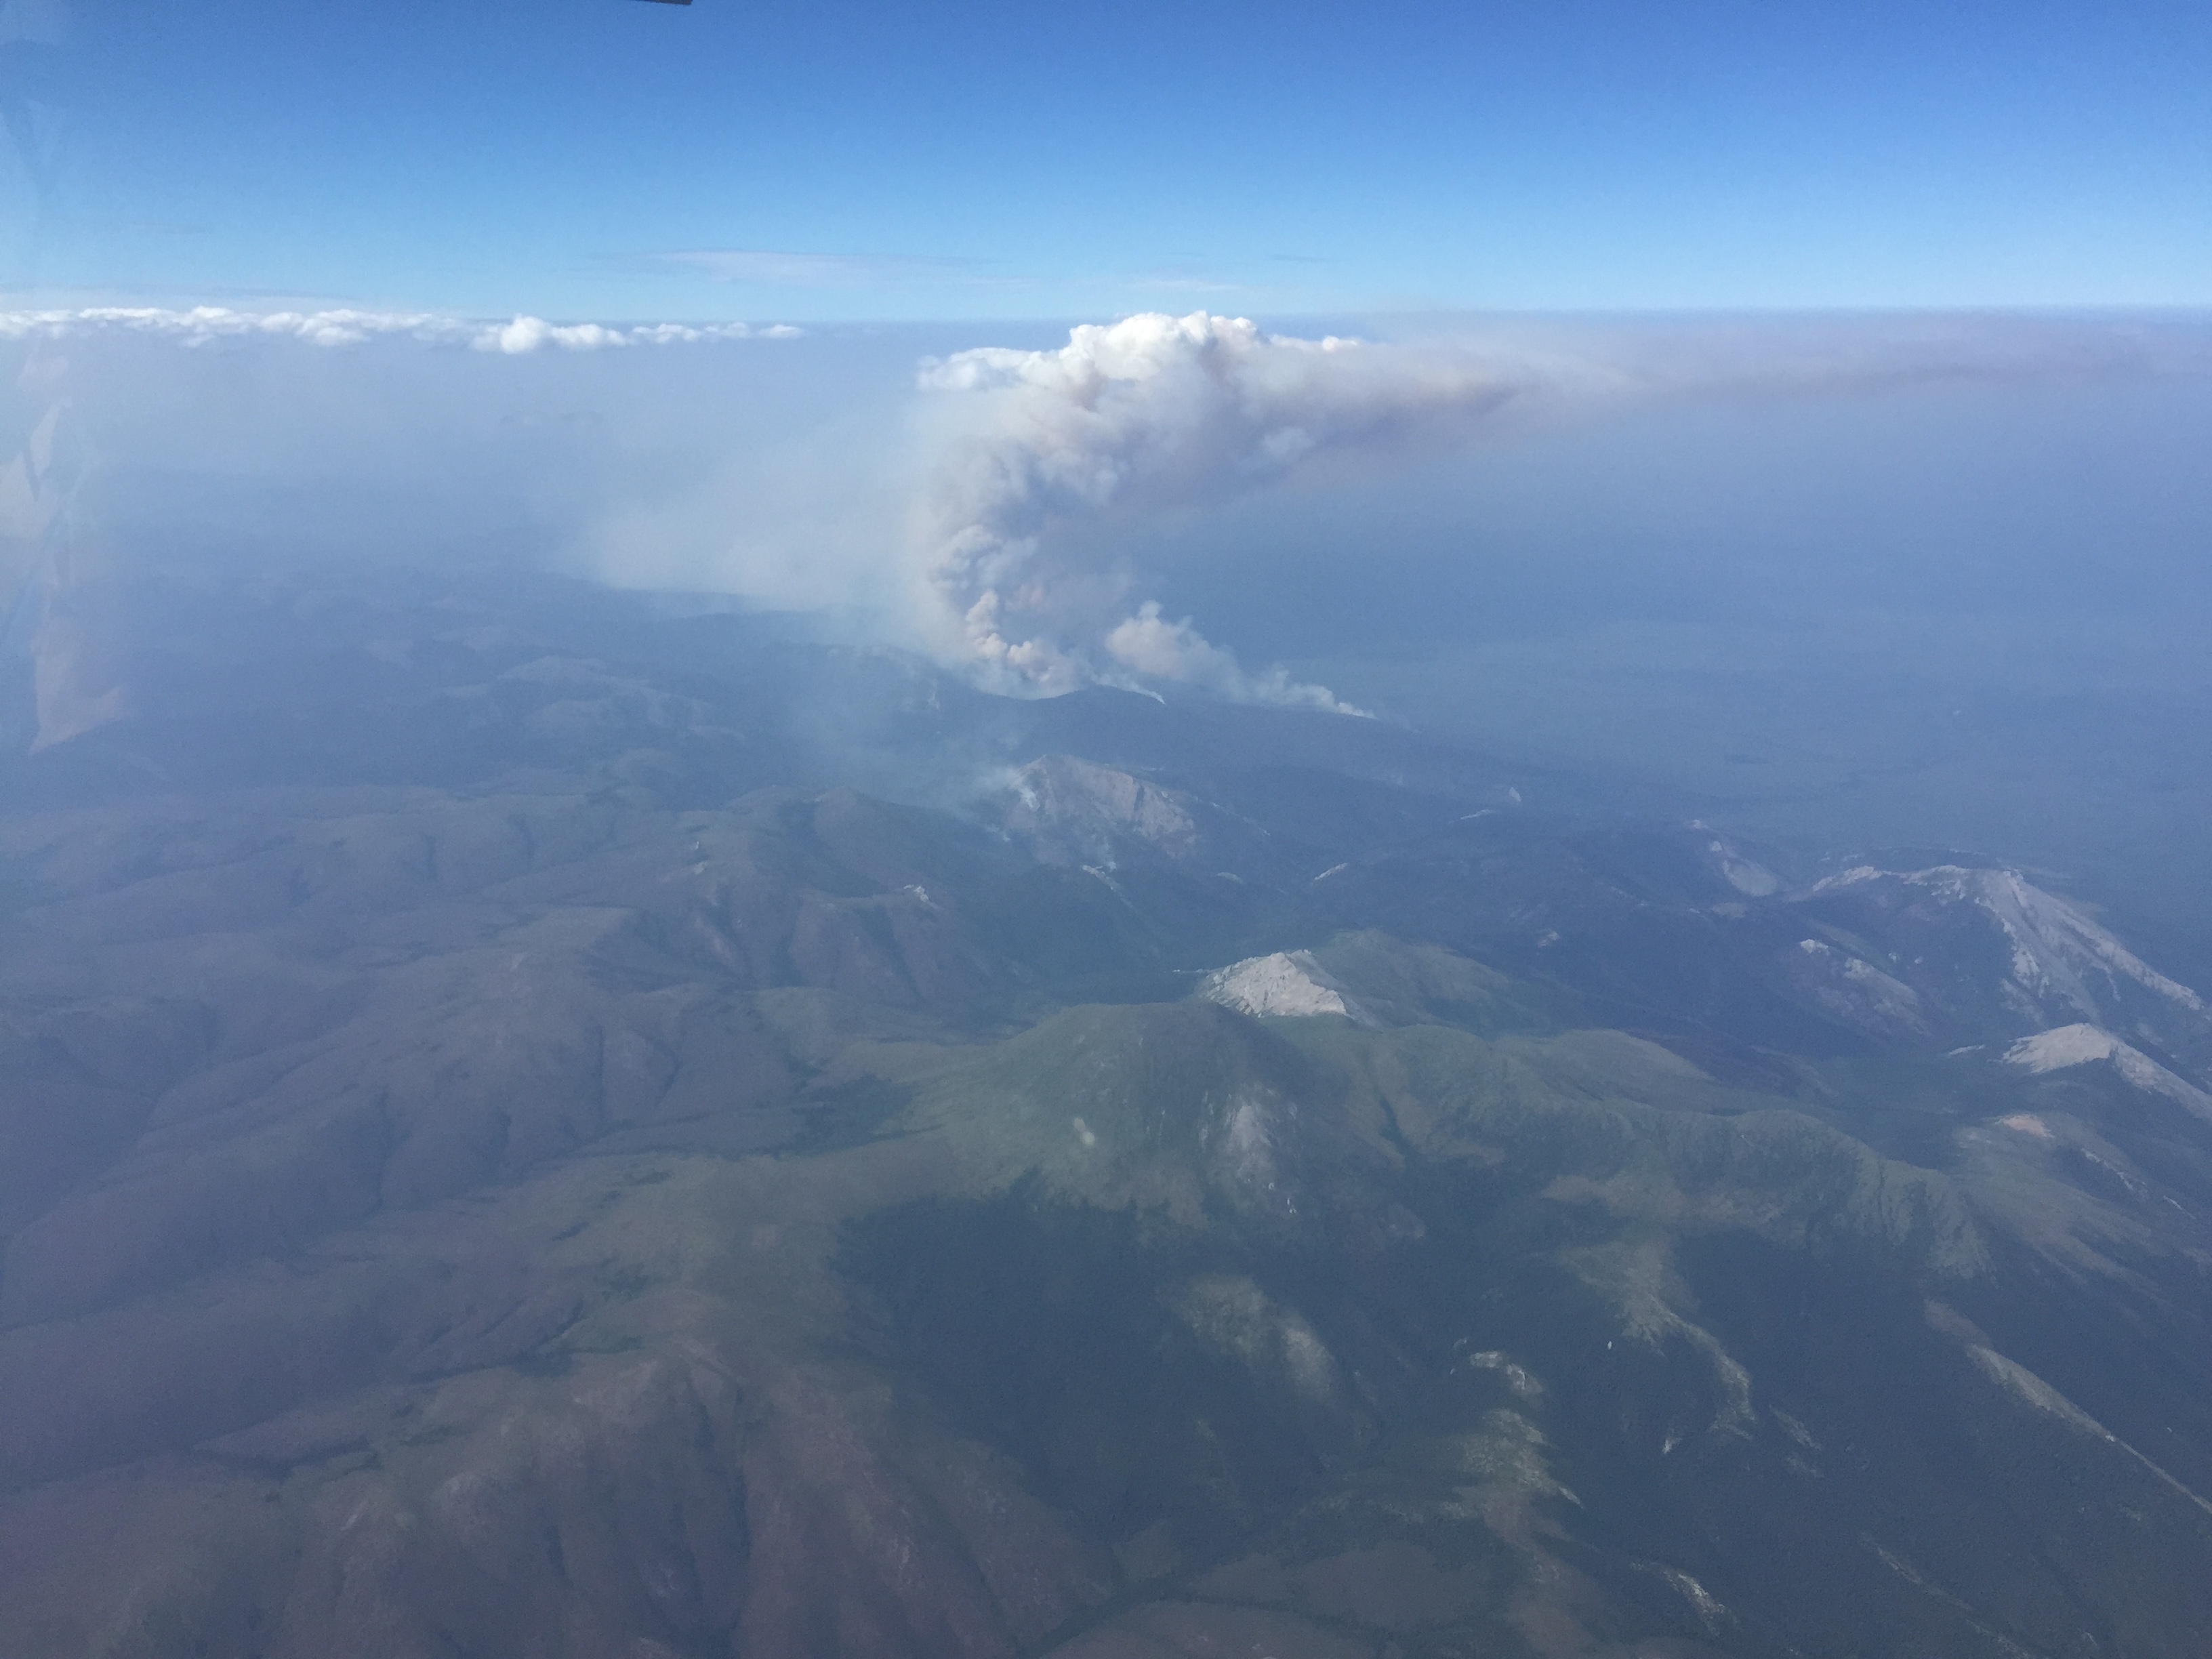
This fire seemed to have started on my way south. I could see it in the distance, but by the time I got up close to it was much larger. I could see the flames at its base. By the time I landed, it was forming huge towering cumulus clouds that could be seen from Fairbanks, 50 miles away. Apparently there are more than 300 fires like this, burning more than 2 million acres in Alaska right now. This creates a lot of smoke, and narrow windows for photogrammetry. But not too narrow for us…
There and back again: two days, 19 hours of flying, 1700 miles, and over 8,000 photos.