
New papers published on fodar measurements of Alaskan coastlines
Two coastal mapping projects from last summer have recently been published. Both papers were presented last week at the prestigous Coastal Sediments conference, which occurs every 4 years since 1977.
Evaluating changed to Arctic coastal bluffs using repeat aerial photography and structure-from-motion elevation models by Ann Gibbs, Matt Nolan, and Bruce Richmond
Here I mapped about 3 km stretch of Barter Island in July and September of 2014, which Ann and Bruce from the USGS Santa Cruz office analyzed and compared to their field measurements. They spent about a week there in September mapping with GPS and tape measure. I flew up on a day trip for the mapping, and was able to send them the results before they returned to California; they also became part of my map since they were taking measurements as I flew over! The results came out beautifully, with the difference maps showing the same level of detail as found in our snow paper. We were able to measure coastal erosion on the centimeter to meter scale, and calculate a volume change of total loss of 28,000 m³ with an uncertainty of only 540 m³ (that is, only about 2%) over this two month period. To my knowledge, this is the best measurement of coastal erosion ever made here. I’m encouraged to measure coastal erosion along the whole Arctic Ocean coastline.
Evaluation of vector coastline features extracted from ‘structure-from-motion’-derived elevation data by Nicole Kinsman, Ann Gibbs, and Matt Nolan
Here I mapped the coasts near Unalakleet and Shaktoolik last fall, which Nicole and Ann analyzed and compared to previous data collected there. Both of these villages are situated directly on an eroding coast, and it is a constant battle for them to keep their towns from being washed away. The emphasis of this study, however, was not direct measurement of coastal erosion but rather how well fodar compares to other map products and how useful it is for deriving vector data. In terms of elevation data, fodar was on par with lidar, which were both far superior to other alternatives. However, fodar had several advantages over lidar (besides costing 10x less): 1) Fodar produces a perfectly co-registered image, which clearly lets us identify driftwood, riprap, and even tire tracks, whereas lidar does not produce such an image, 2) Fodar’s spatial resolution was much higher than lidar, allowing topographic measurements of things like driftwood, and 3) this spatial and vertical resolution was high enough that vector products of shoreline could be instantly derived from our raster maps, eliminating the need for hand-digitization of vectors.
These two projects address several problems in common. Our knowledge of Alaska’s coastlines is abysmal. Less than 10% of Alaska has contemporary shoreline data (1960 or newer!) and less than 1% is mapped annually, and as a State we do not comply with many Federal guidelines, such as for FEMA, regarding our mapping status. Estimates for mapping all 11,000 km of our coastlines have ranged into the many millions using lidar, which is what is mostly used in the lower 48. Based on the results of our research, fodar would not only be a perfectly acceptable alternative to lidar, it would be preferred to lidar.
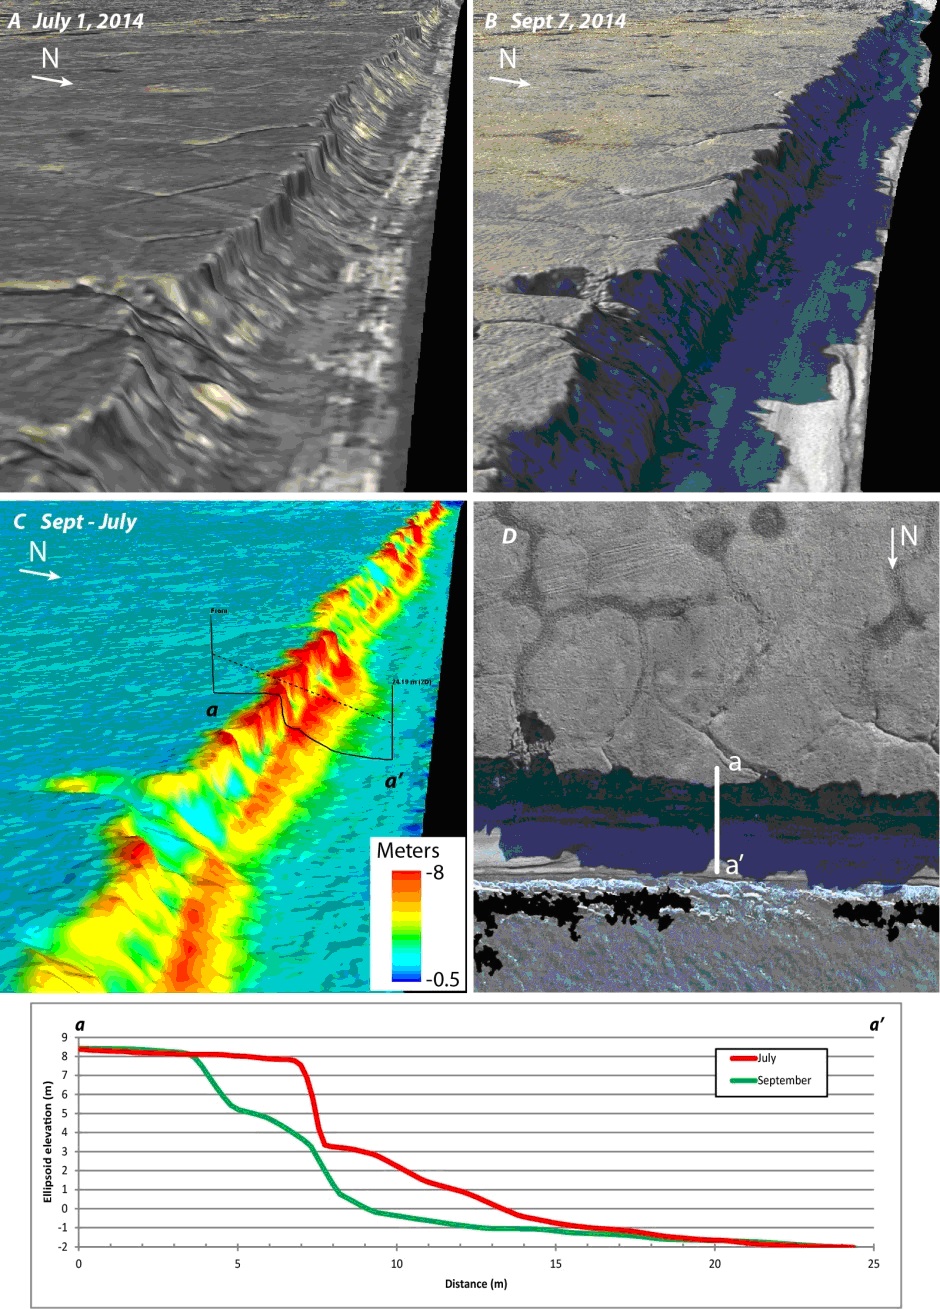
Above is a figure from the first paper, showing coastal erosion on Barter Island over a two month period in 2014. See www.fairbanksfodar.com/fodar-earth to see the Barter Island and Unalakleet data referenced in these papers.