
DOTs Delivered
Today we delivered data acquired for the Alaska Department of Transportation near Valdez and in Fairbanks, and found that their validation data showed what we have always found — it just doesn’t get any better than fodar.
While this is a bit of an aside, here I’m also posting a separate Fodar Earth for the DOT data we acquired in Arctic Alaska last month, delivered within a week of acquisition. Stake-holders interested in learning more about the aufeis problem that has been plaguing the haul road last year can fly around these data in 3D to get what is probably a better impression of the problem than can be achieved by actually being there.
For the Richardson Highway data near Valdez, DOT measured about 30 ground control points, many of which were photo identifiable. Our preliminary analysis is that there is no horizontal offset and the vertical offset is minor if at all, indicating that this fodar data set is perfect without using any ground control, though more rigor is required to be definitive. We have found that accuracy improves in steeper terrain, like here, and it doesnt hurt that there was a CORS base station within the study area. This was a small project by our standards these days, only a few thousand photos covering about 30 miles of road, but we also mapped another 300 miles of road that same day and believe the accuracy will be just as good, suggesting that fodar is an ideal tool for many infrastructure applications.
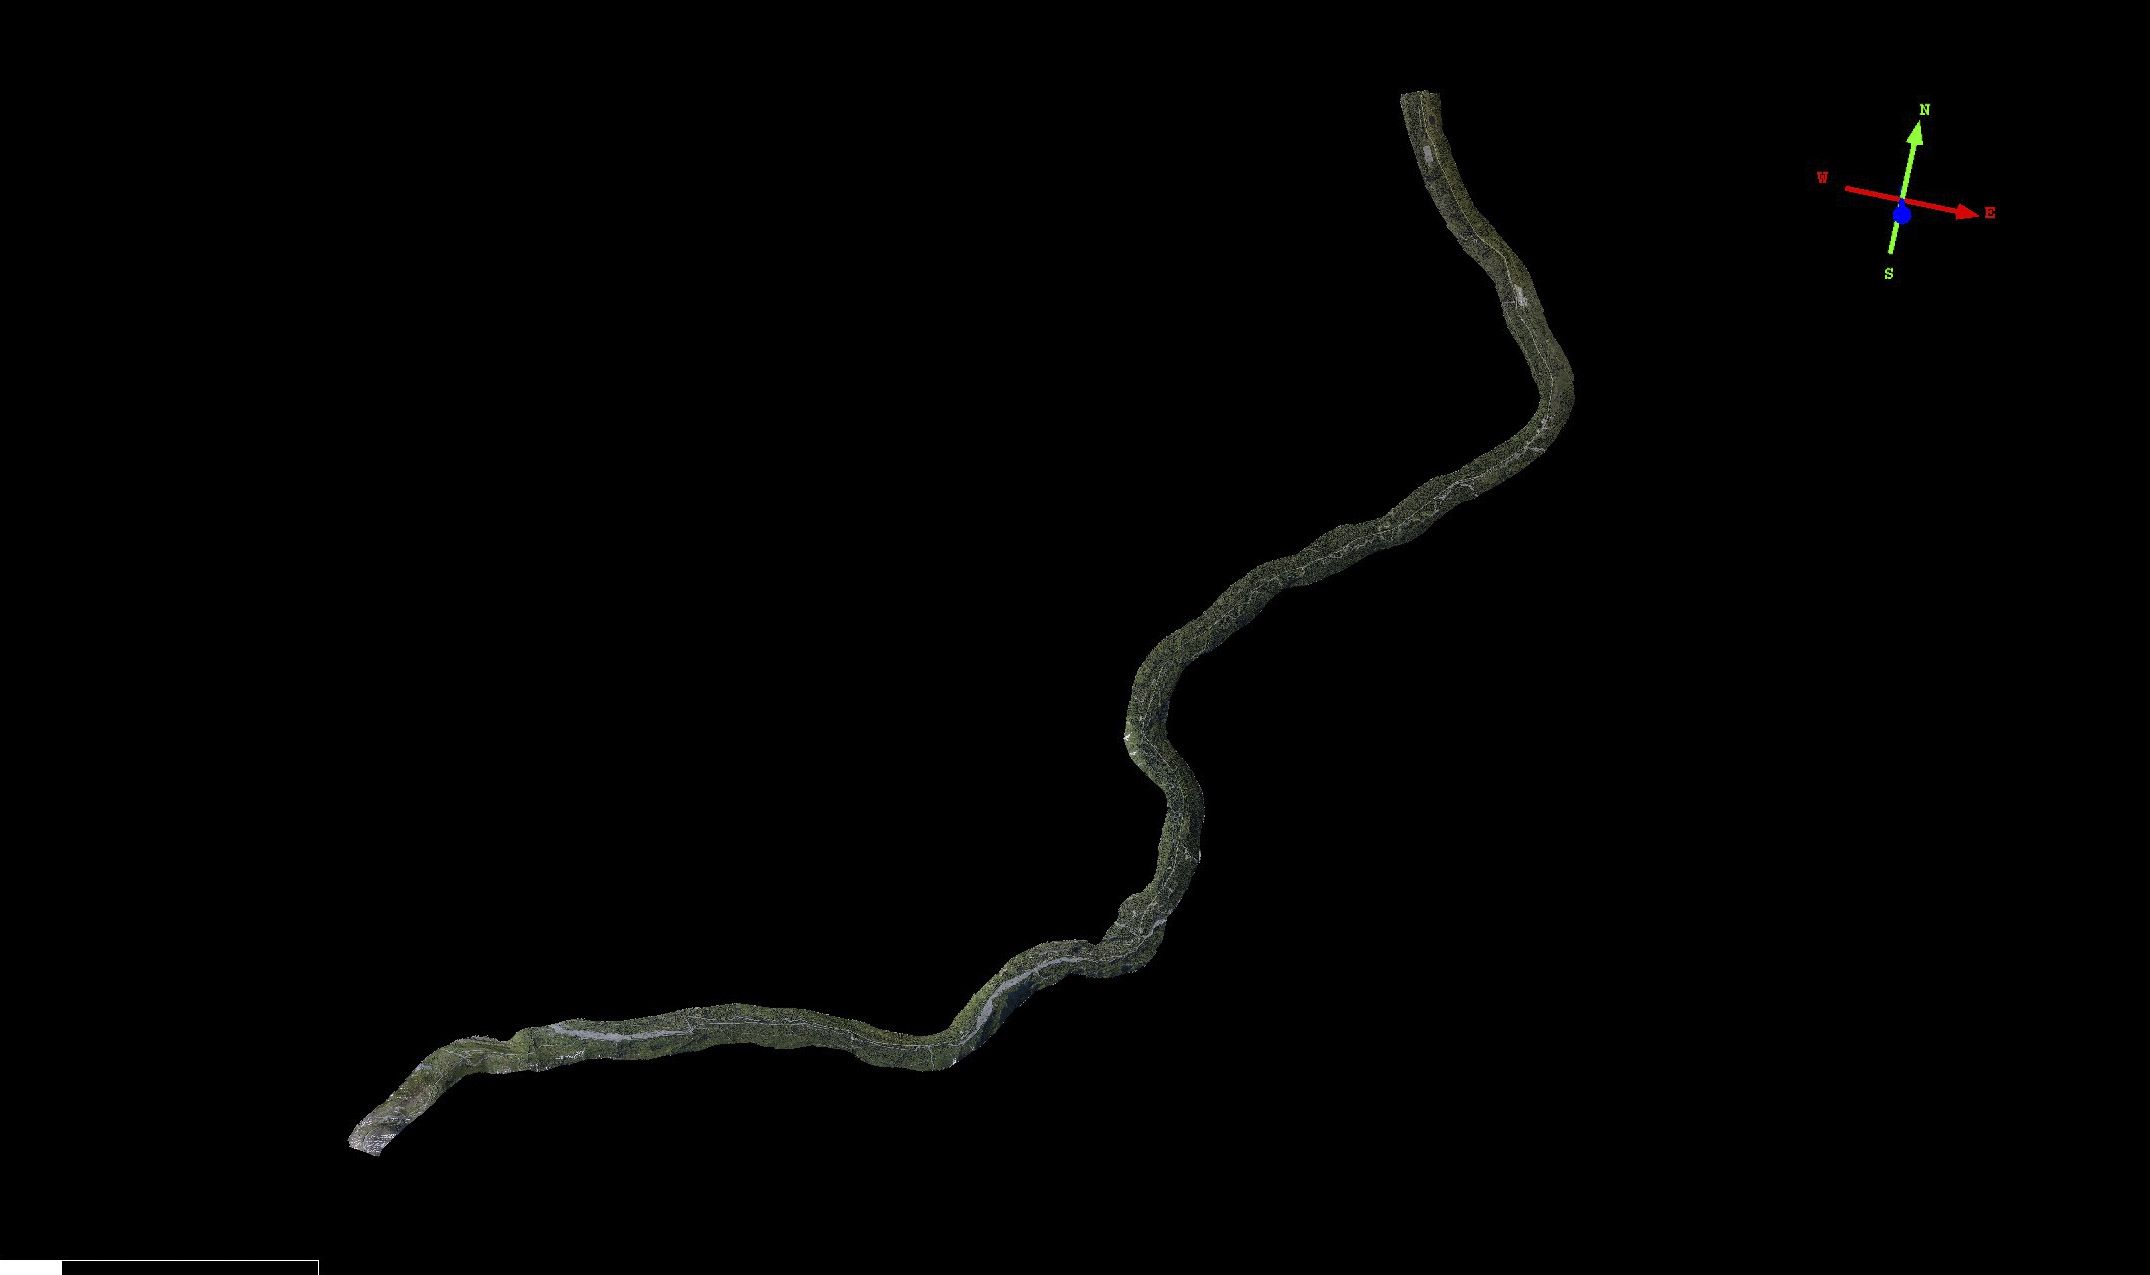
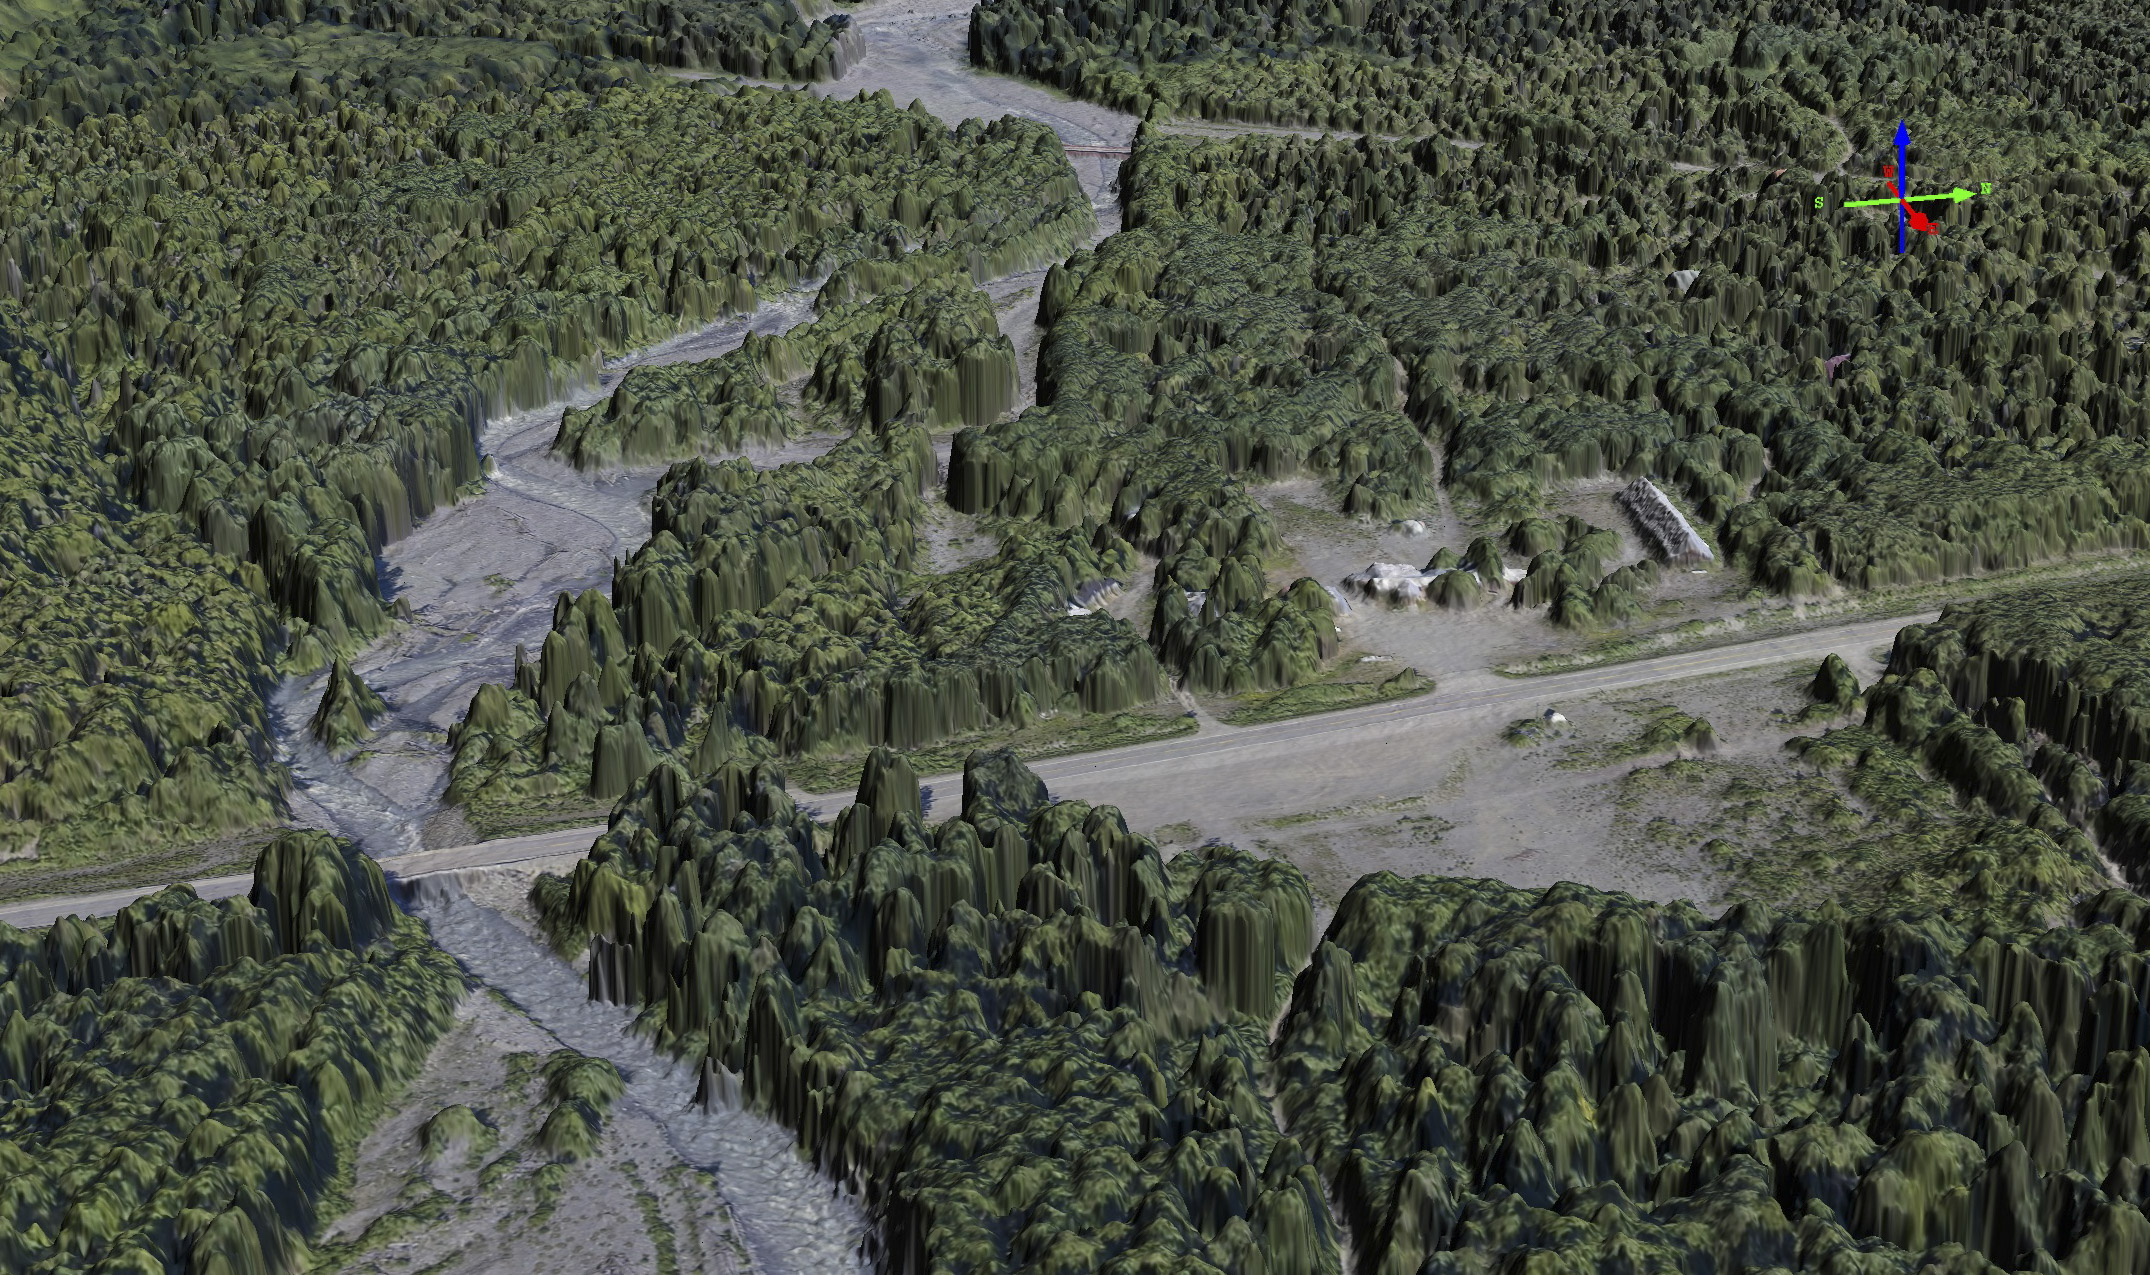
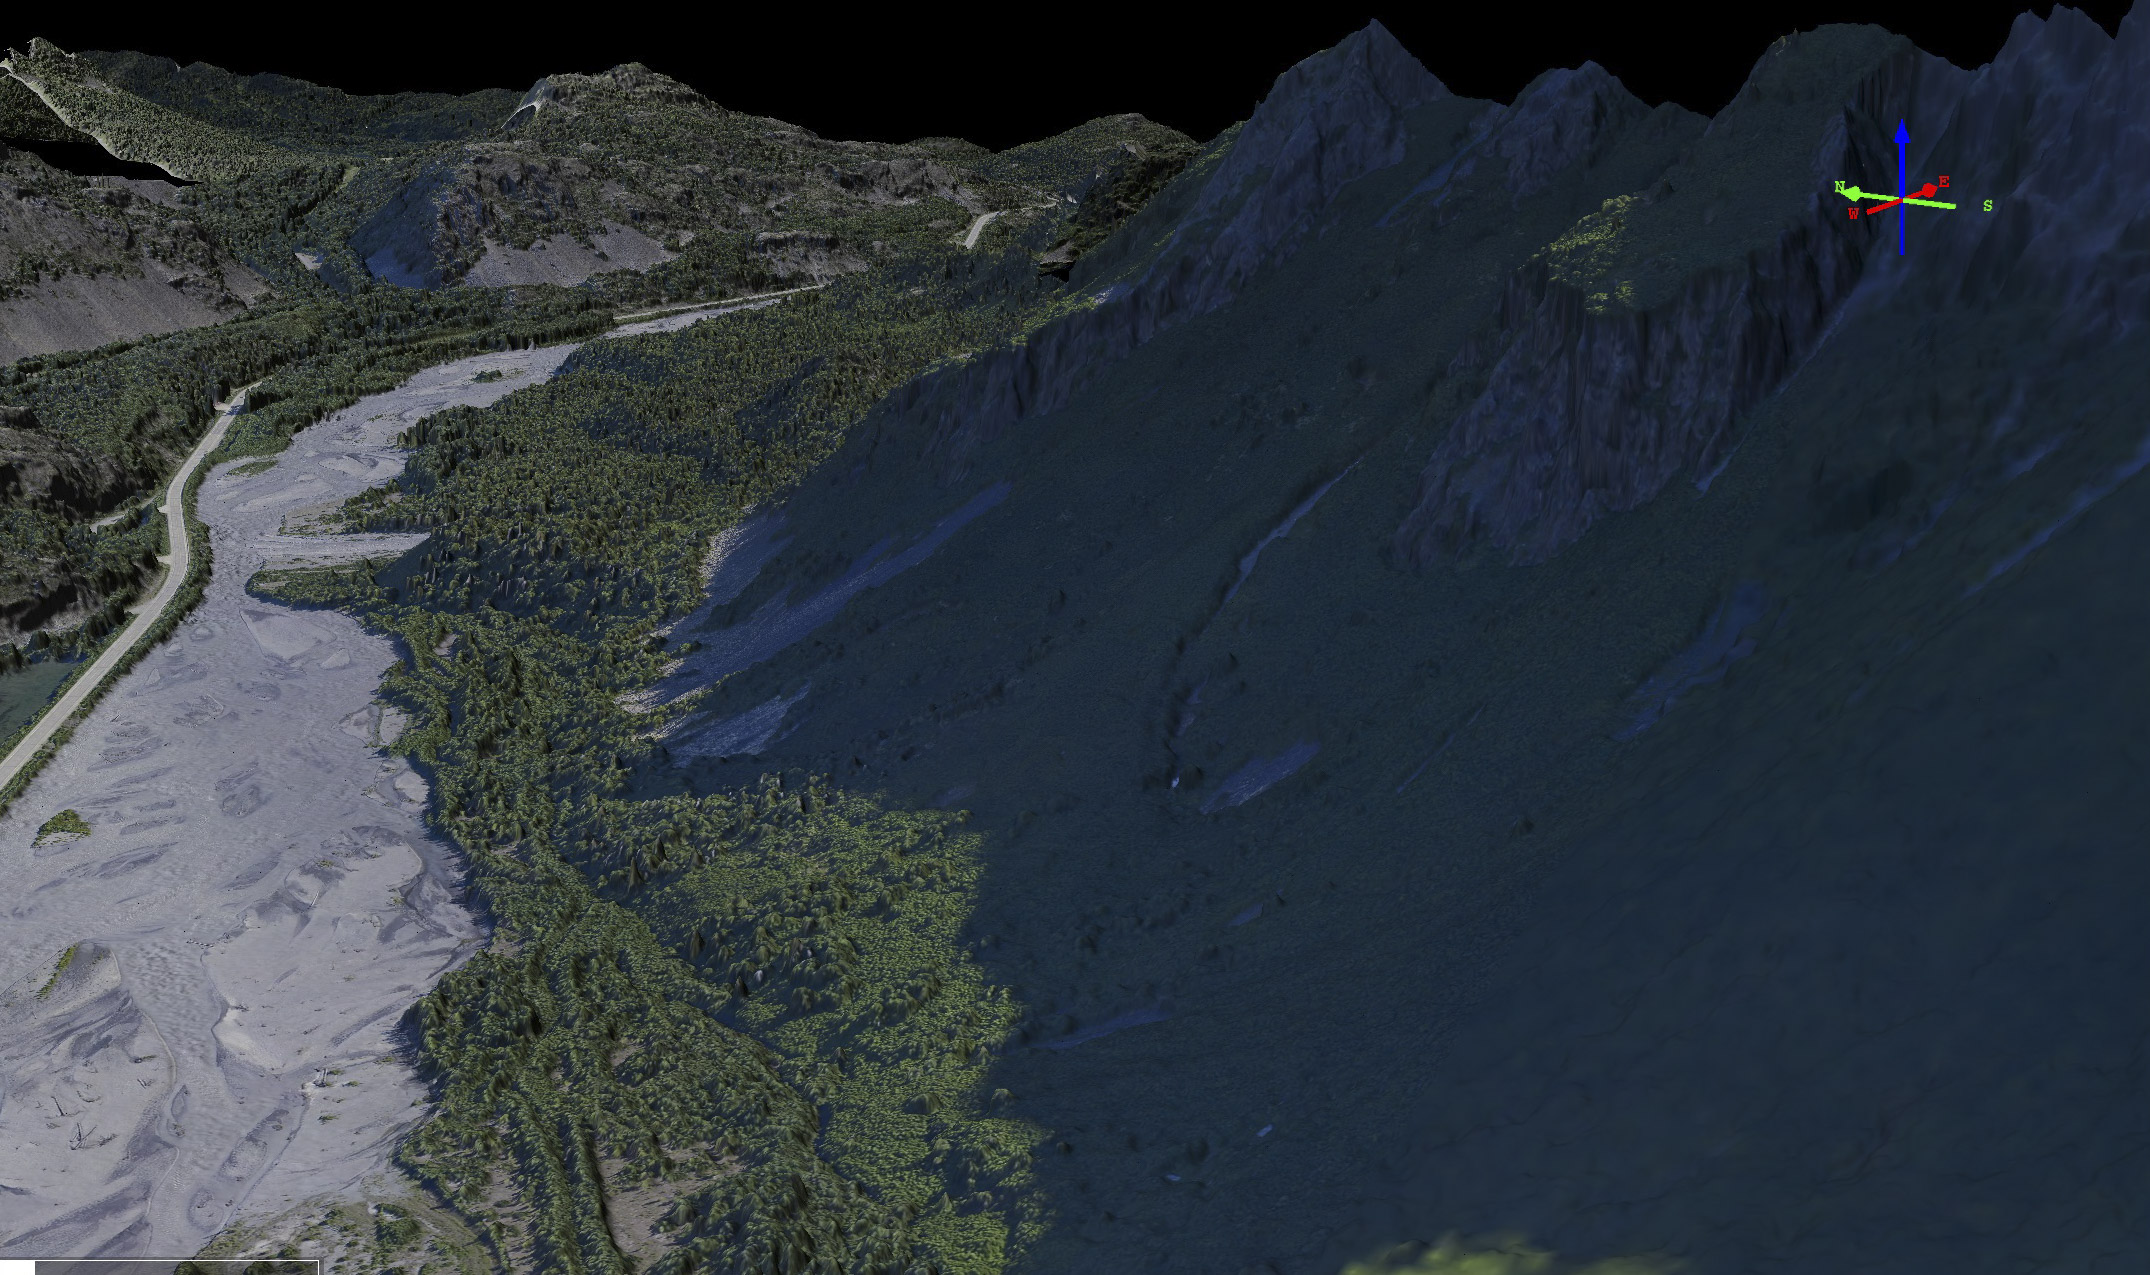
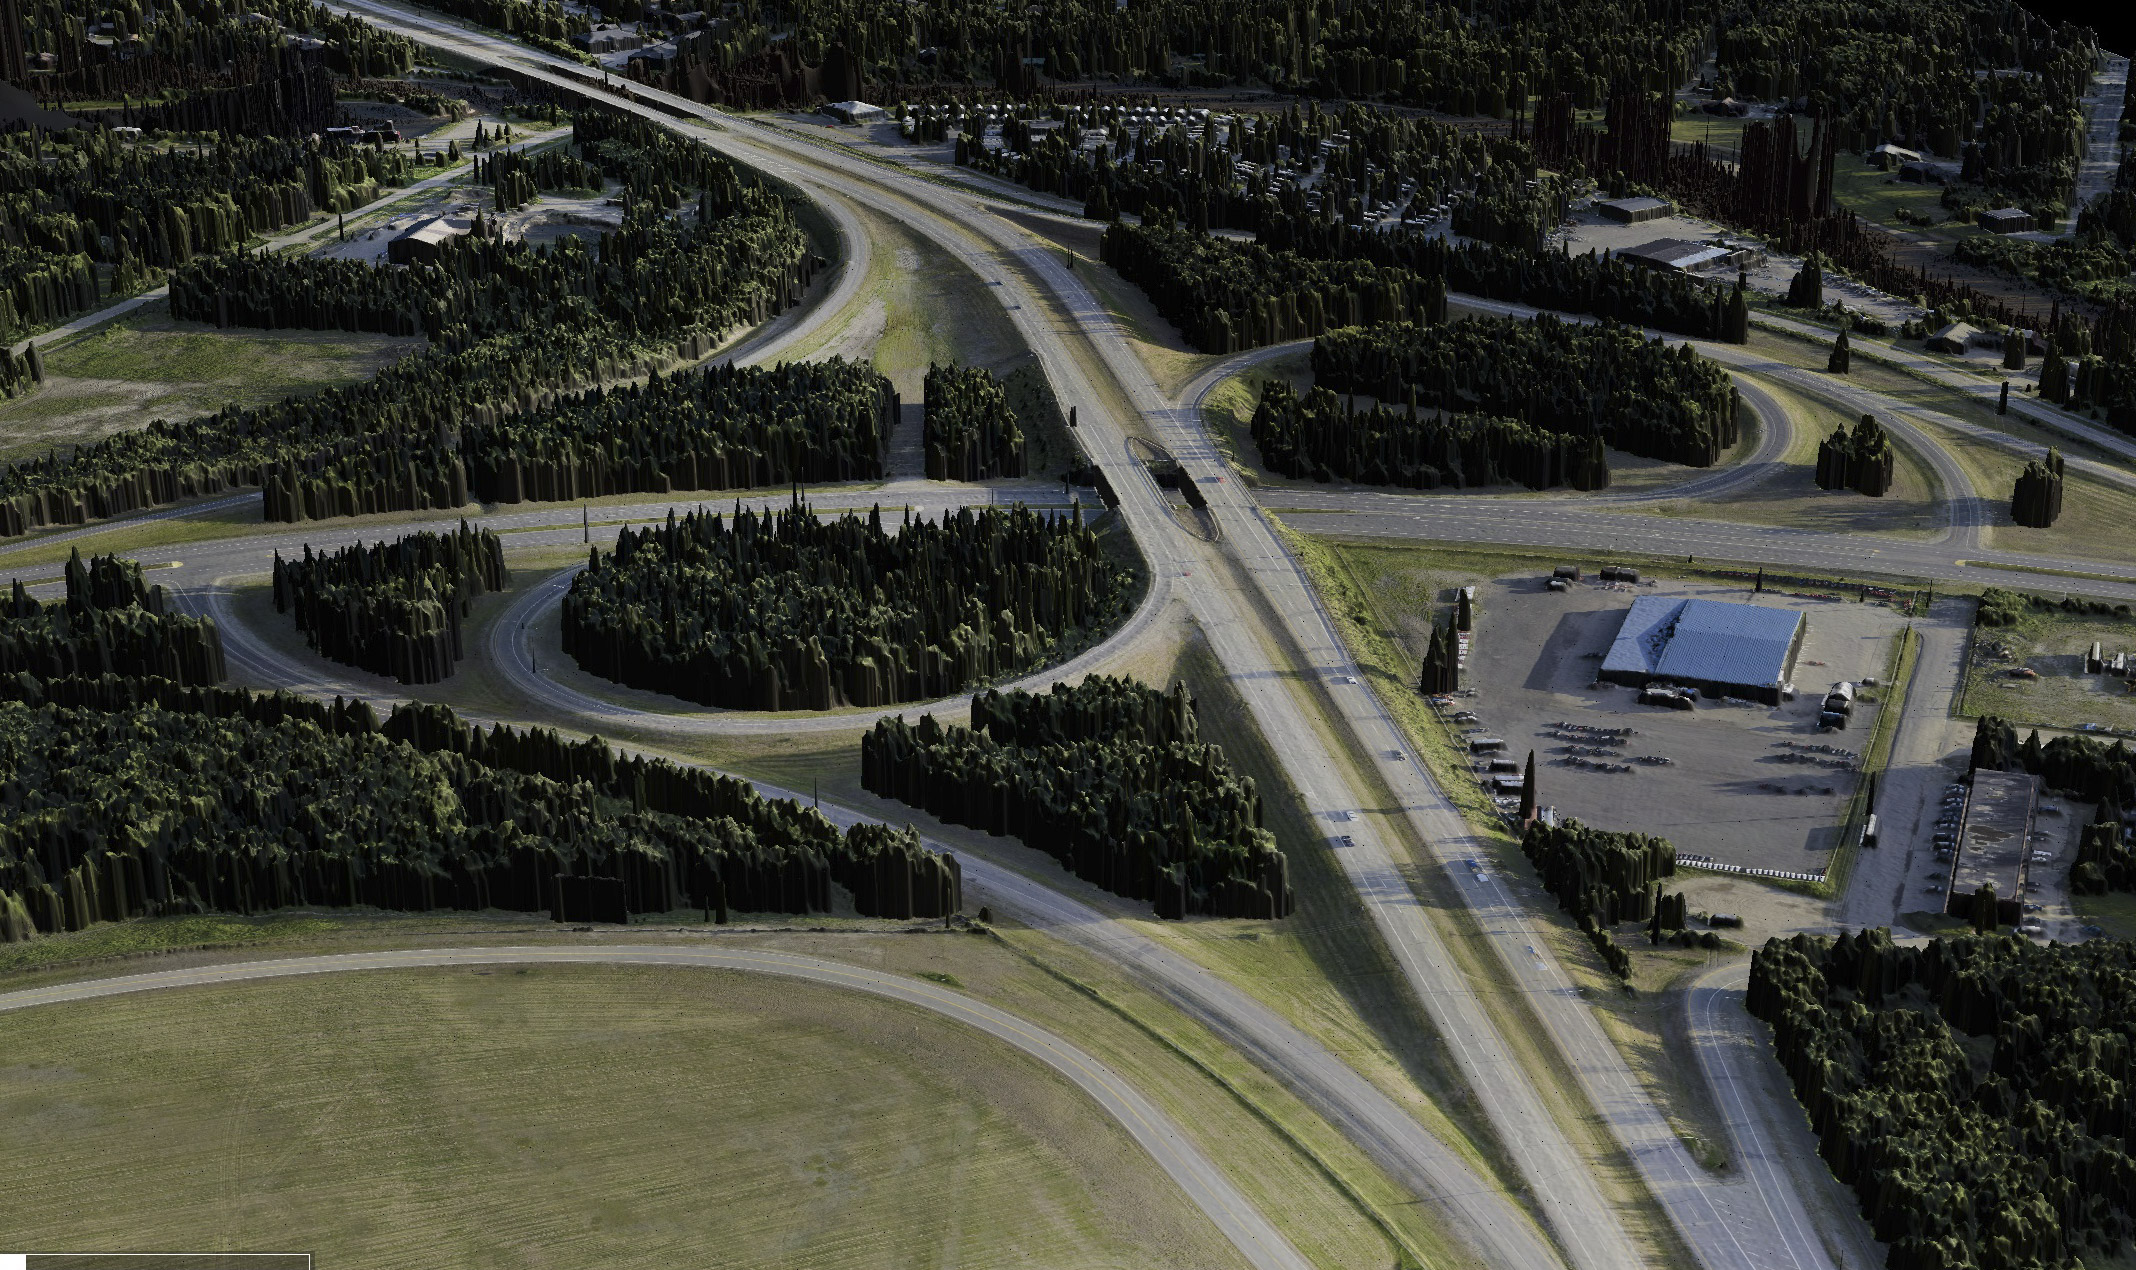
Overview of the Richardson Highway study area near Thompson Pass and Valdez. Mouse-over to see the terrain colored by height.
It’s a tight valley, with a lot going on inside it: a major highway, a huge pipeline, a big river, and lots of streams and tourists.
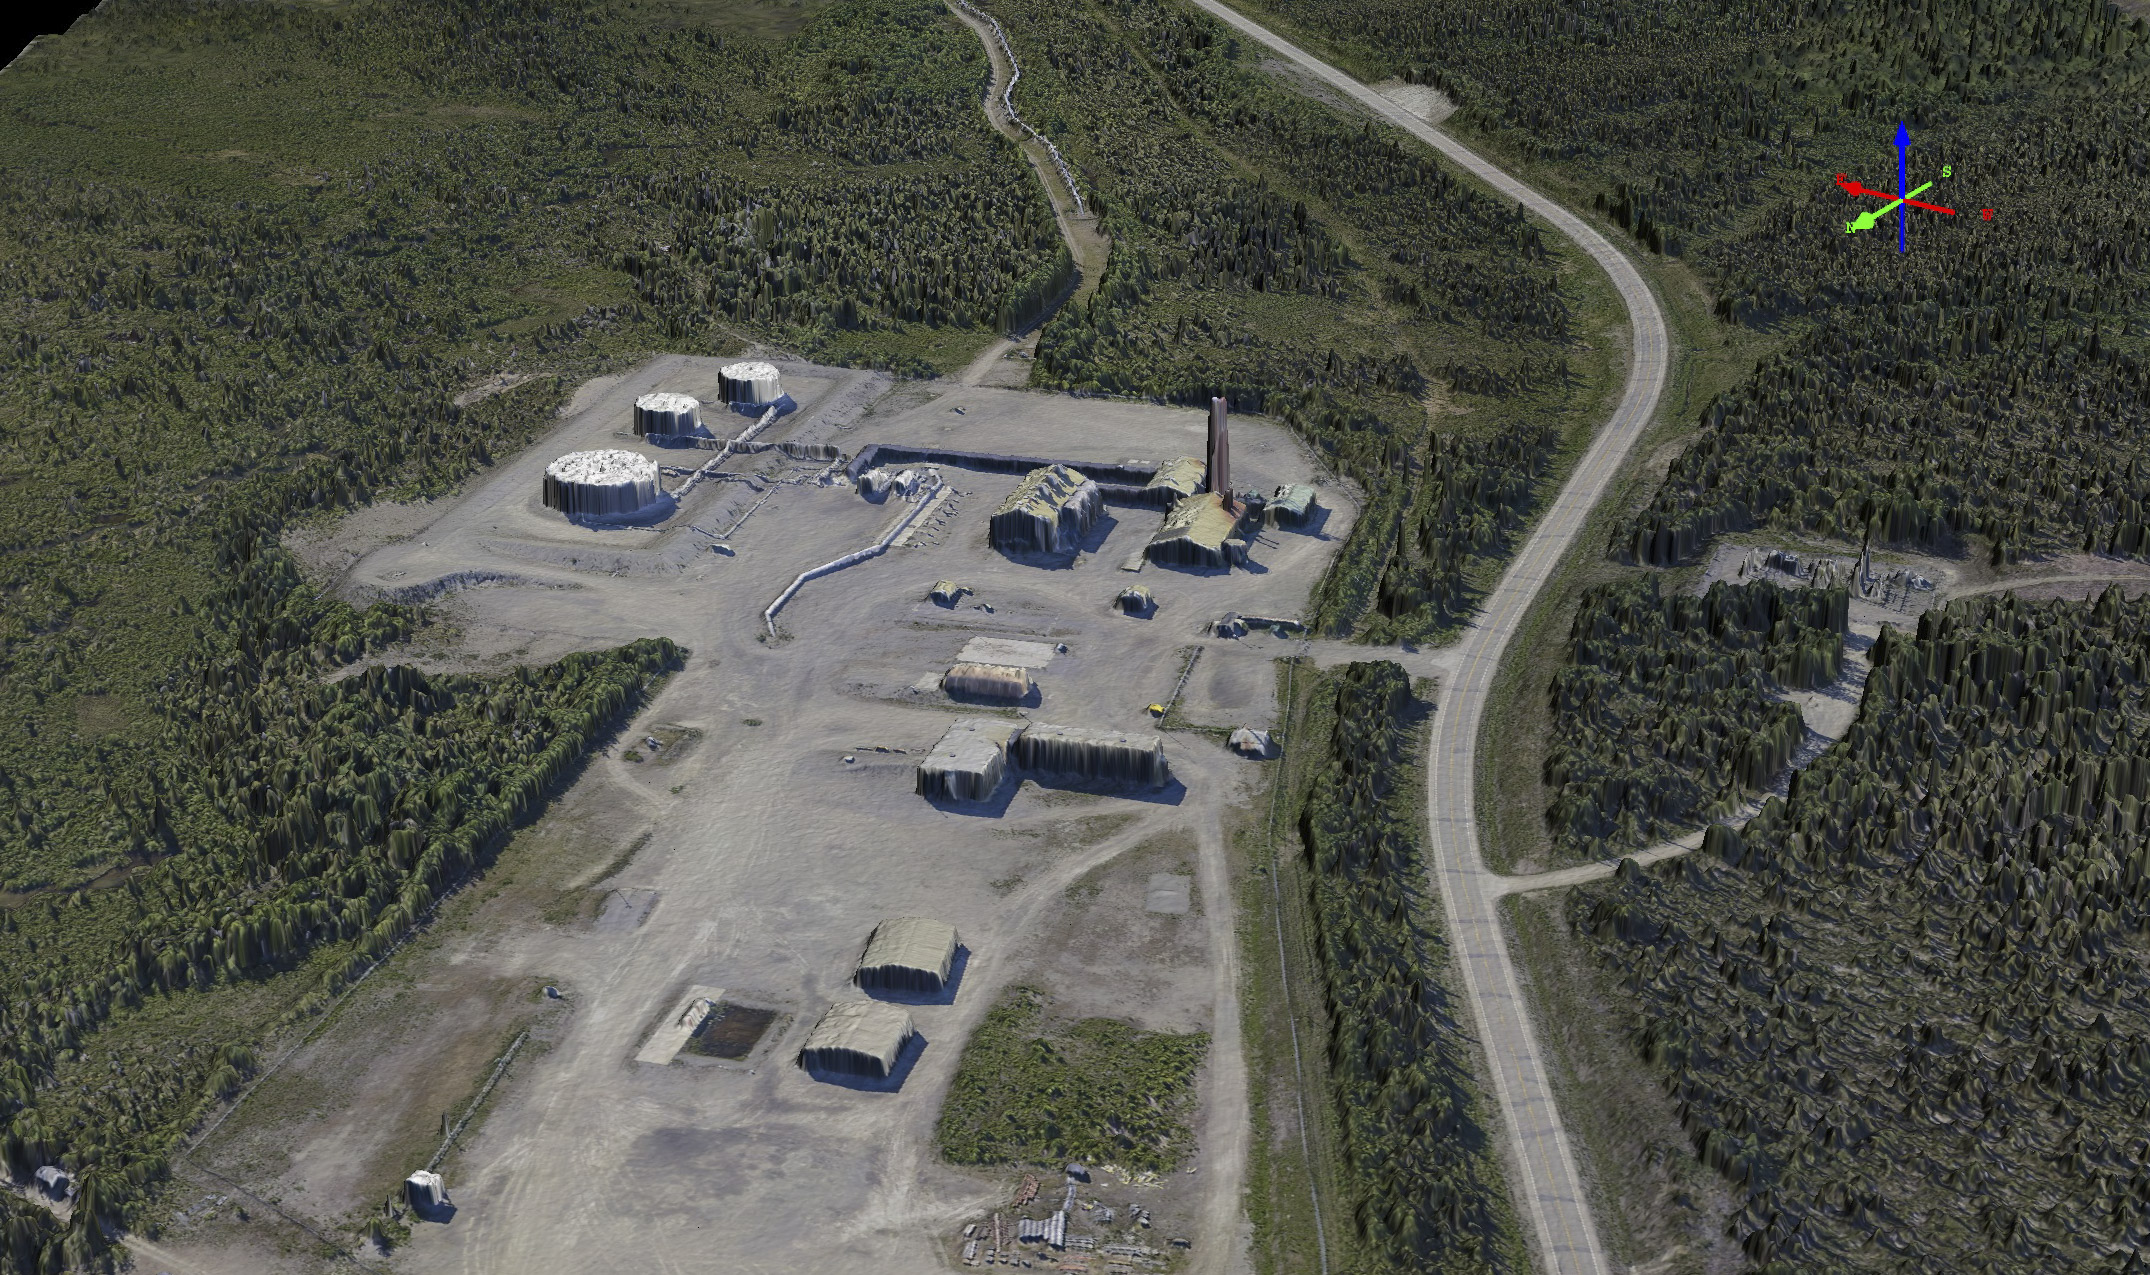
Here is a pump station for the pipeline, which you can see going underground near the top of the image, to the left of the road. We can measure subsidence of the ground where the pipeline is above or below grade with fodar.
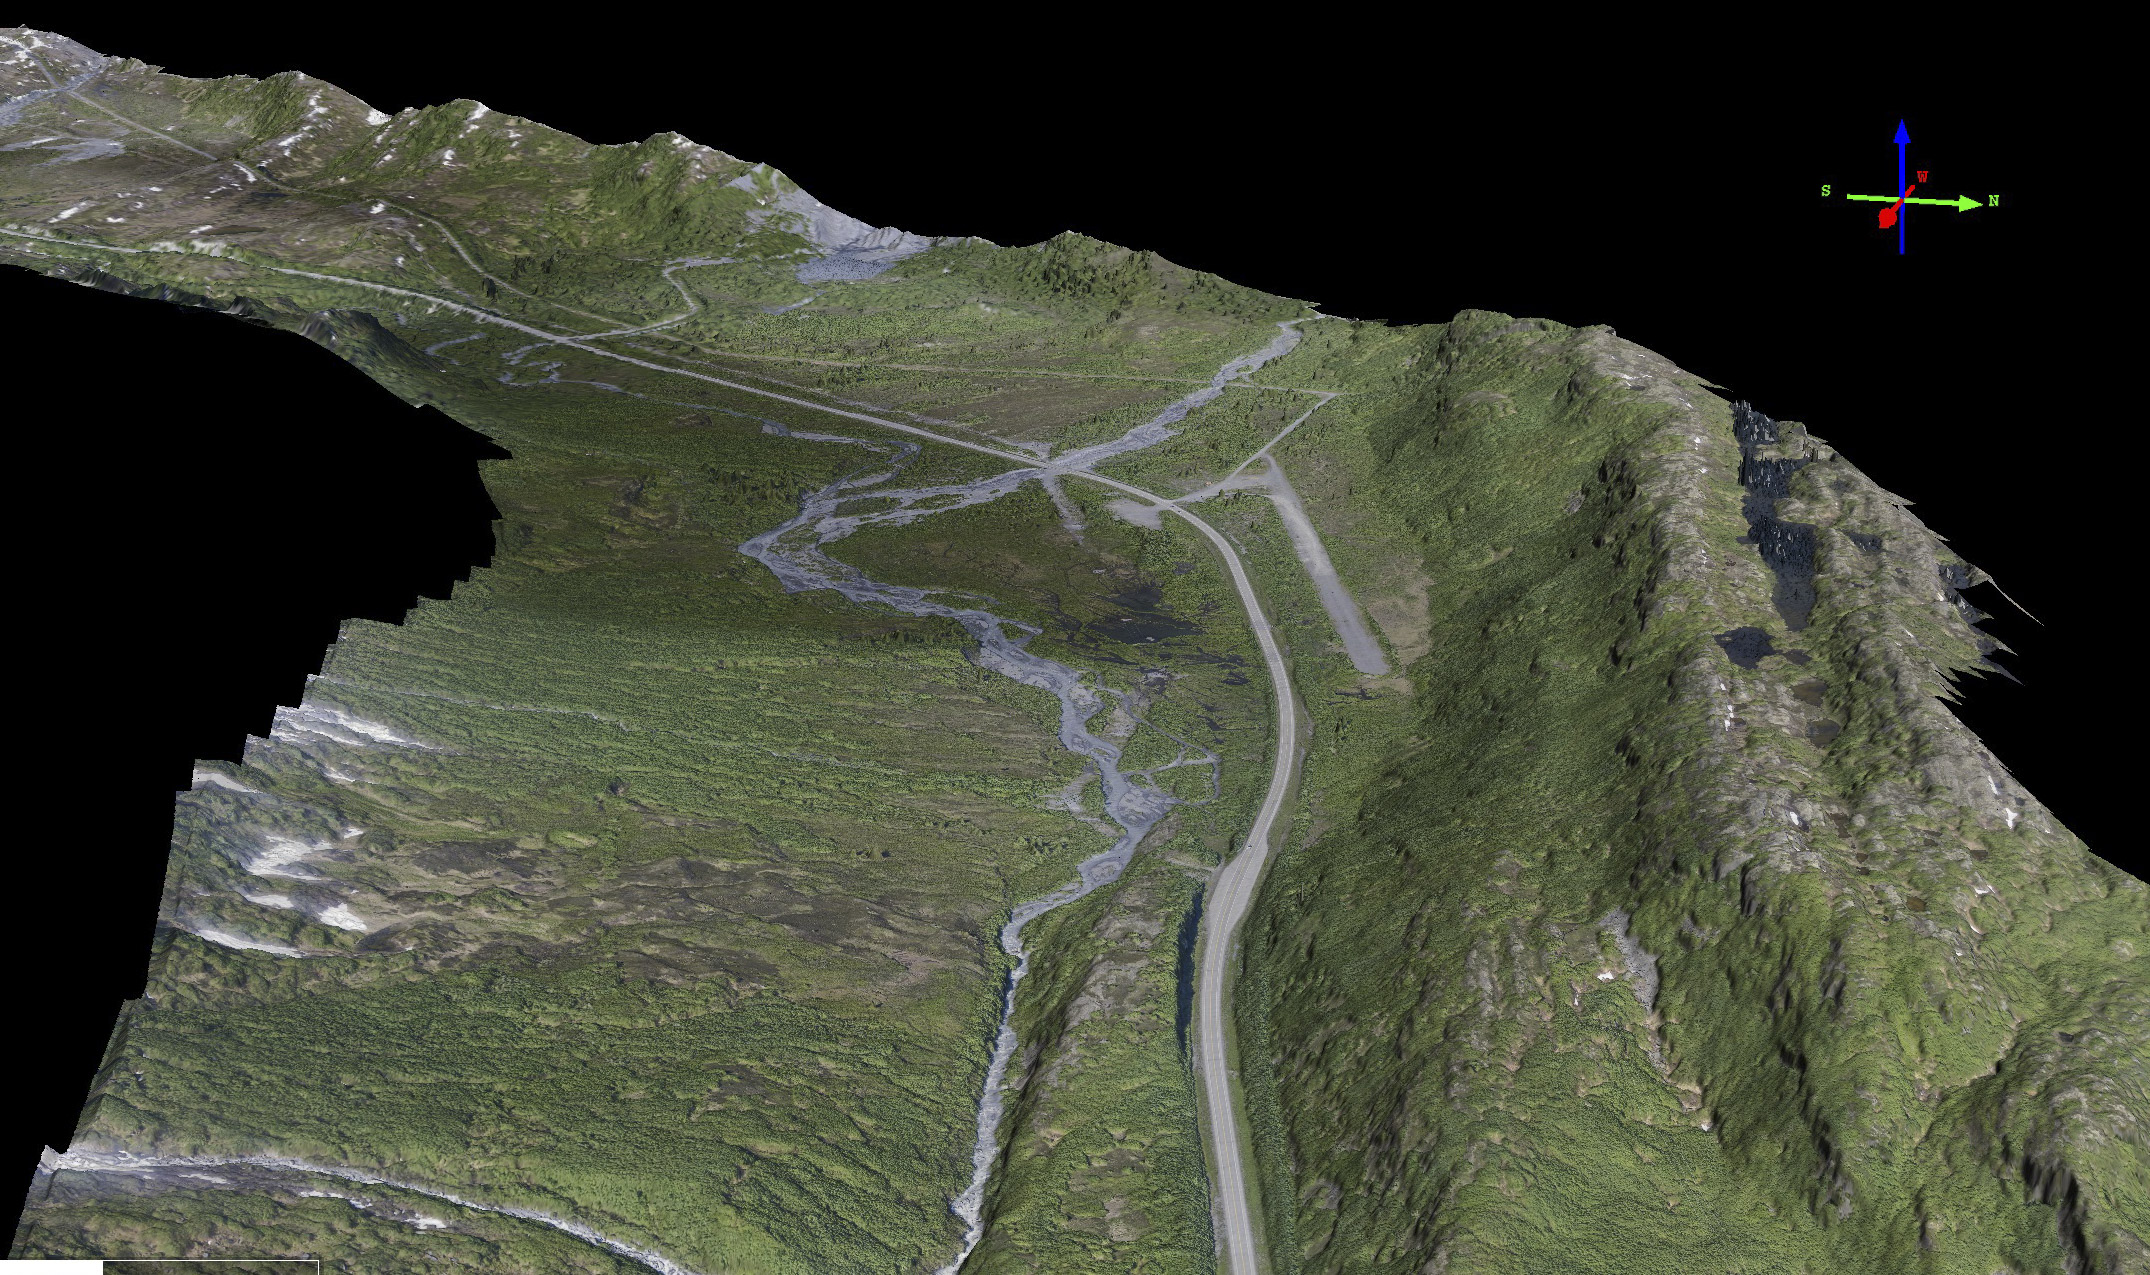
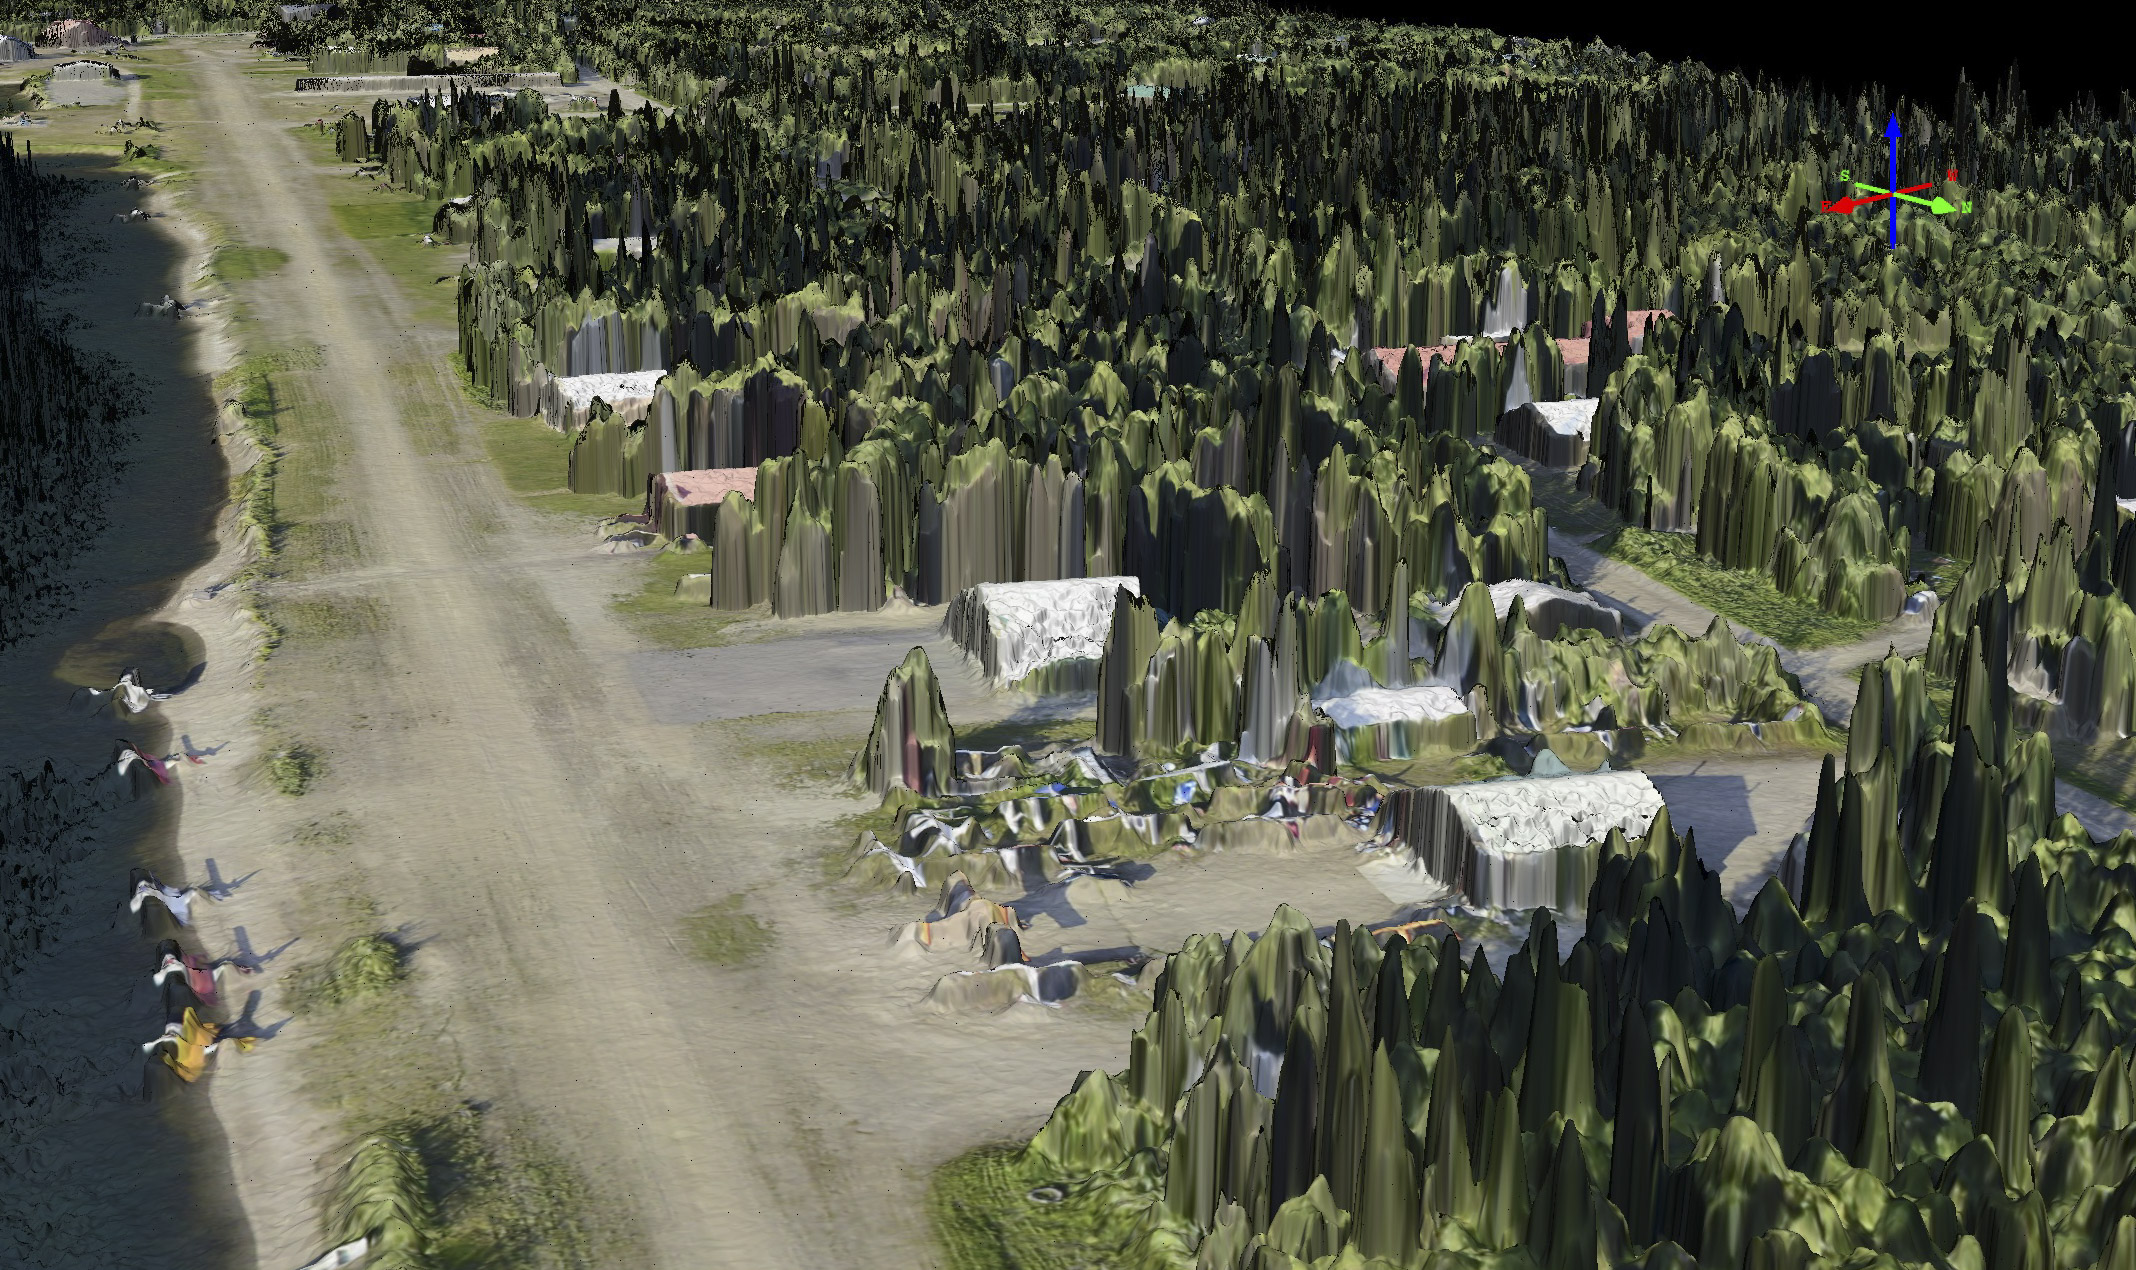
There’s also a small airstrip near the top of the pass. Apparently it gets used pretty often, as the pass is often shut down. A bit sketchy for my tastes, but nice to know its there.
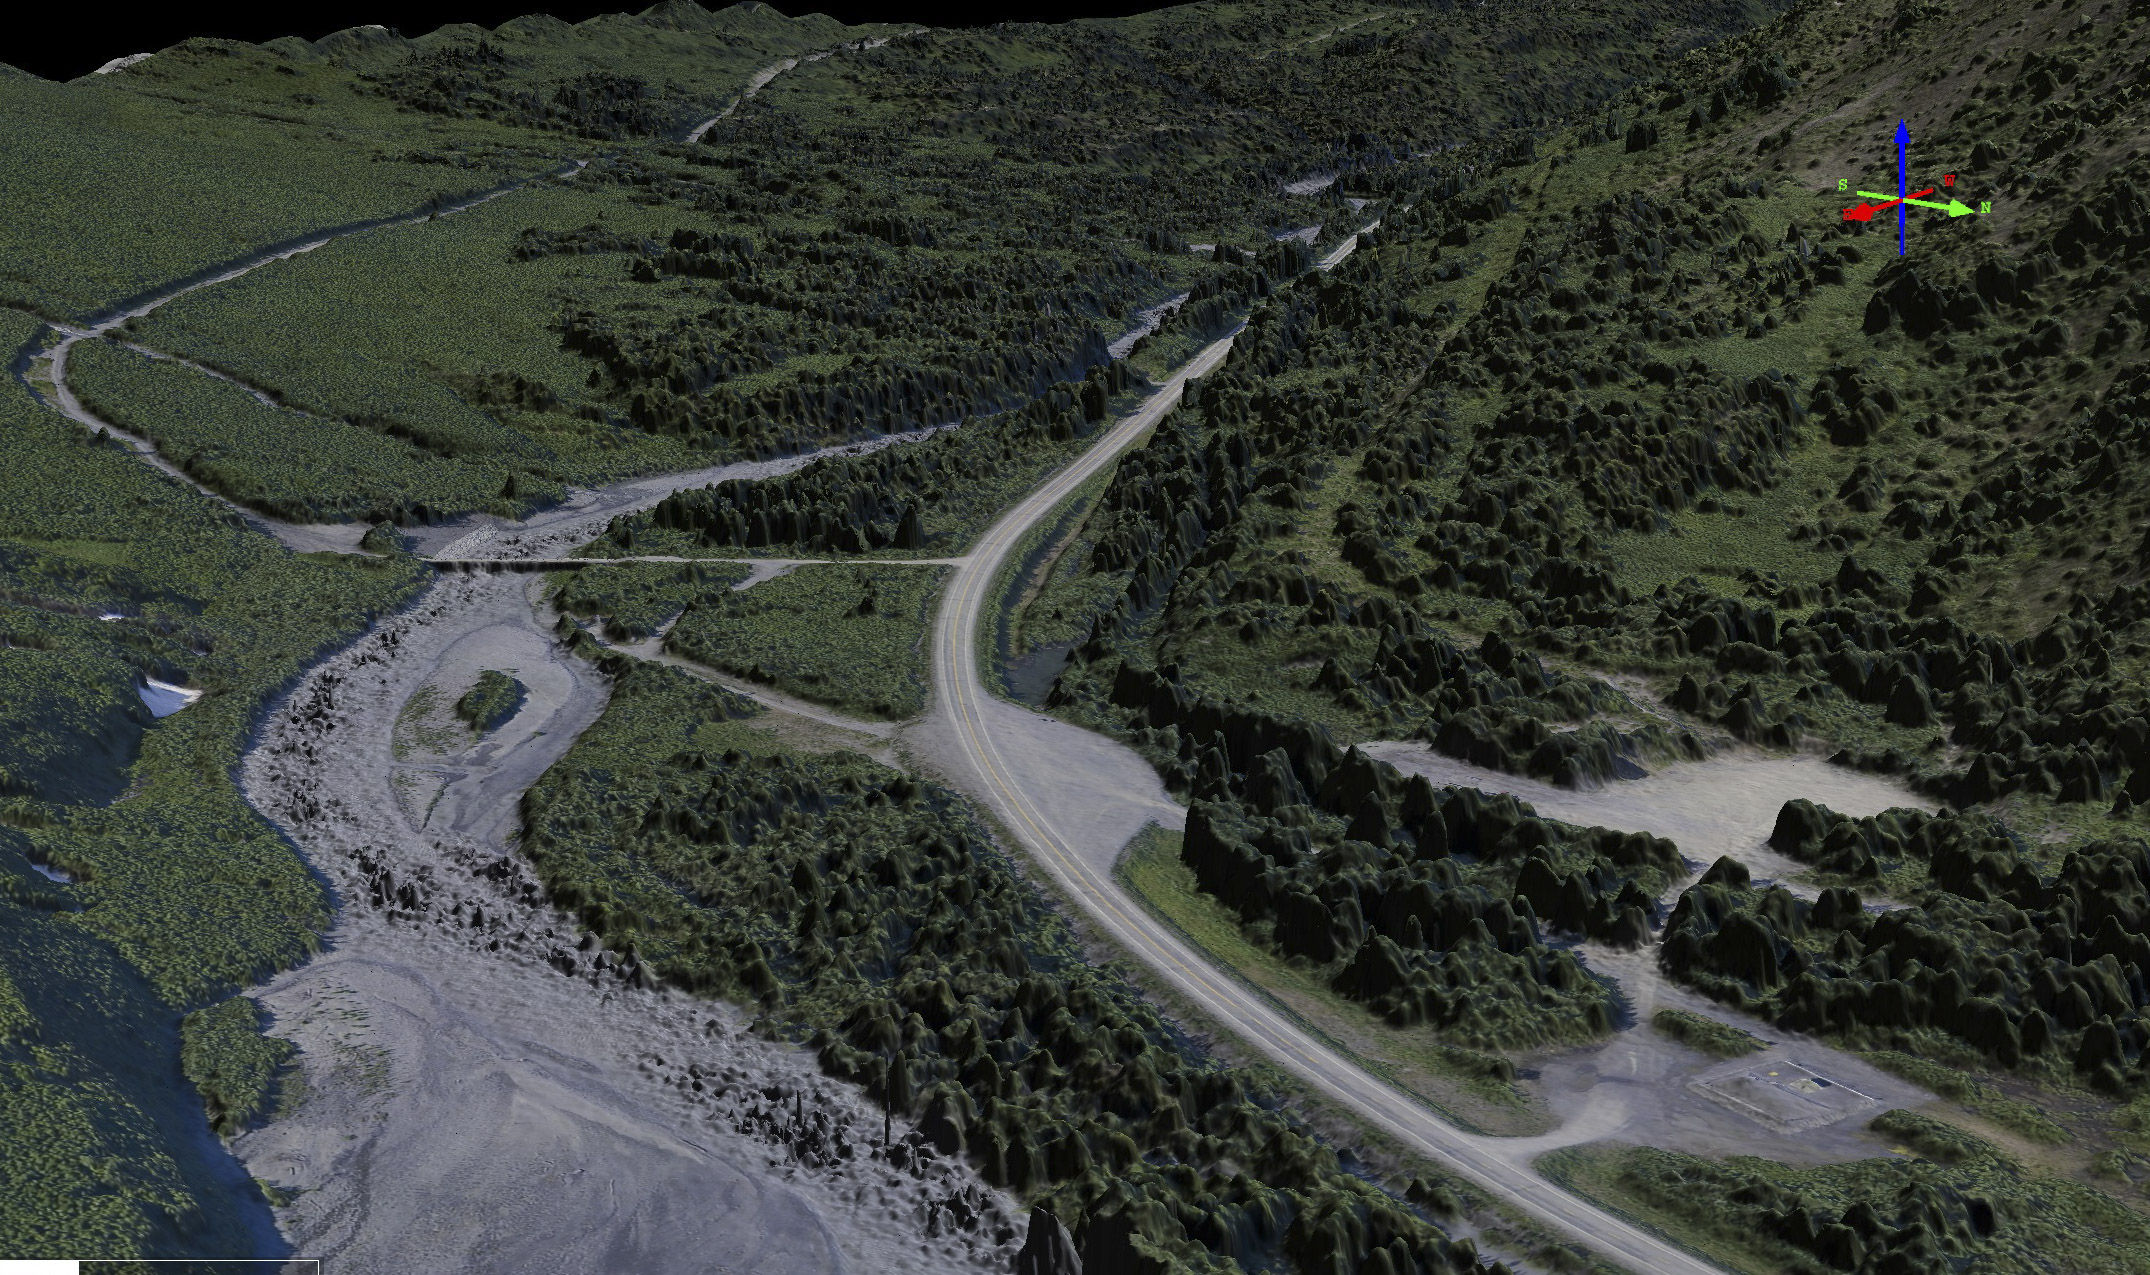
One of the many side streams the road and pipeline have to cross.
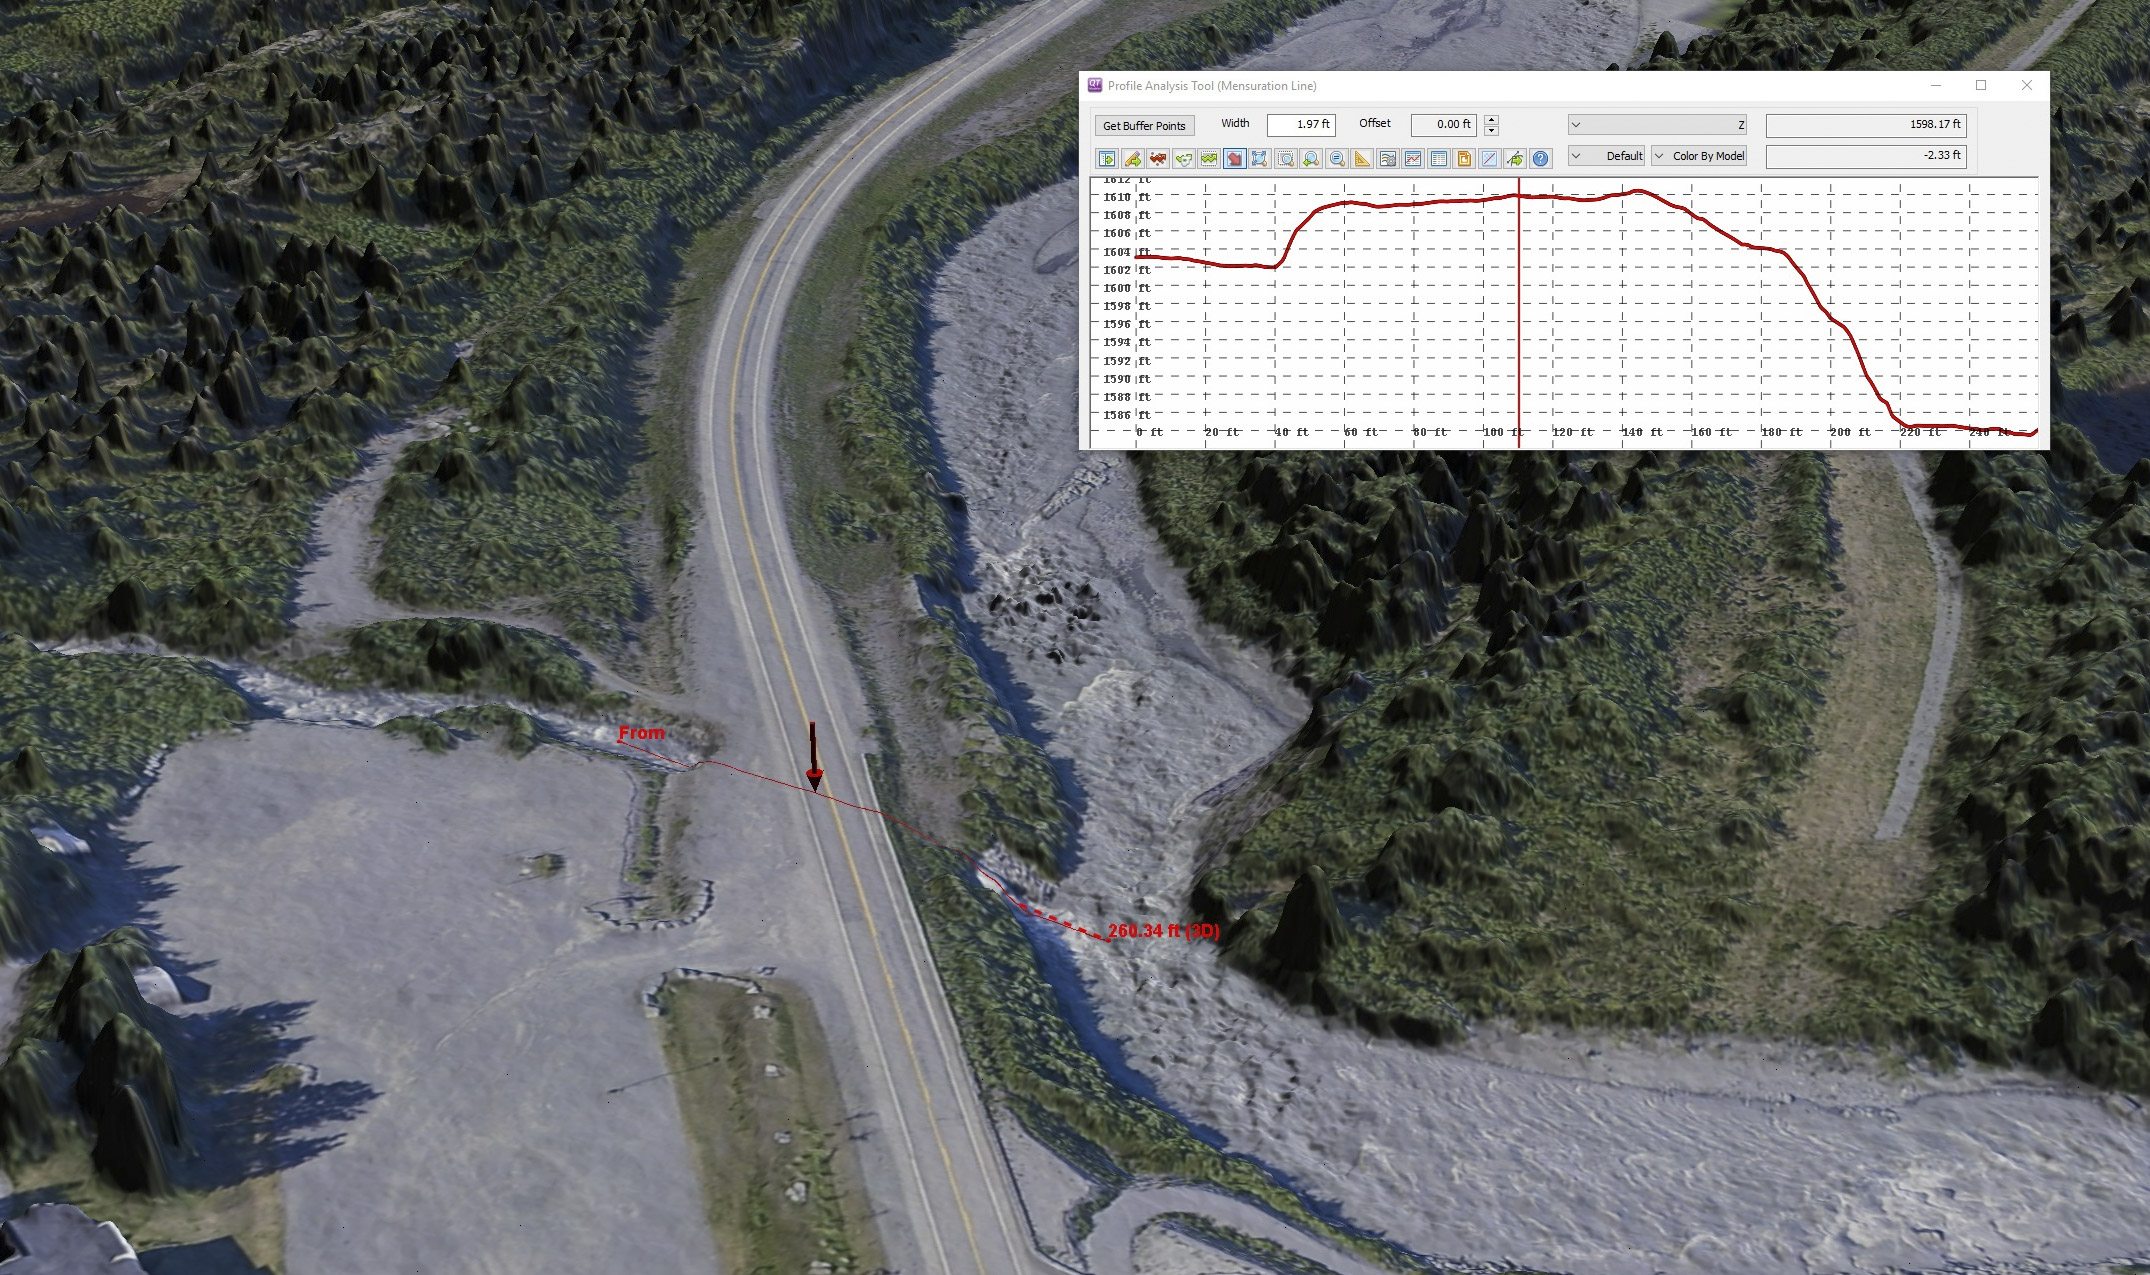
We can measure the water drop, culvert erosion, and winter aufeis growth with fodar.
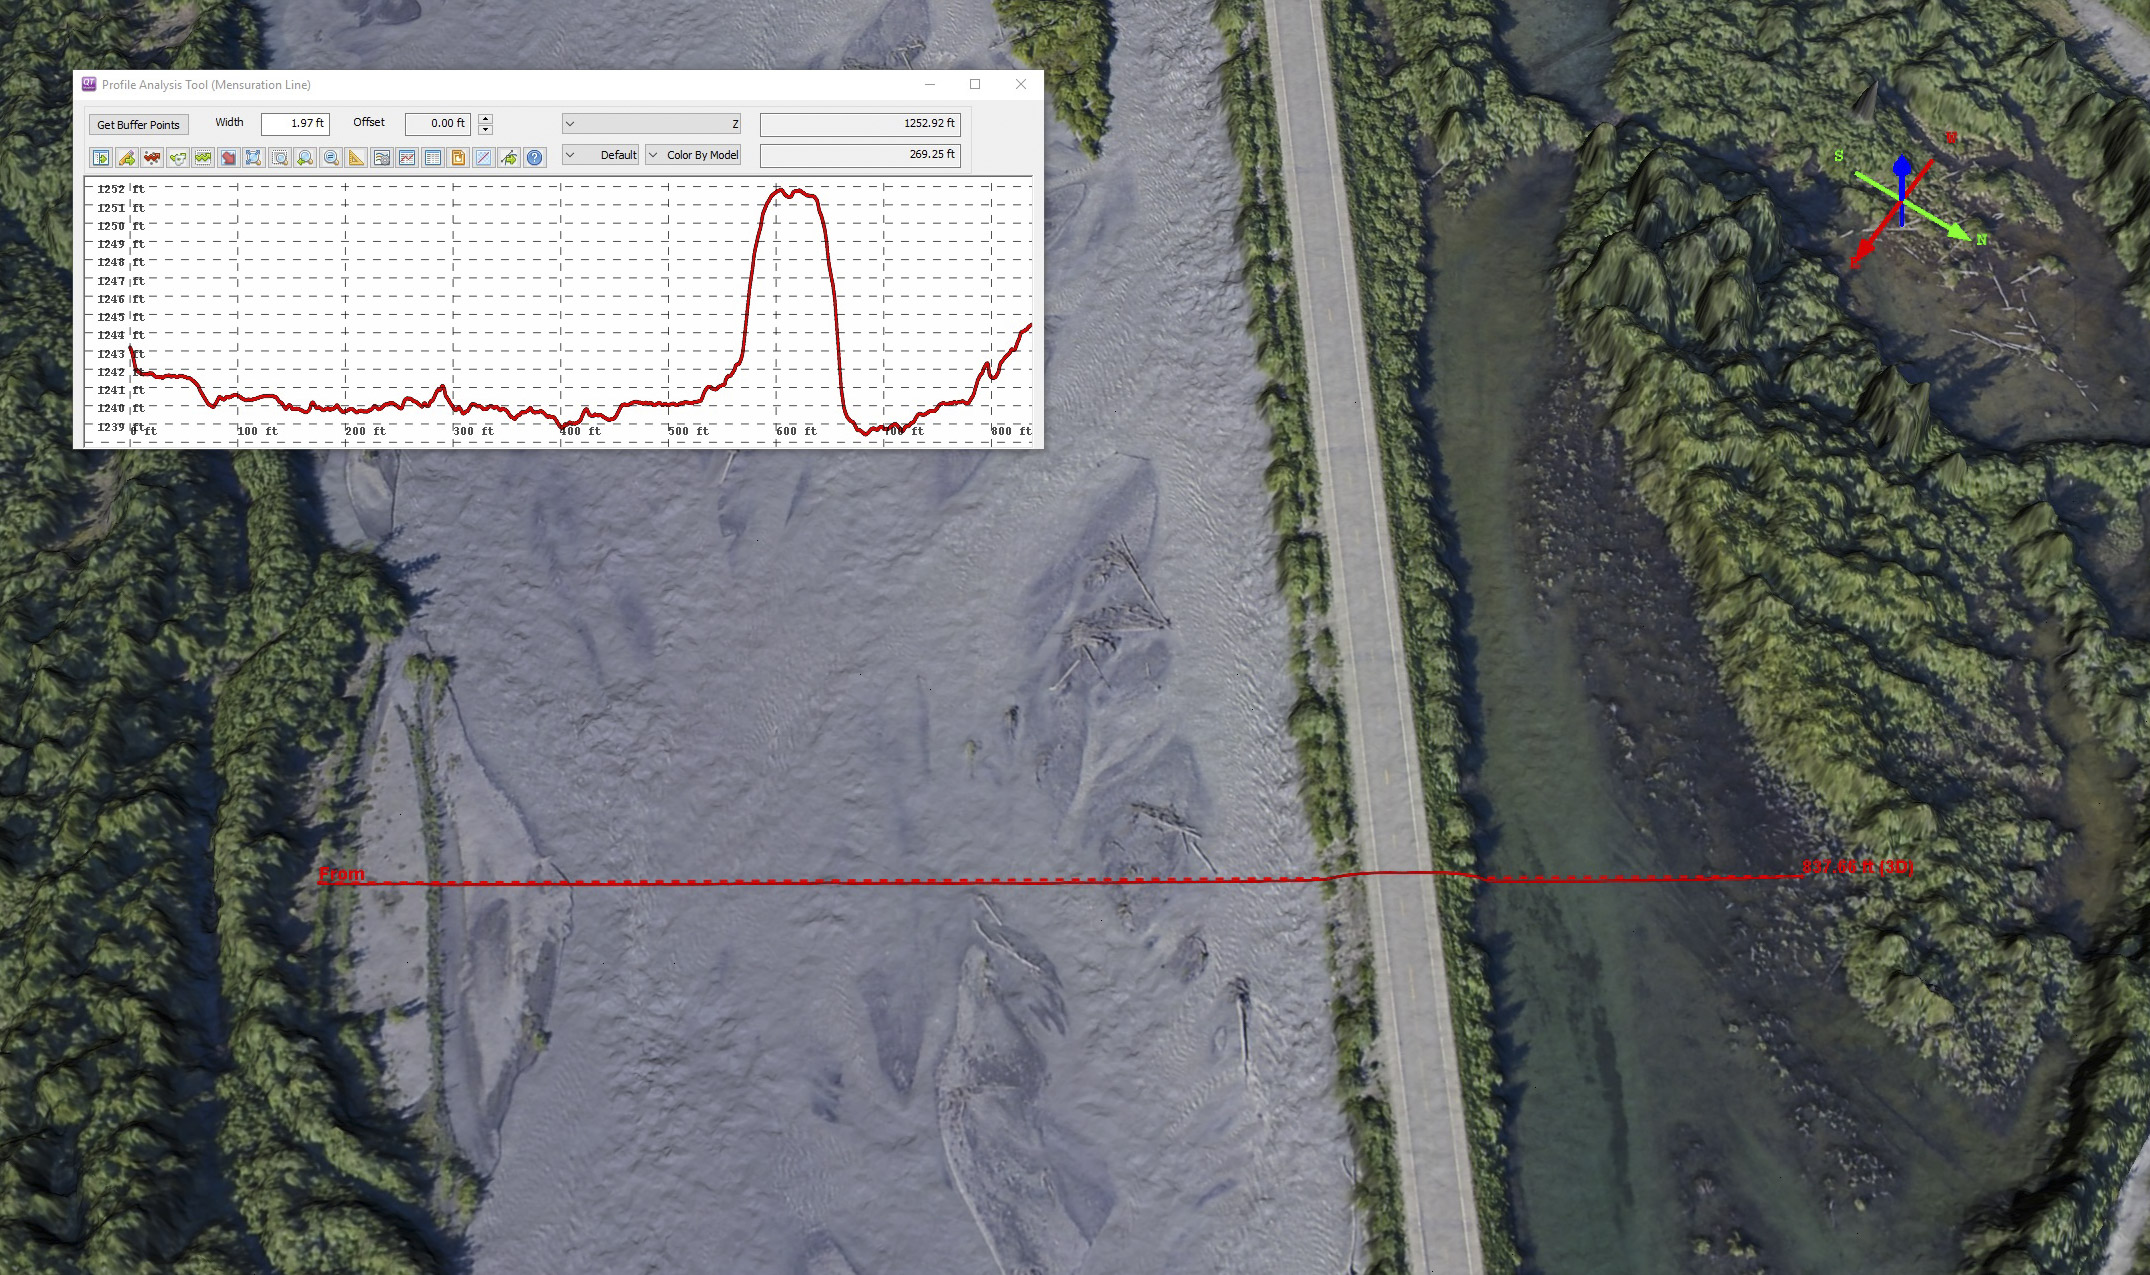
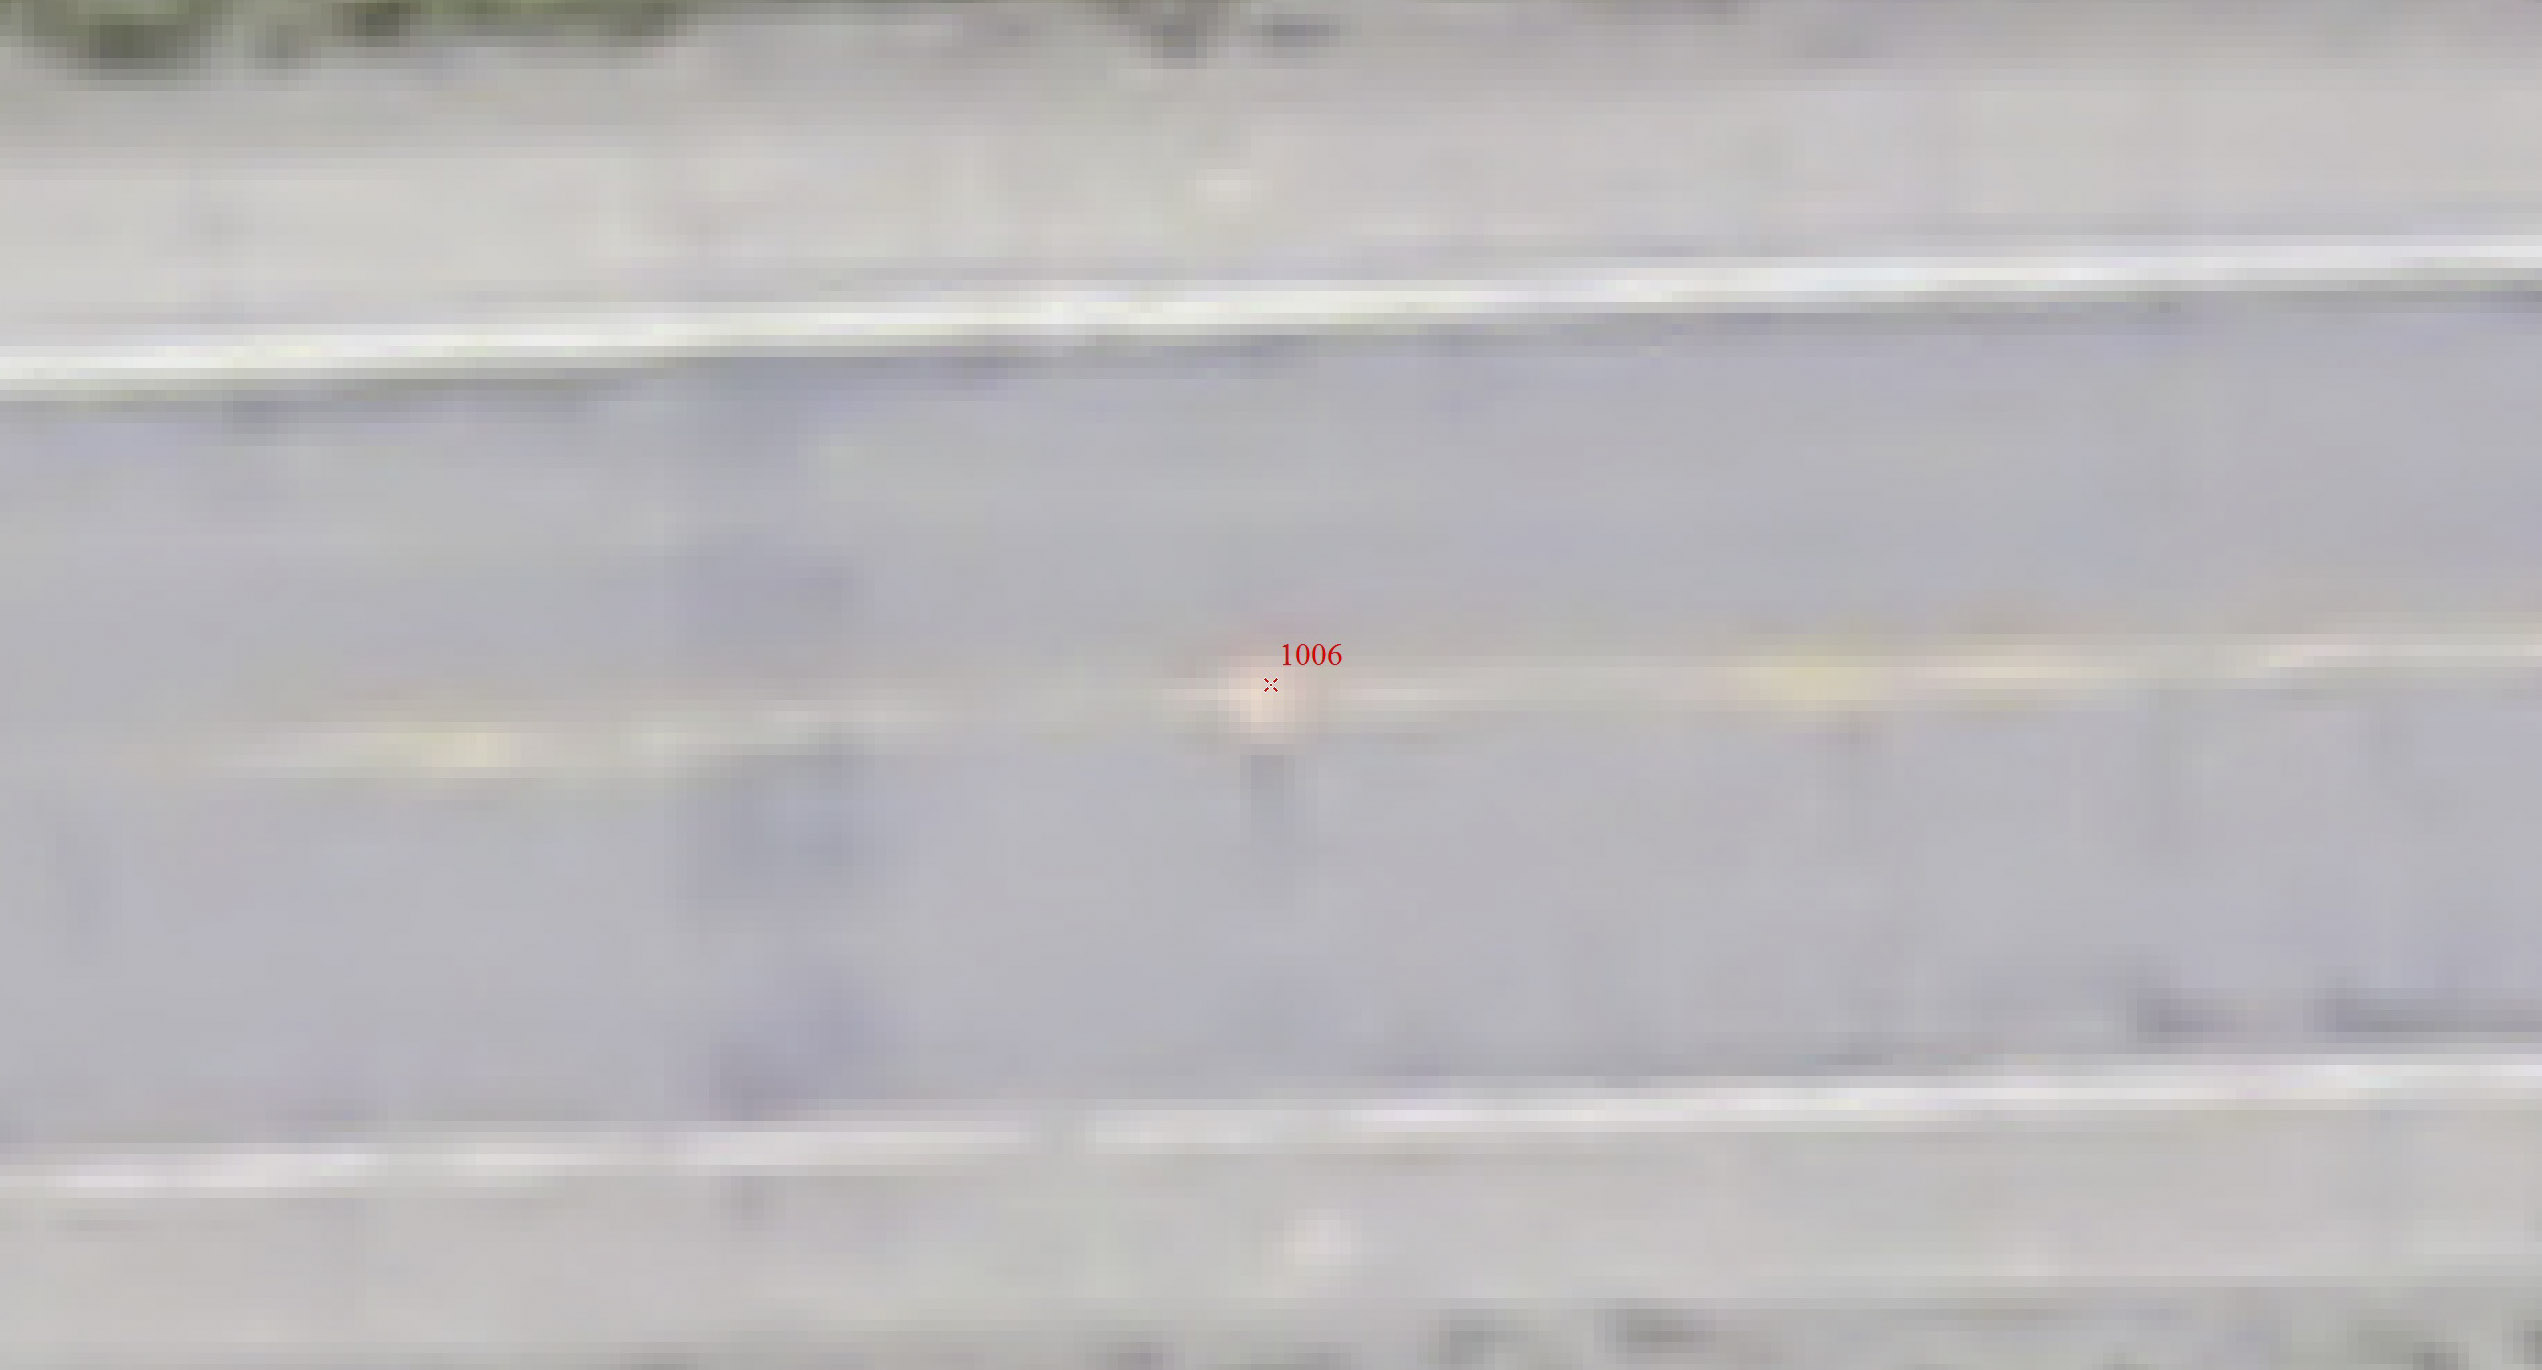
At places the road was near stream grade, on both sides.
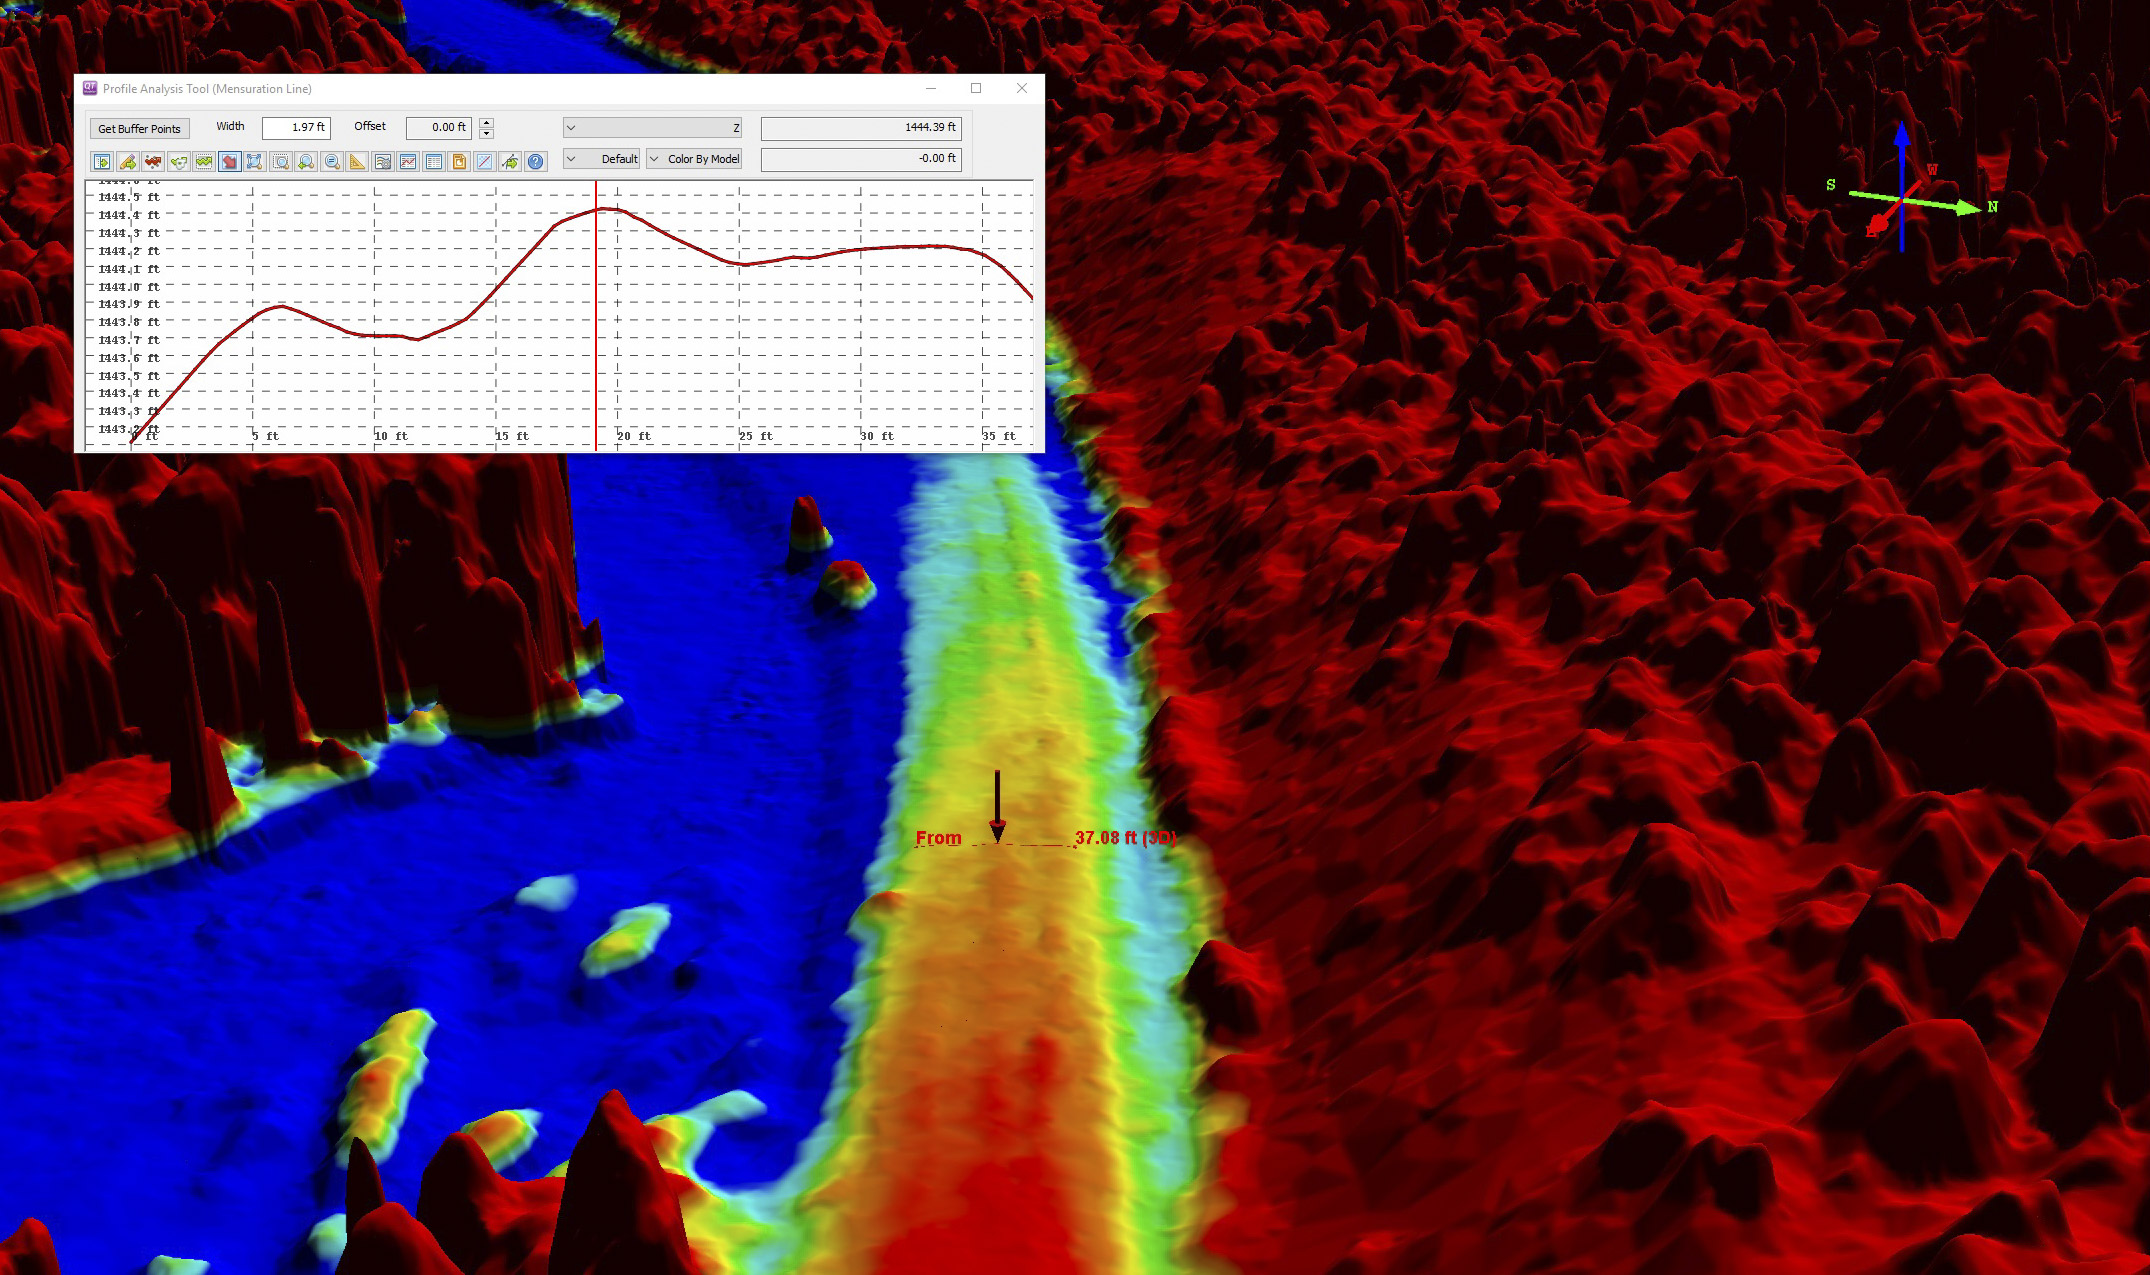
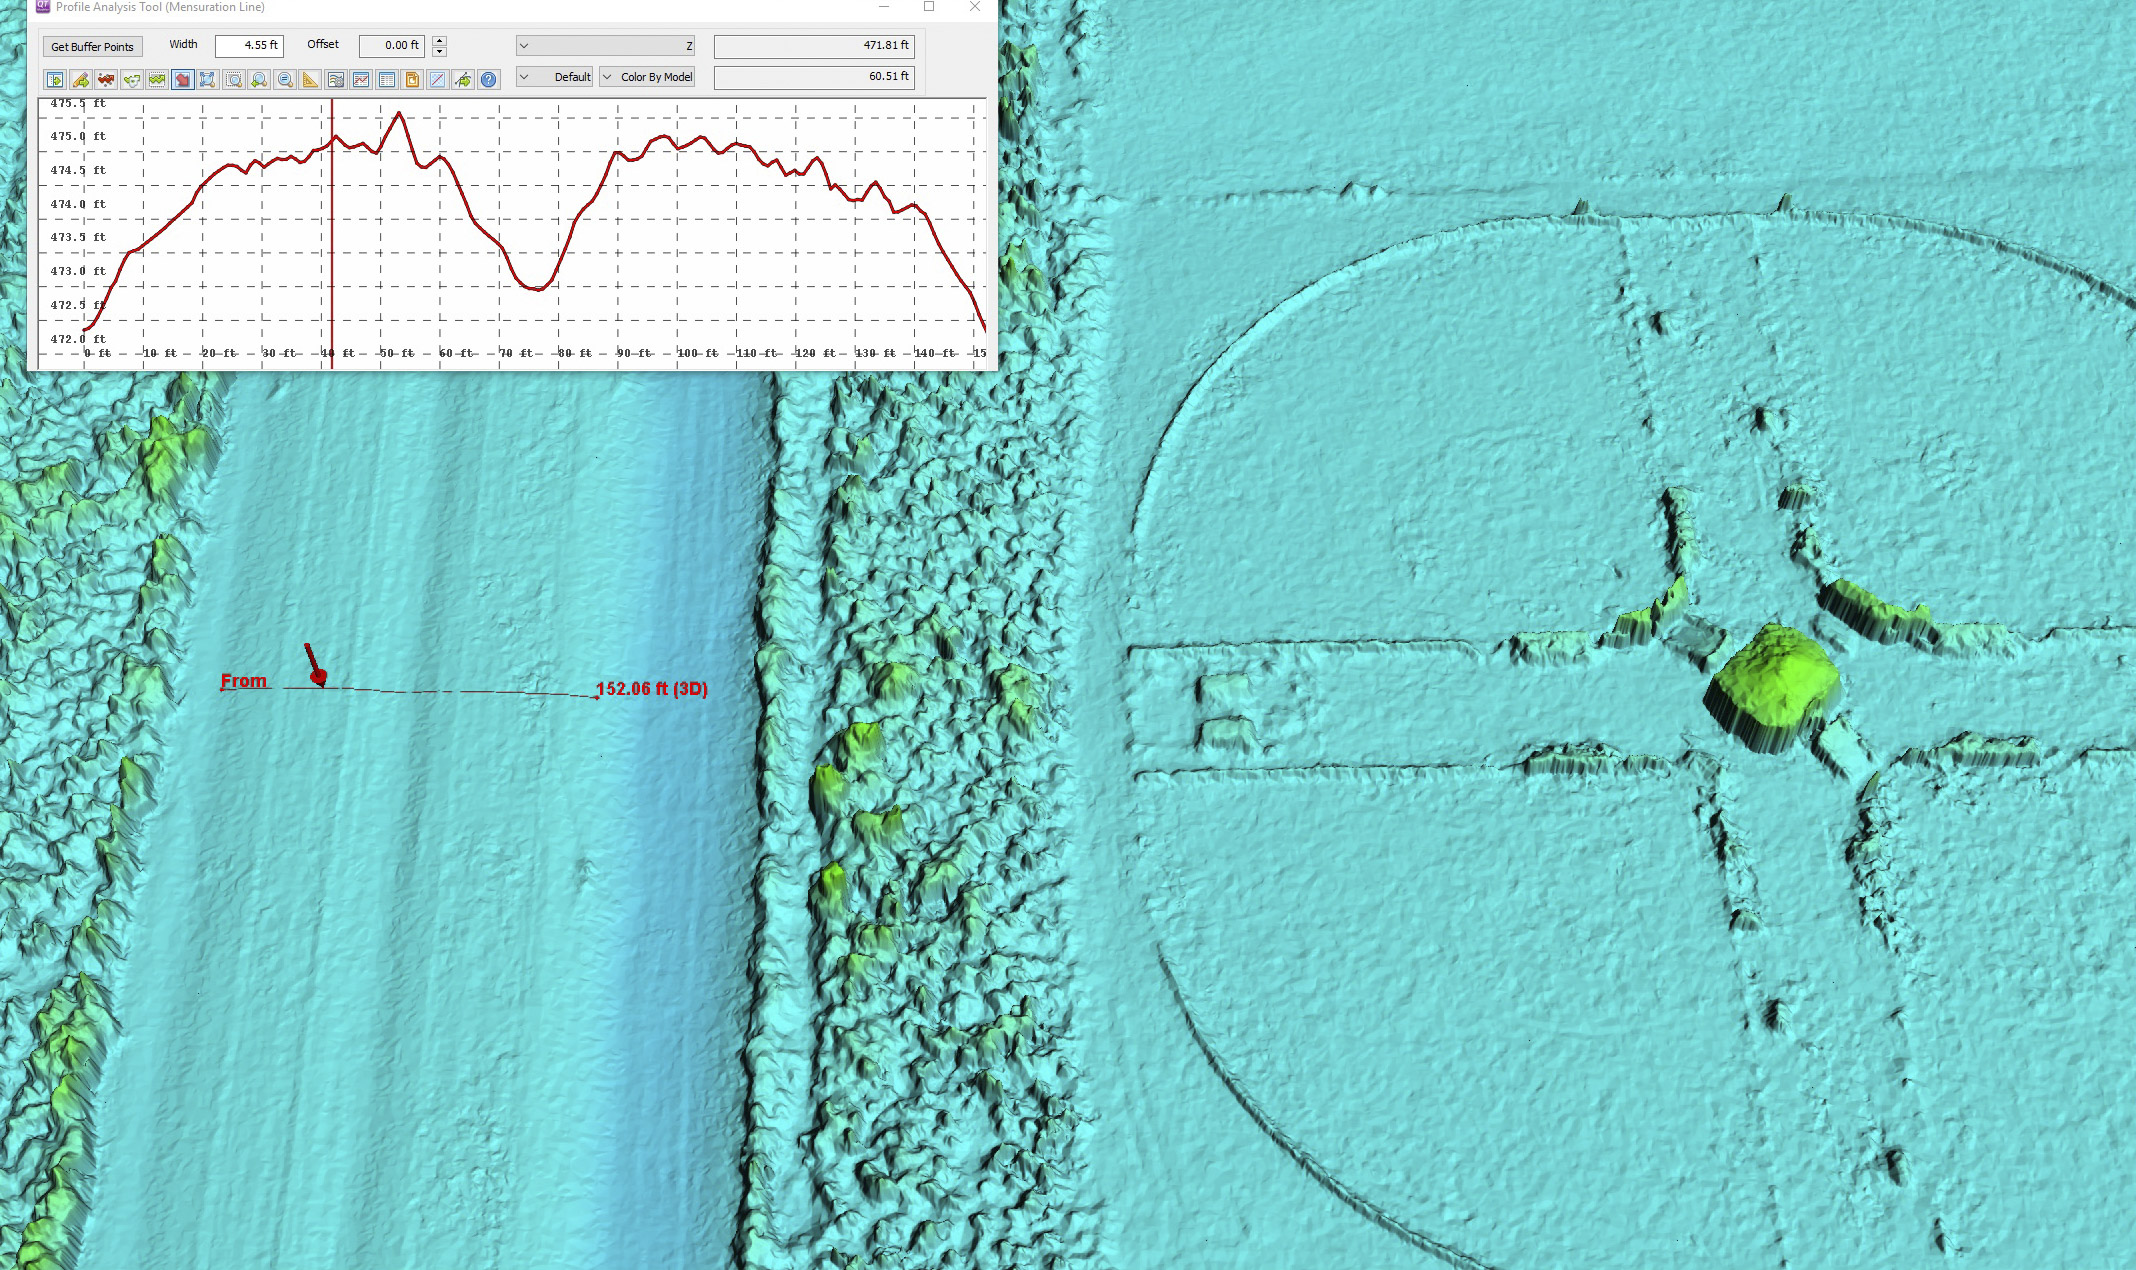
We can measure road crowns and breaklines easily. Those are 1.2 inch vertical tick marks. Note the river side of the road is a few inches lower — either the trucks are heavier coming this direction or the shoulder is starting to blow out, or both.
The valley has many shadows being so steep, but this did not prevent acquiring quality data. Mouse-over to see the colorized terrain.
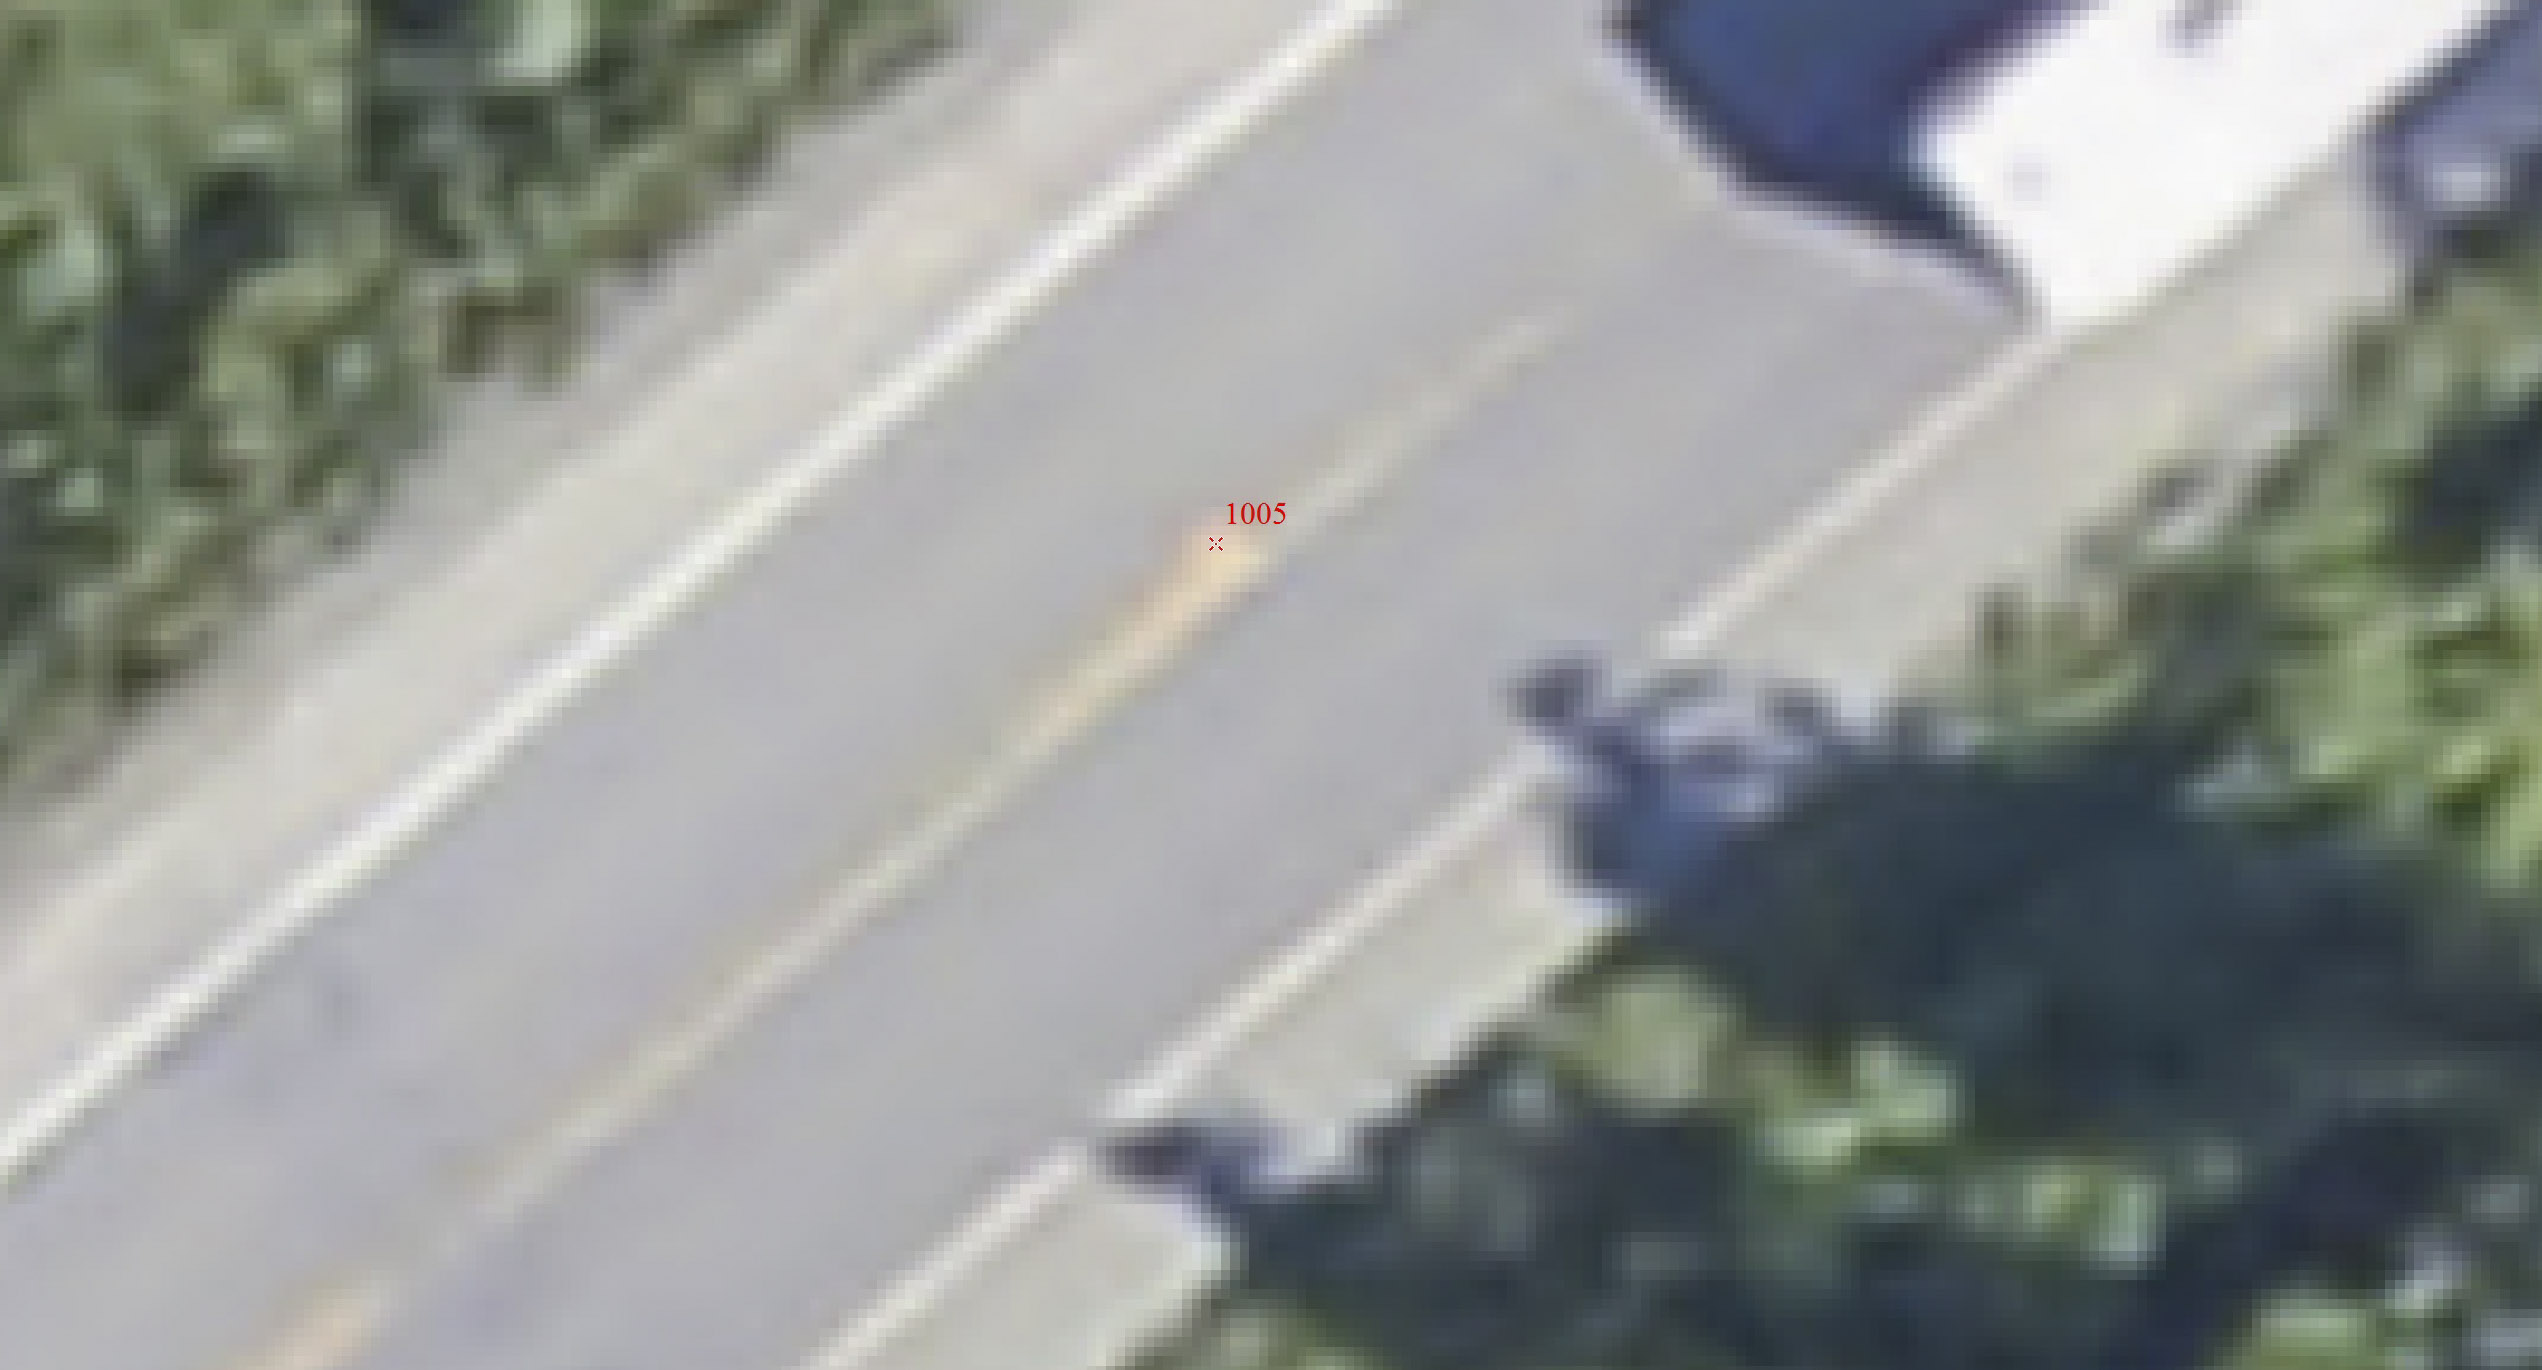
Here is one of the ground control points. Spot on, like normal.
Another one.
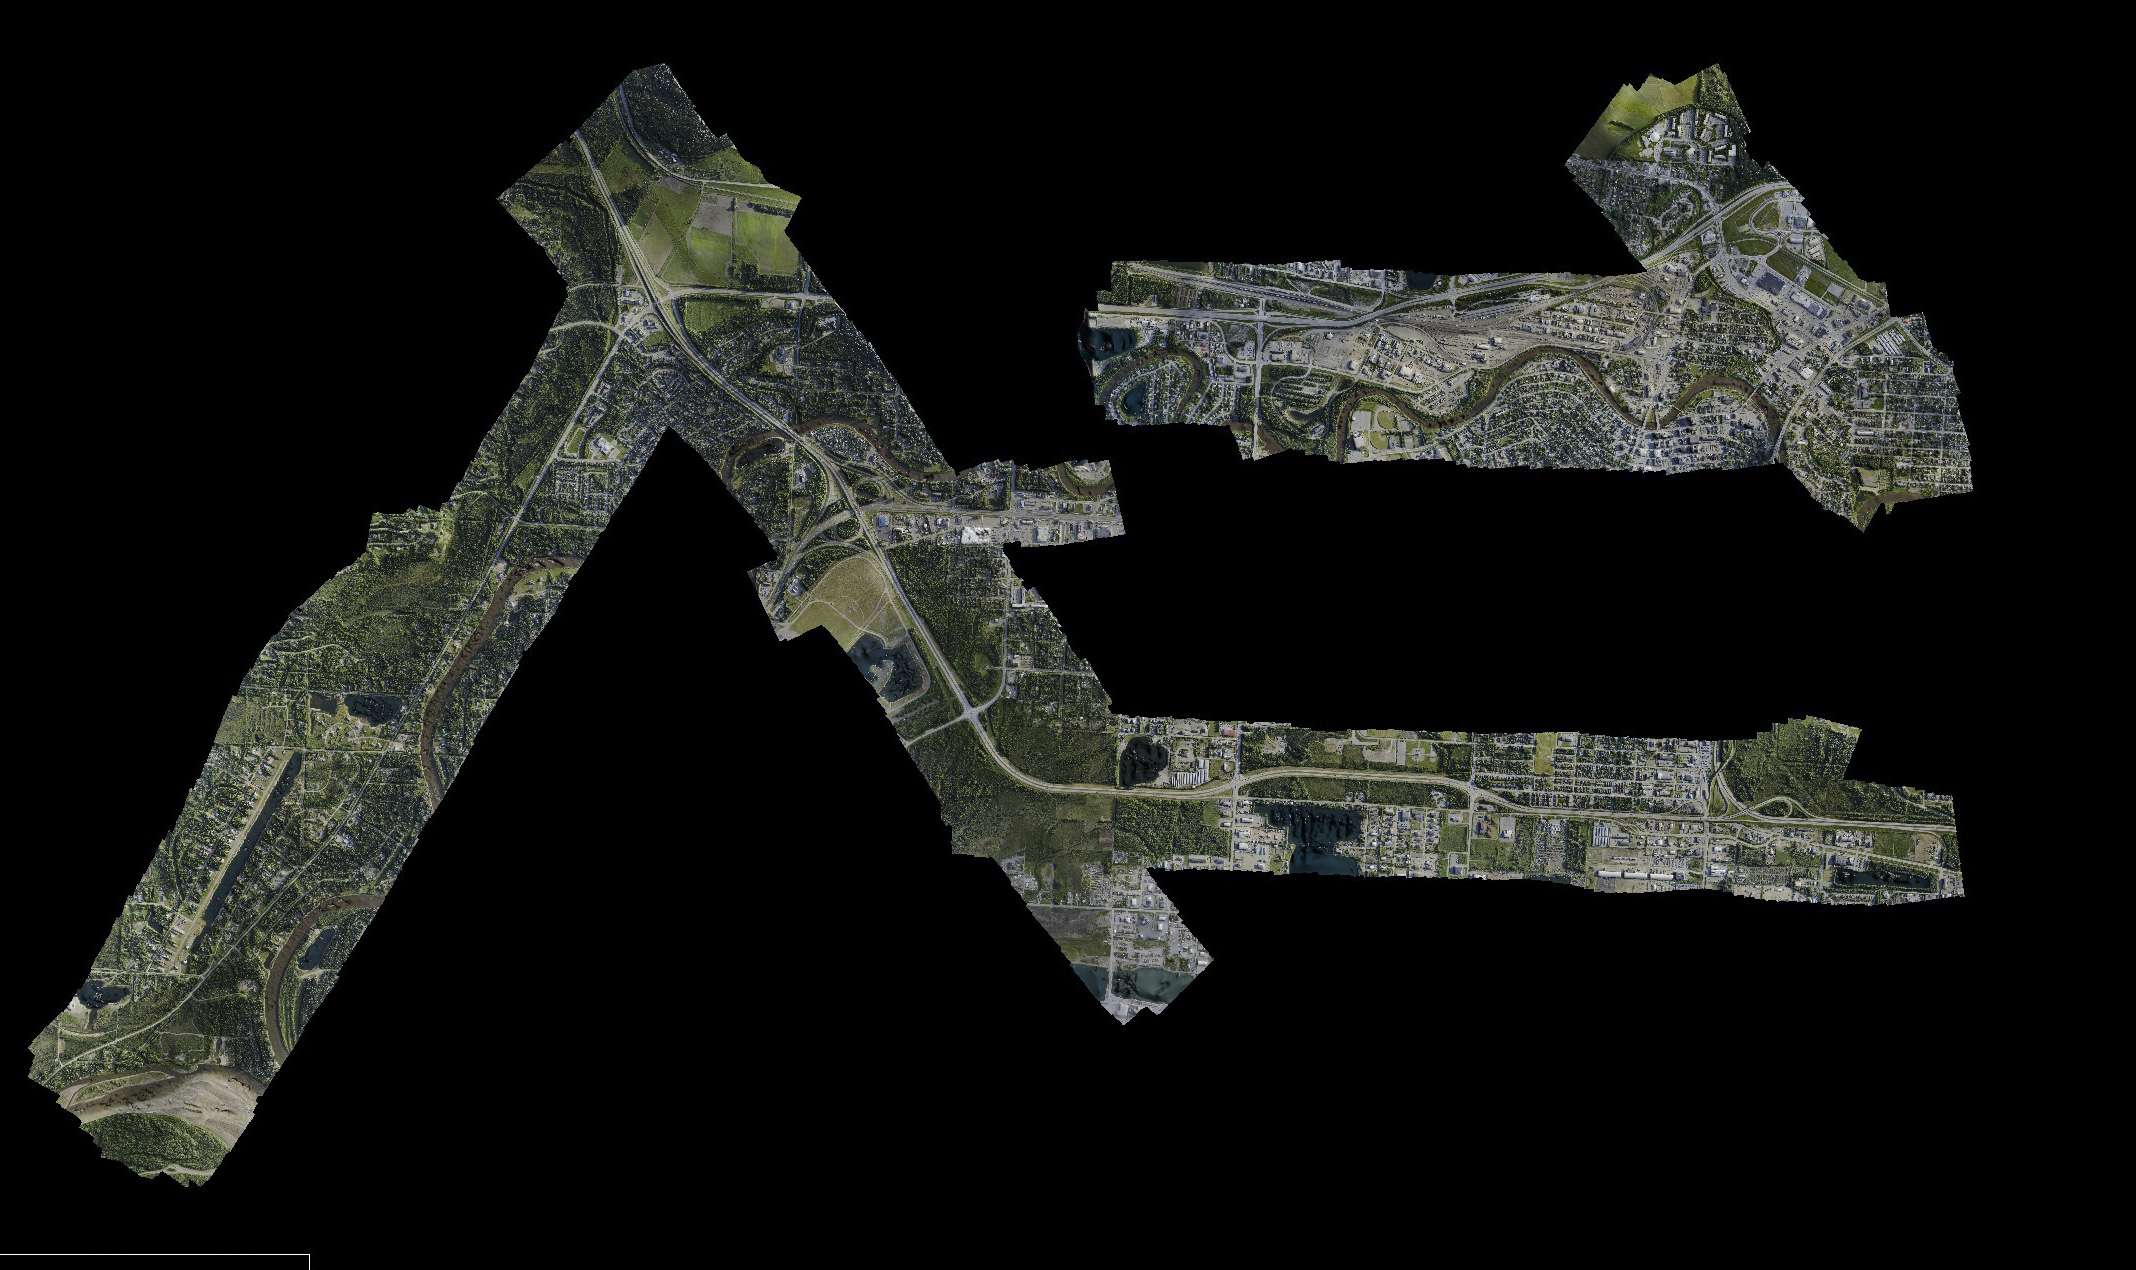
The Fairbanks study area. The main goal here was to support road improvement again.
The overpass of the Mitchell Expressway and Geist.
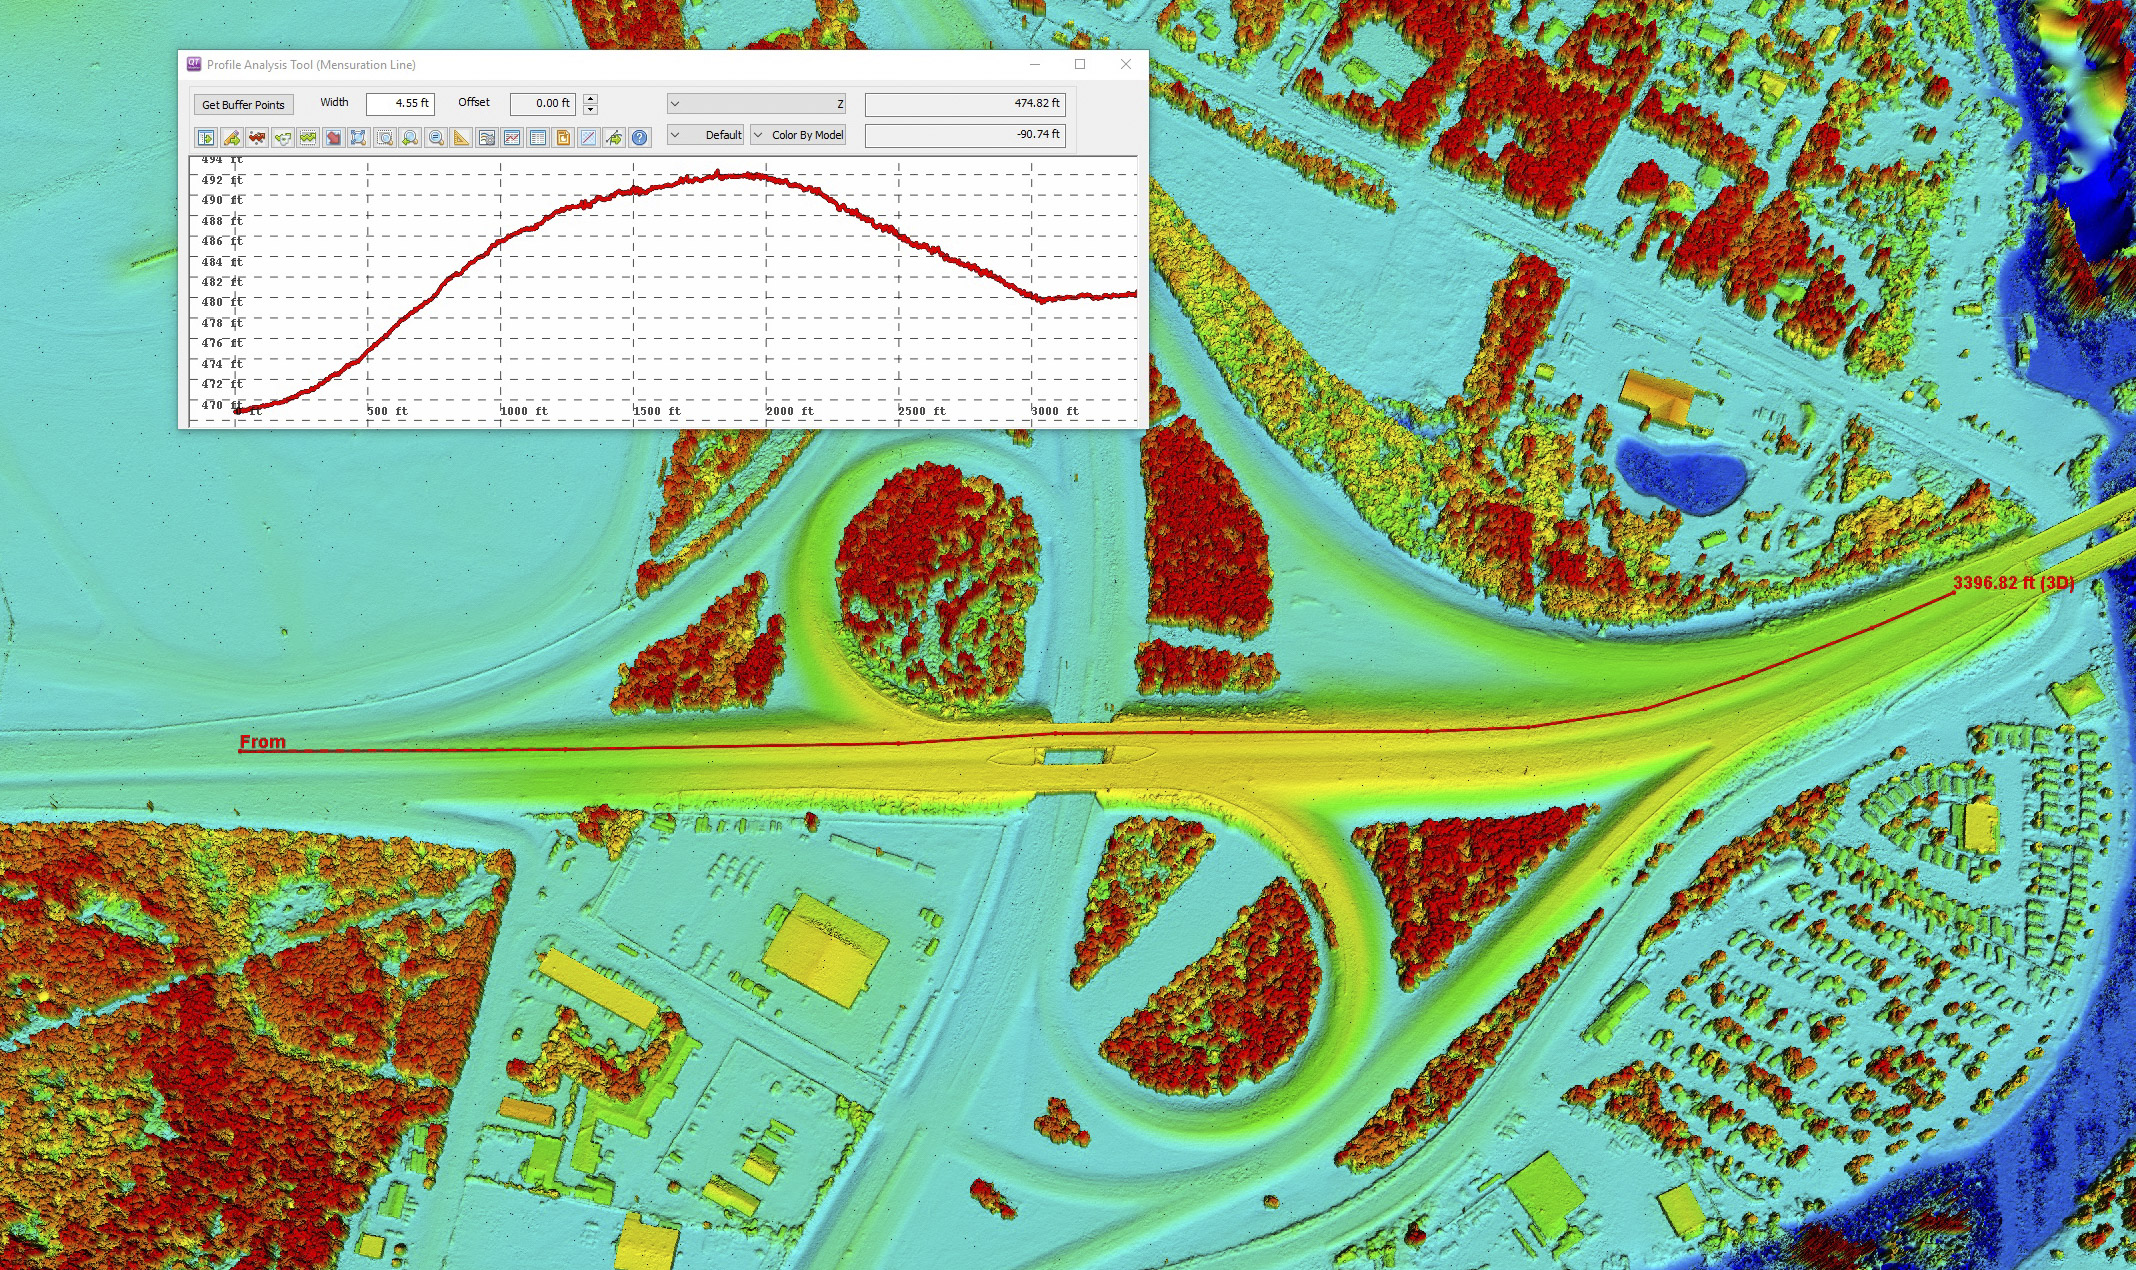
We can make any measurements we like, here showing the overpass elevations. Those are 2′ vertical ticks.
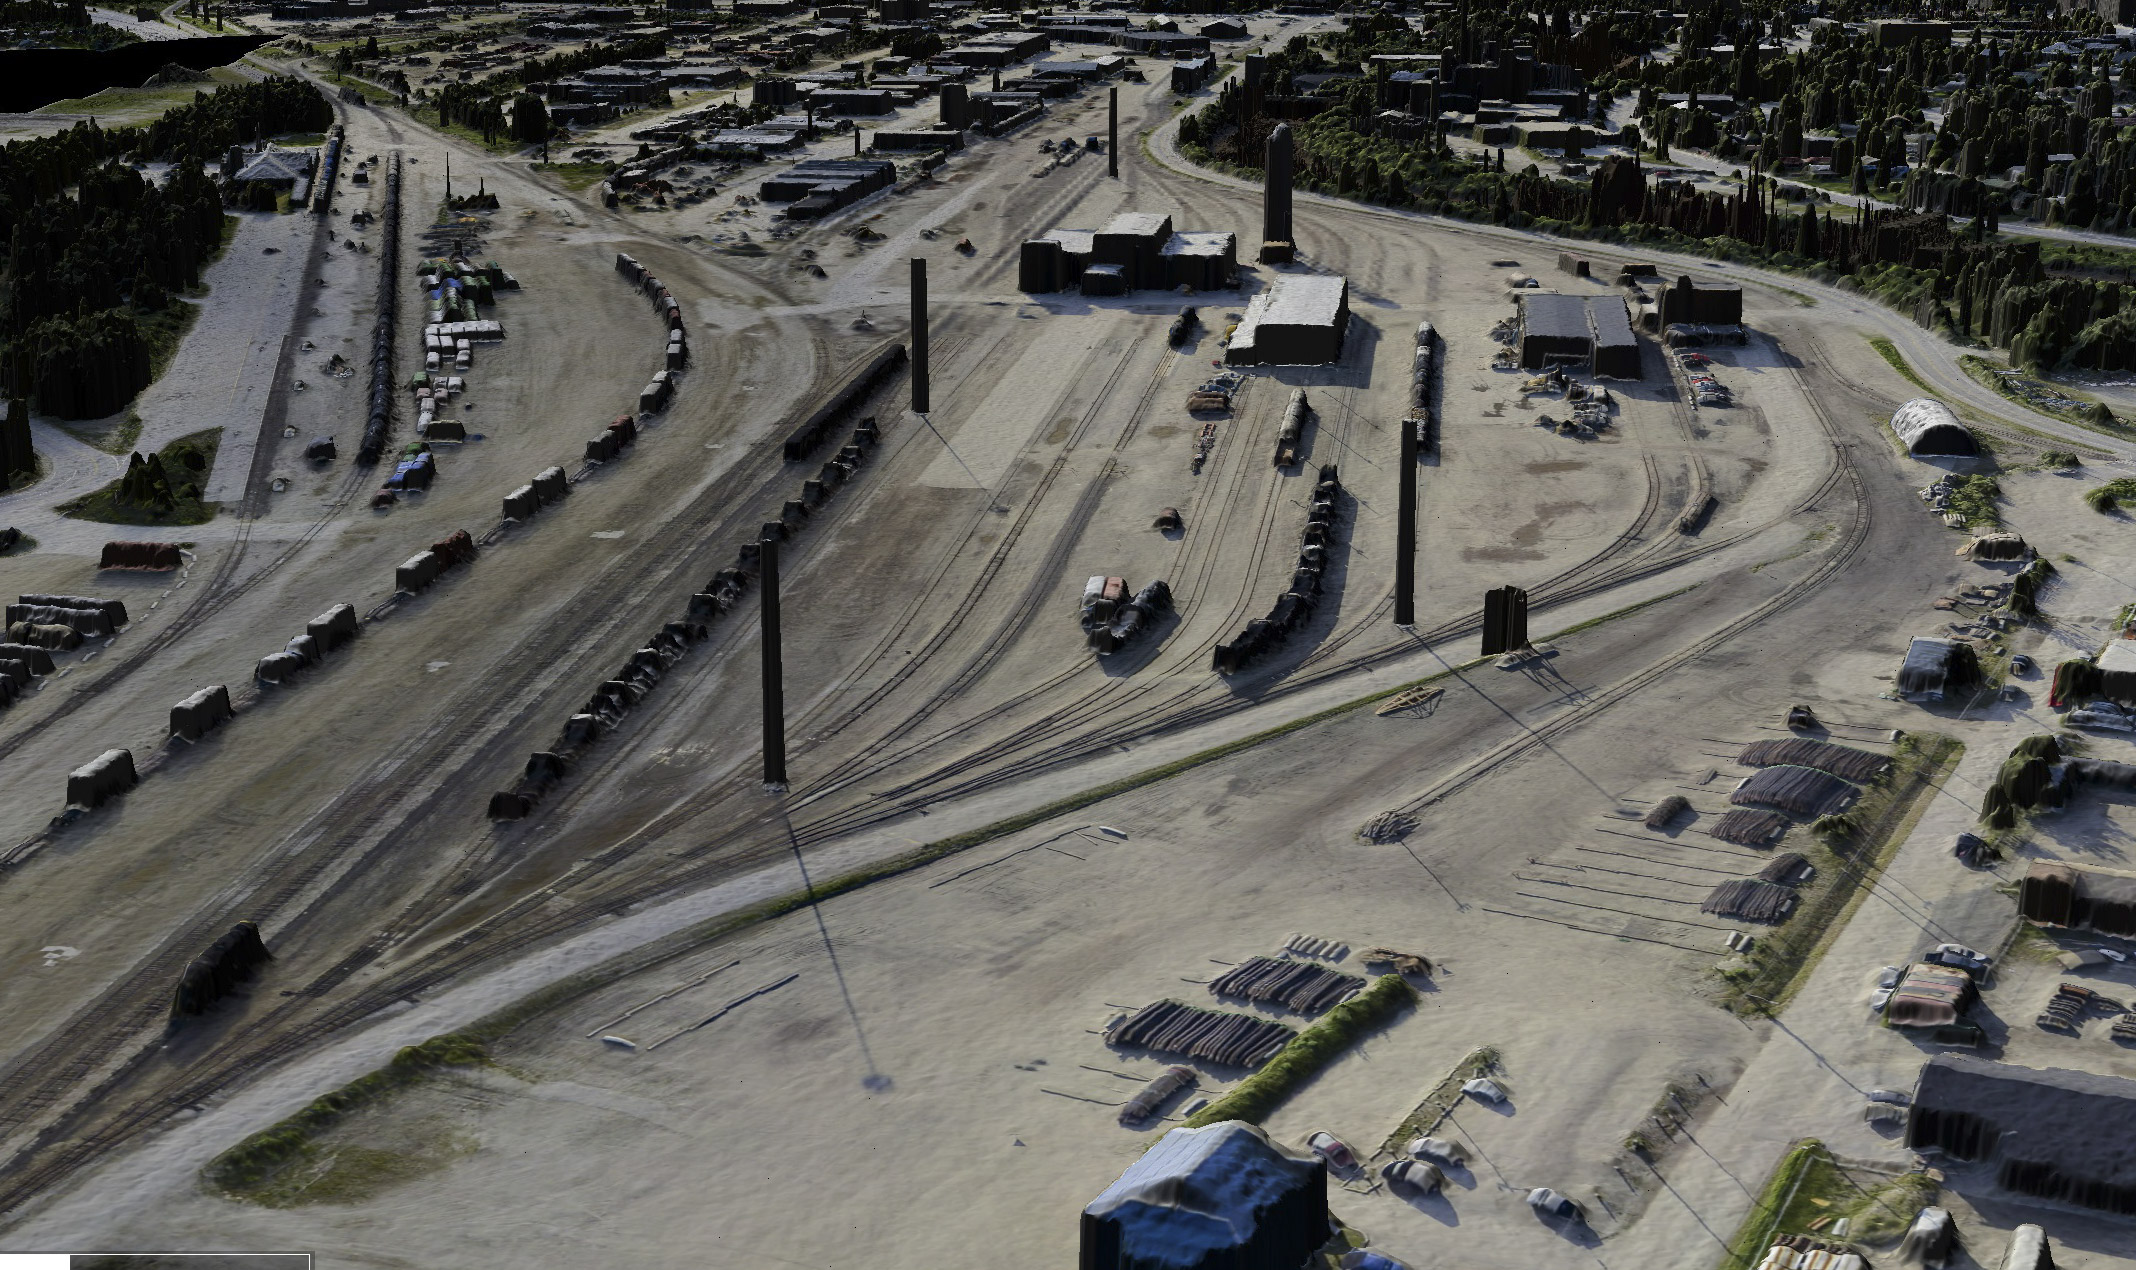
The train station. Trains and train tracks are easily resolved. Note the piles of logs in the foreground — the topography of the dunnage used for the bunks can be seen in the empty ones. Mouse-over to see the topography.
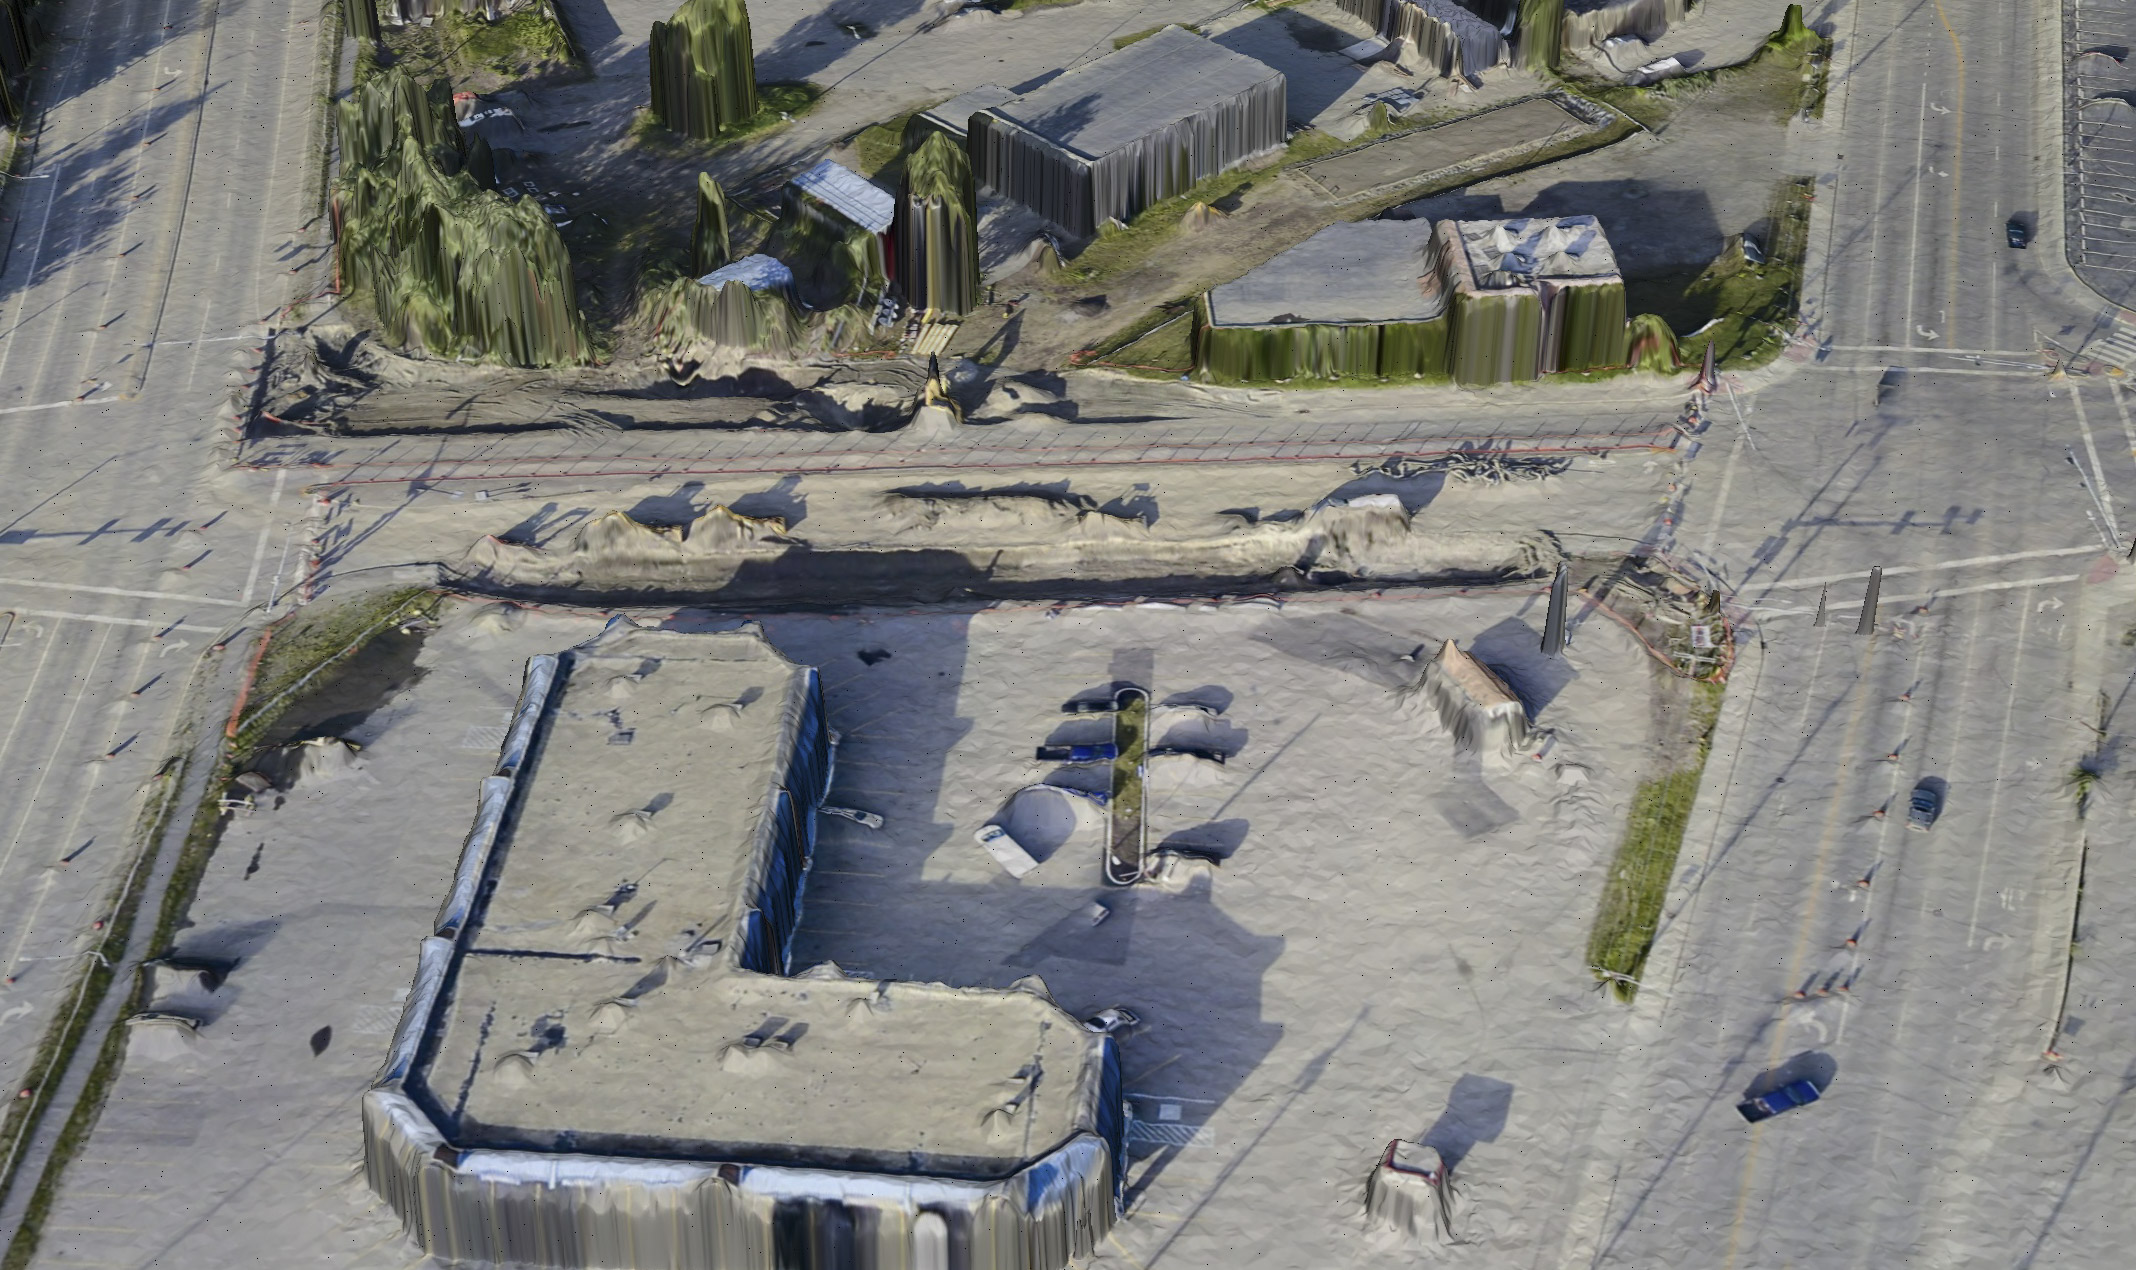
A construction project.
 Here you can see more road crowns, and even the guard rail to the right of the arrow.
Chena Marina, a nice place to land and eat Doritos.