New GCP test at Fairbanks International Airport
My plane had a flat tire on Sunday, so I took the opportunity to collect some ground control points (GCPs) around the ramp to compare to maps I had made there previously. I was a bit concerned that there was perhaps some calibration issue with the system, given the Unalakleet GCPs showed a 20 cm standard deviation with my maps. The airport results demonstrated that things were working just fine, since the airport GCPs showed a standard deviation of less than 2 cm. This means that the high scatter in Unalakleet was likely due to real surface changing since the GCPs were acquired in 2011. As we’ve found in nearly all other studies, at 95% confidence the precision of fodar is about +/- 4 cm. Though harder to quantify, the spatial correlation was pretty much spot on as well, as the images below show.

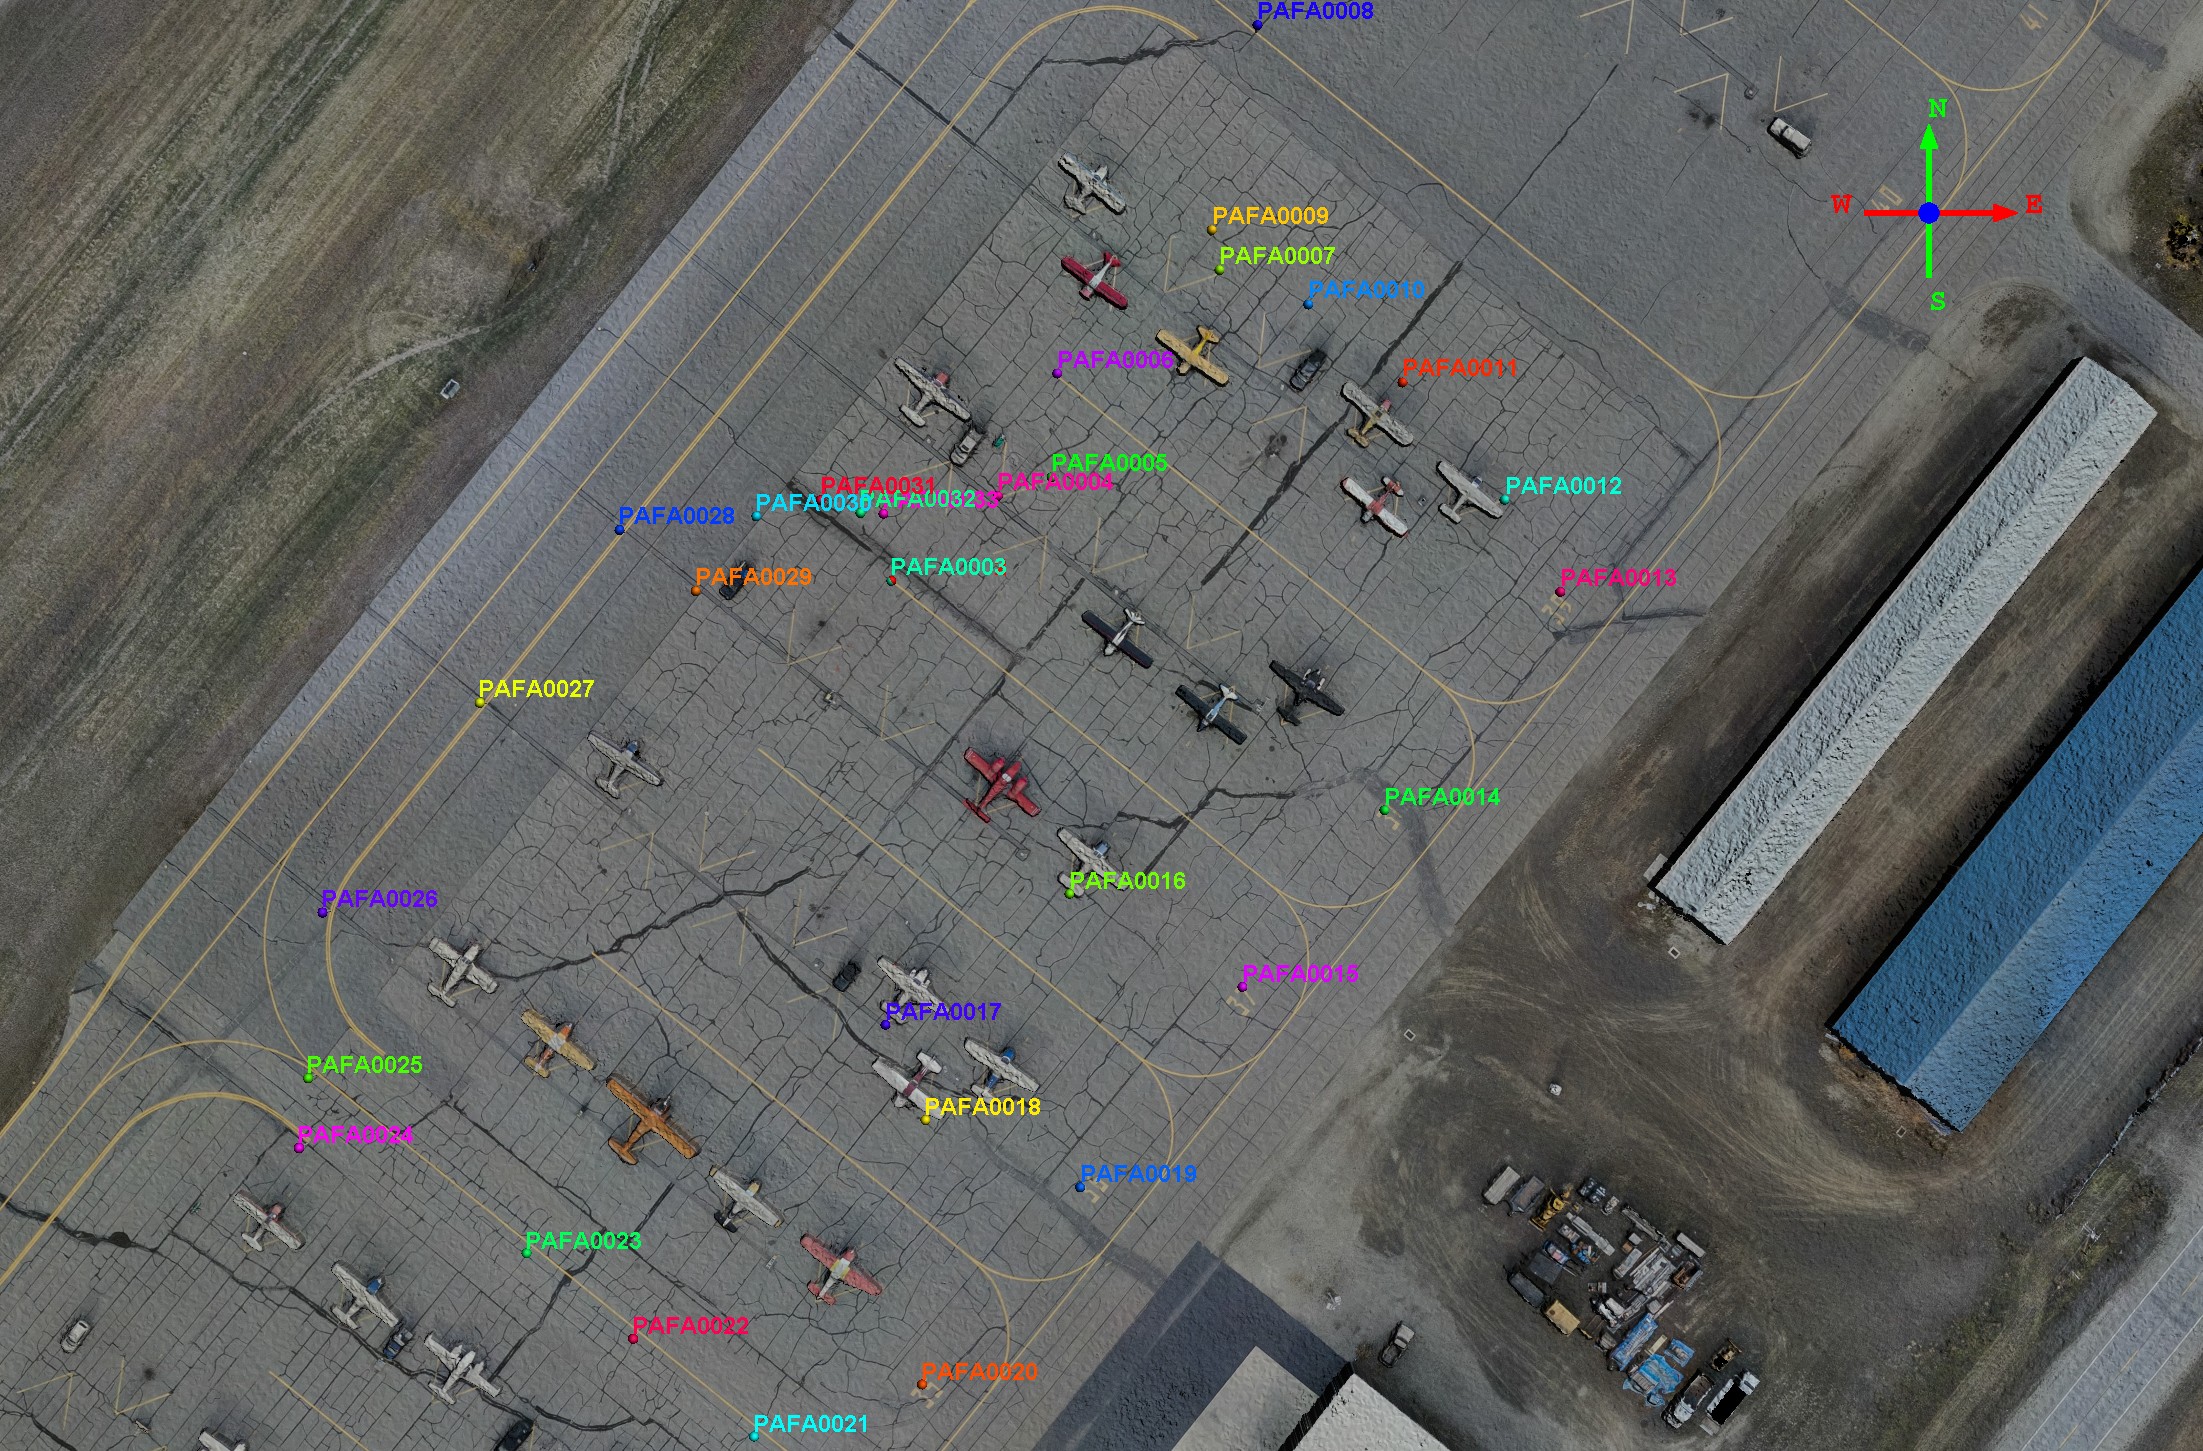
Here are the points I measured. I made most of the measurements at intersections of cracks, the ends of yellow lines, or on the corners of numbers, so that I could assess any spatial misfits.

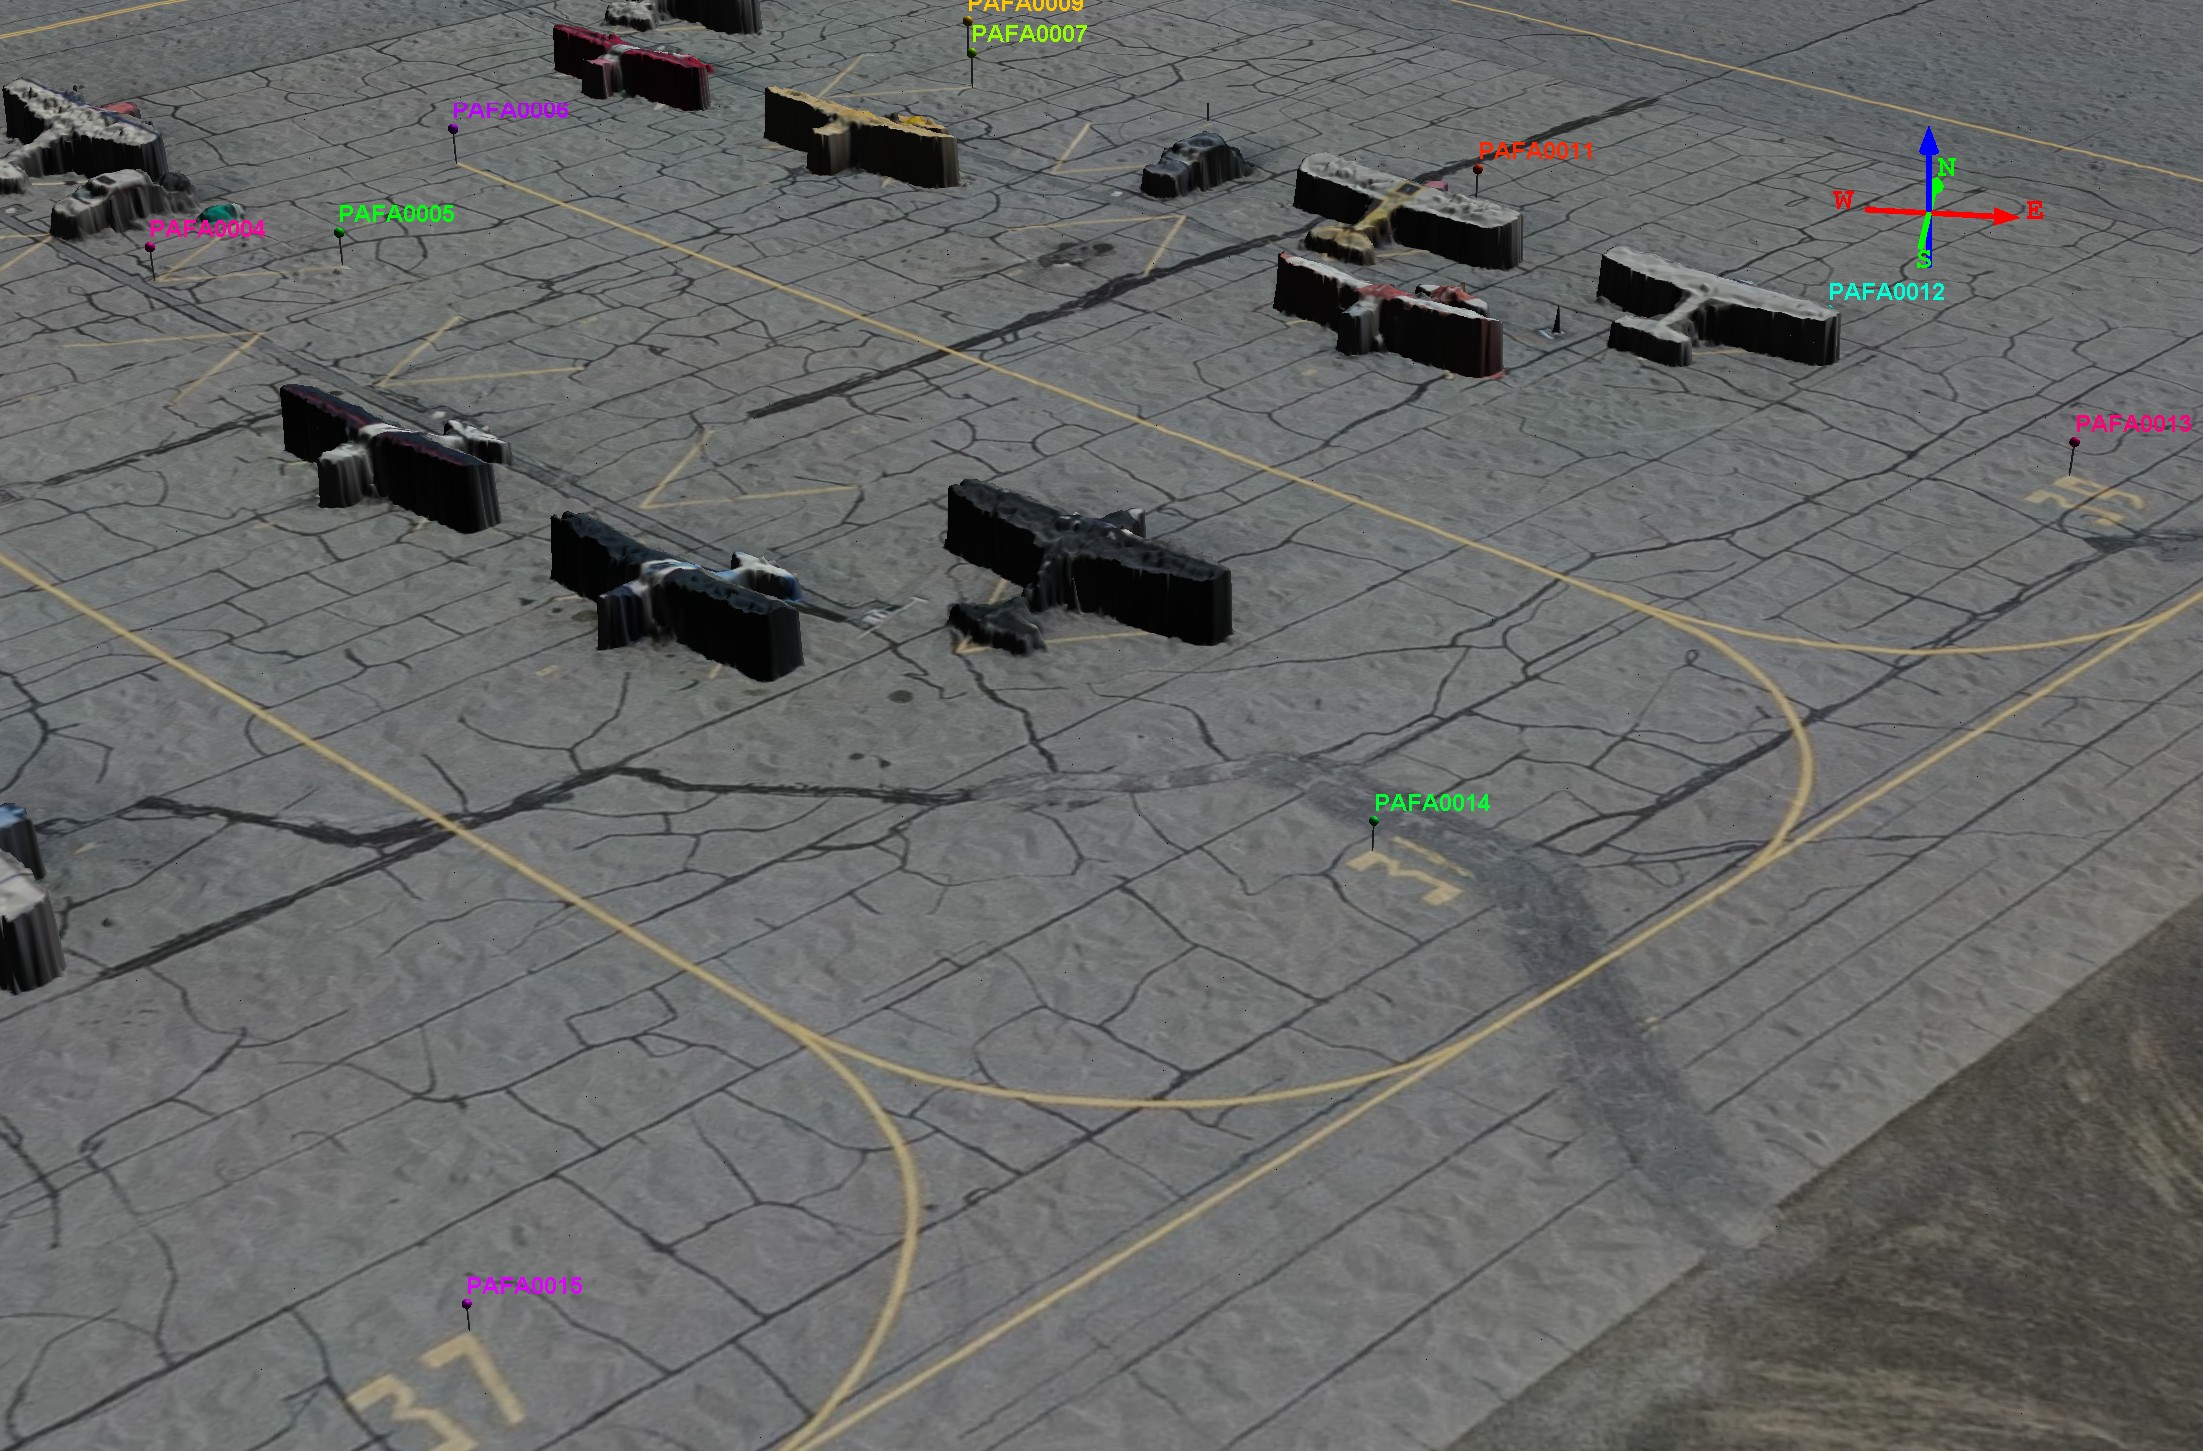
Here you can see the GCPs aligning with the corners of numbers and intersections of lines and cracks. It doesn’t get any better than this really.
Here’s the data from the airport:
| Point ID | Easting (m) | Northing (m) | Difference (m) |
| PAFA0004 | 460120.51 | 7188366.51 | -0.024 |
| PAFA0005 | 460127.21 | 7188368.84 | 0.010 |
| PAFA0006 | 460127.91 | 7188381.77 | -0.020 |
| PAFA0007 | 460148.14 | 7188394.66 | -0.002 |
| PAFA0008 | 460152.88 | 7188425.16 | 0.001 |
| PAFA0009 | 460147.21 | 7188399.64 | 0.000 |
| PAFA0010 | 460159.21 | 7188390.35 | 0.002 |
| PAFA0011 | 460170.98 | 7188380.63 | 0.002 |
| PAFA0012 | 460183.70 | 7188365.98 | 0.019 |
| PAFA0013 | 460190.64 | 7188354.50 | -0.011 |
| PAFA0014 | 460168.72 | 7188327.26 | -0.019 |
| PAFA0015 | 460150.99 | 7188305.23 | 0.002 |
| PAFA0016 | 460129.43 | 7188316.82 | 0.027 |
| PAFA0017 | 460106.47 | 7188300.49 | 0.010 |
| PAFA0018 | 460111.45 | 7188288.61 | -0.033 |
| PAFA0019 | 460130.78 | 7188280.25 | -0.039 |
| PAFA0020 | 460111.06 | 7188255.67 | -0.004 |
| PAFA0021 | 460090.10 | 7188249.21 | 0.007 |
| PAFA0022 | 460075.04 | 7188261.37 | 0.016 |
| PAFA0023 | 460061.76 | 7188272.05 | -0.003 |
| PAFA0024 | 460033.42 | 7188285.18 | 0.018 |
| PAFA0025 | 460034.57 | 7188293.90 | 0.022 |
| PAFA0026 | 460036.32 | 7188314.52 | 0.023 |
| PAFA0027 | 460055.92 | 7188340.67 | -0.004 |
| PAFA0028 | 460073.34 | 7188362.21 | 0.018 |
| PAFA0029 | 460082.80 | 7188354.62 | -0.030 |
| PAFA0030 | 460090.37 | 7188363.93 | 0.004 |
| PAFA0031 | 460098.37 | 7188365.95 | -0.007 |
| PAFA0032 | 460103.33 | 7188364.36 | 0.014 |
| PAFA0033 | 460106.20 | 7188364.26 | -0.020 |
| Standard Deviation (m): | 0.017 |
Note that the standard deviation is a metric of precision (that is, repeatability). The data originally had a mean offset of about 12 cm, which is a metric of accuracy.
