NAGAP Photogrammetry Coming Soon
Between 1960-1995, a crew at the USGS made annual flights to photograph the state of glaciers in western North America, with the bulk of them taken by Austin Post to form what would become the North American Glacier Aerial Photography (NAGAP) collection. These photographs were made with large format cameras, typically on rolls 9″ wide containing 200-300 photos each. There is no finer collection of air photos covering these glaciers that I know of. Several years ago I got a project funded through UAF by the NSF’s Cyberinfrastructure Program to scan these negatives, archived at UAF’s GeoData Center, at photogrammetric quality so that we could use them to make topographic maps and thereby determine glacier volume change over this time. These photos span the gap between the first systematic mapping of Alaska in the late 1950s and the ability of satellites to make such measurements in the 1990s and thus are likely our only option for information on the rate of increase of volume loss during this time.
So far we’ve scanned nearly all of the vertical photos. There are more oblique photos than vertical, but we’re saving those for future funding (help!) as the vertical ones are most suitable for quantitative measurements (so before you ask, this means that none of the awesome photos from Post’s Glacier Ice book were scanned, as these were all obliques). The next big push is to create the metadata needed to accompany these scans so that they can be discovered and used more easily. This step is a slog of grunt work, even more so than the scanning itself. My goal is to georeference all of the photos as part of the data release. Because these photos were acquired before GPS, this means we have to find the location of each photo by comparing it to existing maps and images, such as with Google Earth. Once georeferenced, however, the photos will be searchable by location and time, which is of great value scientifically. I think there is also a lot value to the public too, because soon everyone will have access to a visual record containing over 50,000 images showing terminus retreat and volume change of these glaciers over a critical 35 years in earth’s climate evolution.
So this blog gives an example of one method I’m planning to use to share these data, namely through Google Earth. I’ve created KML files for Google Earth for about 30 rolls (only another few hundred to go…) and give a few examples of what they look like here. You can download a sample from 1977 by clicking this link. Any feedback would be appreciated.
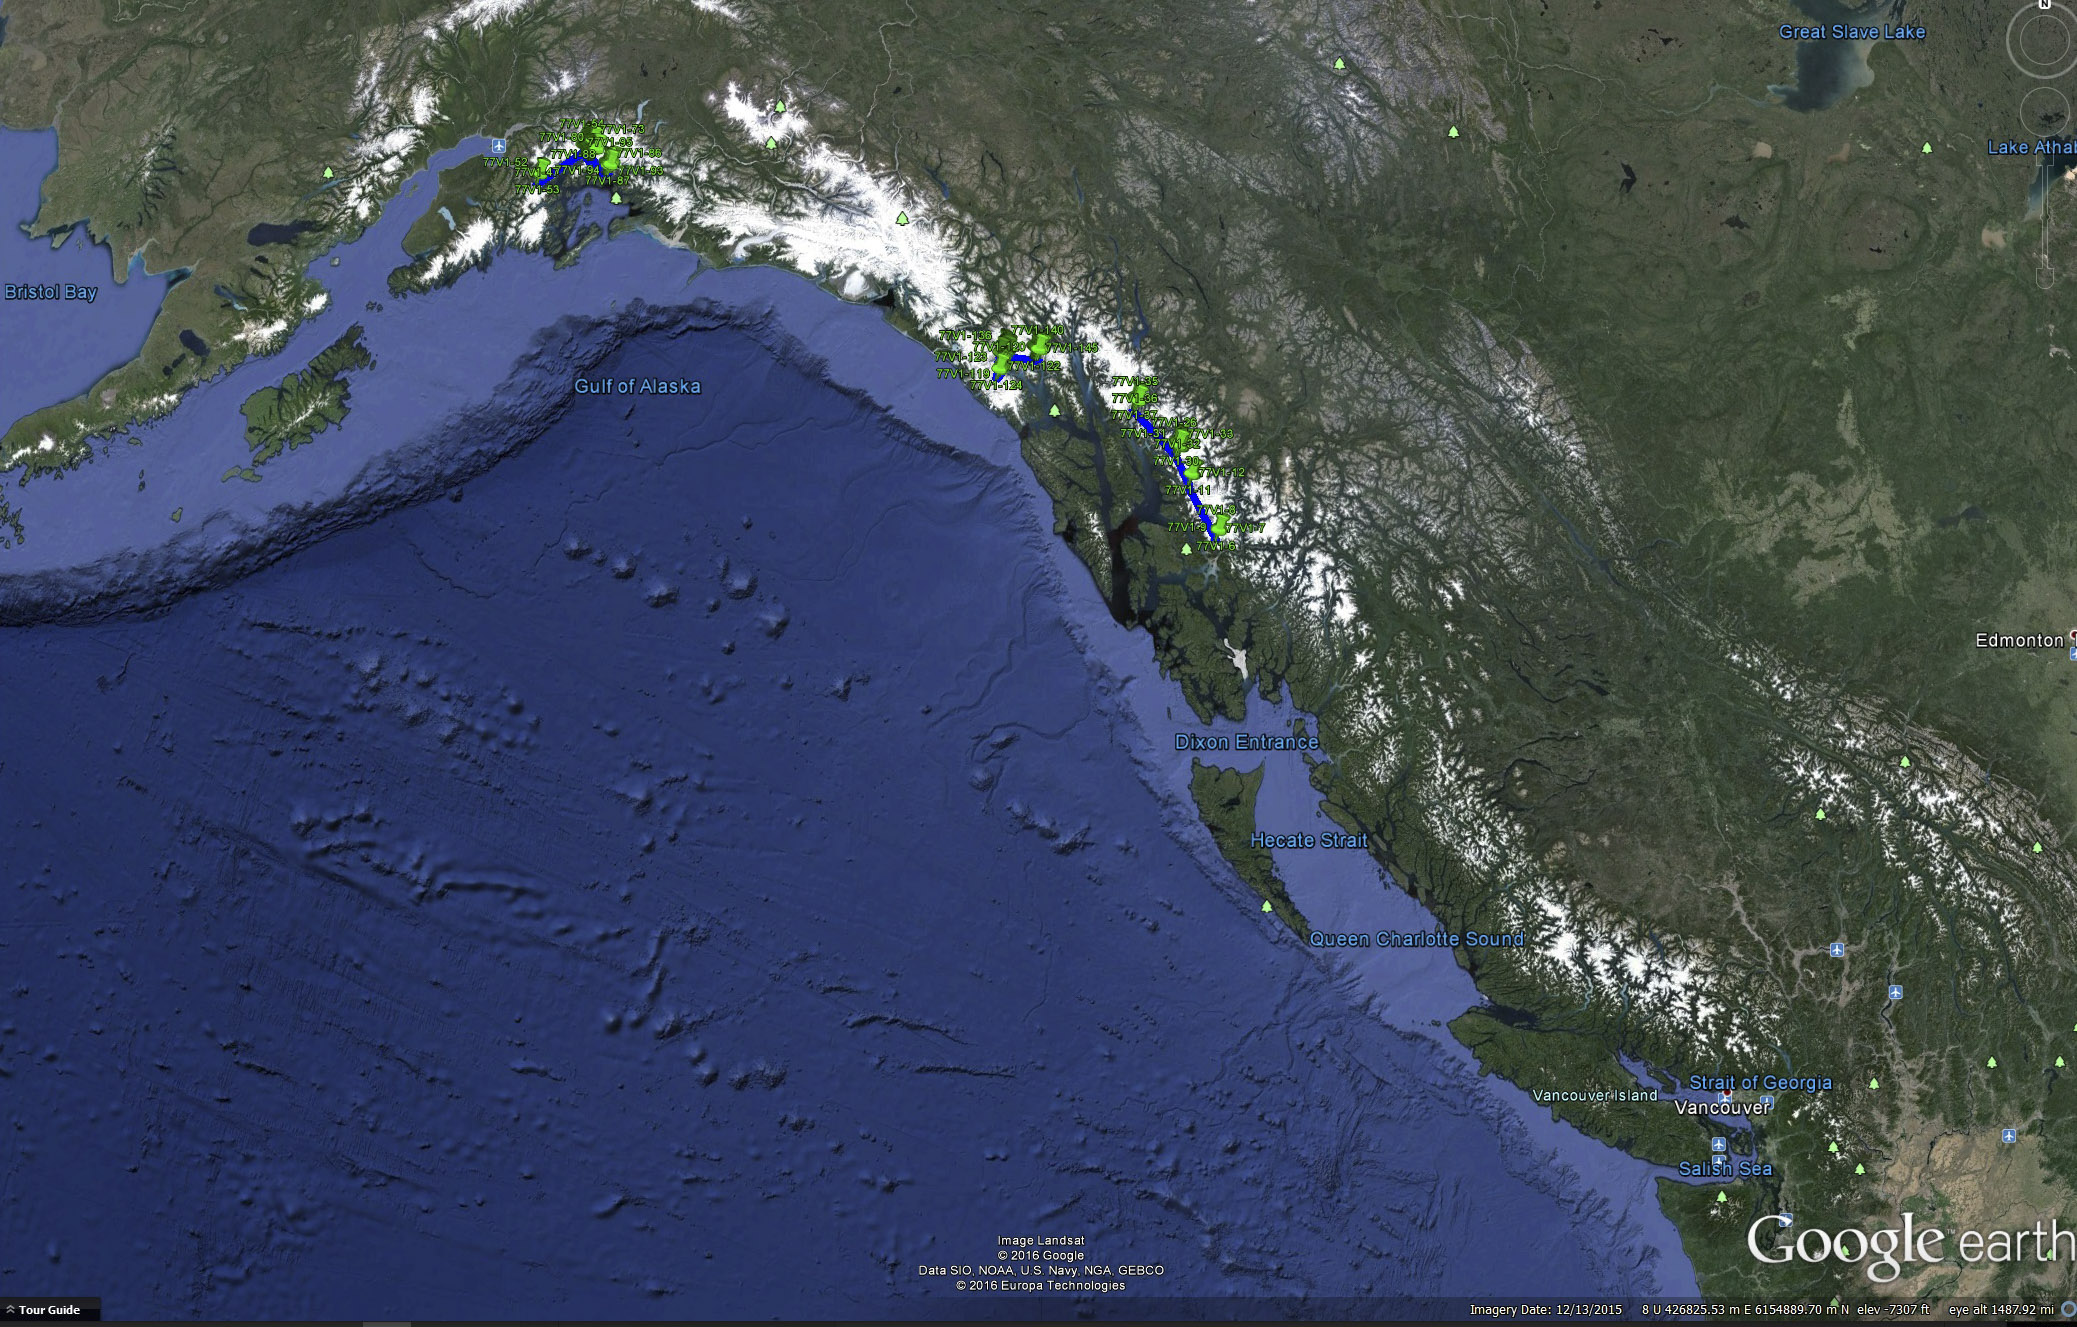
Each of the green pushpins is a photo from 1977. The blue line reconstructs the flight line by connecting the dots, so its not the real path. Each photo mission was different. Mouse-over to see a mission from 1997, twenty years later. Notice that in 1997 the coverage also include glaciers in Washington state. The bulk of the photos are along the Gulf of Alaska, but many missions also include either the Alaska Range or the Cascades. Only one mission that I have found reached the Brooks Range.
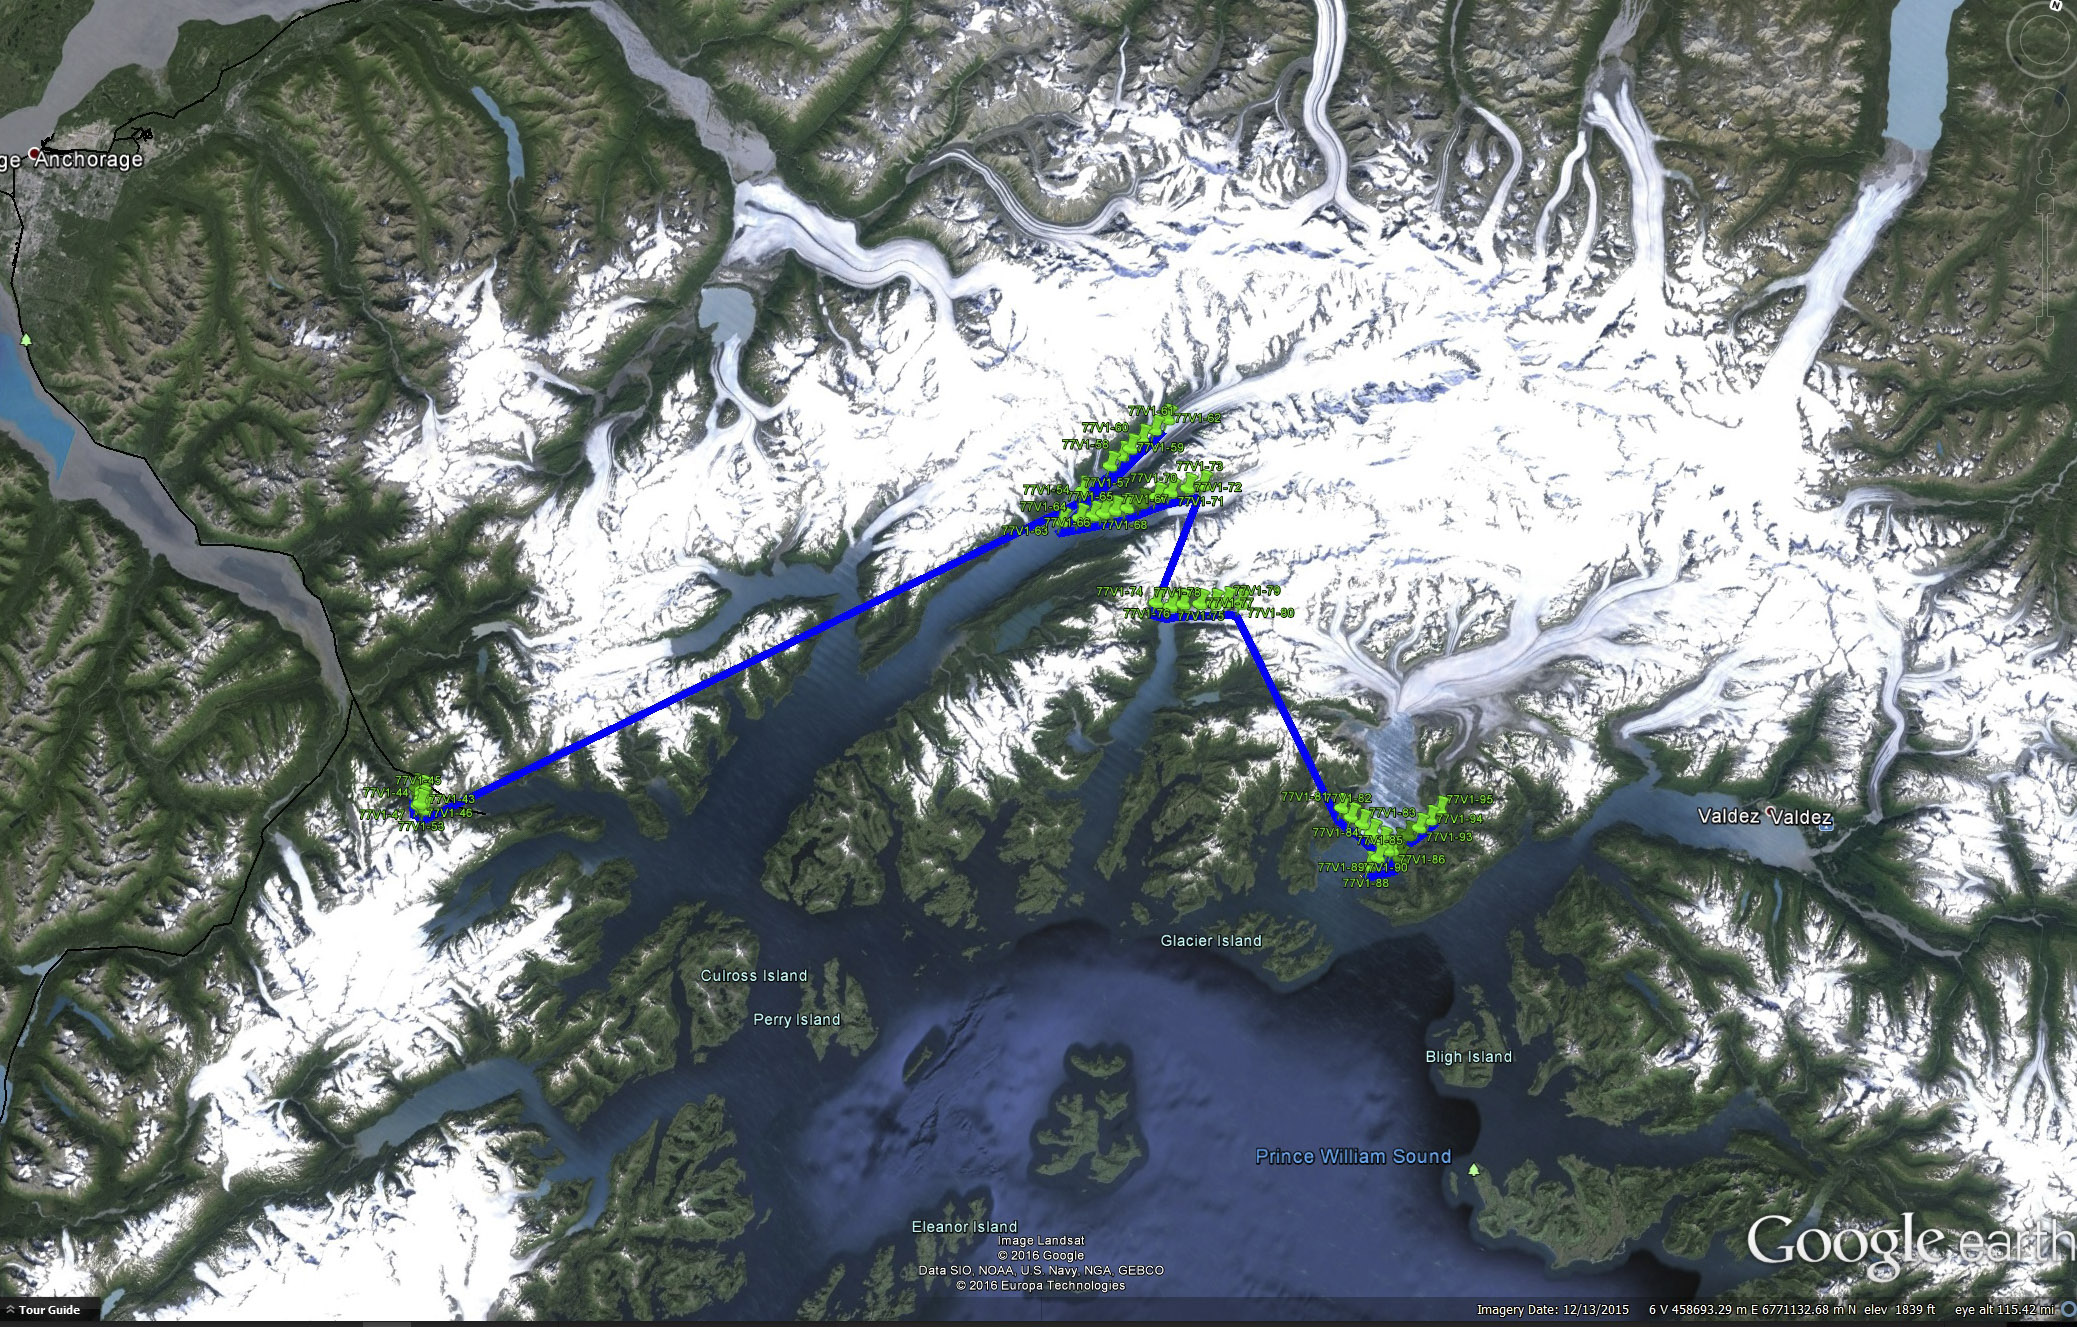
Here is a close up around Prince William Sound of those same two rolls, mouseover to see the other. At a glance you can see not only where the photos were taken on each mission, but also which may be suitable for photogrammetric reconstructions of glacier topography. That is, anywhere there is a strip of photos in a line, there is a good chance we can make a map from them. By organizing these KML files by roll, we are essentially organizing them by date, thus giving us an easy way to search and discover photos by time and location. The photo date, time, and elevation was written or stamped directly onto the film’s border region, which was also scanned, but I have also captured this information within a spreadsheet for machine searches.
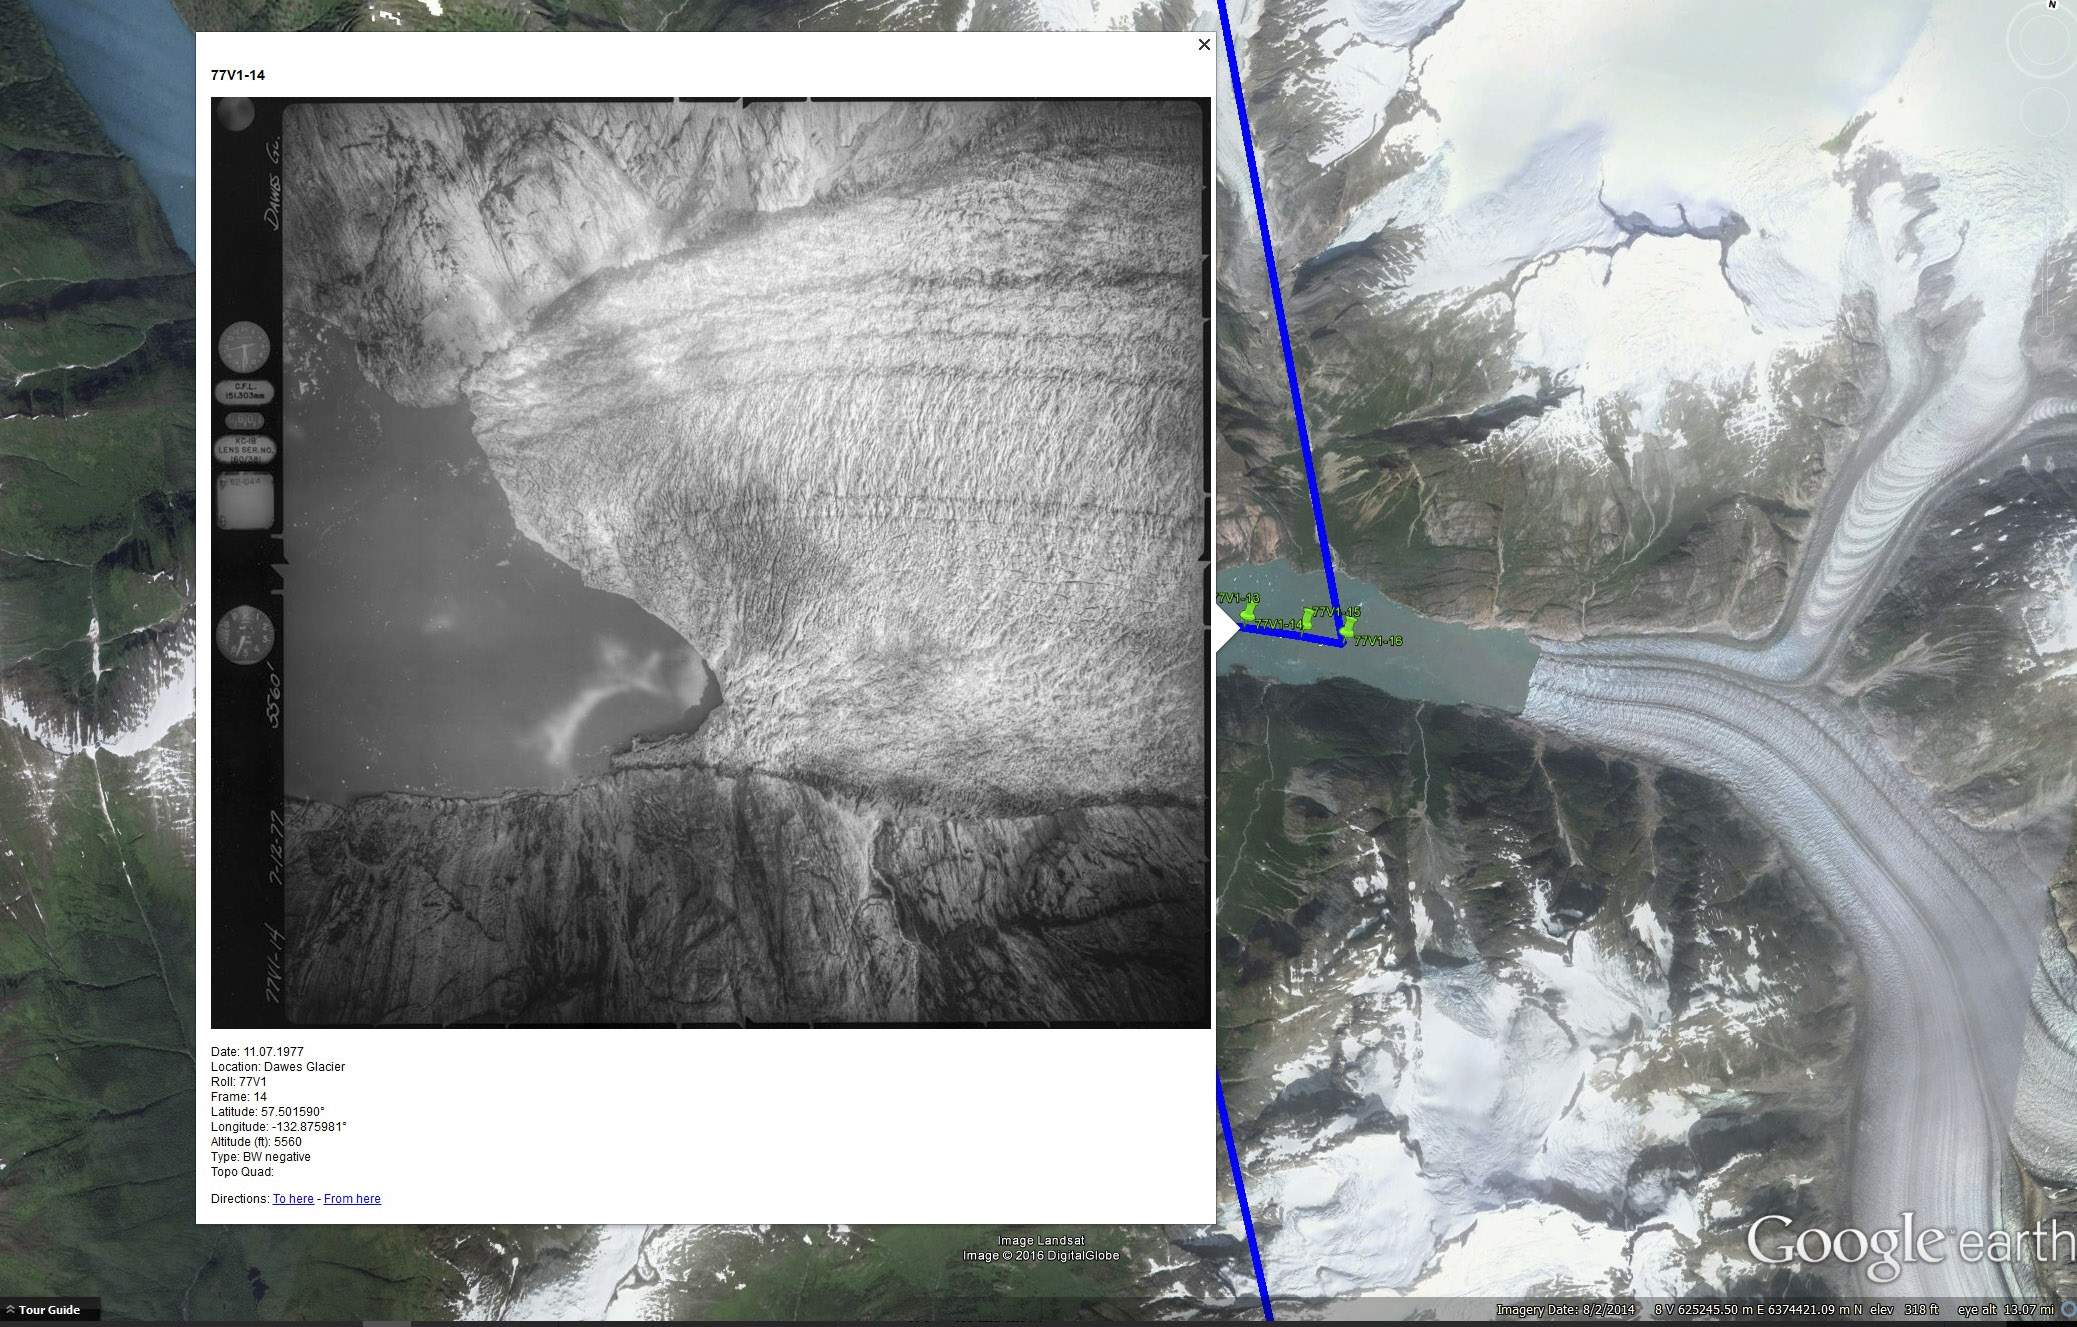
When you click on the pushpins, it will bring up the photo along with a little metadata. Green pushpins mean that I found the location, red ones mean that I couldnt find the location but I know its somewhere between the green ones on either side of it. With glaciers this hasnt been a problem so far, but its tough to geolocate photos of coasts or forests taken in between.
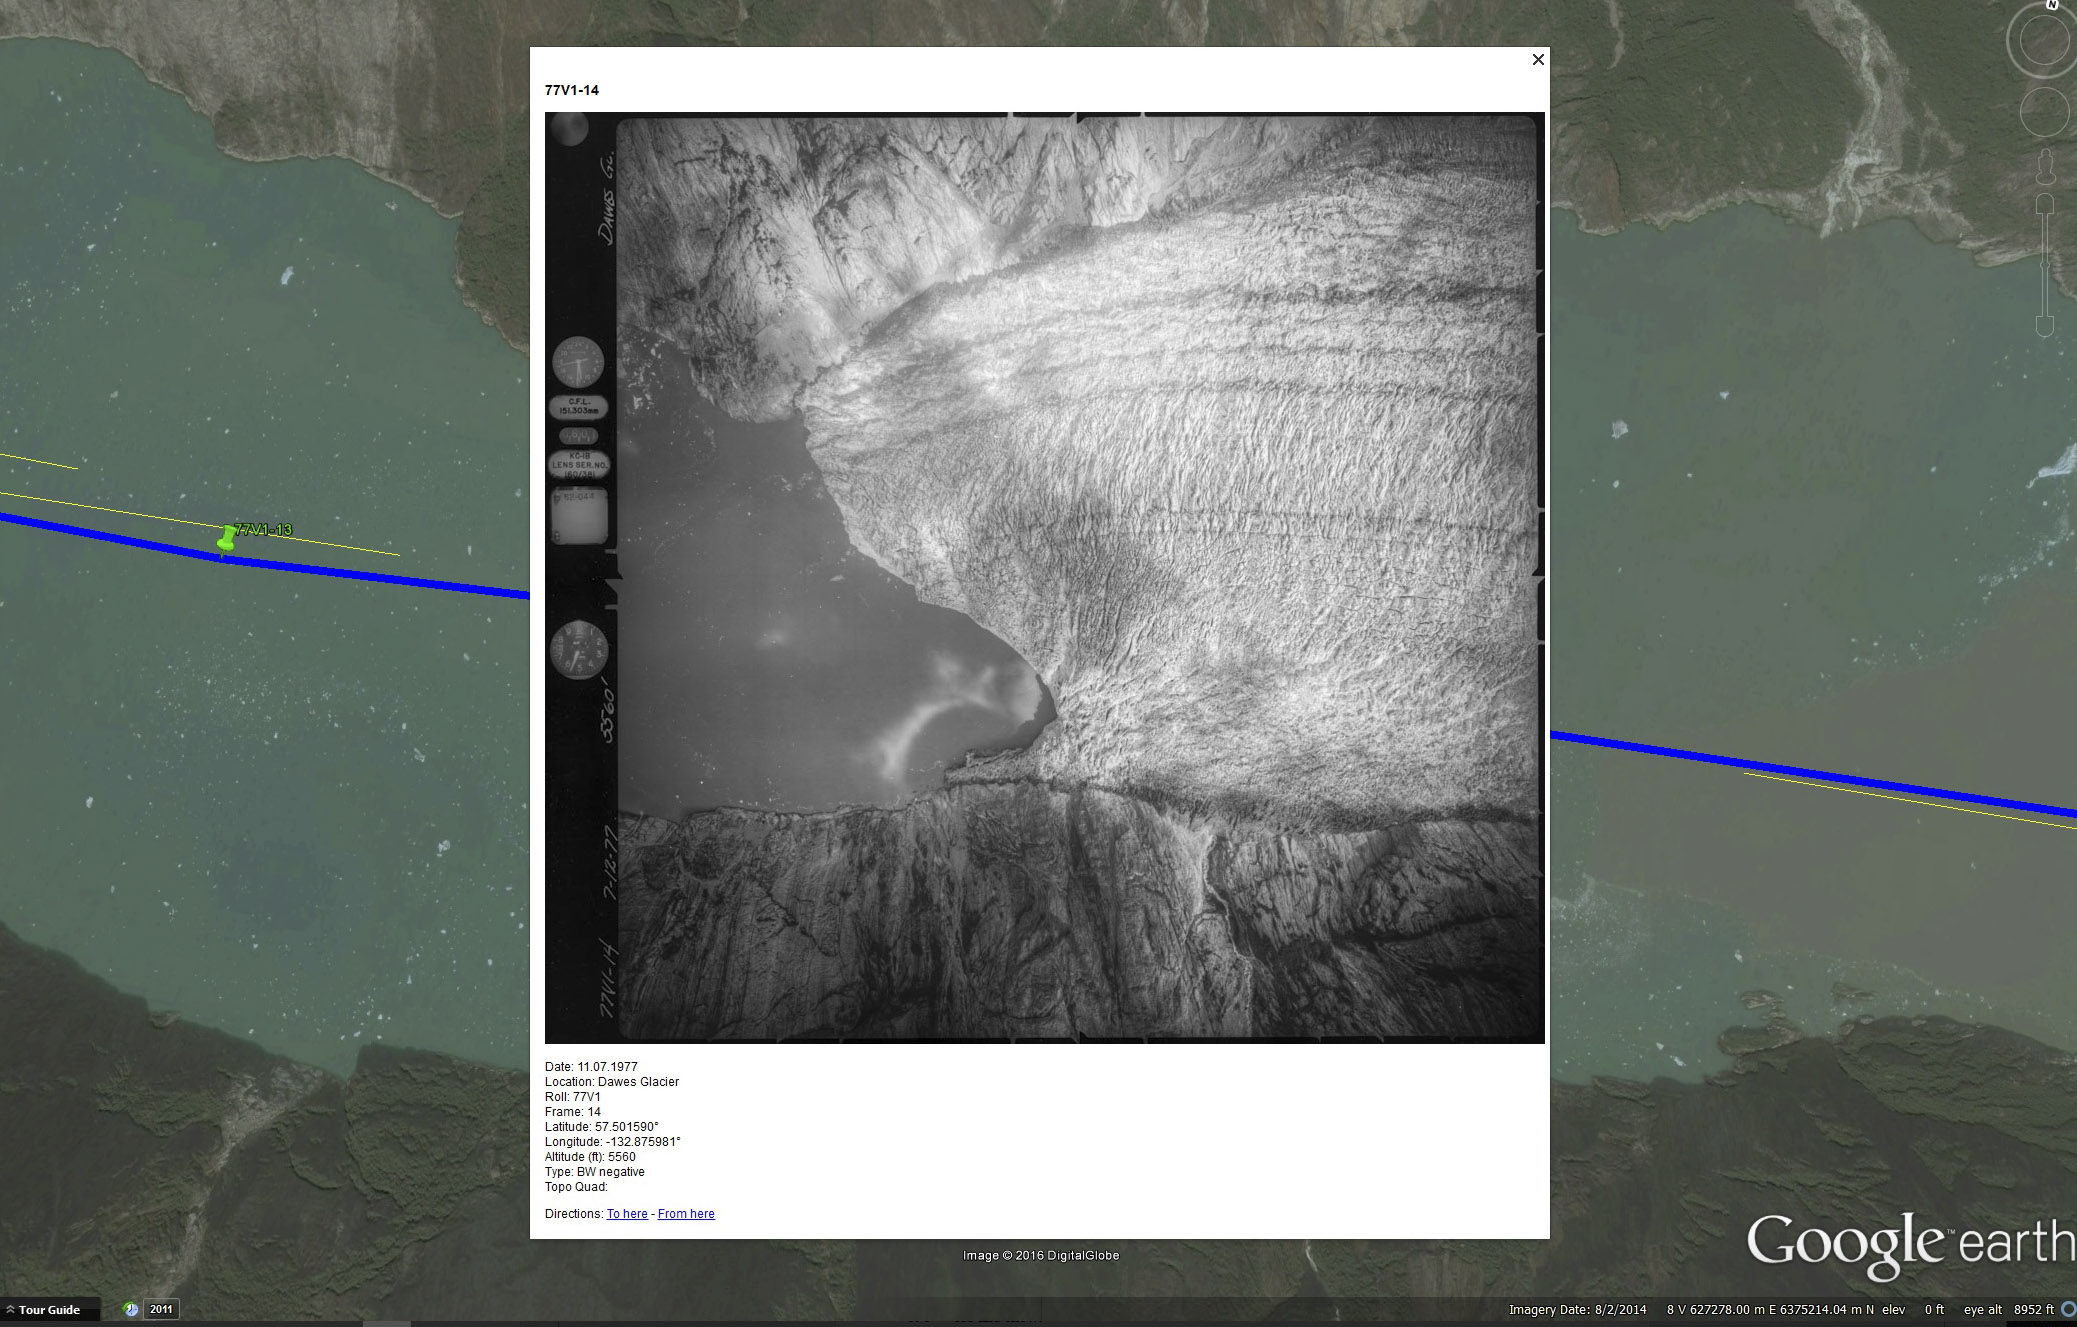
When you double click on a pushpin, it will fly you to a viewpoint that more or less matches that of the photo, so that you can flicker the photo on and off to get a sense of change over time. Mouse-over to flicker between them.
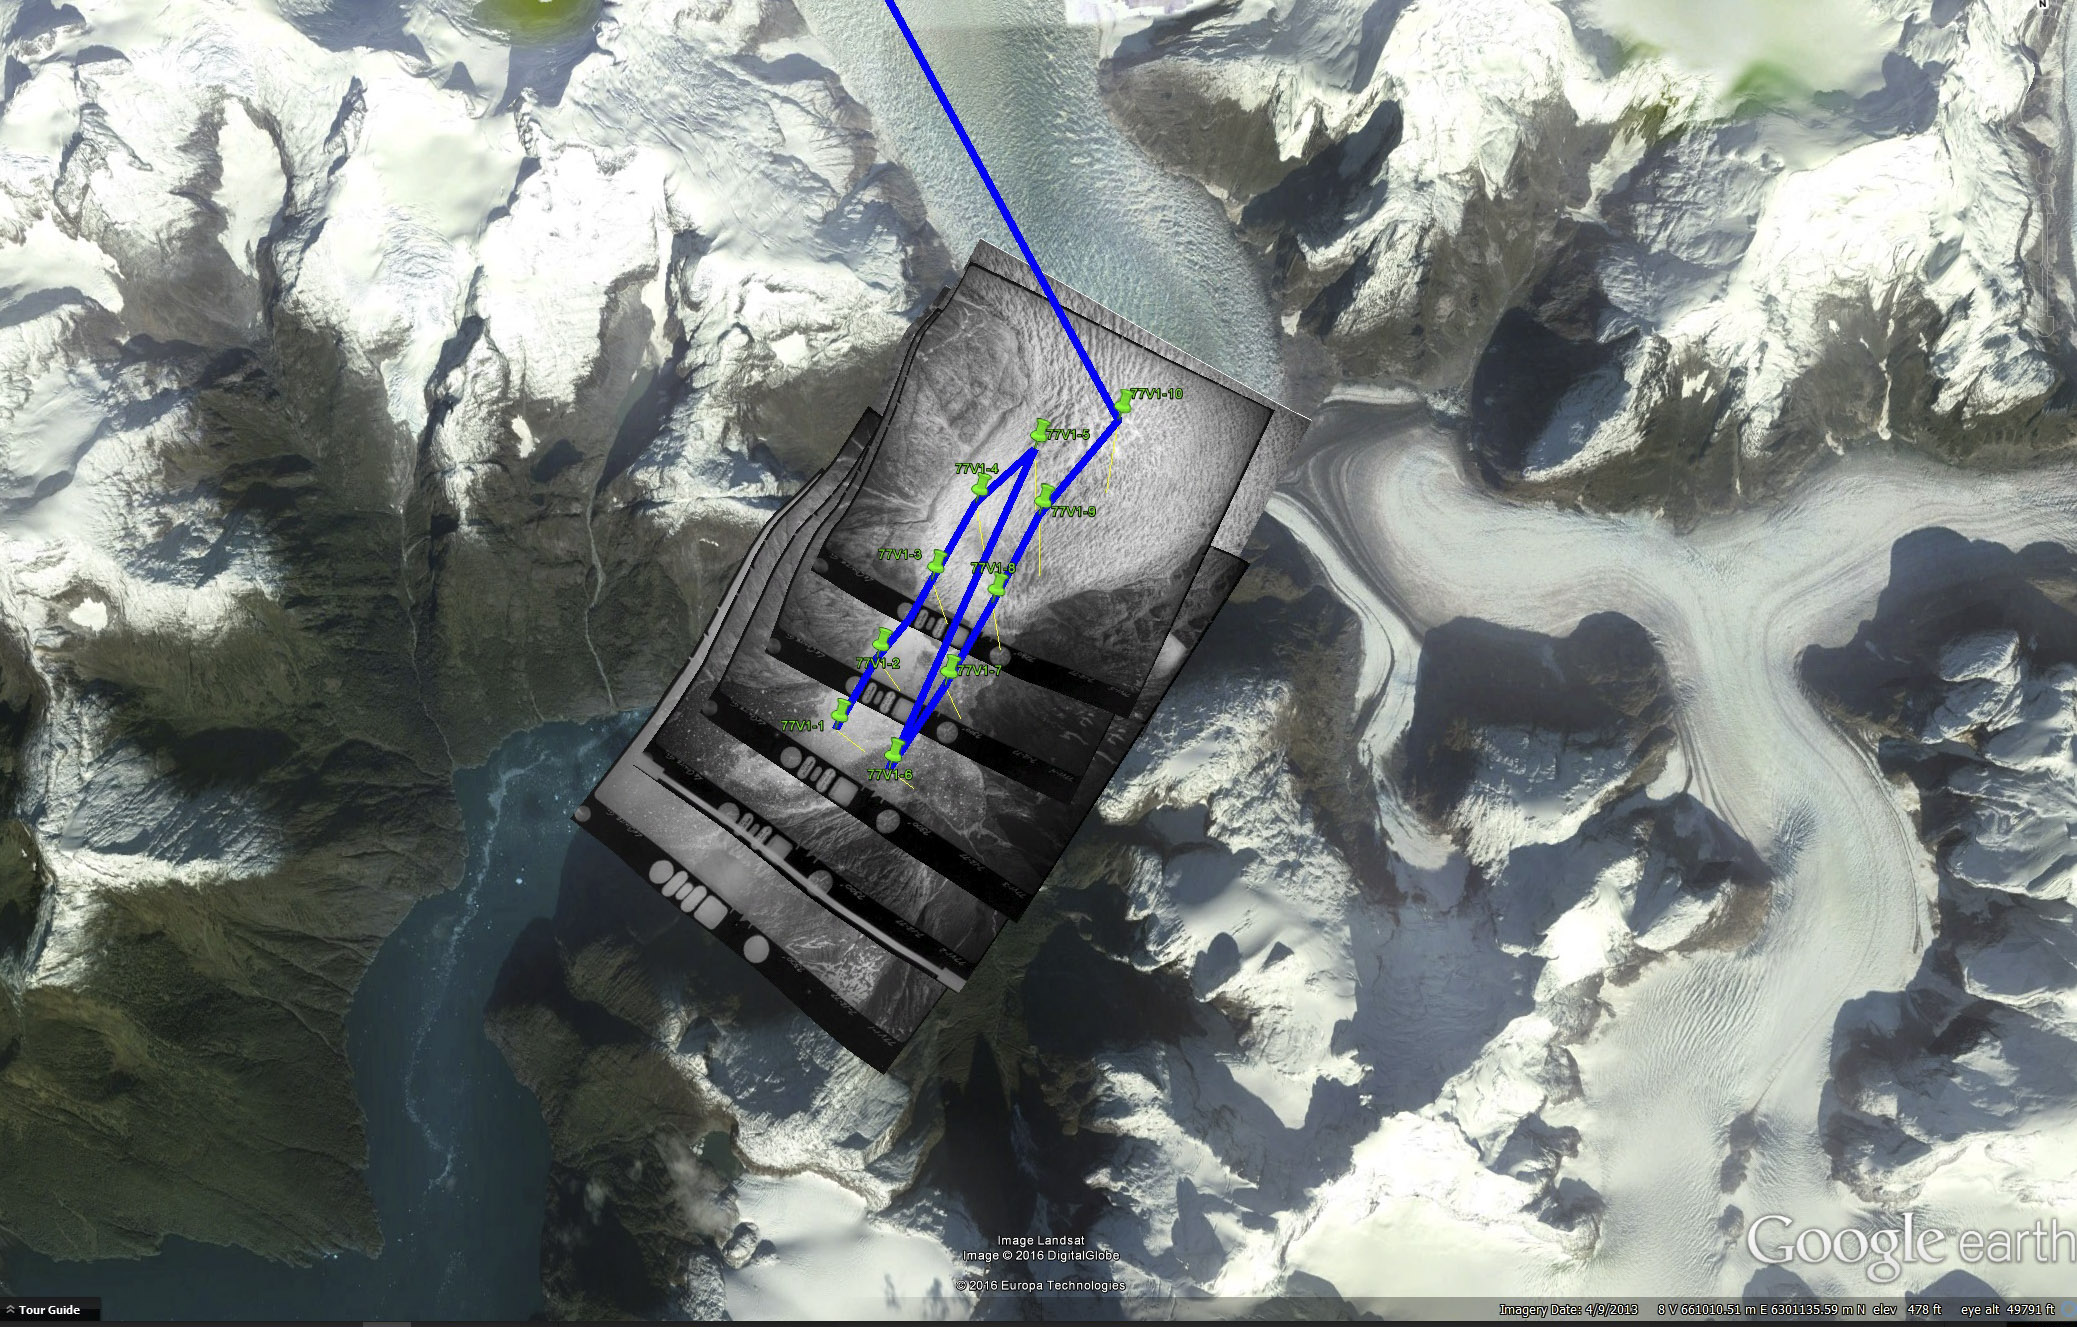
Overlaying the images directly over the terrain in Google Earth is another means of discovering it and understanding it’s utility. Here it becomes immediately obvious how much image overlap there is over LeConte Glacier to assess photogrammetric processing quality.
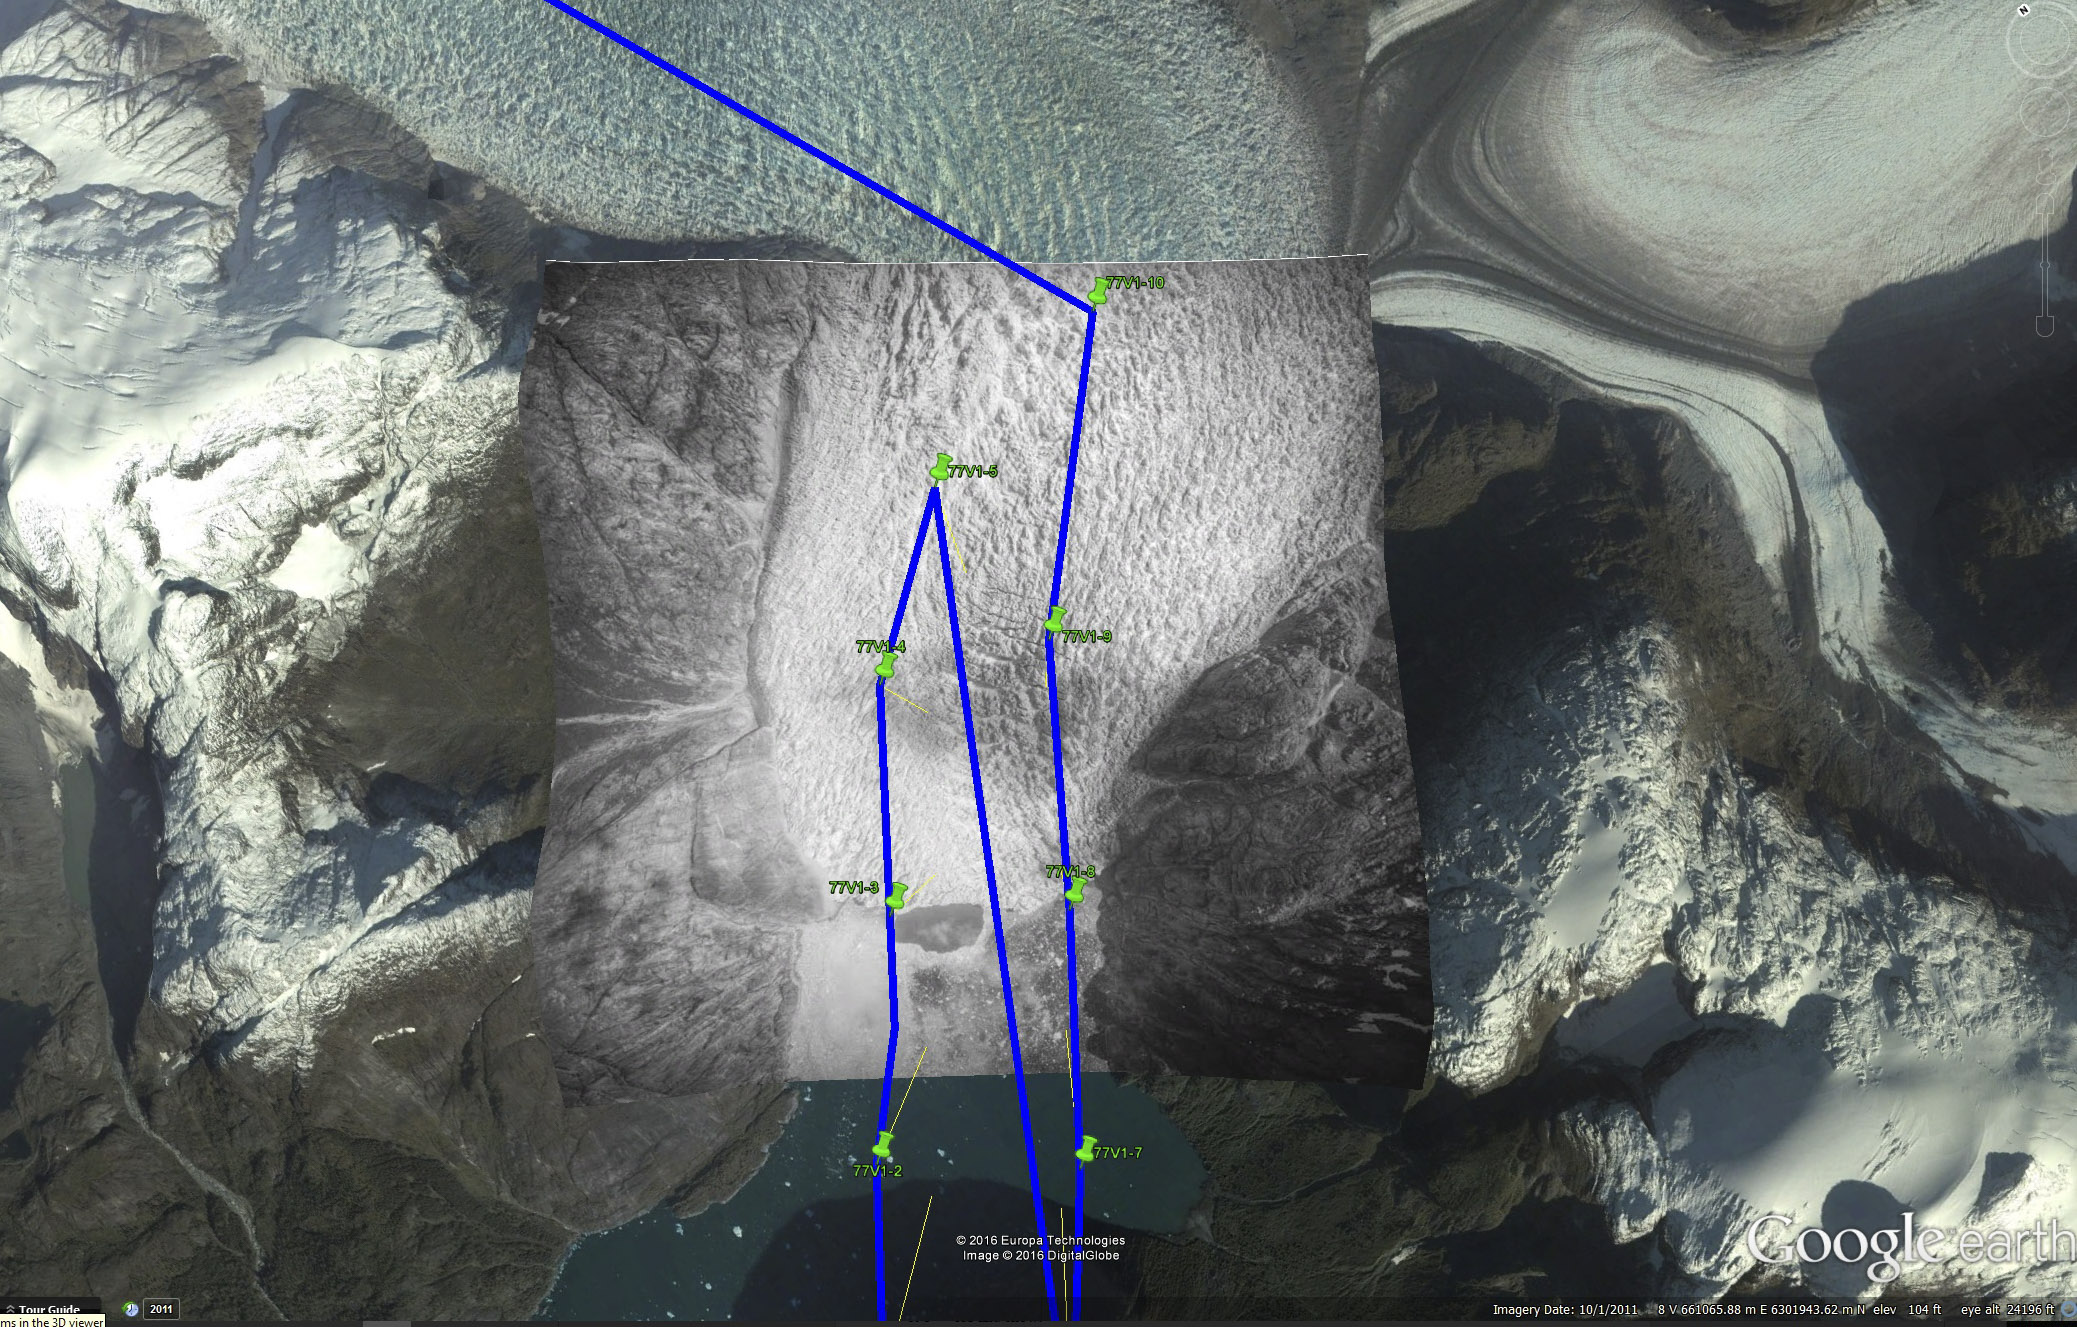 I’m only planning to do a few image overlays per roll at this point, as it is fussy and time-consuming work that doesnt lead to an ideal result because these images are not ortho-rectified. Once the images are photogrammetrically processed, however, the resulting ortho-mosaics will drop exactly into place easily. In meantime, these overlays will give a good flavor of the change that has occurred in these glaciers — mouse-over to see LeConte Glacier’s current position. If you look closely you can also get a sense of glacier thinning by looking at the rocks. Imagine flipping through 30 years of annual imagery like this.
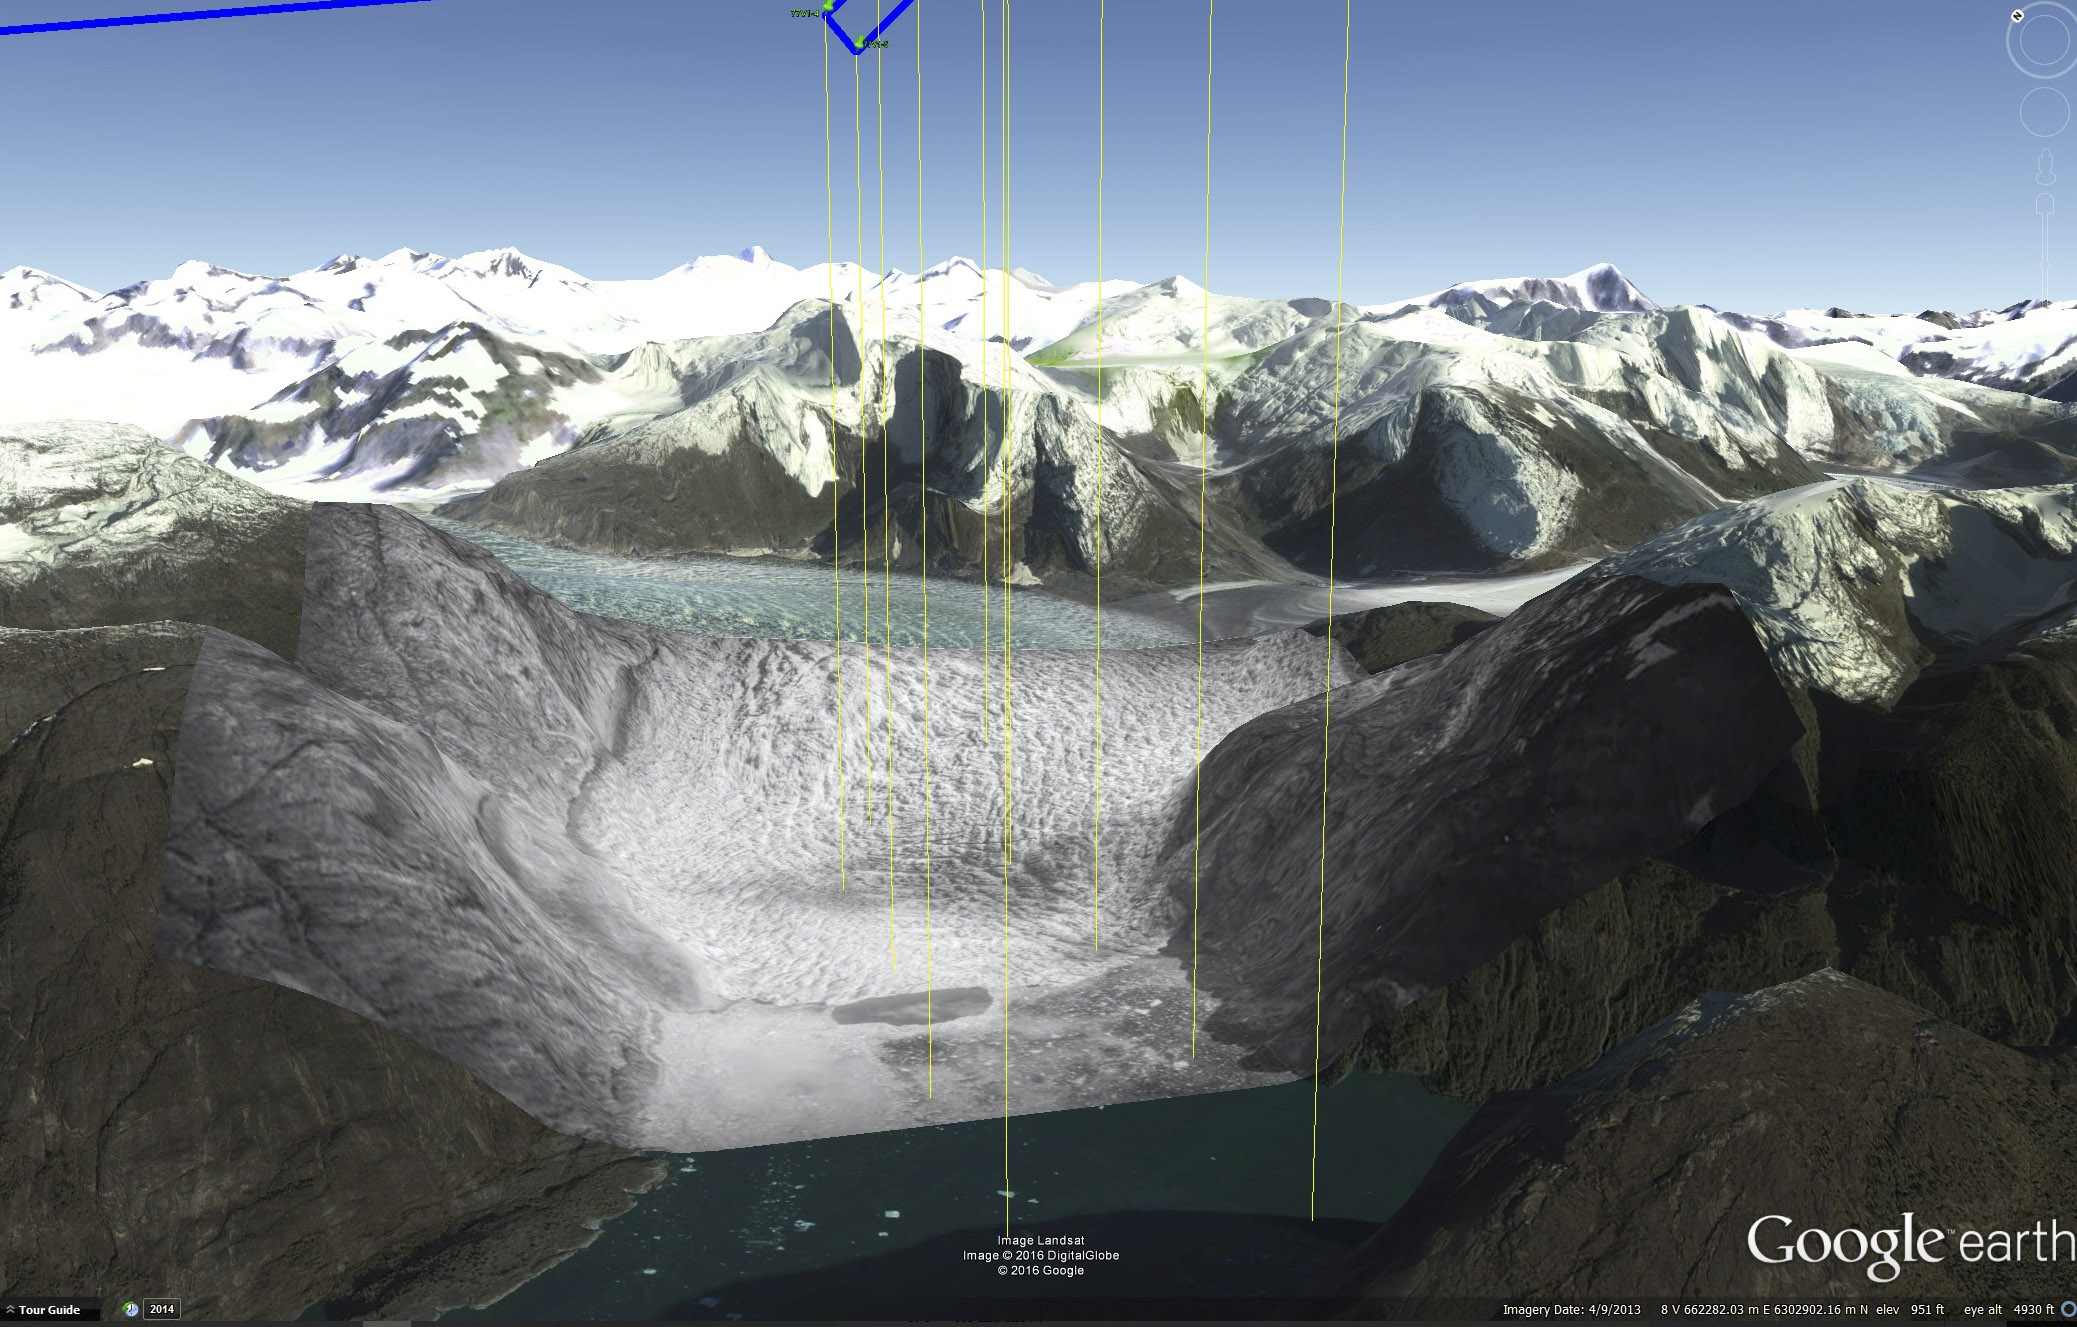
With the image draped over terrain, we can also get a 3D perspective on the changes on LeConte Glacier. Mouse-over to see the current glacier position. The old image is draped over the same topography as the current position so the glacier looks somewhat deflated; unfortunately the “current” topography is way out of date too..
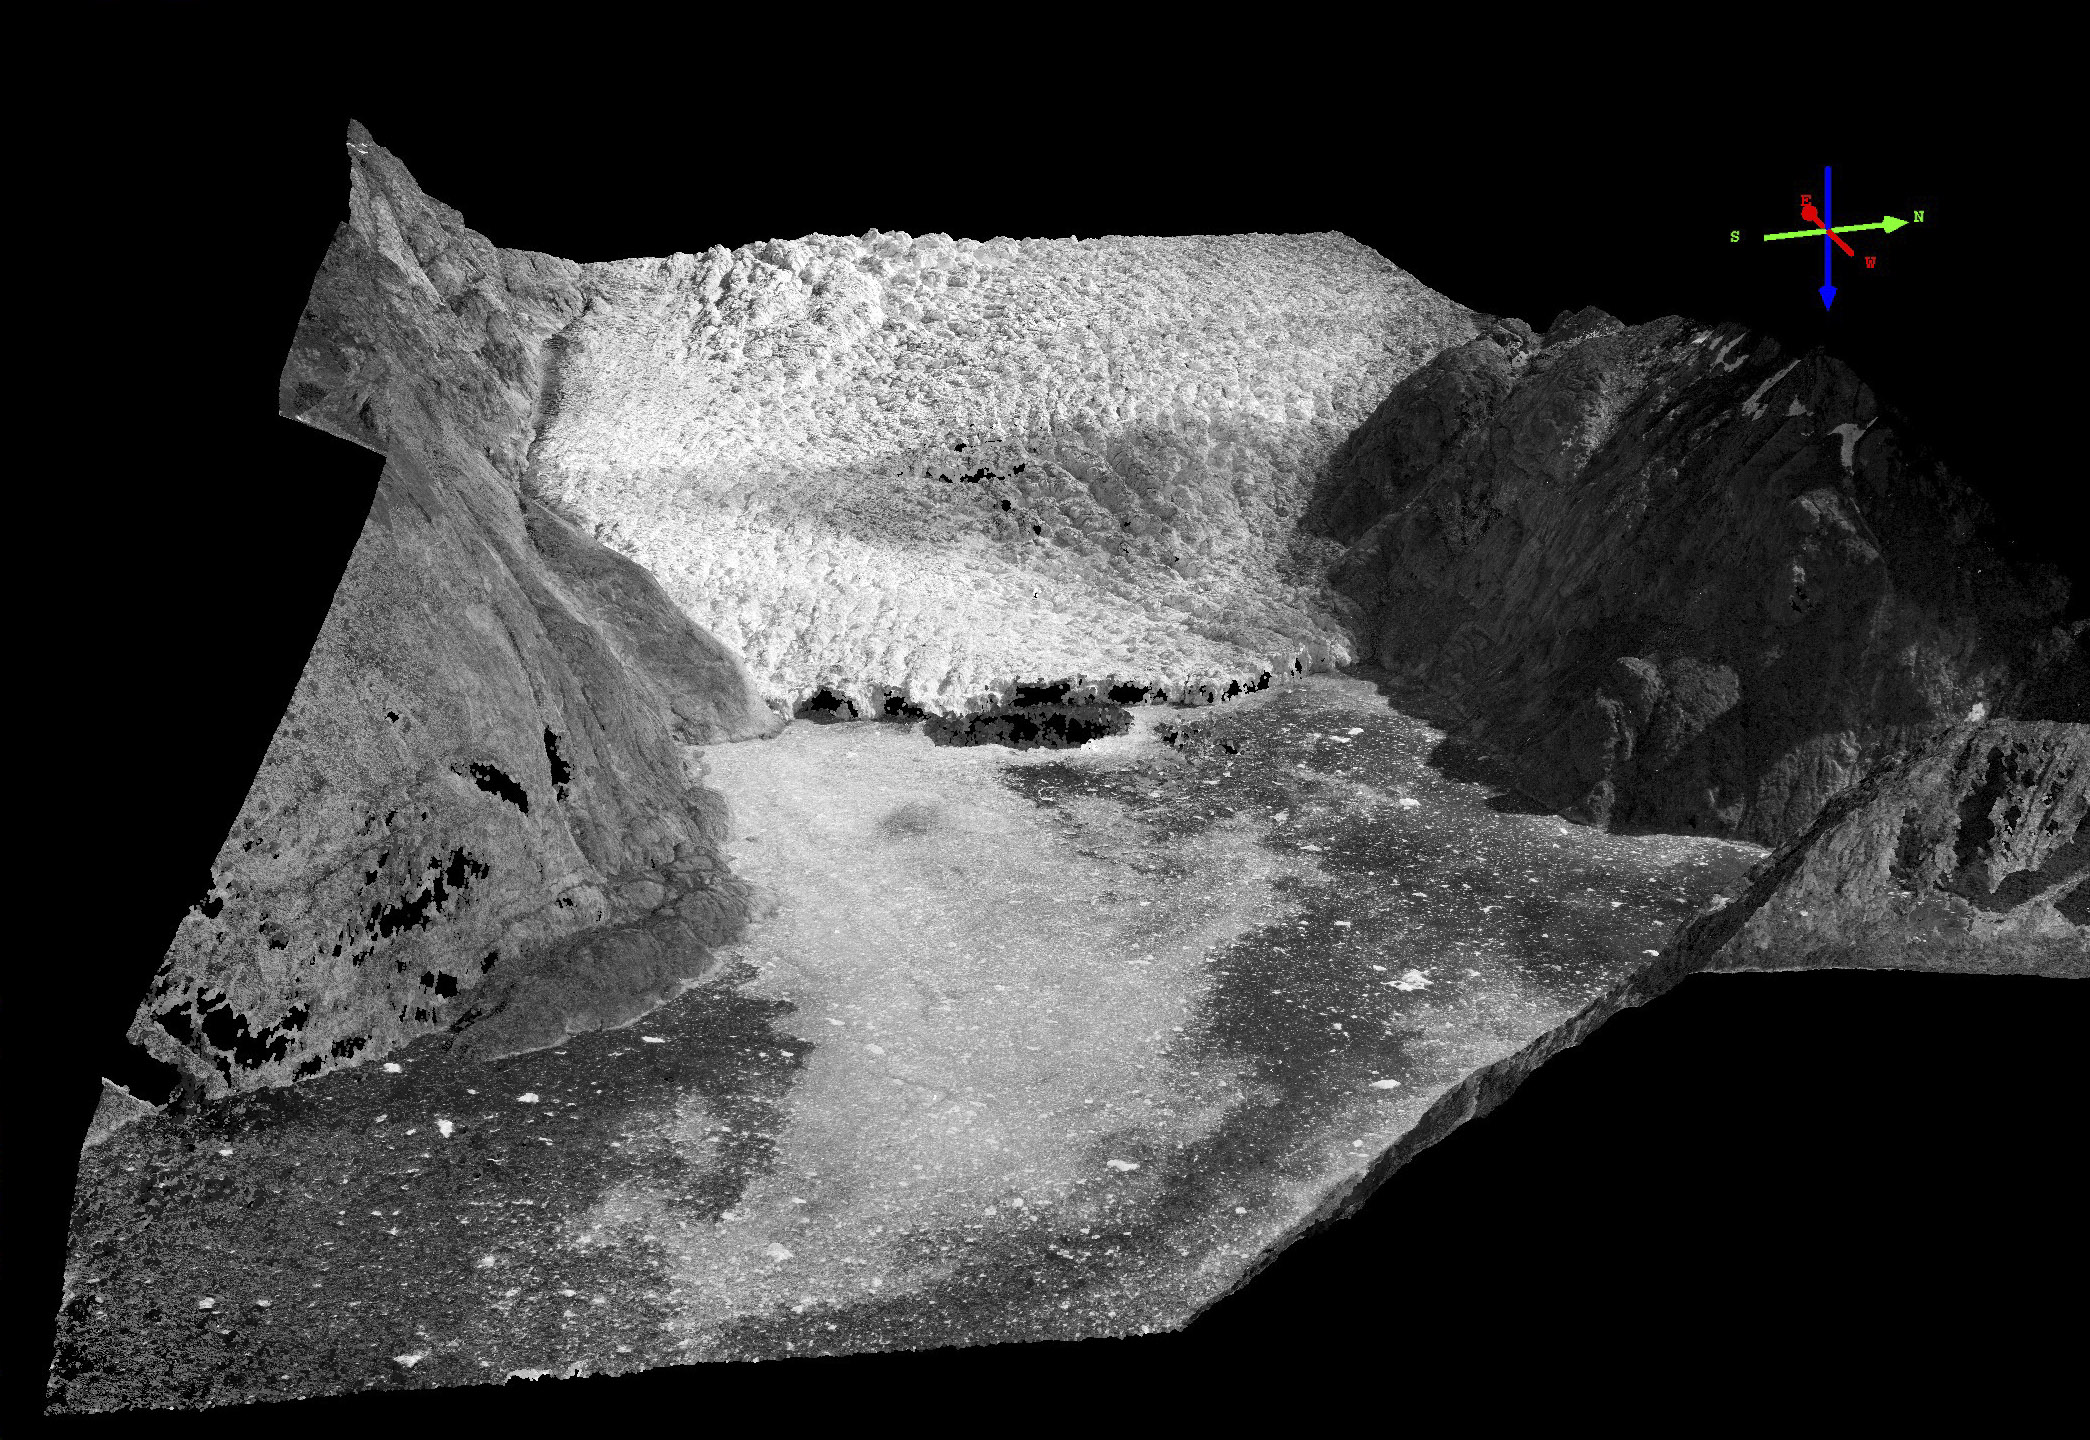
Of course this is the scientific goal of scanning these photos — to turn them into topography. It took only a few minutes to turn the photos shown above into this point cloud using techniques similar to fodar, revealing the true shape and position of the LeConte Glacier in 1977. Note that there was enough brash ice in the ocean to create an accurate sea level height too. This effort, though, was of the quick and dirty kind. To get the most out of these data, we will need substantial ground control. My goal is to map each of these glacier using fodar, both to map the modern topography but also to use that topography to generate the ground control to get the most accurate topography possible from the older photos, but this will require a fair amount of time and funding (help!). In the meantime, at least it’s clear that our goal of creating accurate topographies from these images is possible and there are alternative sources of ground control that will yield perfectly adequate DEMs for a wide variety of studies.
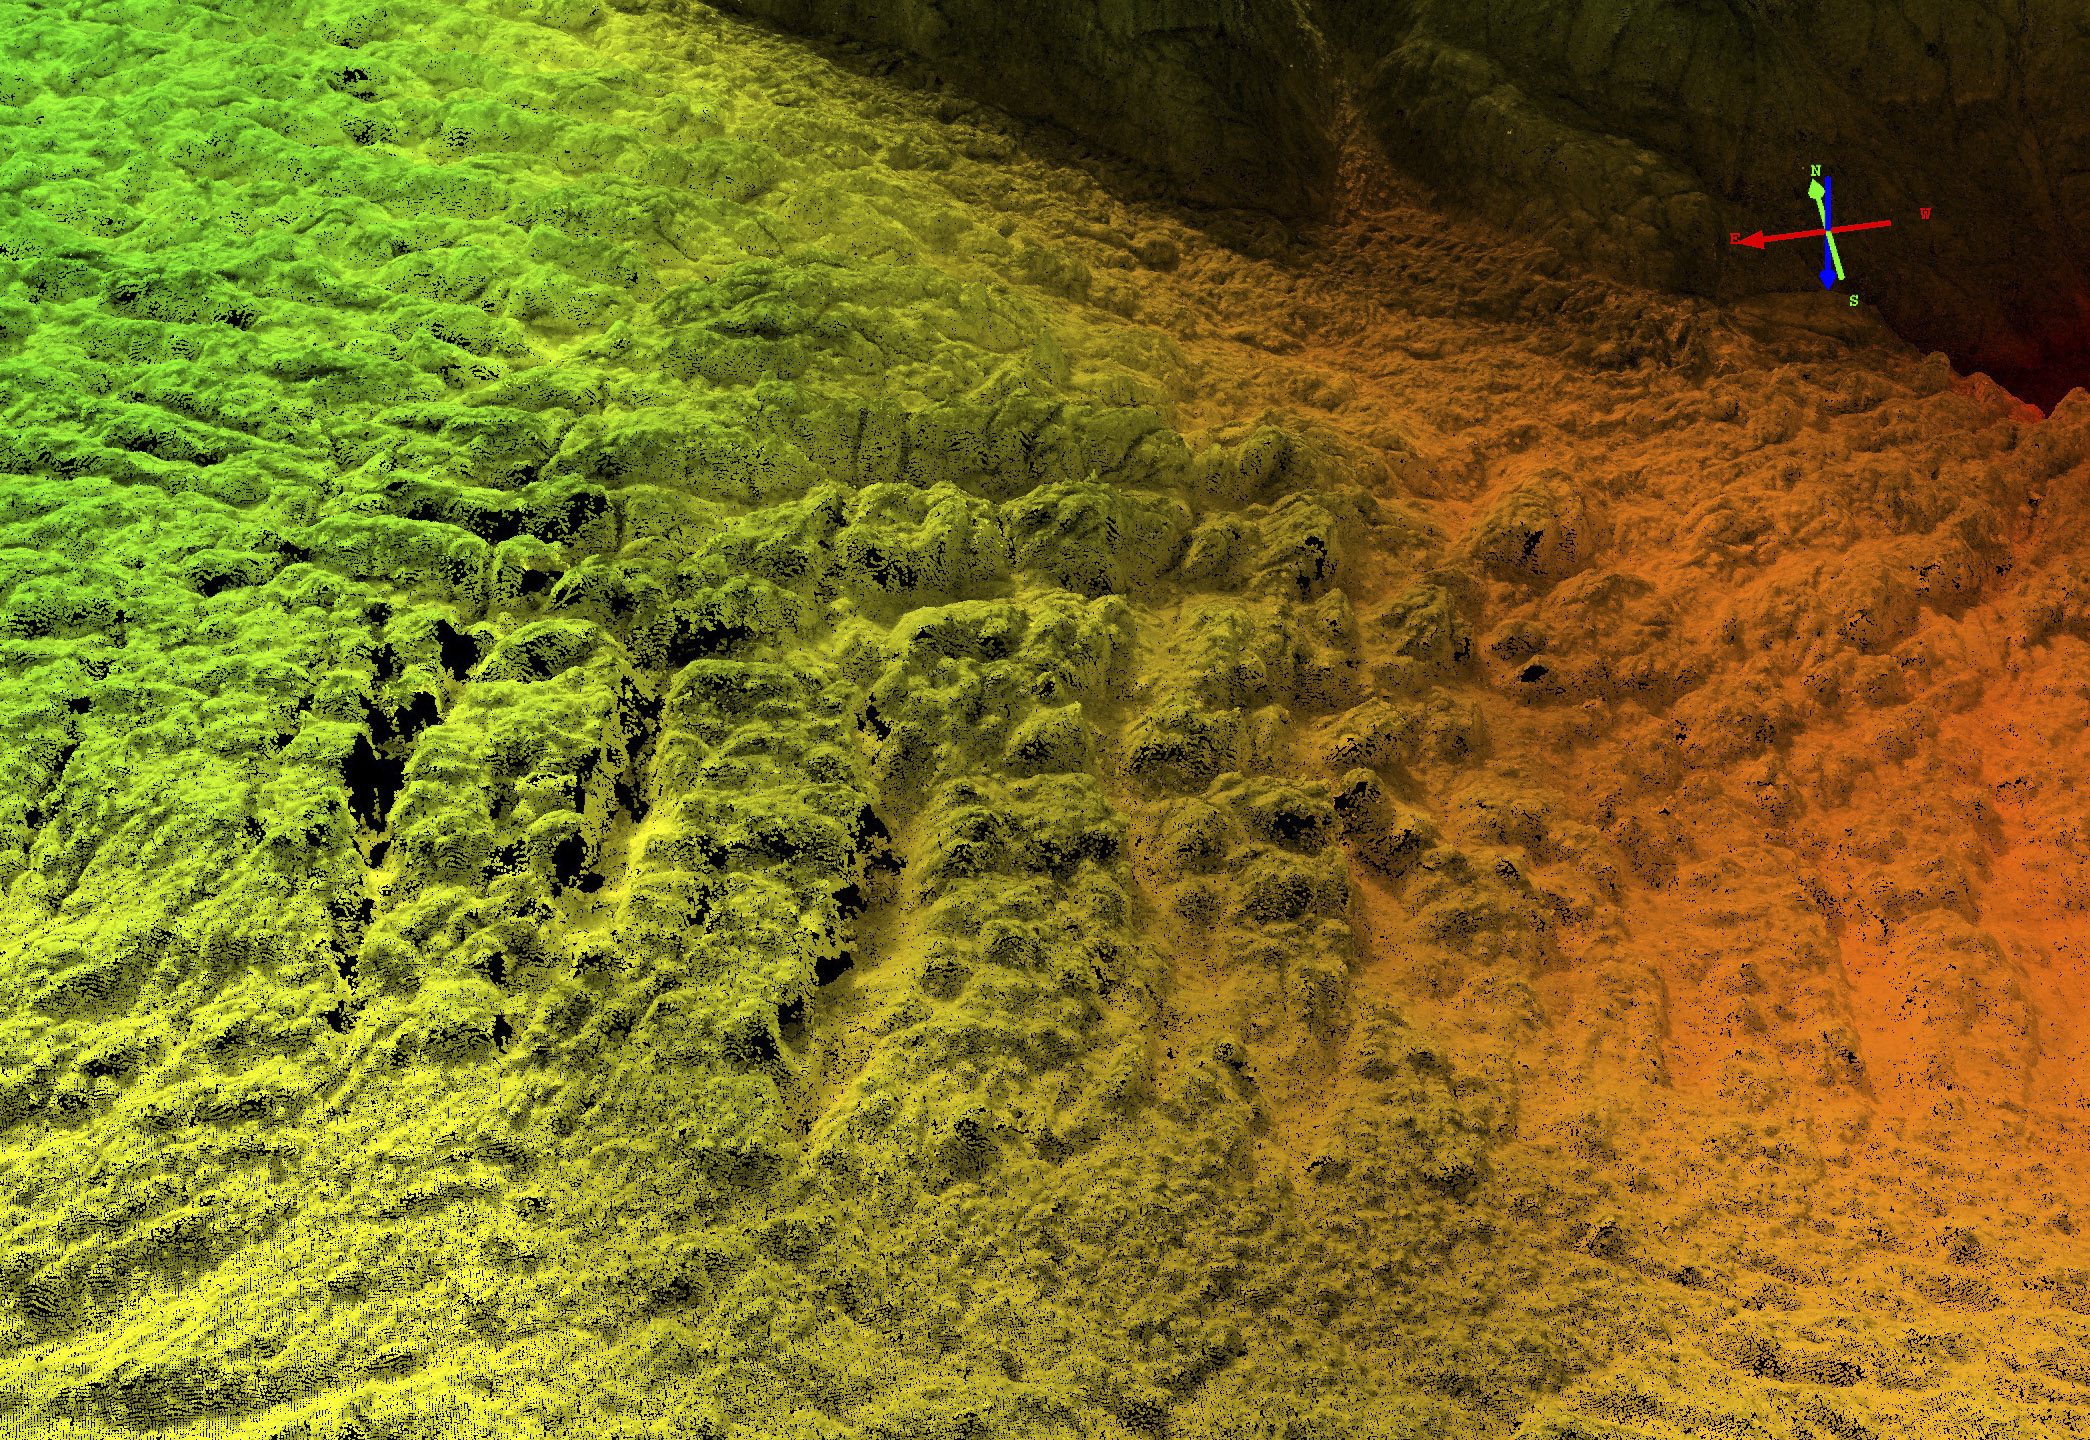
Here’s a close up of some crevasses on LeConte Glacier. I processed this at 90 cm posting for convenience, but many of the photos could support reconstructing topography at 20 cm or better. That’s superior to what modern satellites can do.
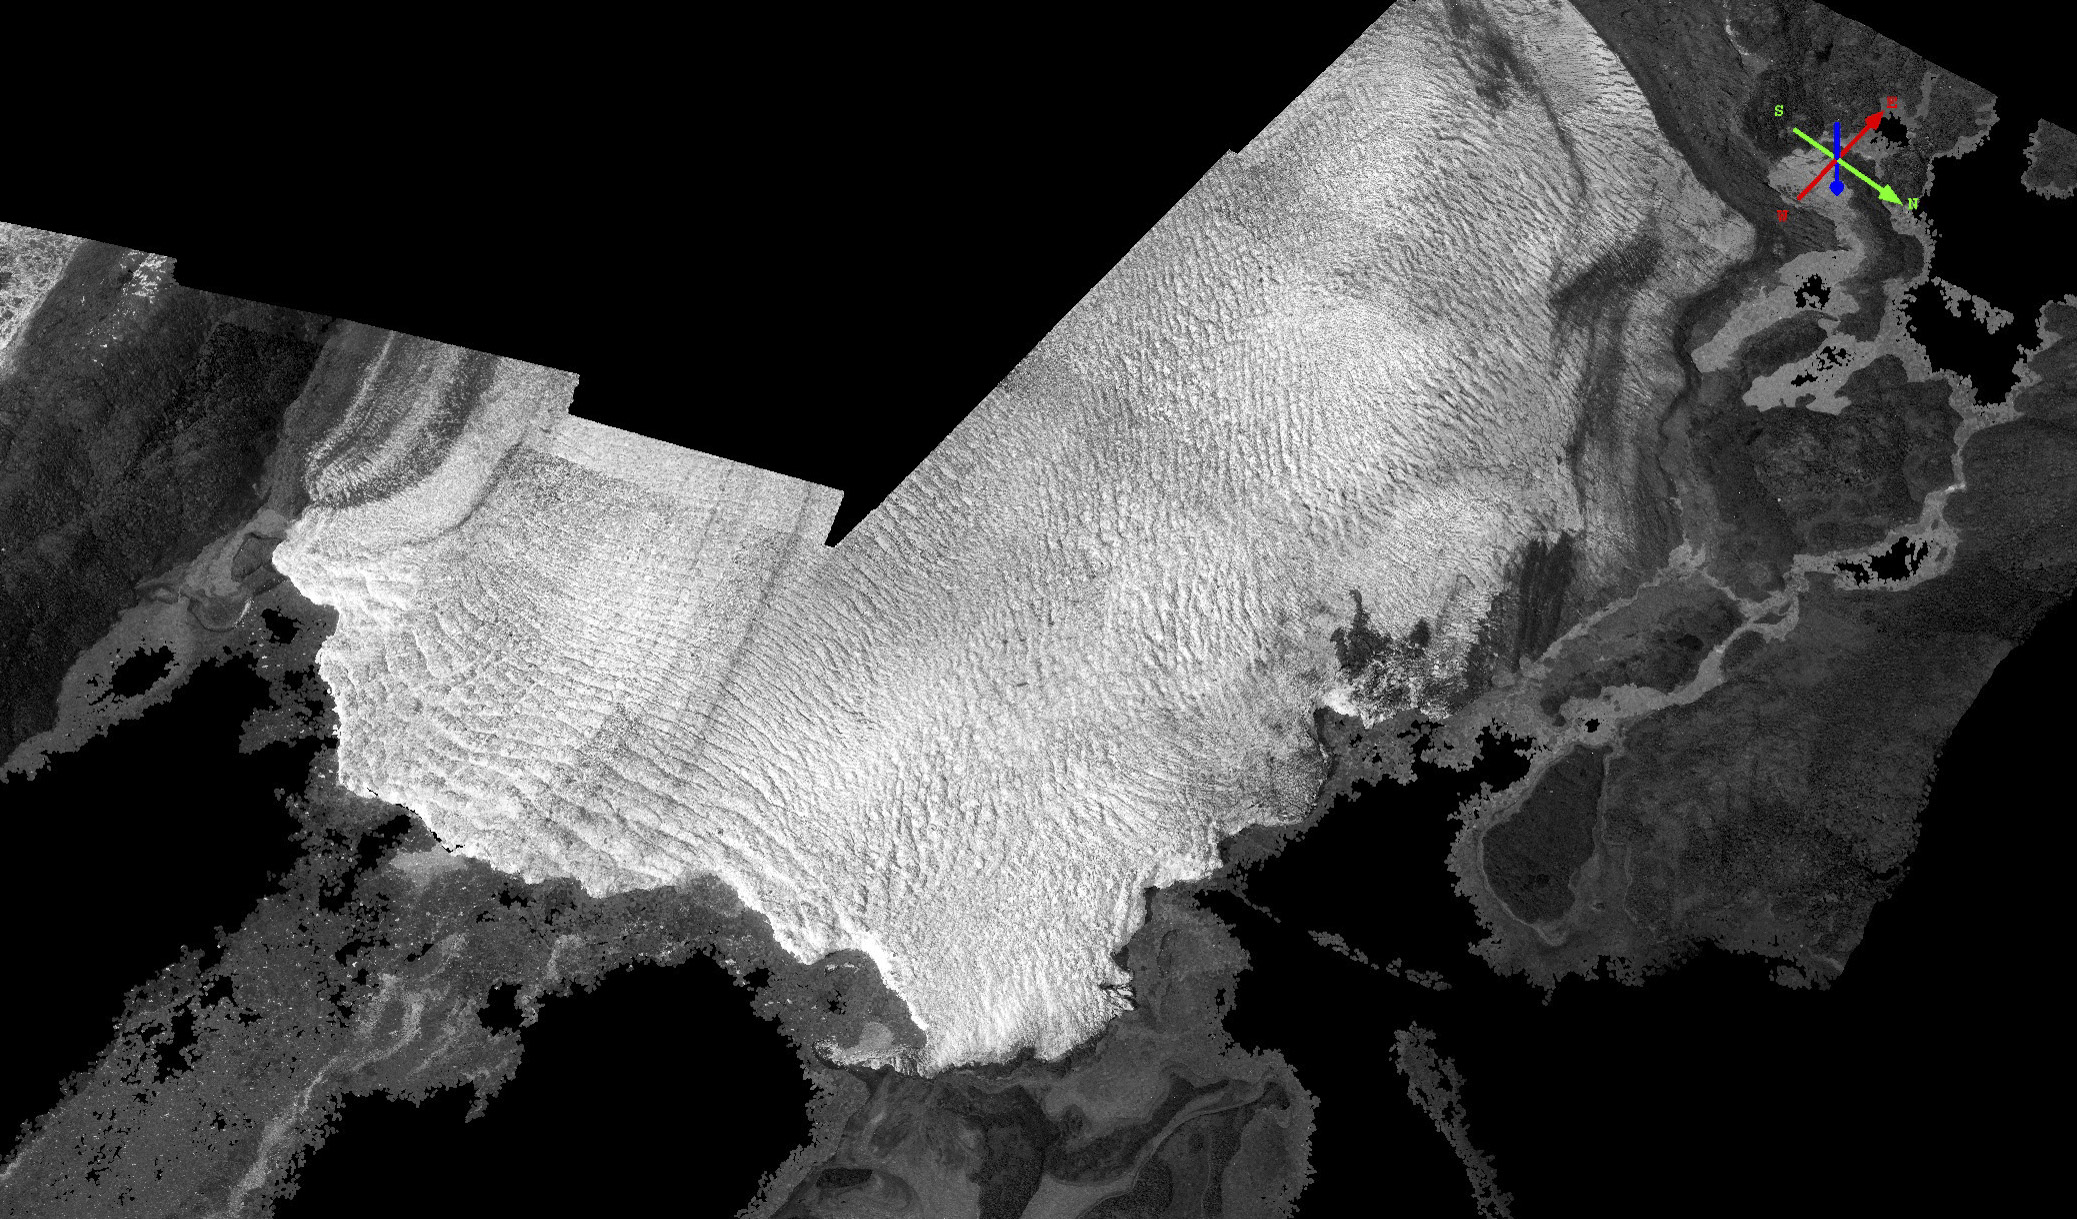
The topography of the terminus of Columbia Glacier in 1977, pre-retreat, while still resting on Heather Island; mouse-over to see the topography. The rapid retreat and demise of Columbia Glacier in the 1980s is perhaps the most well studied and comprehensive data set on a tidewater glacier retreat, and the time-series of DEMs we will create from this collection of photos is the (frozen) wet dream of a generation of glaciologists.
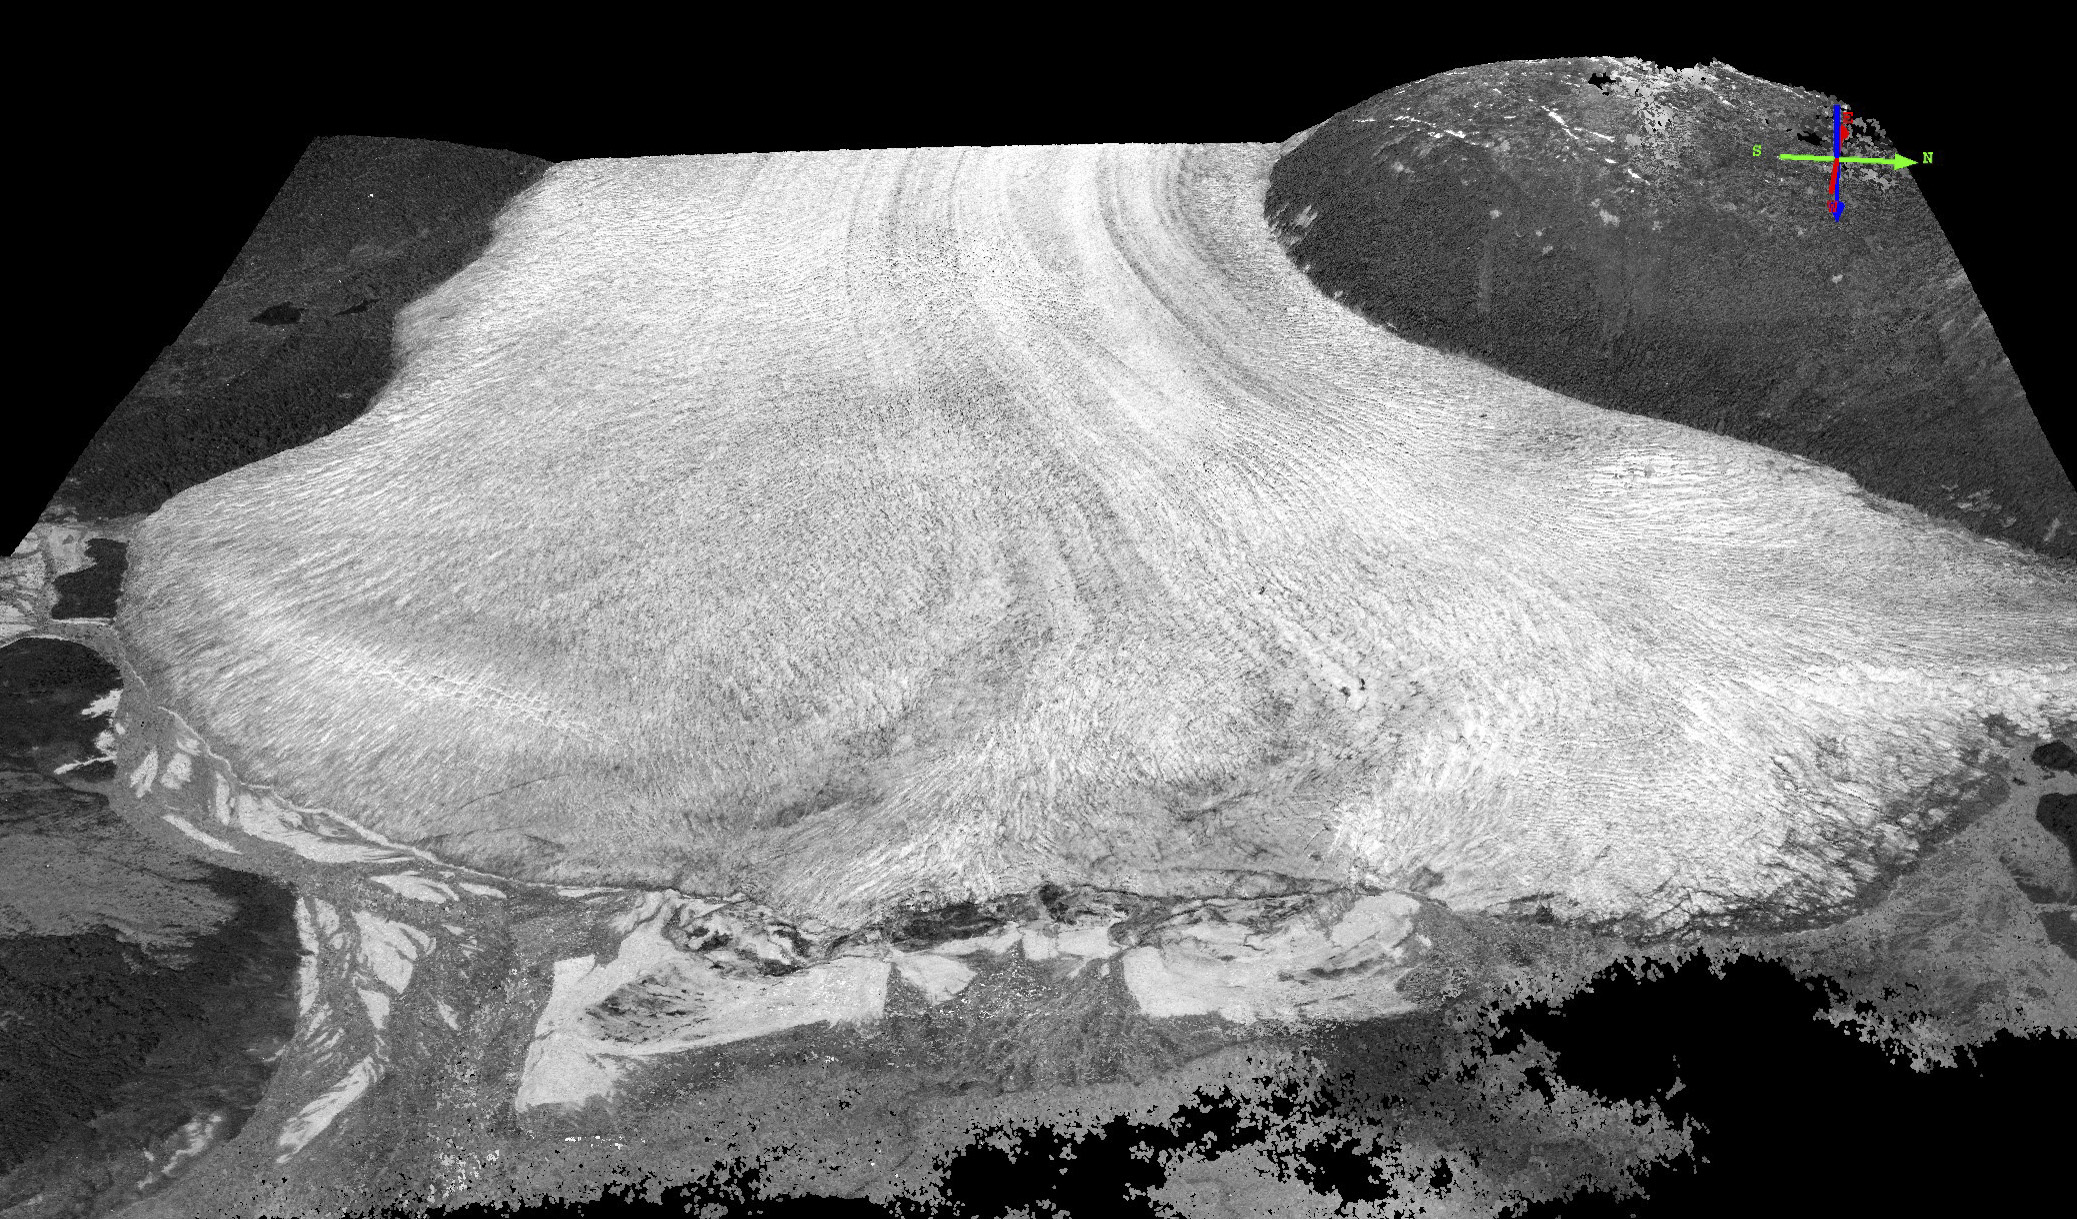
The terminus of Taku Glacier in 1977. Taku Glacier is my favorite along the coast for personal reasons, but scientifically it is an excellent counter-example to Columbia Glacier. At the same time that Columbia Glacier was massively wasting away and its icebergs sinking oil tankers, Taku Glacier was likely the fastest growing glacier in Alaska. Beginning in the early 1900s, it began advancing and had come to this position later in the century. Then, over the course of this photographic collection, we know that Taku Glacier grew in thickness by about 3 meters per year by excavating sediments below it, but we have almost no information on whether it grew by getting higher as well. Until now.
Though its taken a little longer than I would have liked, we are now getting close to releasing these data, hopefully in the next month or two. The DEMs we can create from these photos exceed the resolution of what even modern satellites can provide, and hopefully their accuracy will exceed them too, though this remains to be seen. Regardless, I believe these data will provide the next generation of glaciologists the ability to reinterpret and improve on nearly all prior studies of glaciers in Alaska. I have focused on tidewater glaciers here simply because they were on the film roll I started playing with to write this blog, but the collection also captures dozens of surging glacier cycles, numerous massive landslides (and pre-landslide topography), and the retreat of many ‘normal’ glaciers over this period. I cant think of a better means to educate the public on the impacts of climate change in the cryosphere, as well as how to disentangle and demonstrate non-climate driven influences on glacier dynamics, and I look forward to putting these data into the hands of those who will make such good use of them soon, and that’s no April’s Fool joke.
