A first look at the latest map of Unalakleet
Since my arrival in Unalakleet the weather has deteriorated. Yesterday brought consistently low ceilings throughout Norton Sound, with winds increasing as the day wore on. This morning I woke to pure IFR, with fog, wind, and rain. So I got to know town little better and caught up on sleep while I processed the map I made of town on my arrival.
The results were as expected — terrific. When I made a similar map last year, I was a bit surprised to find that the beach was 8 meters above sea level, as normally my vertical errors are less than half a meter. That was one of my first acquisitions with so much ocean in it, so I figured it must have something to do with the moving water confusing the software. Yesterday I processed the data differently and discovered the true cause. The elevations found on every map are relative to some ‘zero’ elevation, but this zero elevation varies from map to map. Most maps use sea level as zero elevation, but sea level turns out to be a tricky thing to know exactly, so there are a number of approximations. The simplest, and perhaps best, approximation is called an ellipsoid — basically a sphere-like shape that comes pretty close to approximating the surface of the earth as if the earth was all ocean. All you need to know to define an ellipsoid is the center of the earth and the distance from there to the poles and equator. But ‘pretty close’ leads to errors in actual sea level of up to tens of meters. The variations are largely caused by the gravitational field caused by the solid parts of the earth — mountains, tectonic plates, density of rocks, etc. So ‘sea level’ itself varies by up to tens of meters across all of the oceans. It was this variation in height in fact that led to our first good maps of the ocean floor, made by measuring the height of the ocean surface, as the surface height reflected the gravitational pull of the floor below. Anyway, the best approximations for sea level come from creating geoids, essentially a map of the gravitational field of the earth that defines a surface with a constant gravitational field that approximates sea level, to oversimplify a bit. Geoid models can be very complex, because the variations in gravity are very complex, and they are improving constantly as our knowledge of the earth’s gravitational field improves. All this going to say that when I processed my data relative to the latest geoid model, my sea level came out only 1.5 meters above zero. While much better, I was still surprised it was this far off. When I asked Nicole about how accurate the current geoid model is in this area, she told me it was about 1.5 meters too high, not knowing what my ‘error’ was. Thus, my results would appear to be spot on — an encouraging start to a project focused on measuring coastlines…
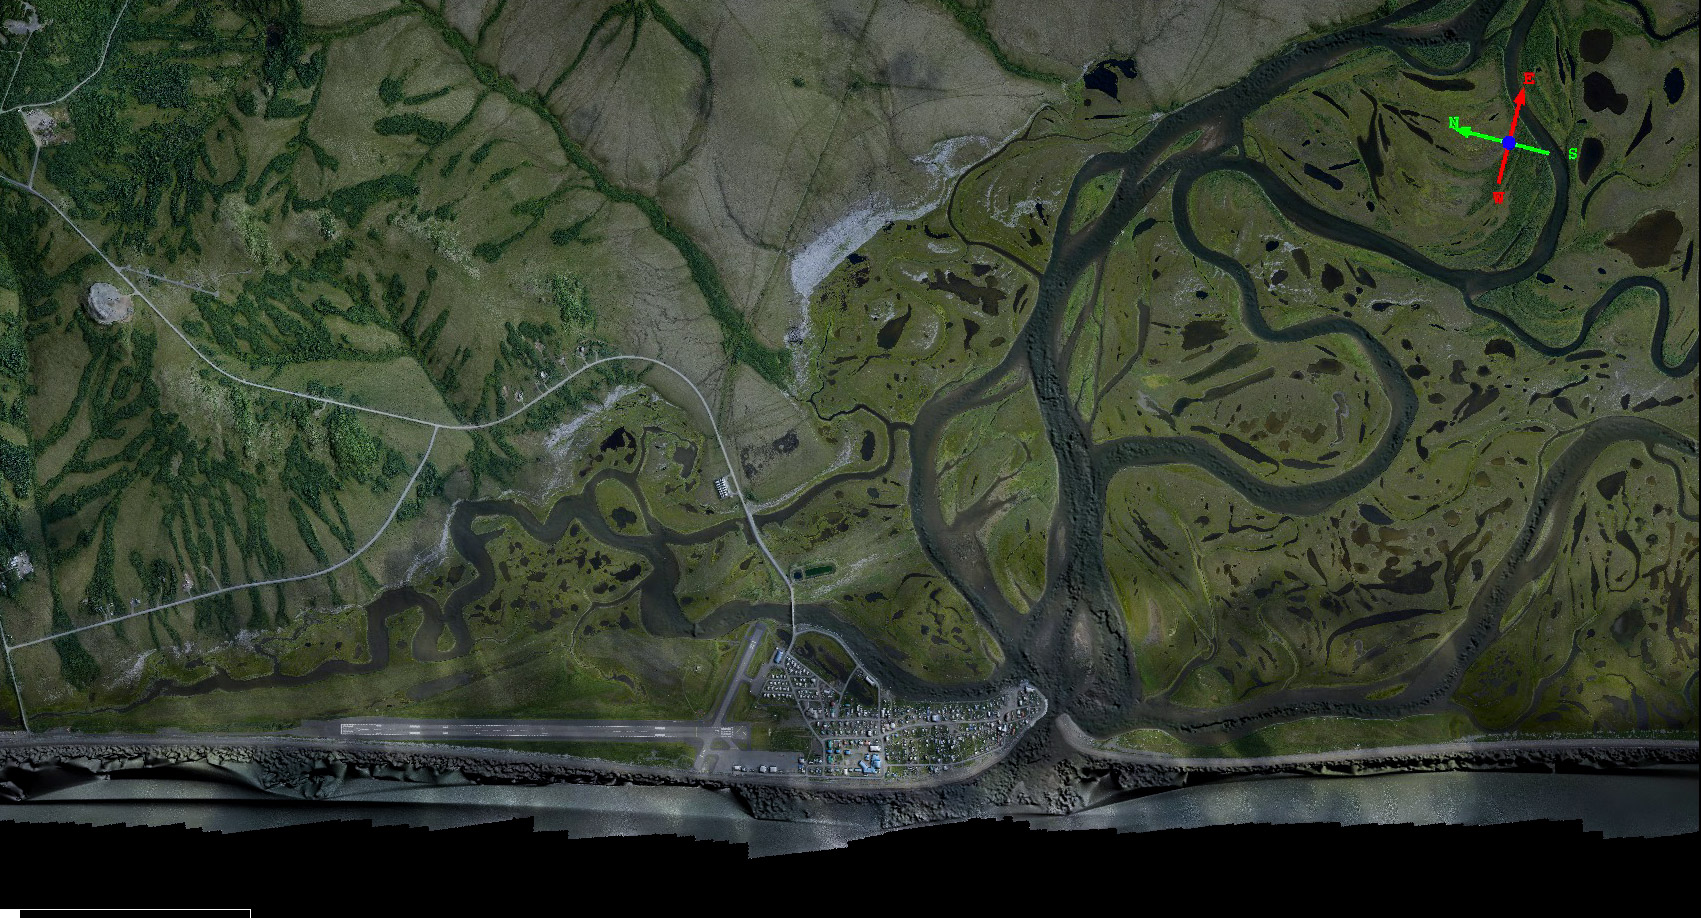
Here’s a cut out of the map. Mouse-over to see the topography created by the same images.
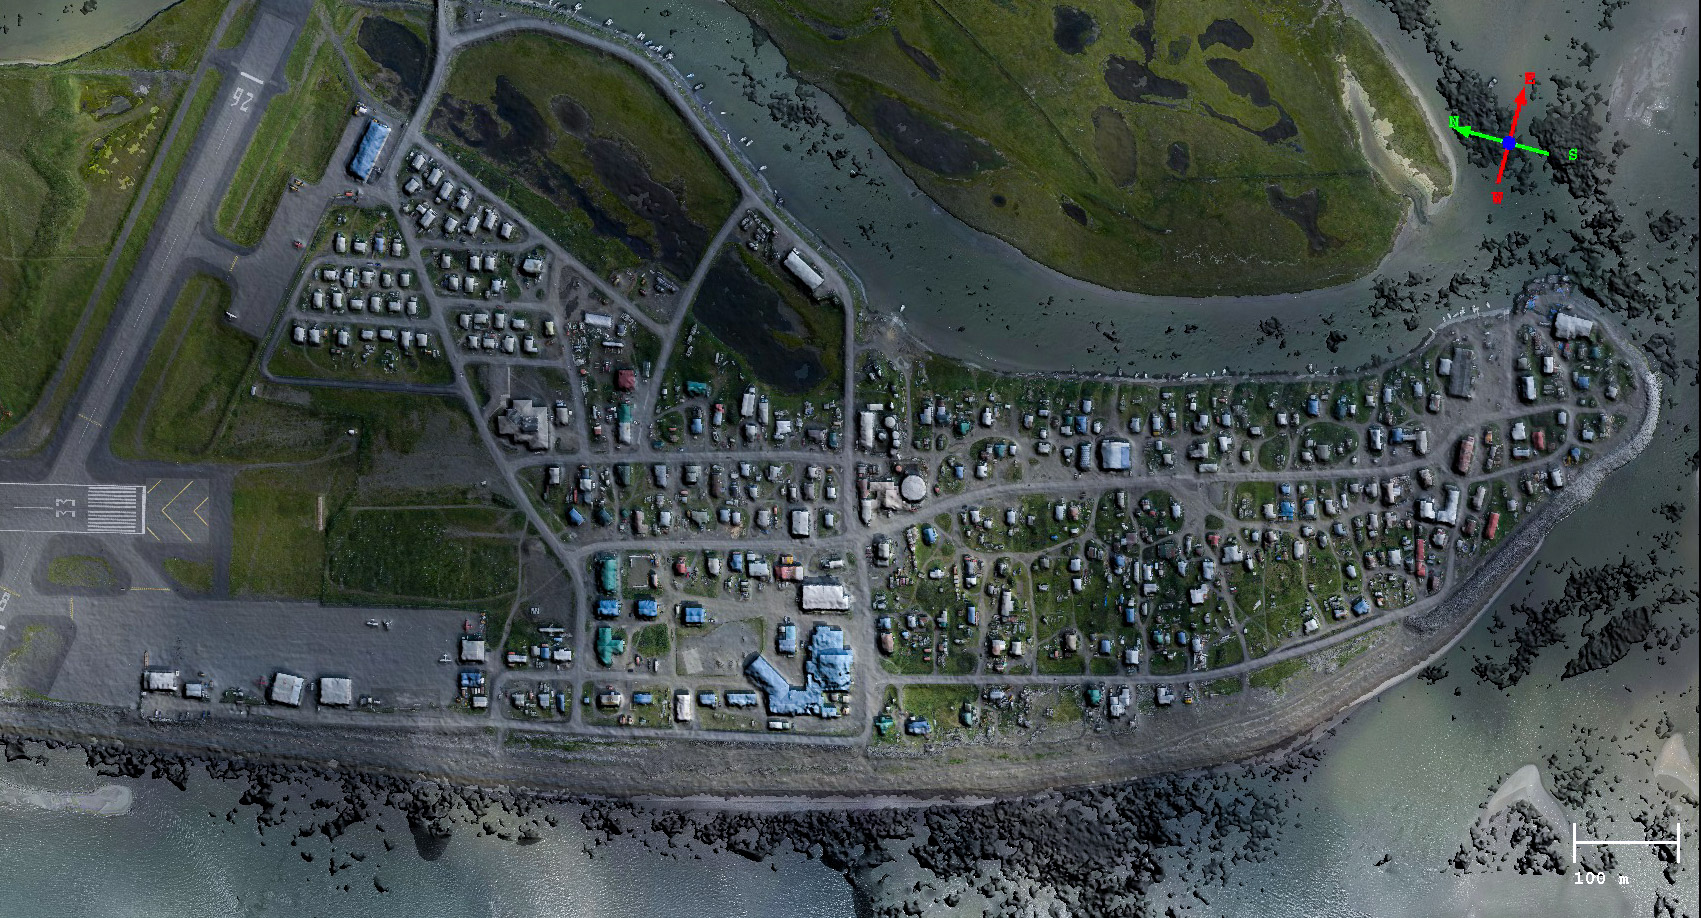
Here’s main part of town. Mouse-over to see its topography.
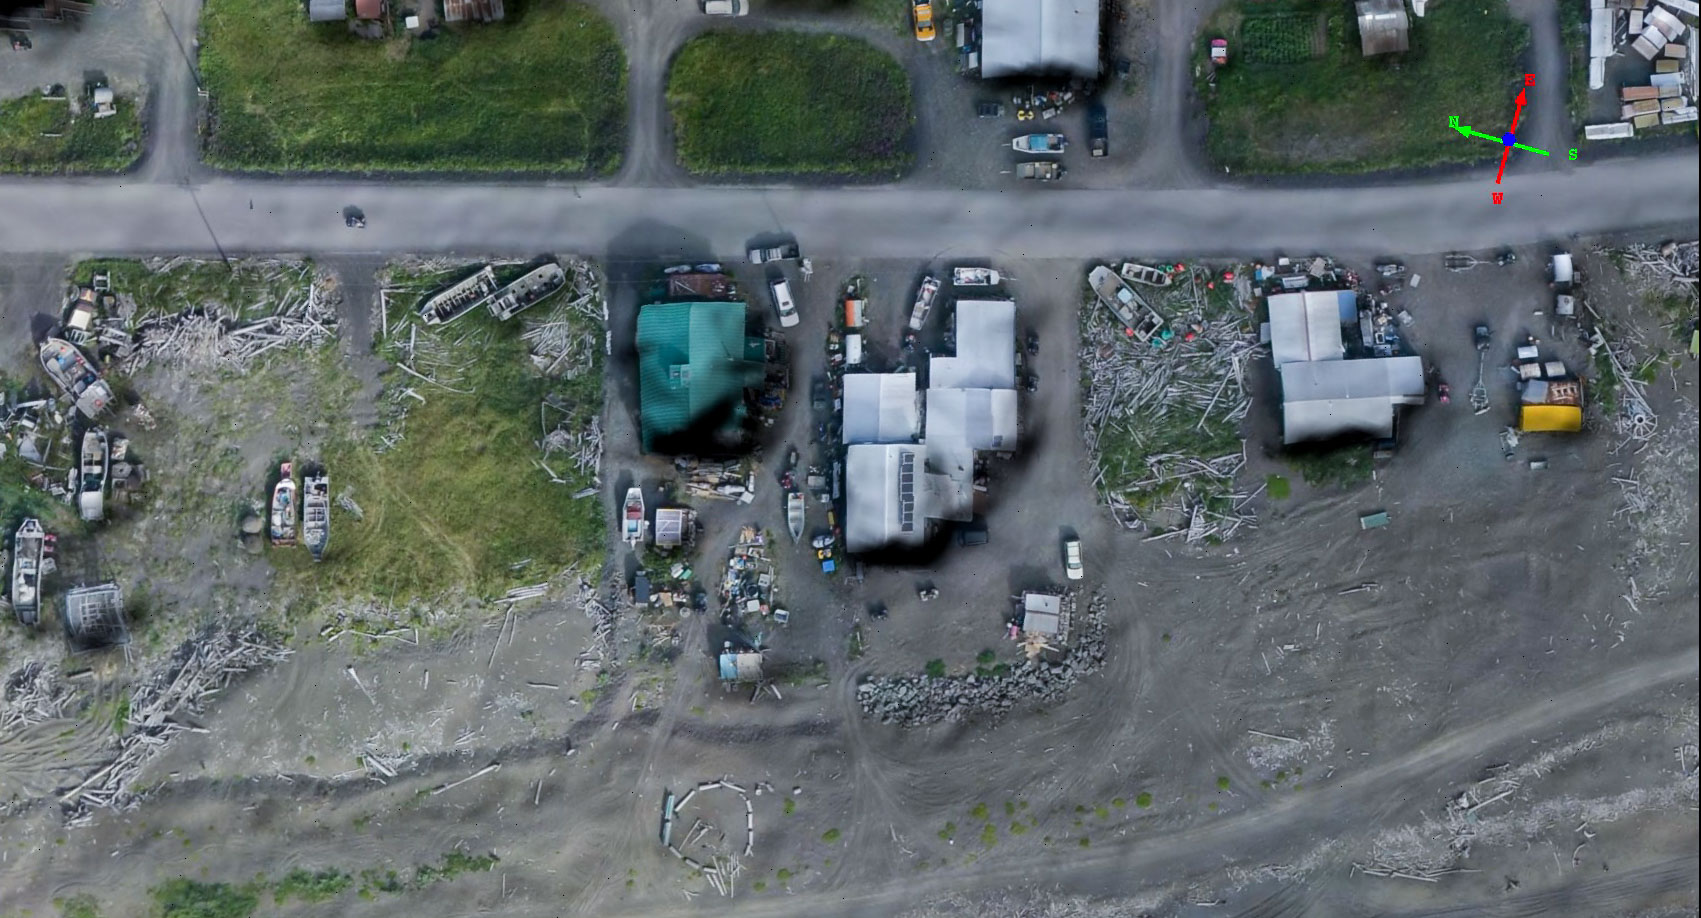
You can tell who has ocean front property by the amount of driftwood in their yard…
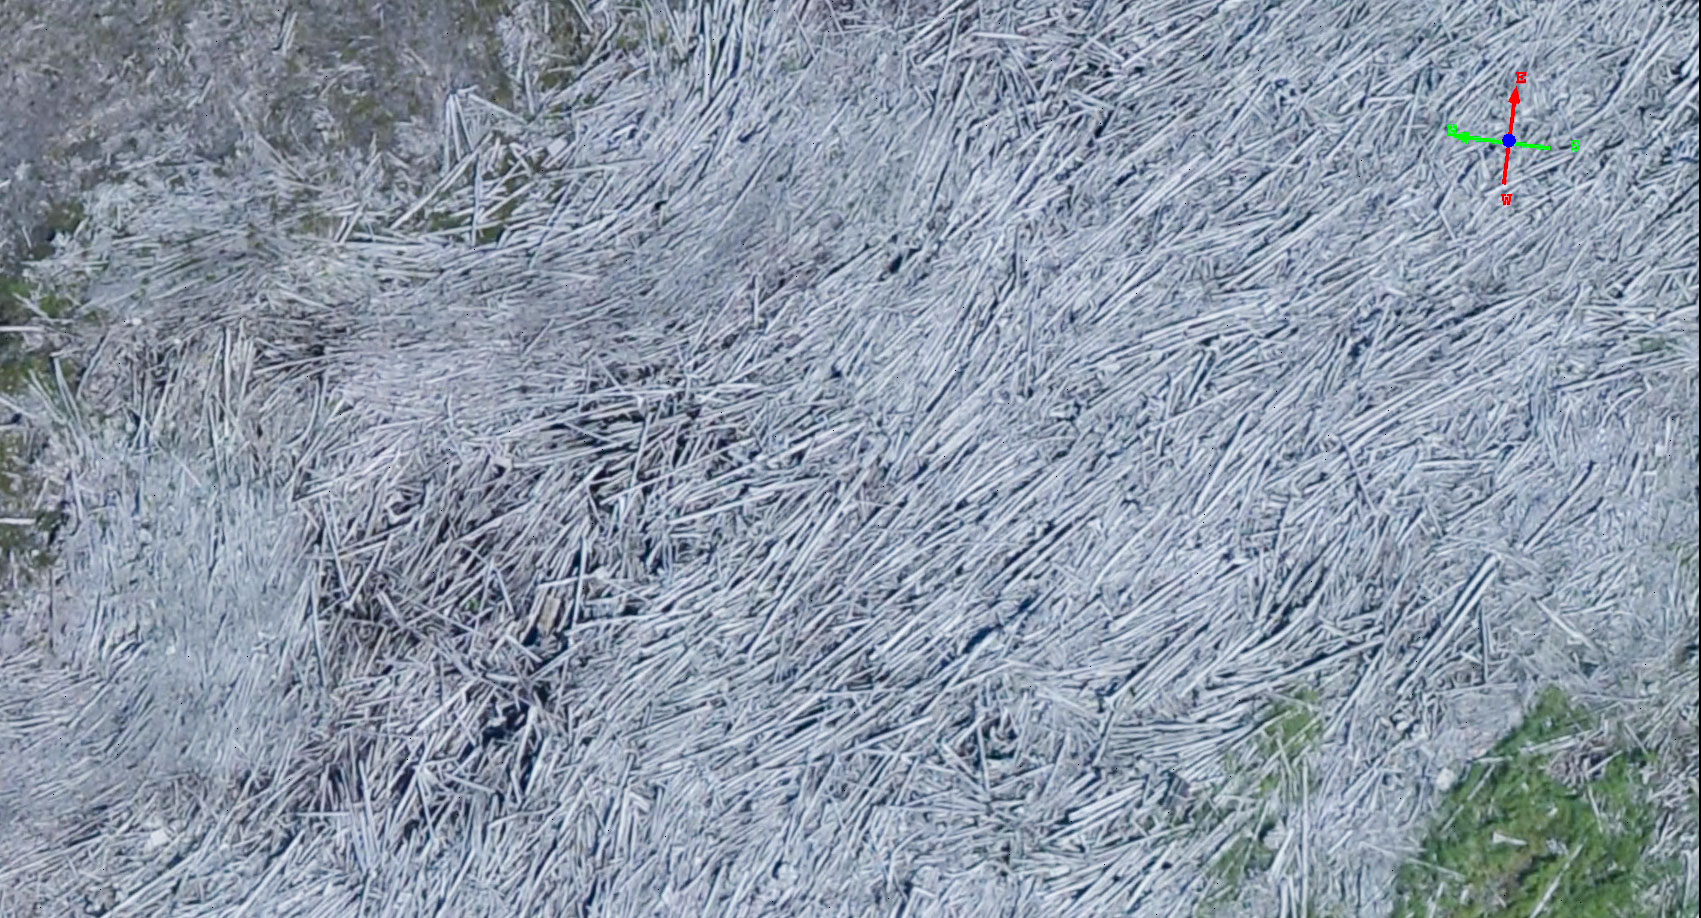
This driftwood pile is several miles inland, so no one is safe really.
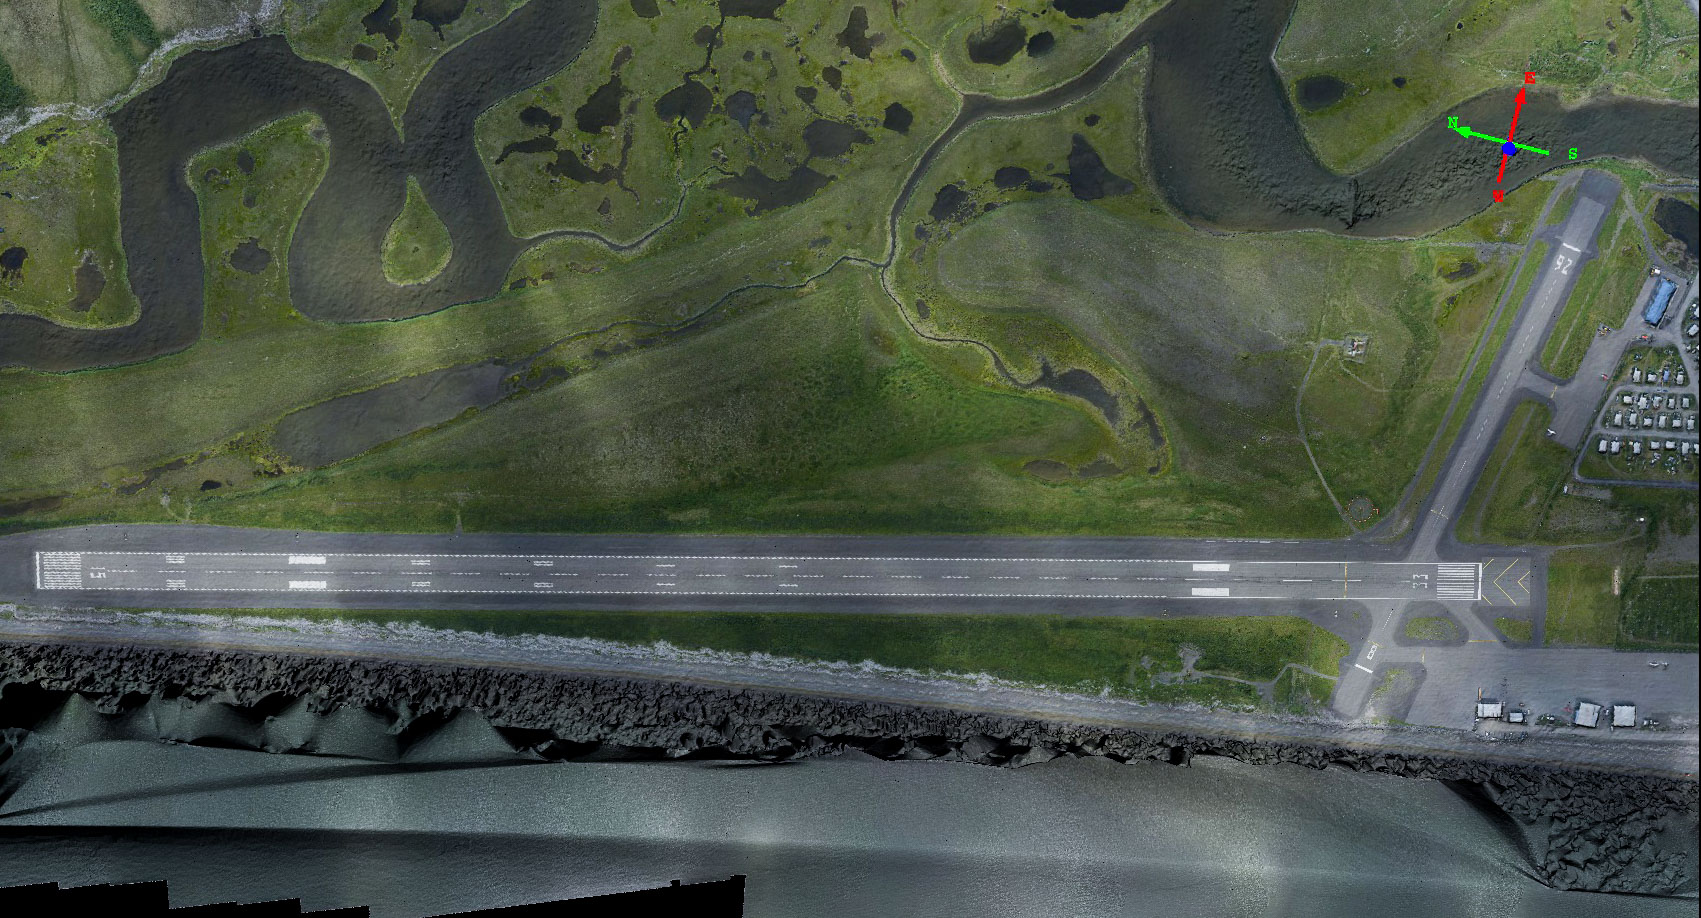
There are two main runways. The big planes and the 207 studs use the big one in what seems like almost any weather.
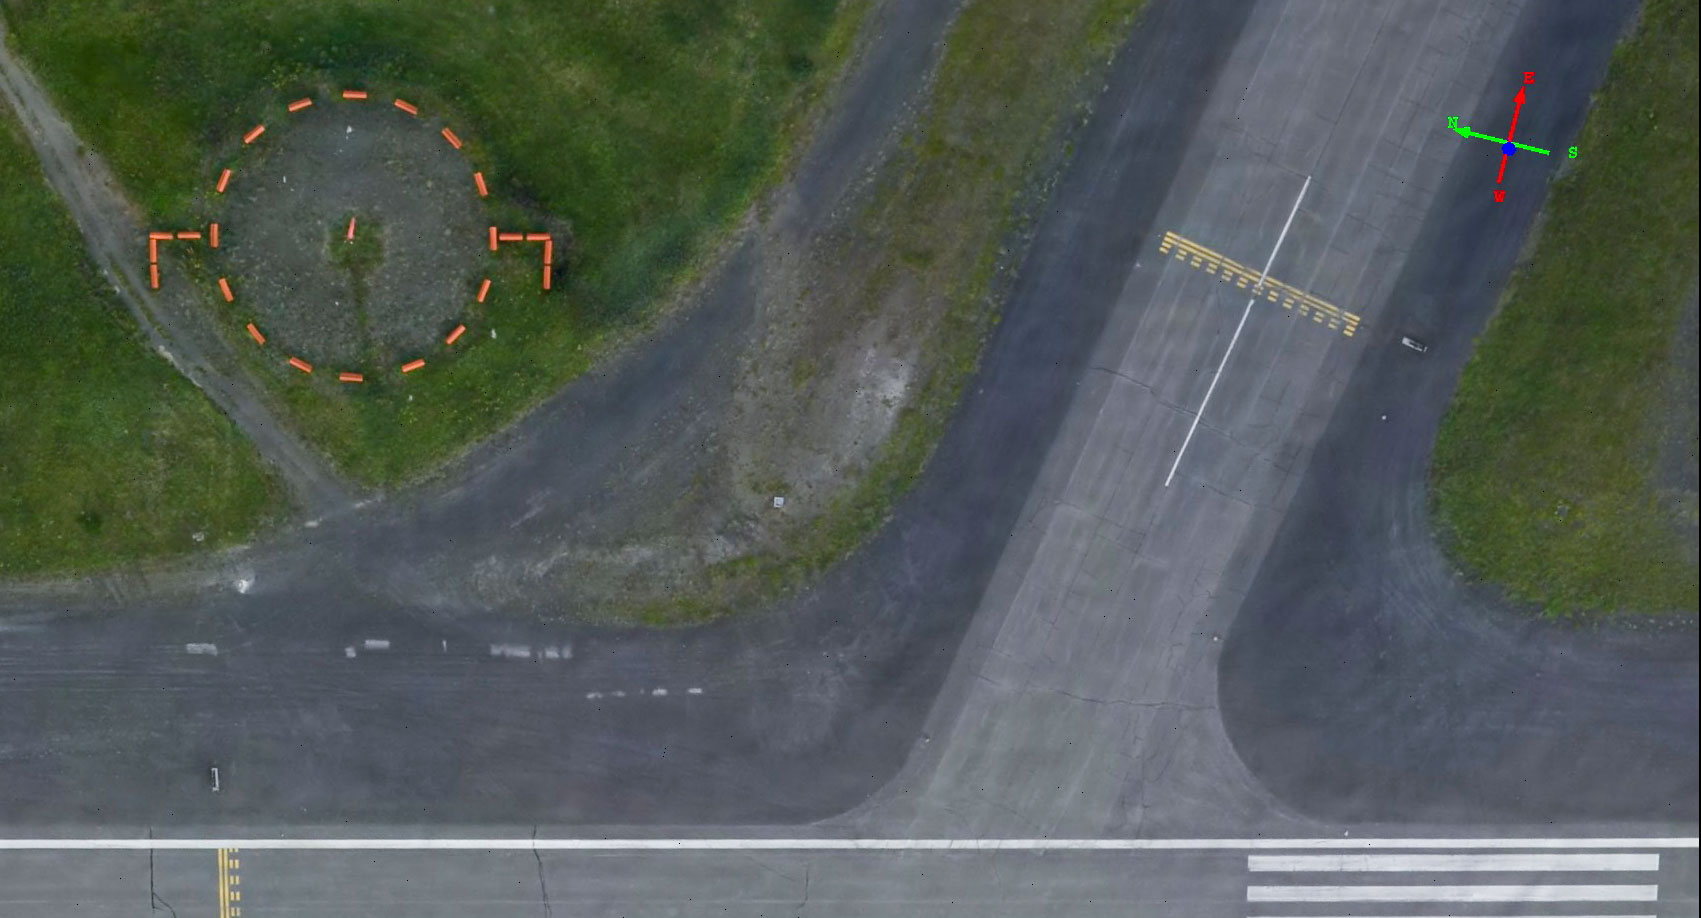
Cowards like me land into the wind whenever possible. In this case, winds were favoring the little runway. The challenge with the little runway is not to land long unless you have floats…
After having fun exploring the details of the map, given the weather I spent some time learning what I could from it about flooding. I’m not by any means a coastal expert, but I know that one of the purposes of these maps is to use them to help with predictions of flooding extents to help improve village planning decisions. So I started exploring what would happen to the town if the ocean rose, for whatever reasons. I created the video below showing some of those results.
