
New Map of Aufeis Affecting Dalton Highway
A week ago today I was flying over the haul road near Deadhorse acquiring photos to make a map of the aufeis threatening to close the haul road, and today I delivered that map. Snow and ice are great features to map because they always have a huge amount of texture, and it is that texture that largely controls the density of points measured by this technique. The resulting data quality of this map is among the best of all the maps I’ve made. In this case, I mapped about 80 km2 (20,000 acres) with pixels 18 cm on a side, totaling about 2.4 billion measurements with a precision likely better than 10 cm. Overall map accuracy is likely the same as usual, or about 30 cm, meaning that with a few ground control points map accuracy will reduce to the precision level. With a time-series of maps like this, everything needed to understand the physical dynamics of this aufeis and how it may affect the road can be understood.
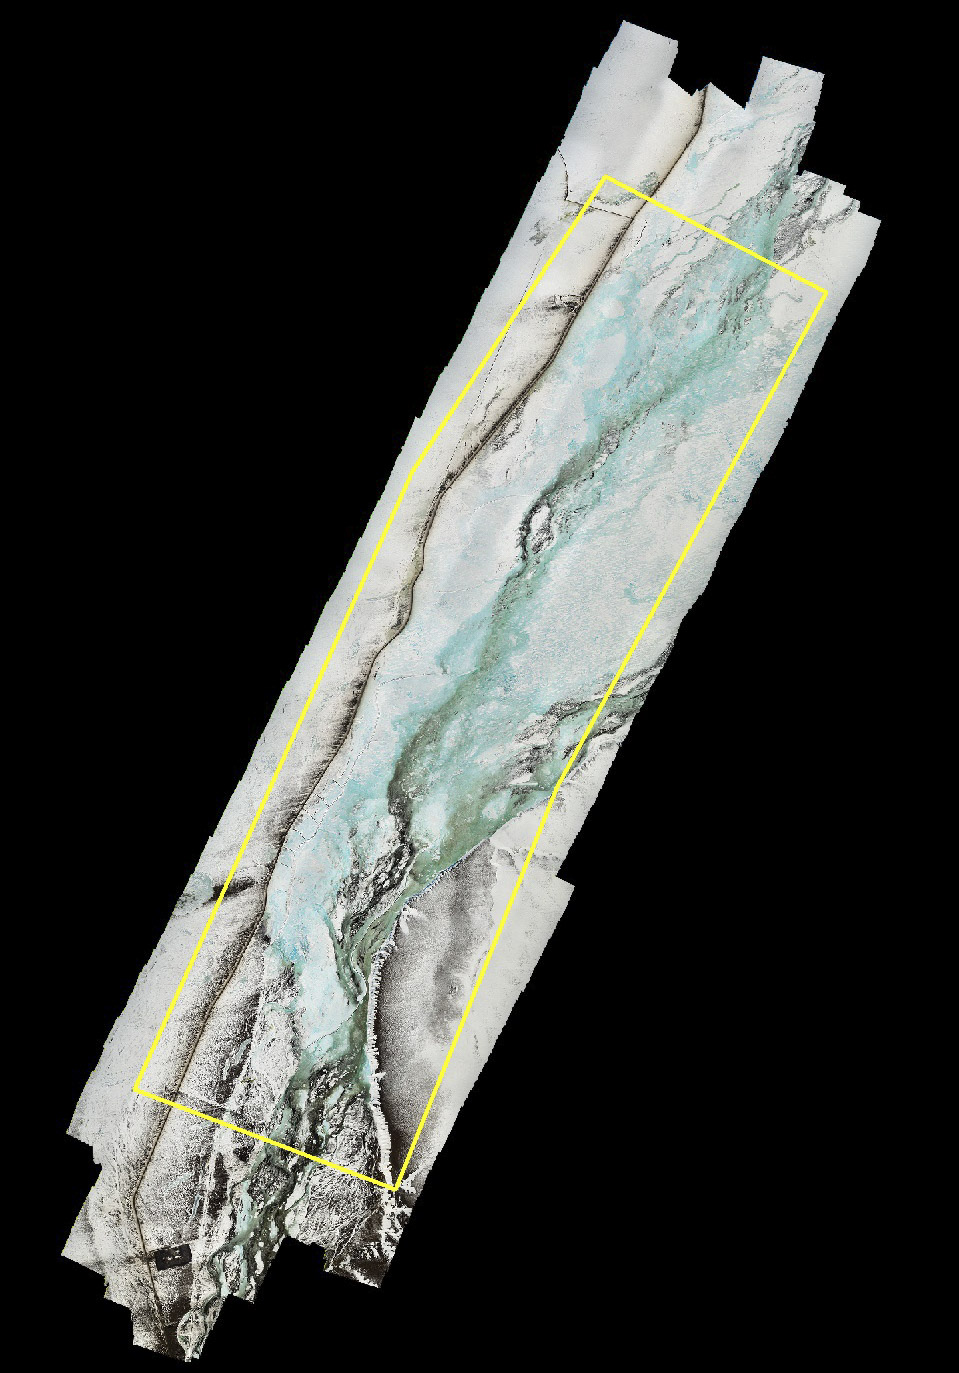
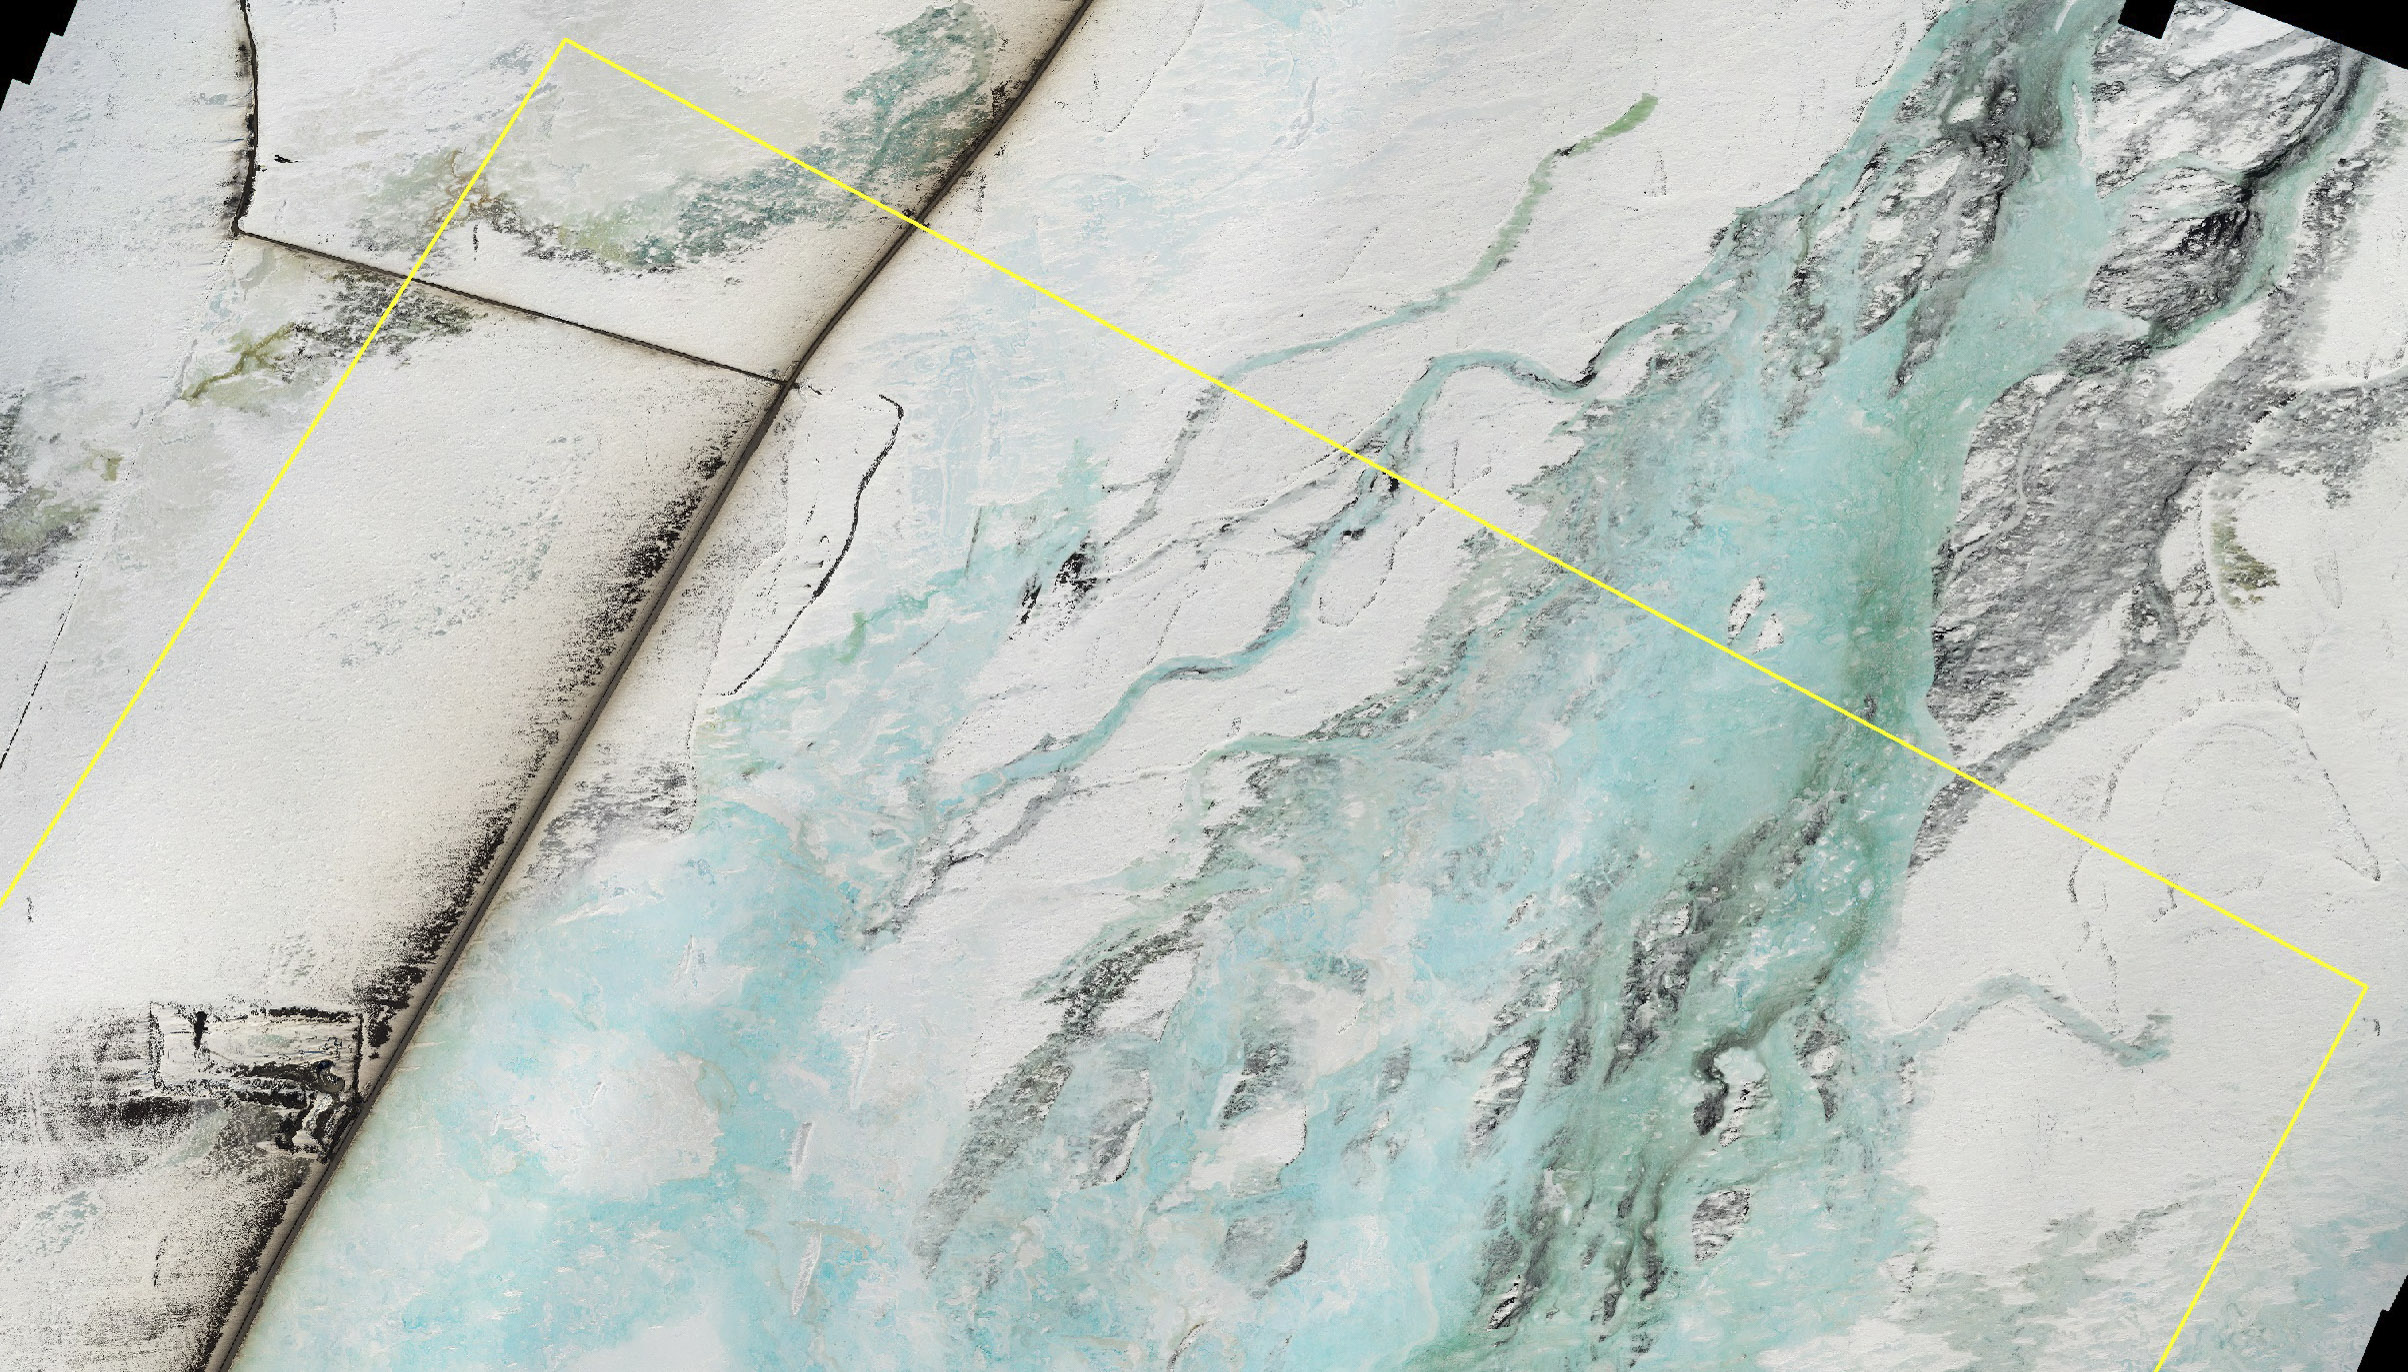
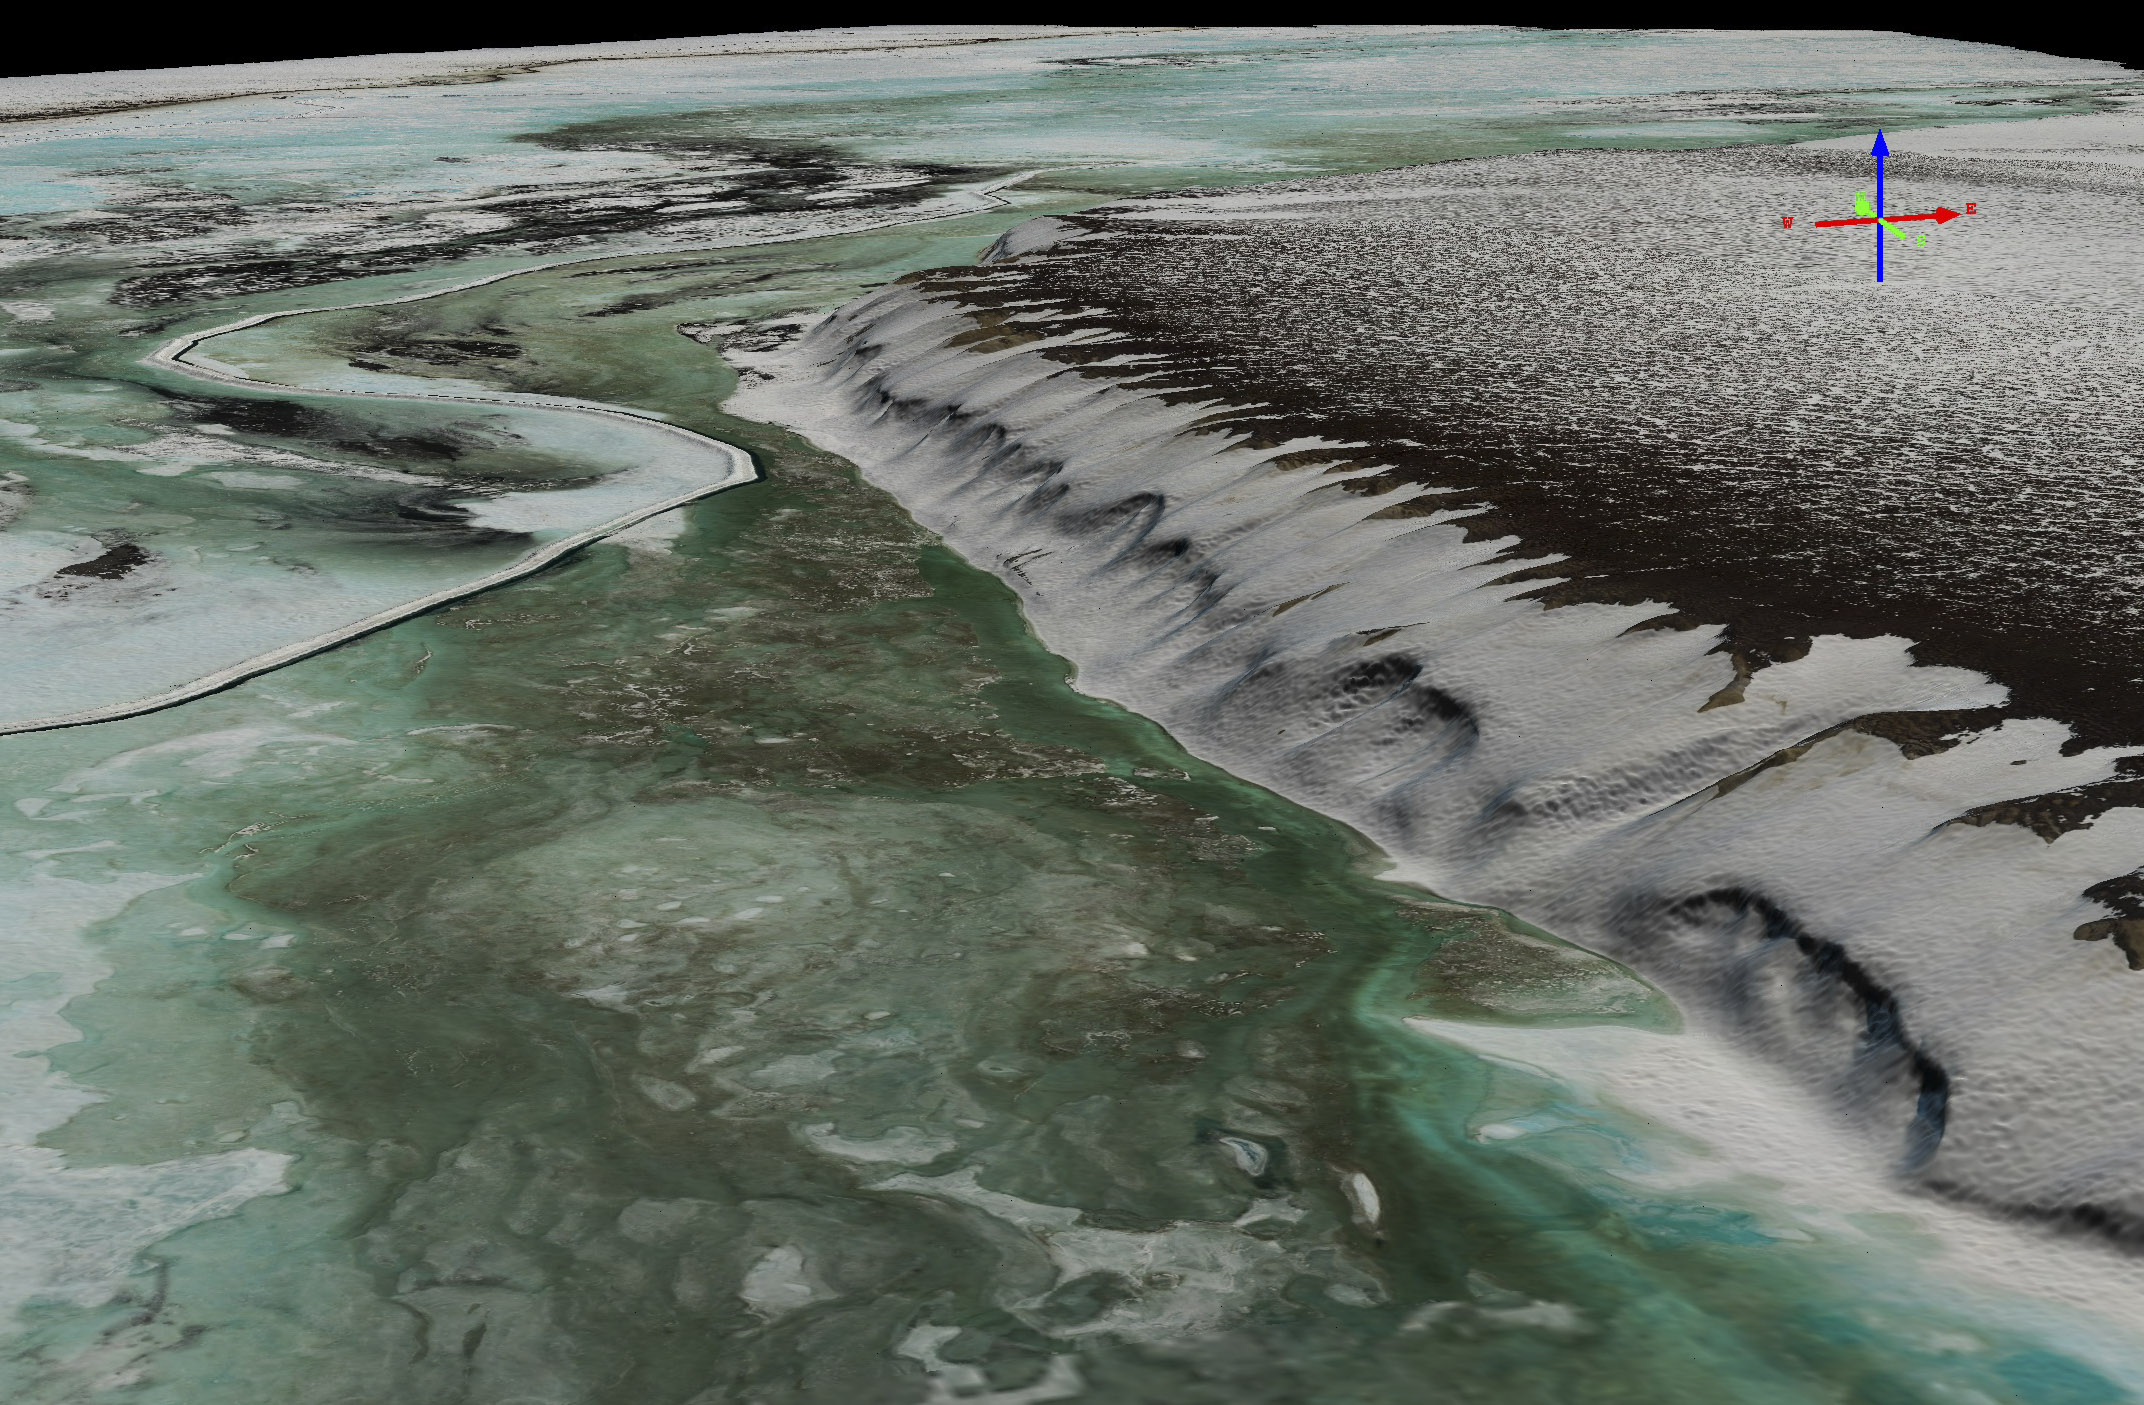
The yellow box was the area of interest for the project. I delivered what is shown here, substantially more than the box, and I acquired much more as described here which I have yet to process. I extended the southern boundary because I was interested to see what was going on at the material pit seen near the bottom, as shown in detail later. The road is the long, linear feature running along the western (left) edge; the aufeis is the blue colored stuff, though some of it is overlain by white snow. Deadhorse is about 5 miles to the north (up). Mouse-over to see the topography, colored by elevation.
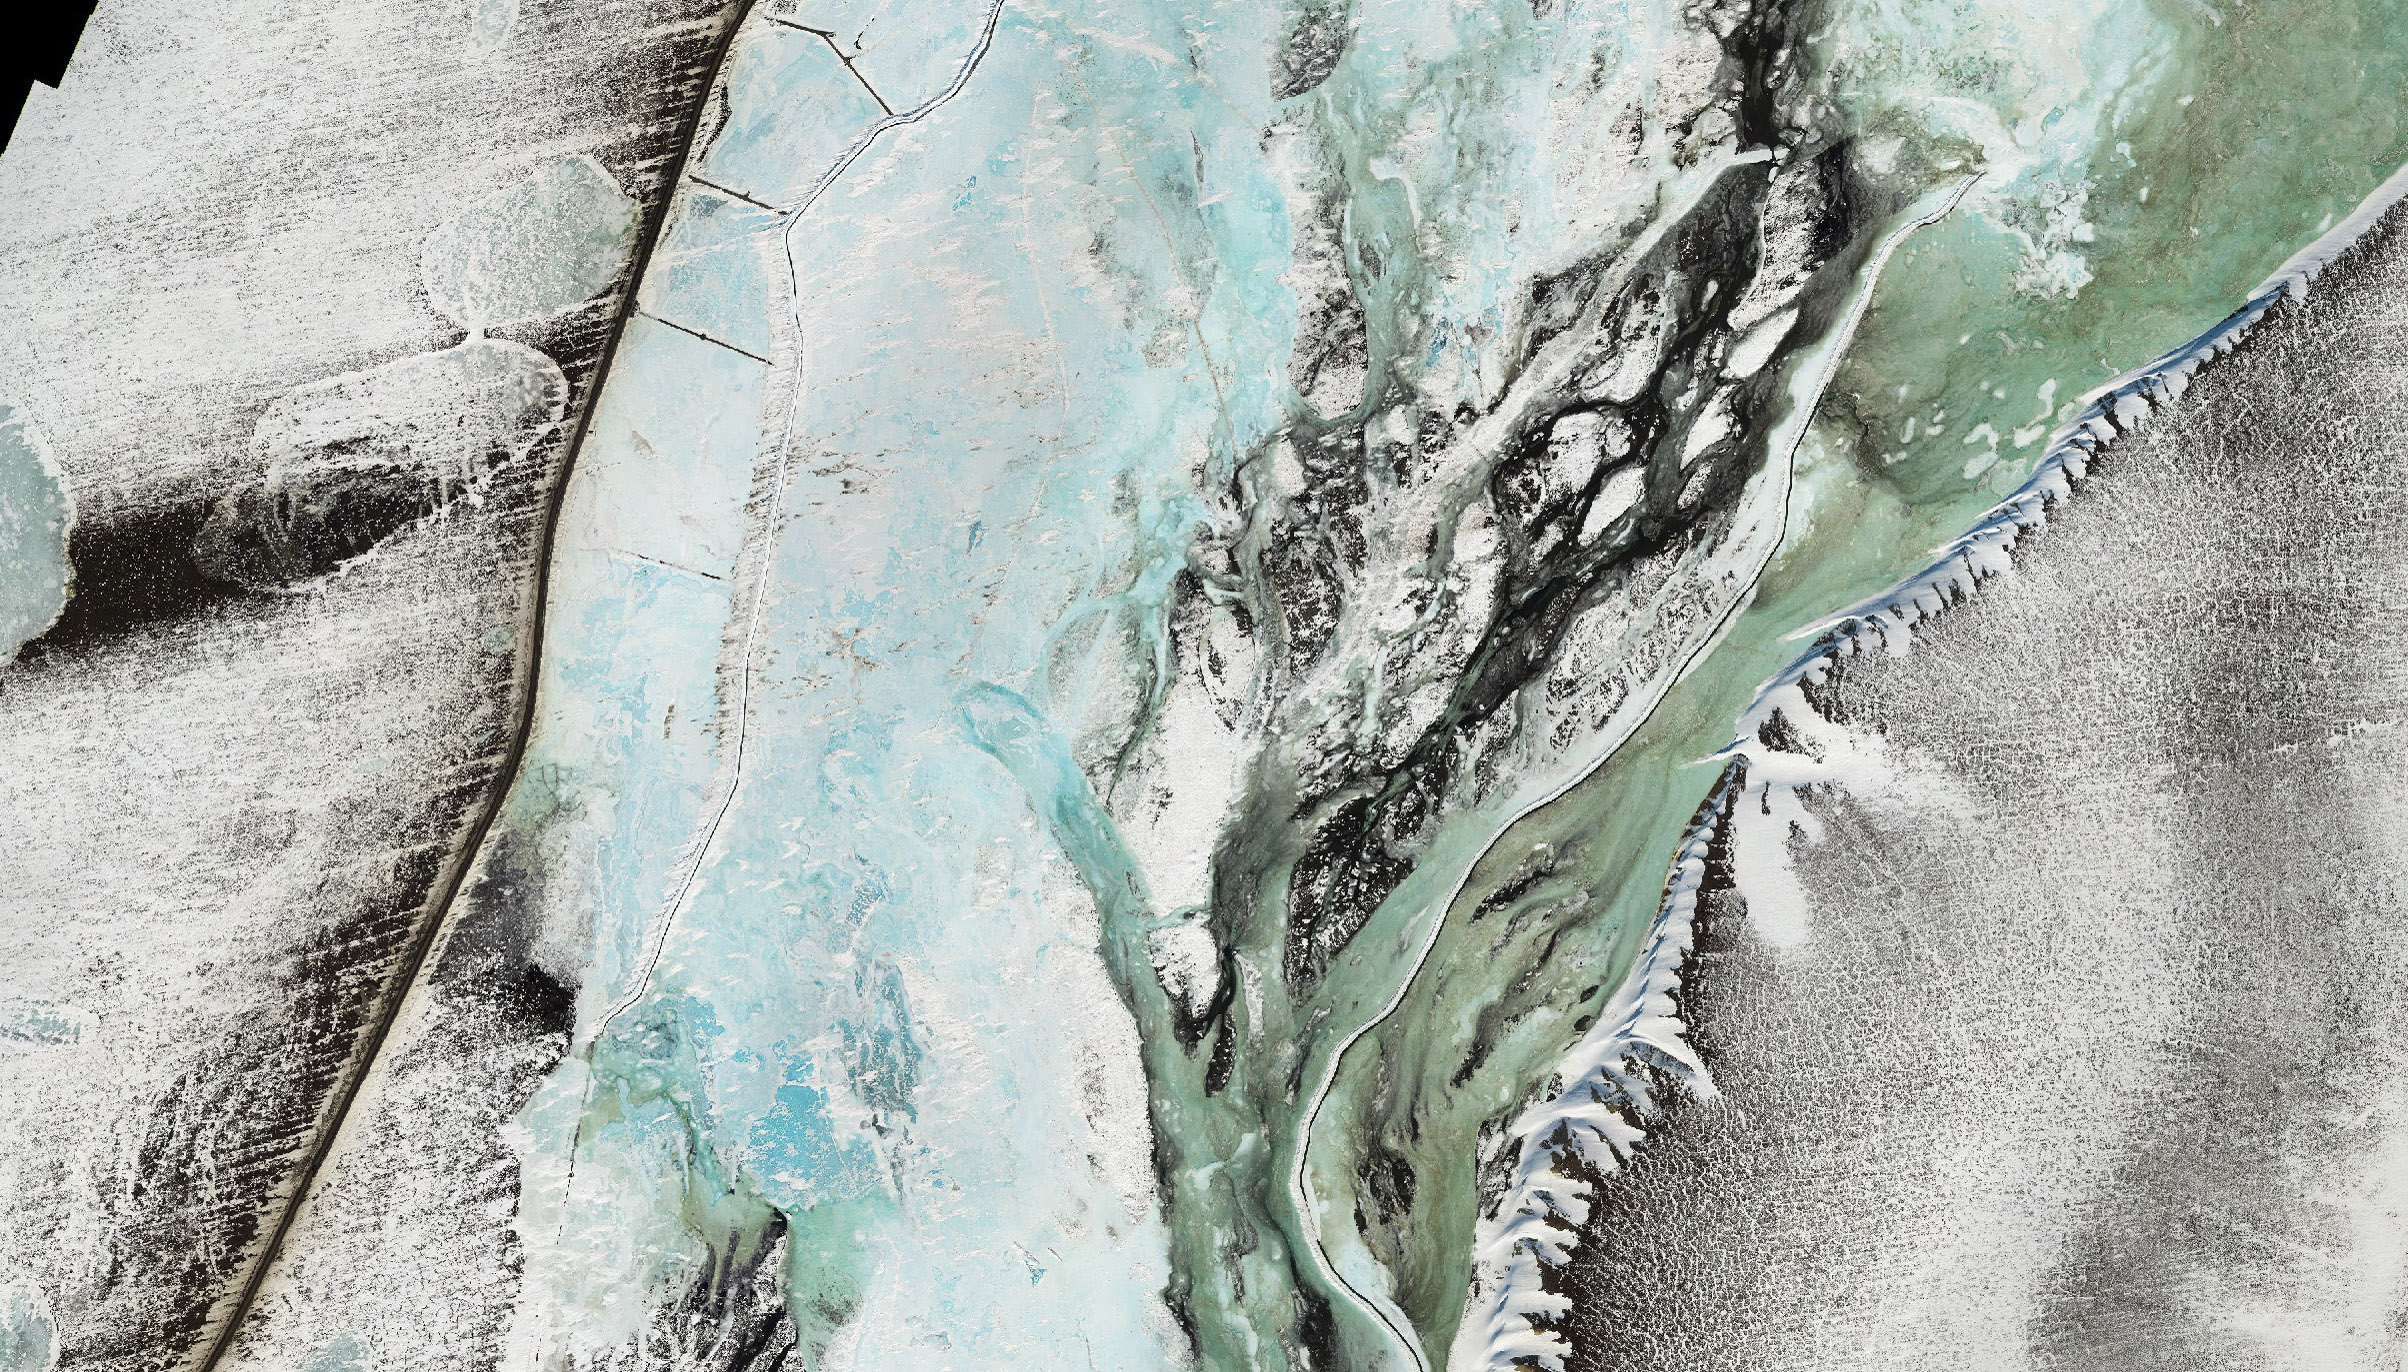
Here’s a closeup of where the river gets squeezed between the road and the bluffs. A lot of ‘earthwork’ had been done already in the river floodplain, creating levees out of what I believe is simply snow. You can see one at left near the road and another at right near the bluff. Gravel levees extend from the road to protect the pipeline, underground here. Note the details, such as the ice-wedge polygons at right. Also you can see how the tongue of ice near center is actually filling an existing stream channel (a topographic low) and then flowing over ice clogging that channel by mousing-over to see the topography.
Here is a close-up of one of the levees in the floodplain. You can see remnants of previous attempts, as well as the snow drifting it caused. Mouse-over to see the image.
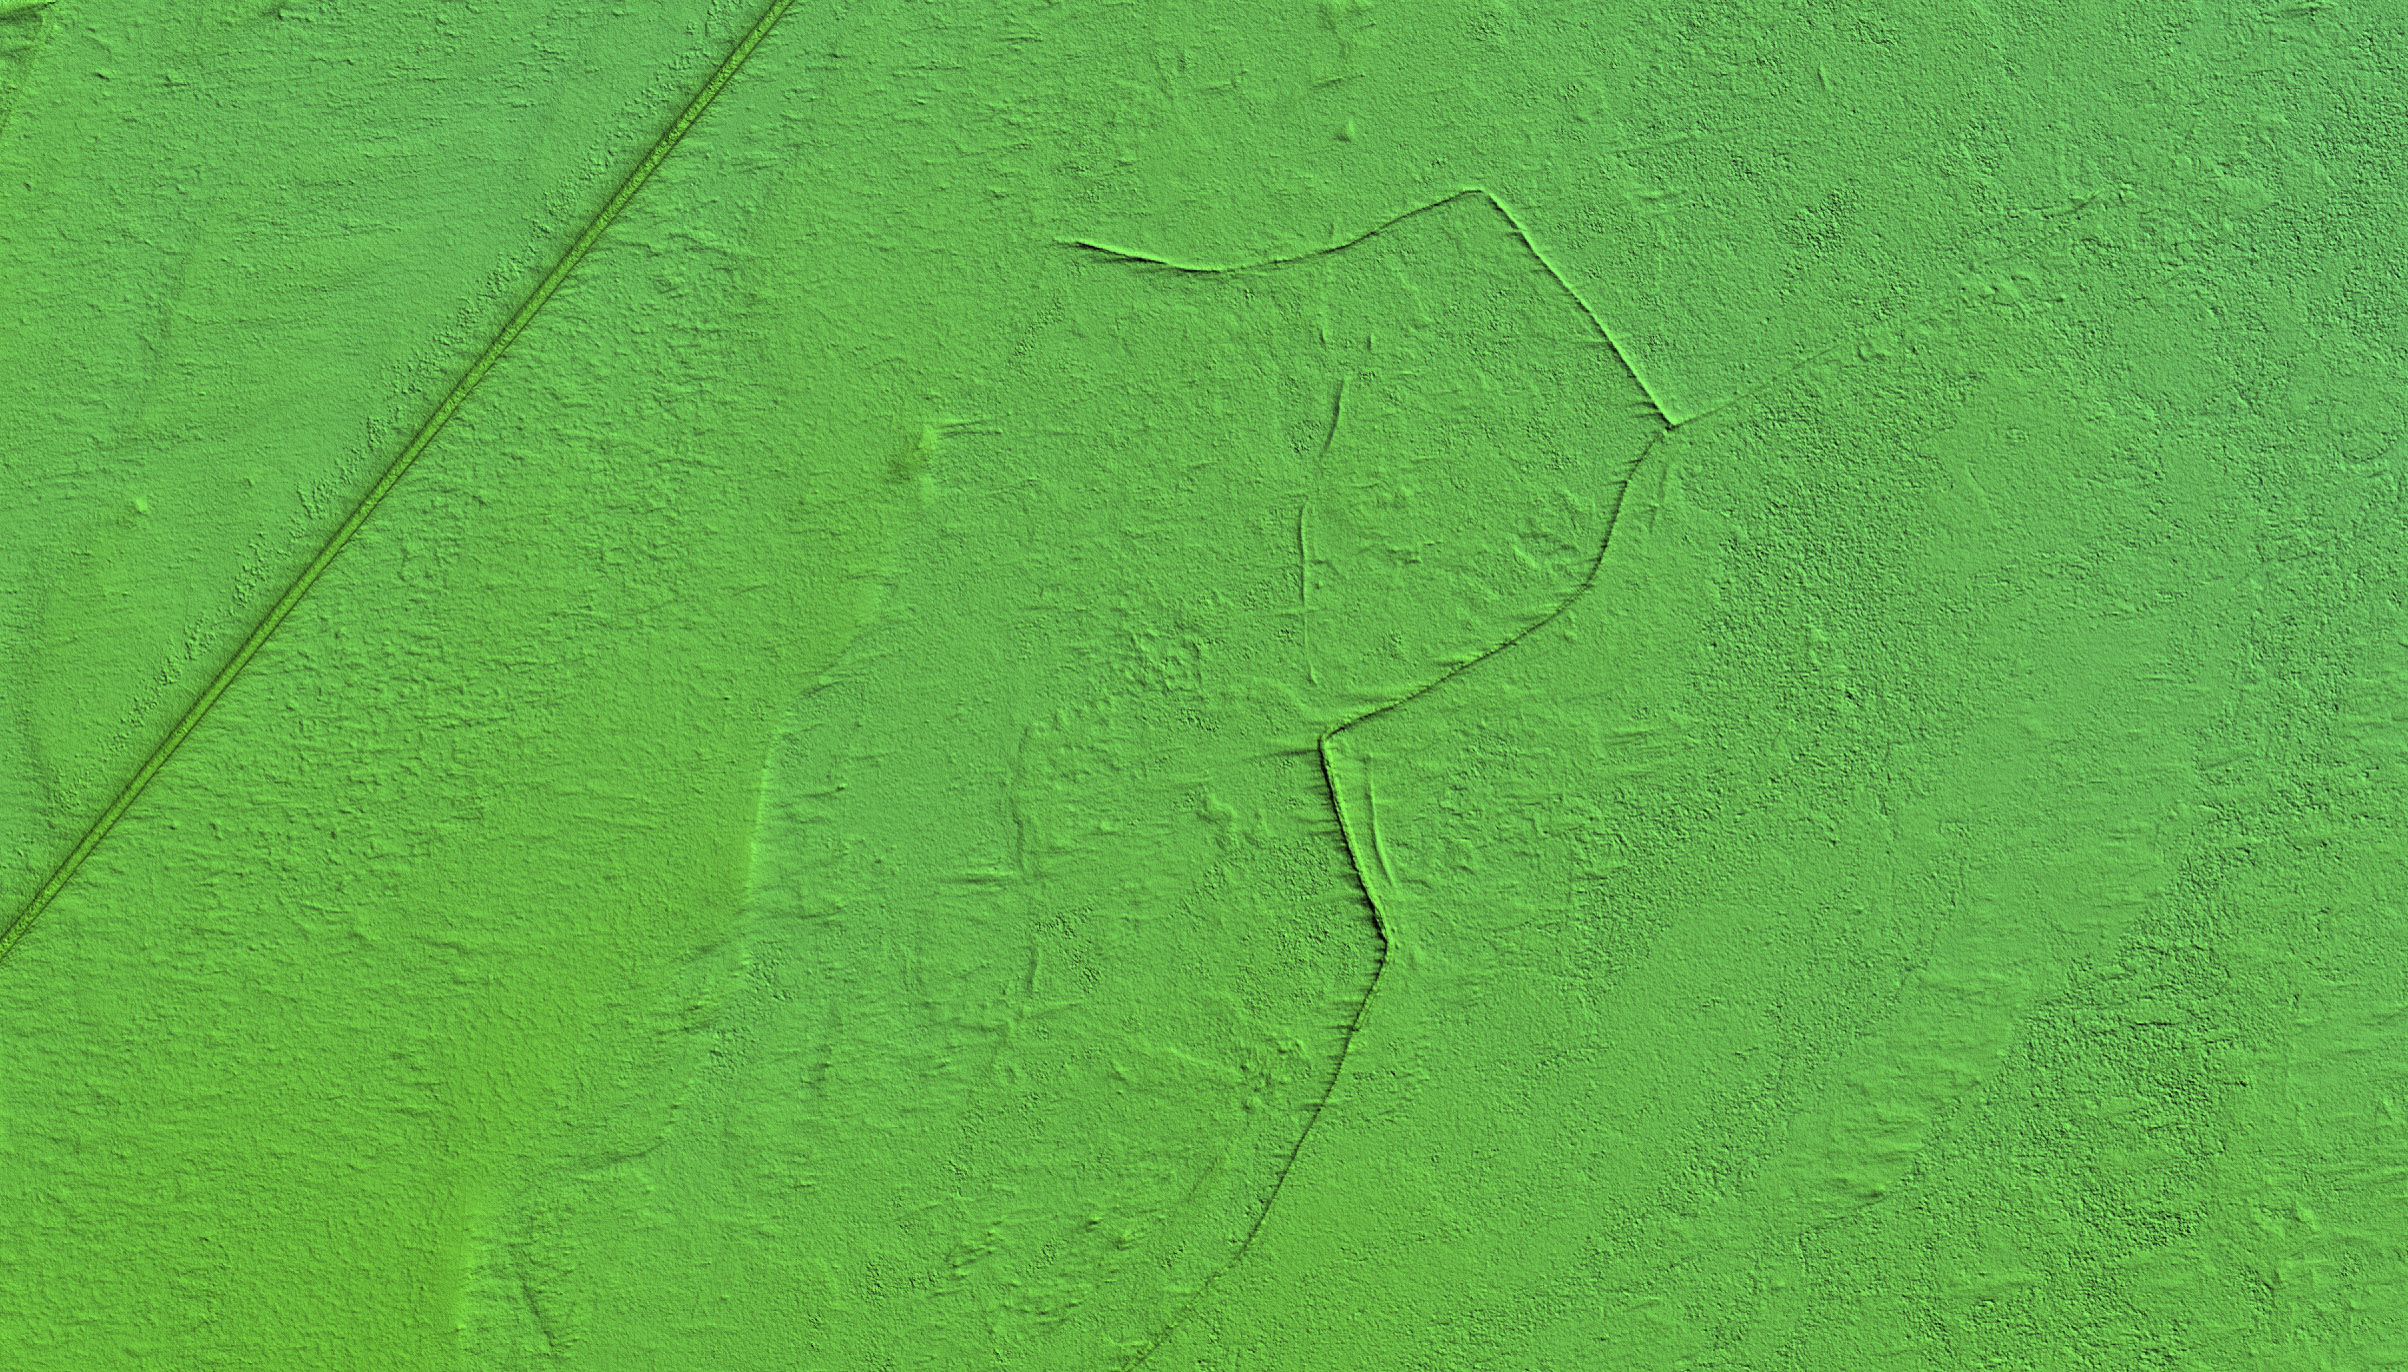
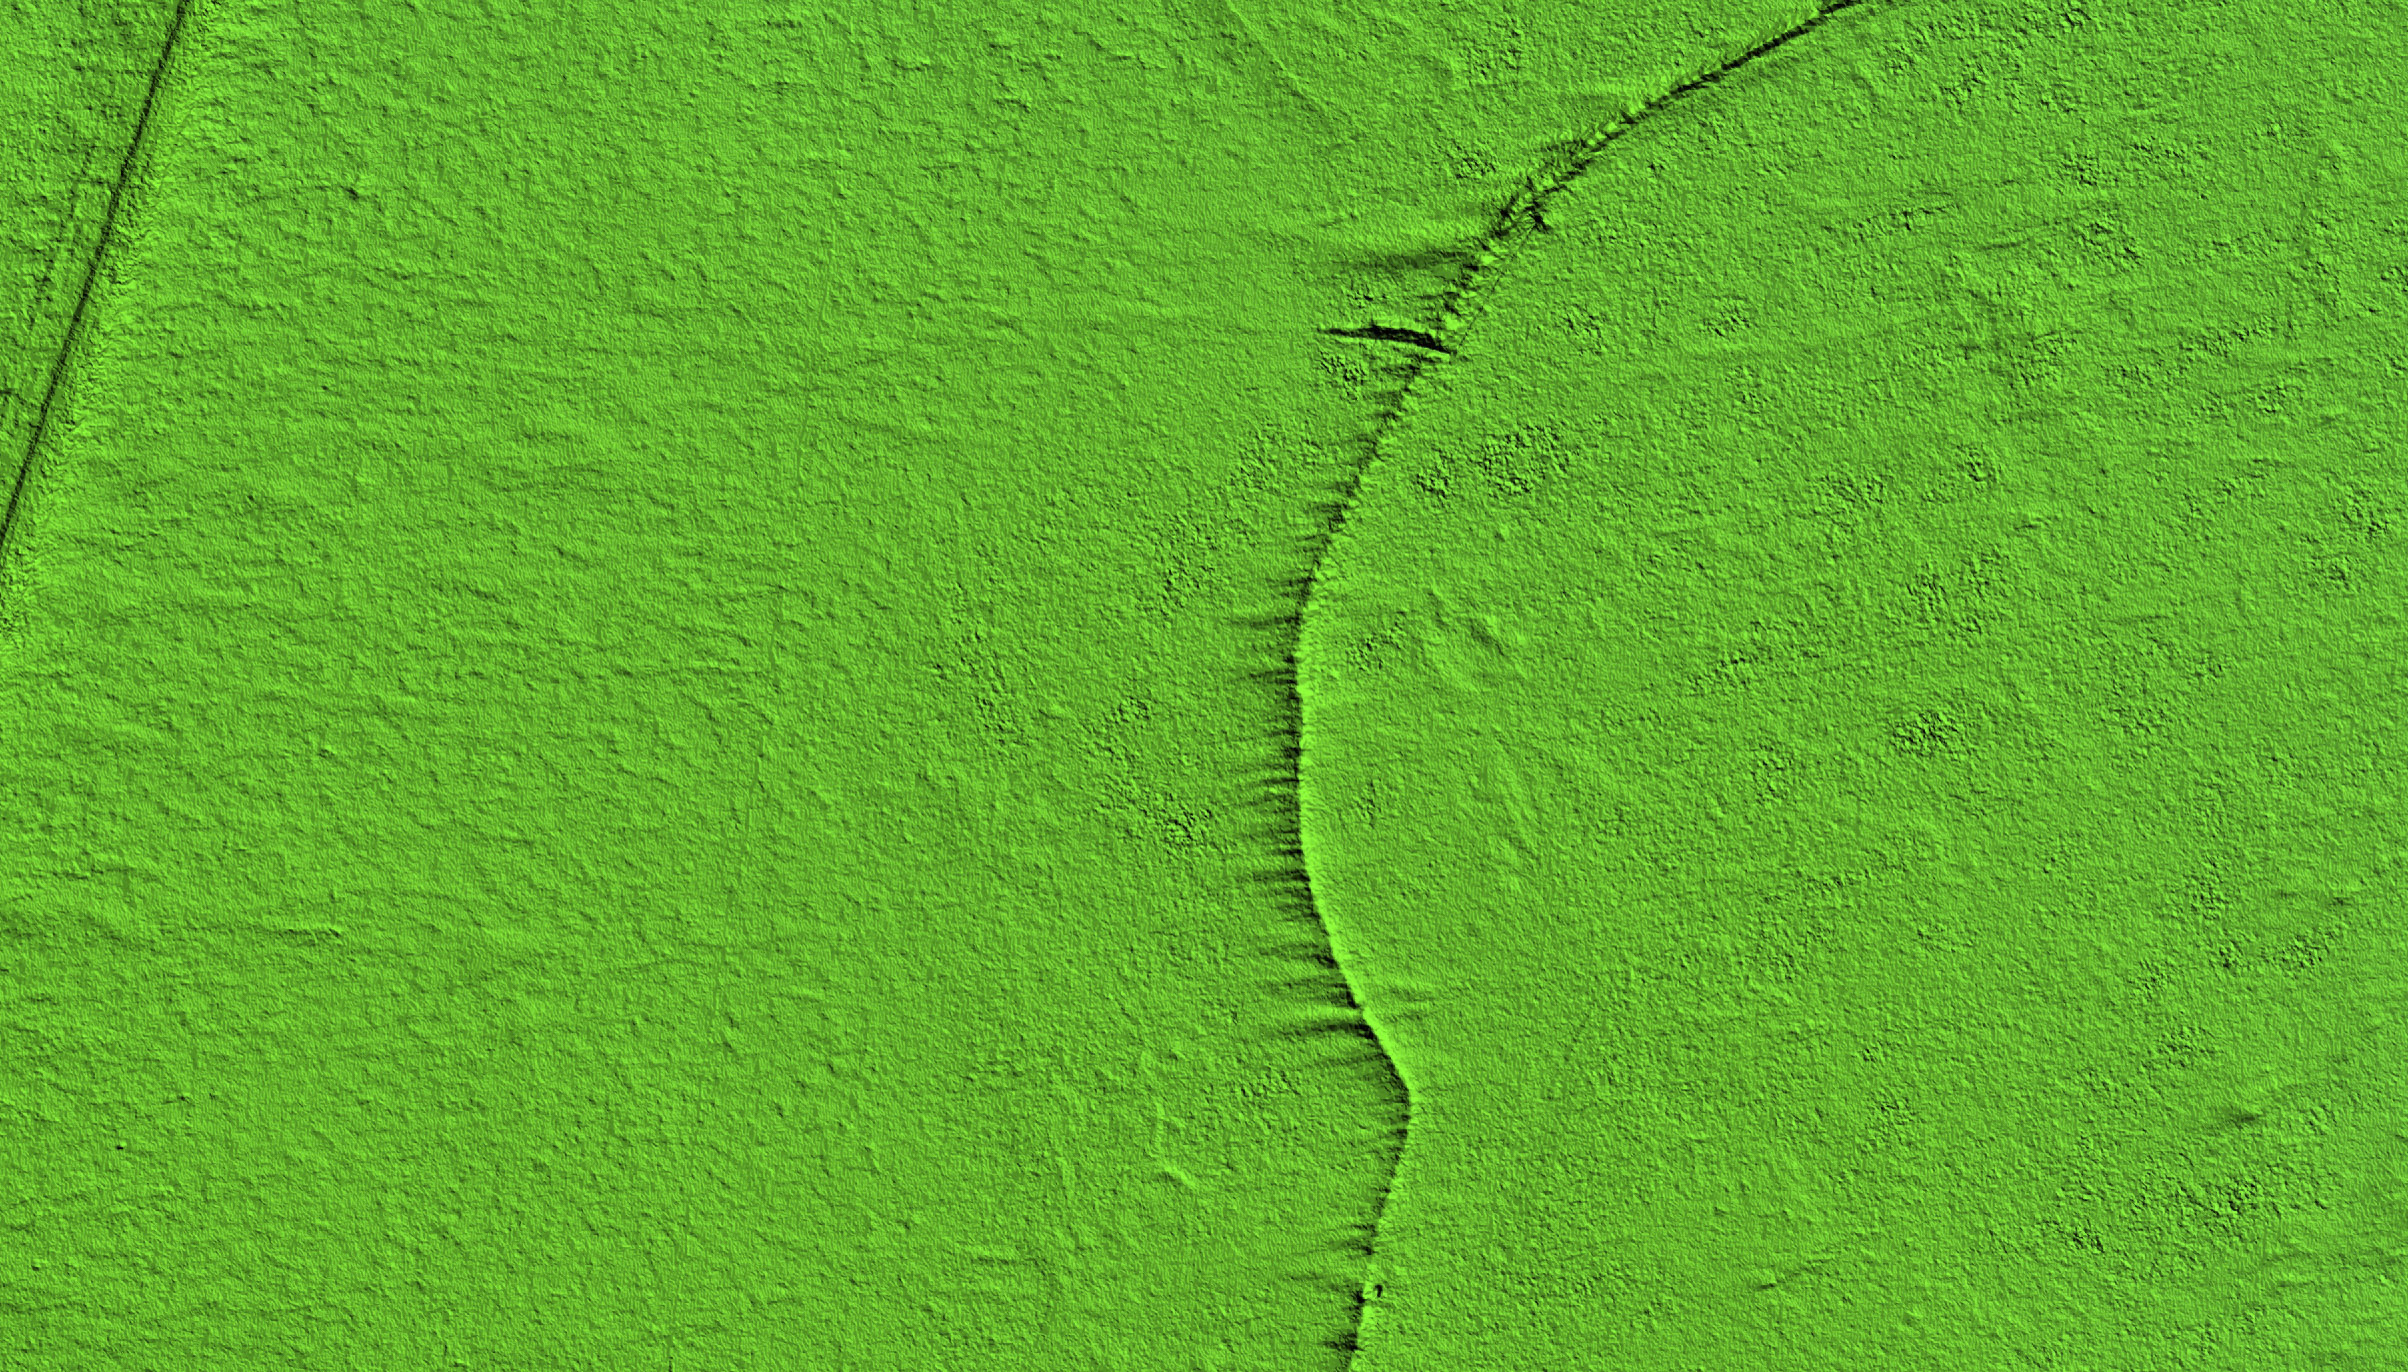
Here you can see fingers of ice extending towards the top of the frame. I would have imagined these to flow randomly over a flat surface filled in by ice, but you can see by mousing-over that these actually fill old stream channels. The fear is that these fingers will not find those channels and run randomly over the road, shutting it down.
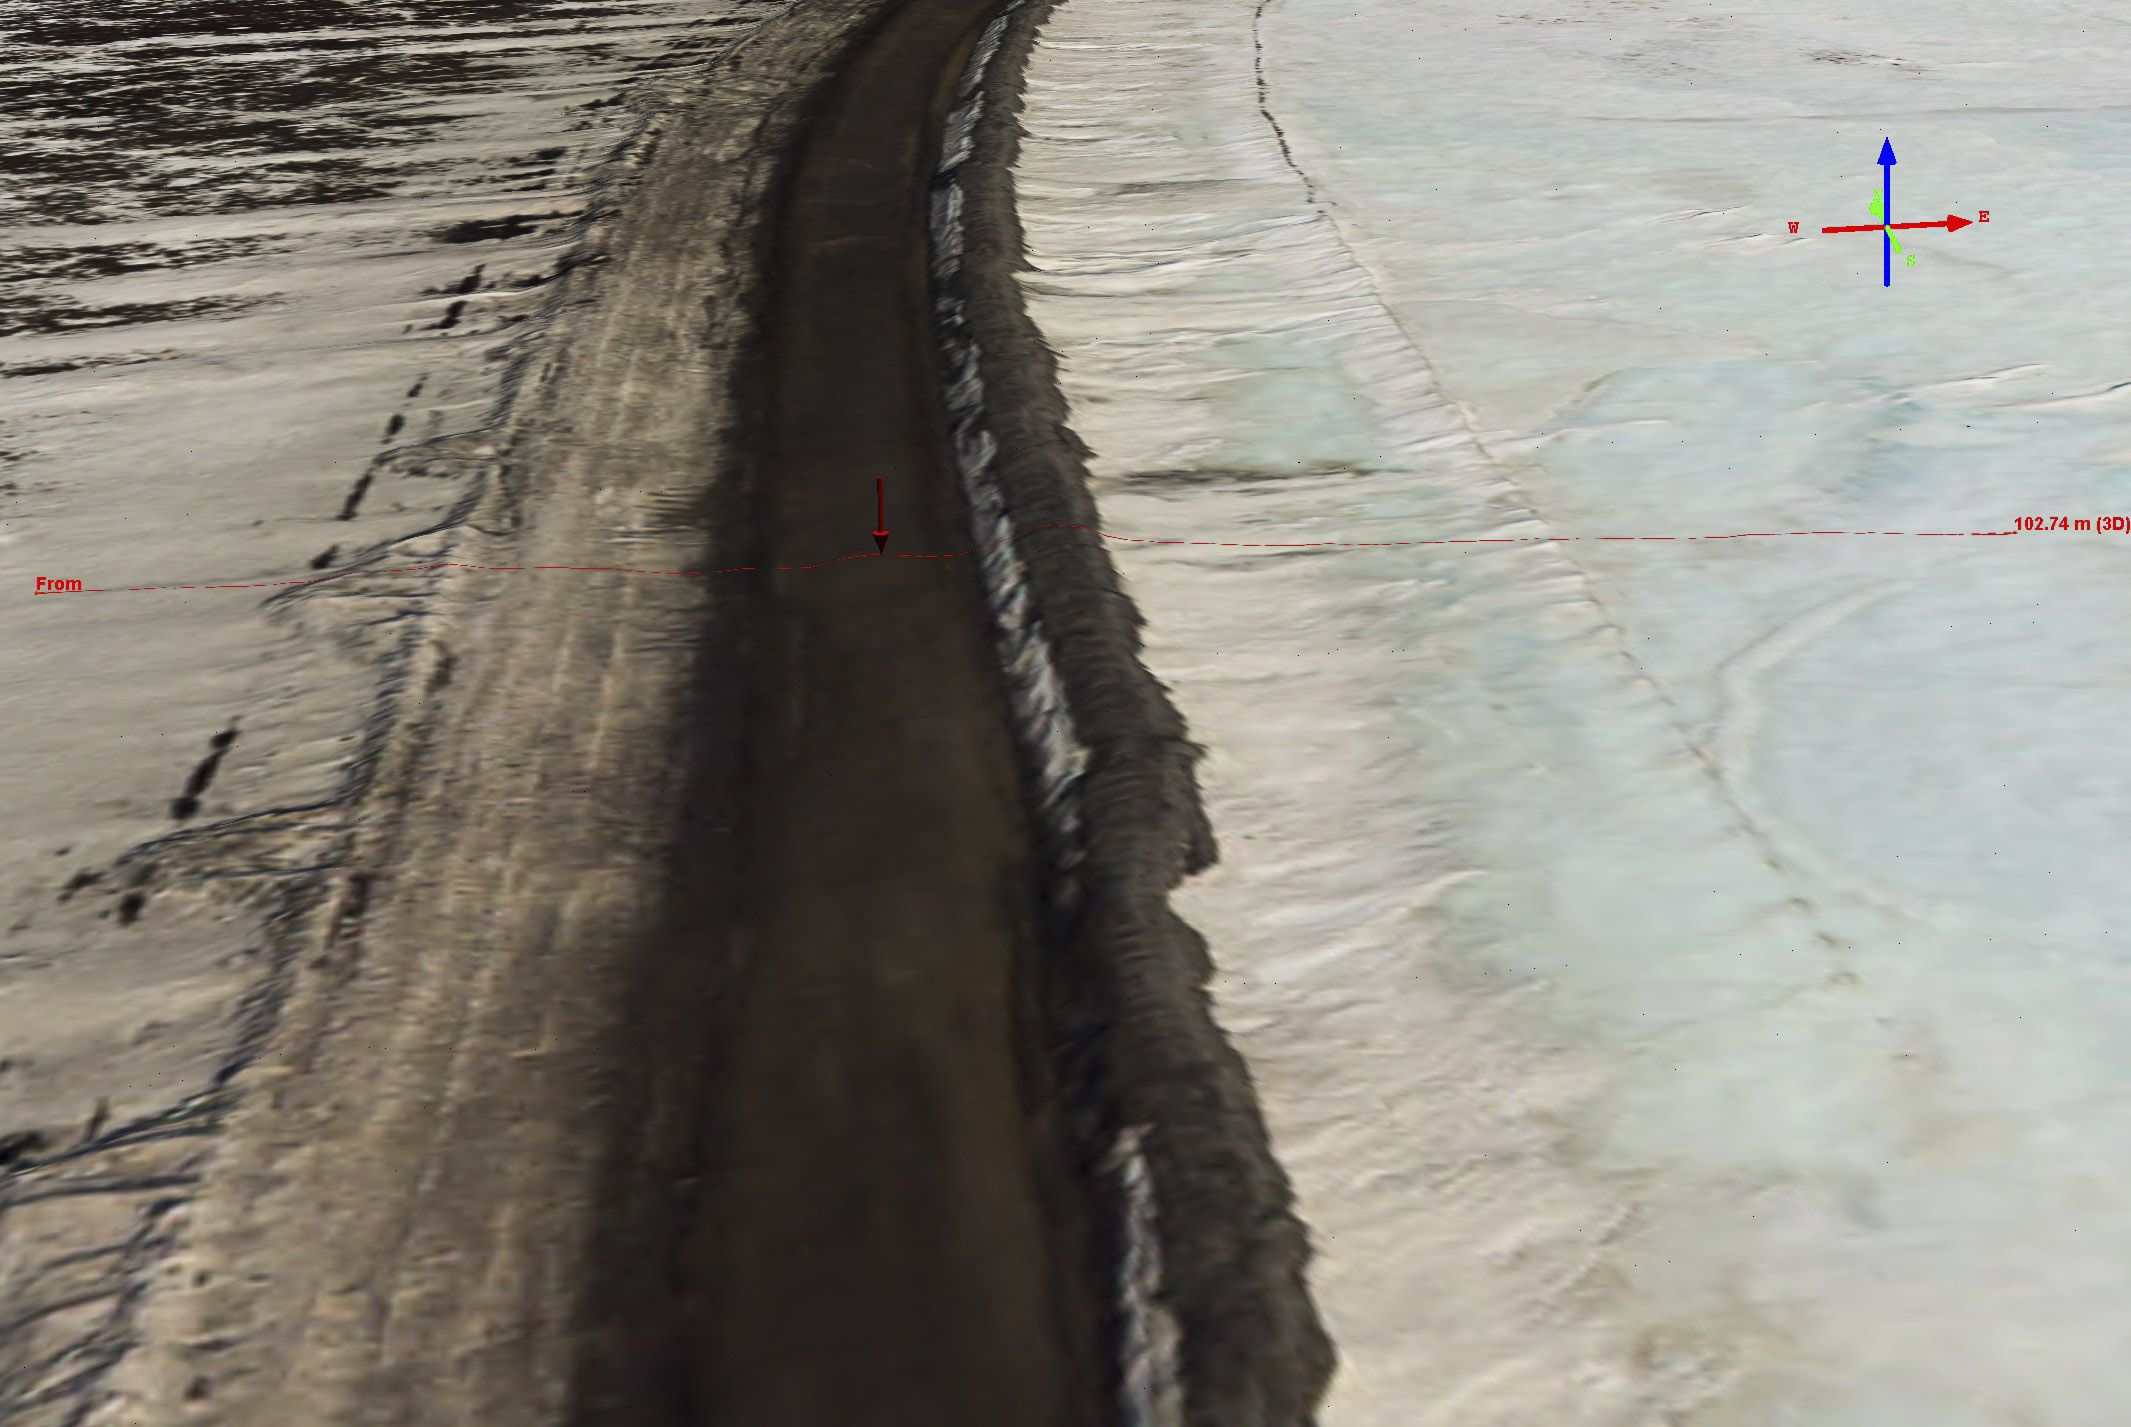
A levee has been built alongside the road where the aufeis seems most threatening. I made numerous profiles around here, and indeed where the levee is built the levee is needed. The plot below shows why.
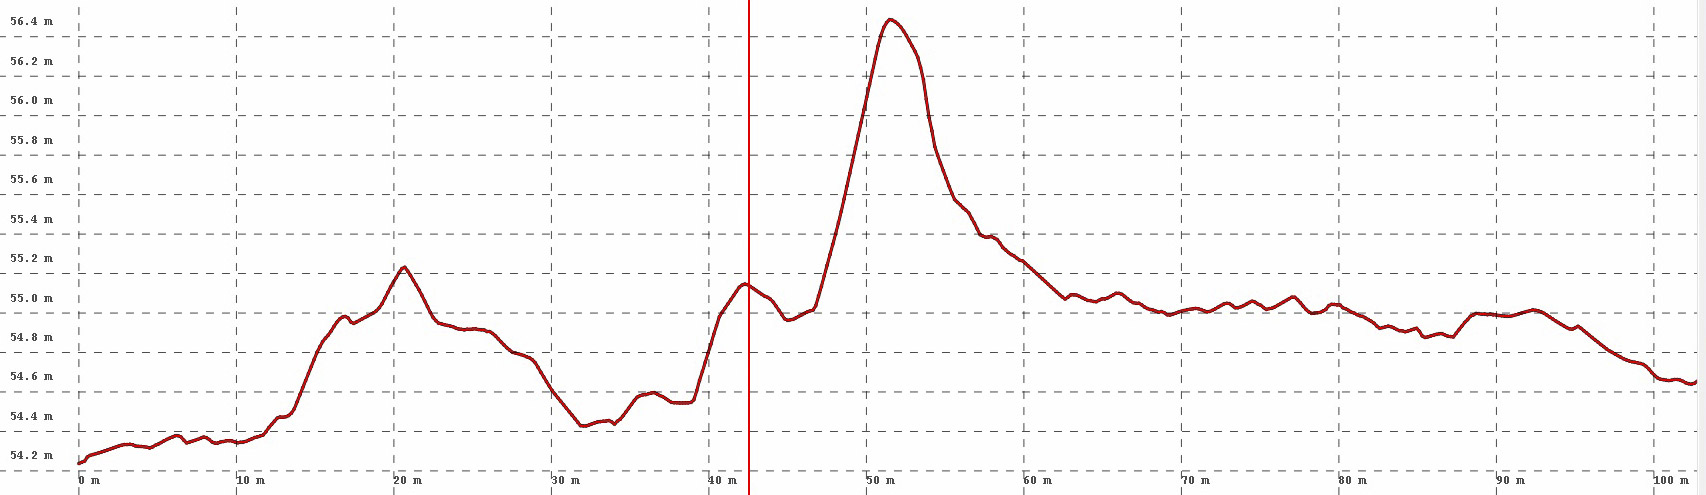
The red line marks the crown of the road. Note that it is within a few inches in height of the aufeis to the right, protected by the 1.5 m high levee.
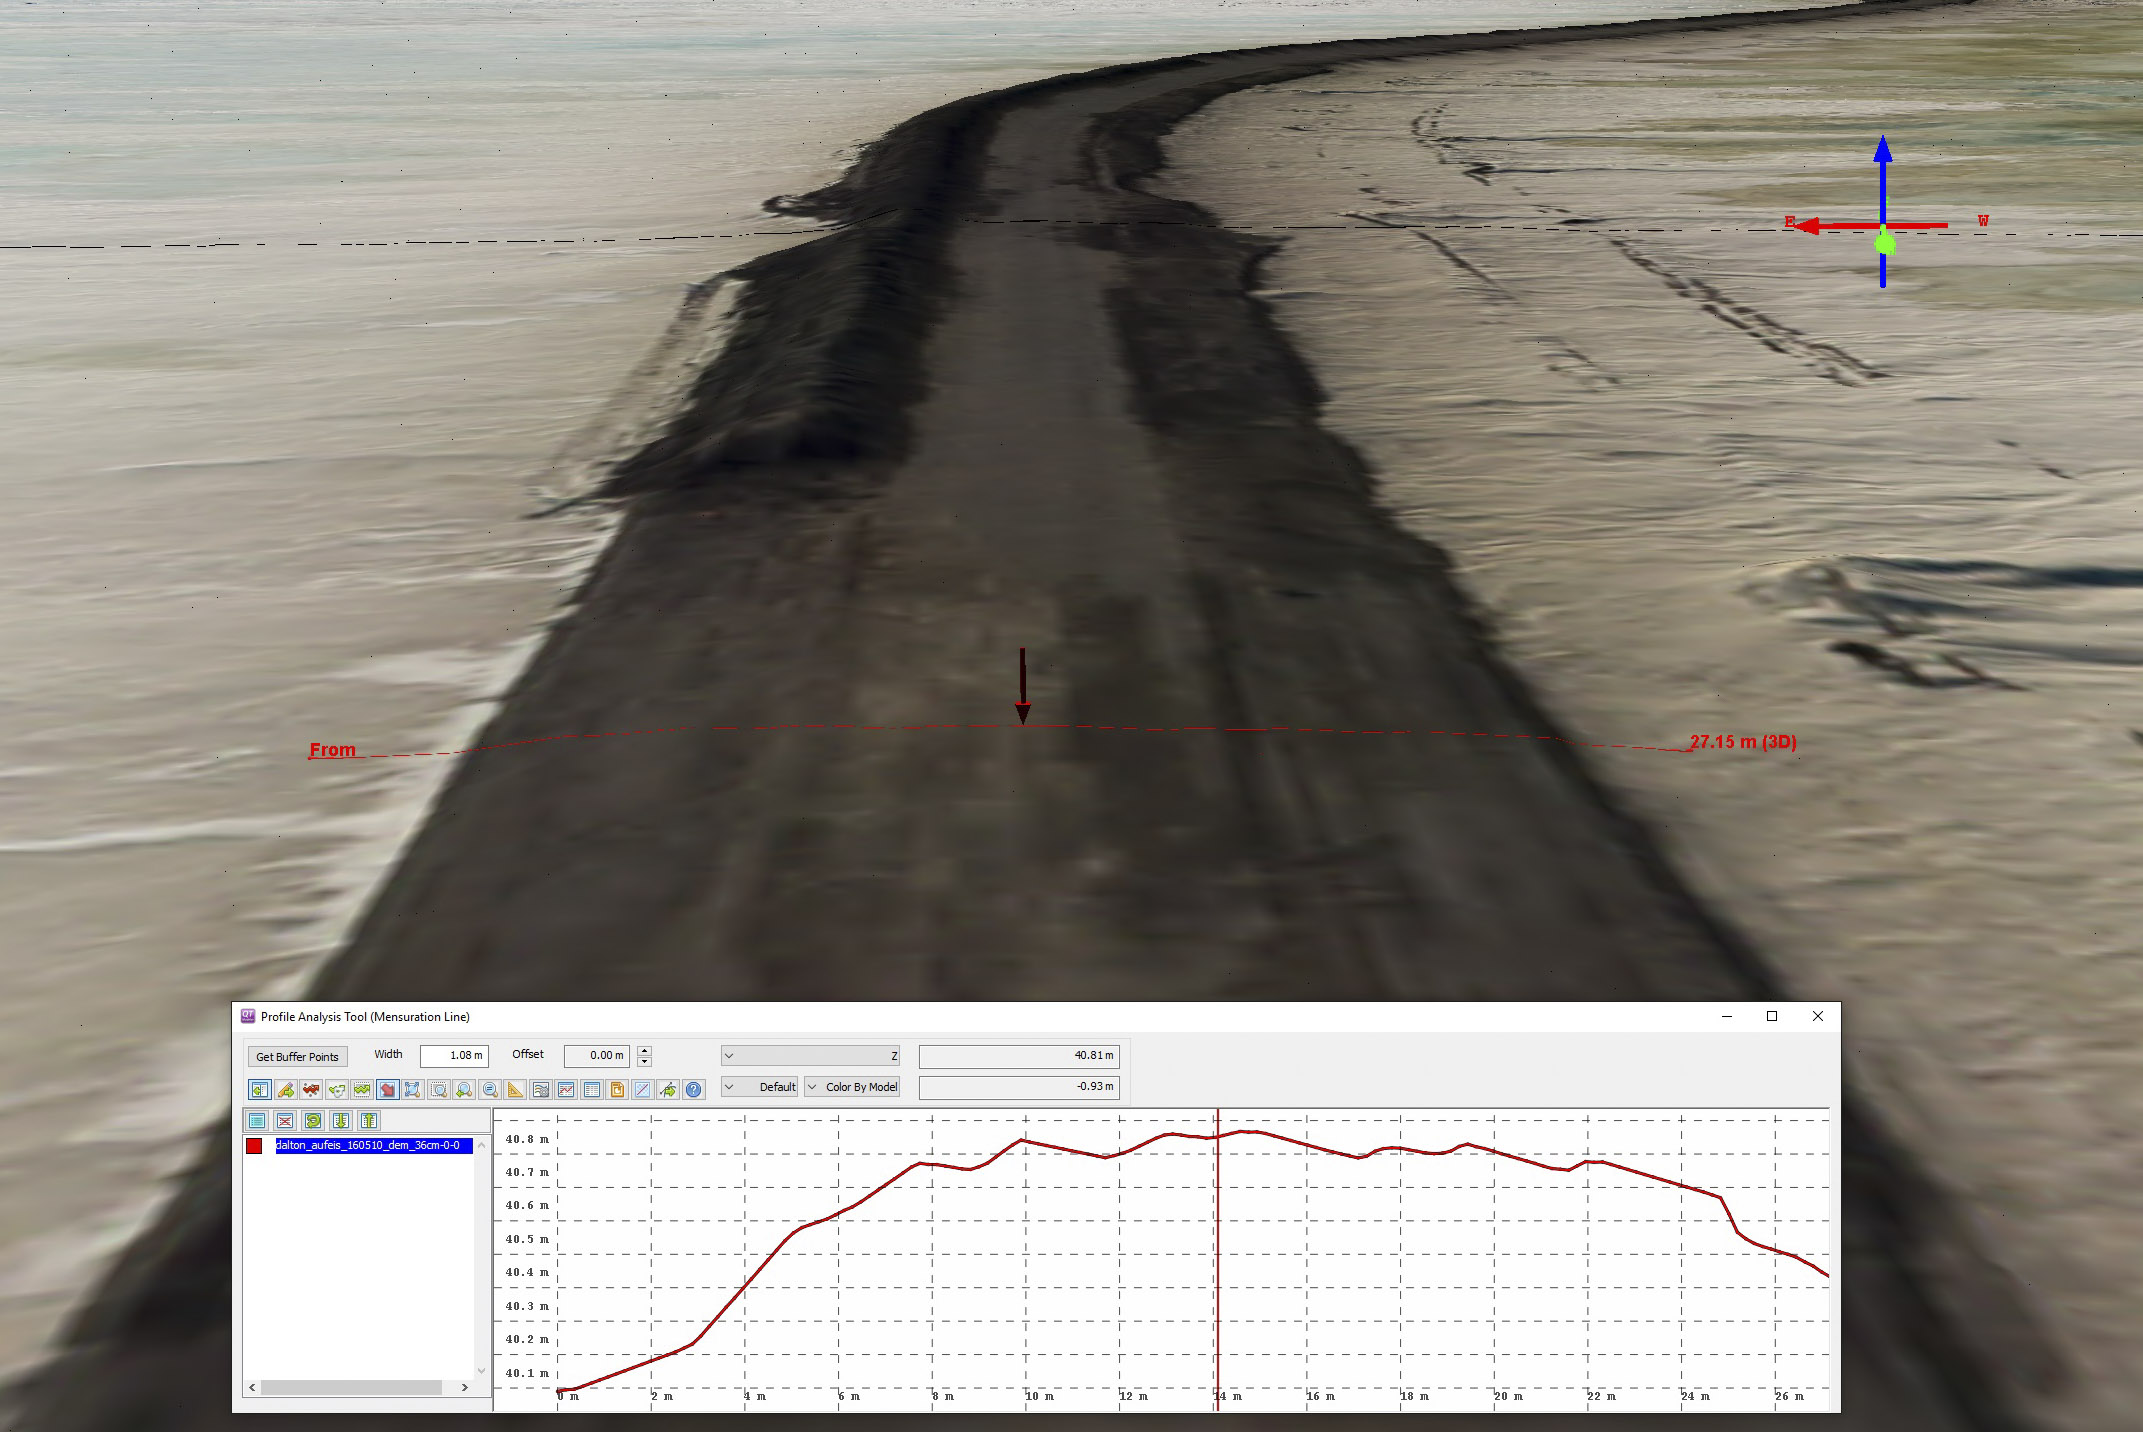
Here you can see the start of the gravel levee built alongside the road. This levee extends through what seems to be the most likely area for overflow. At first I thought they were stealing gravel from the right to pile up on the left, but then I saw how active the material sites in the area were. I was also surprised that I could not find a crown on the road where most of this levee existed, then I realized that the crown had to be graded down to slope away from the levee, else water would pond up on the road itself which is what they were trying to prevent in the first place — I guess that’s why they do road work and I make maps. Mouse-over to see the crown disappear in the levee section. The not-so-subtle point here also is that I can measure road crowns and breaklines for drainage.
Here is the material site on the northern end of the acquired area. It does not look like any mining has been done here this winter, but there are signs that stockpiles are being used. Mouse-over to see the topography.
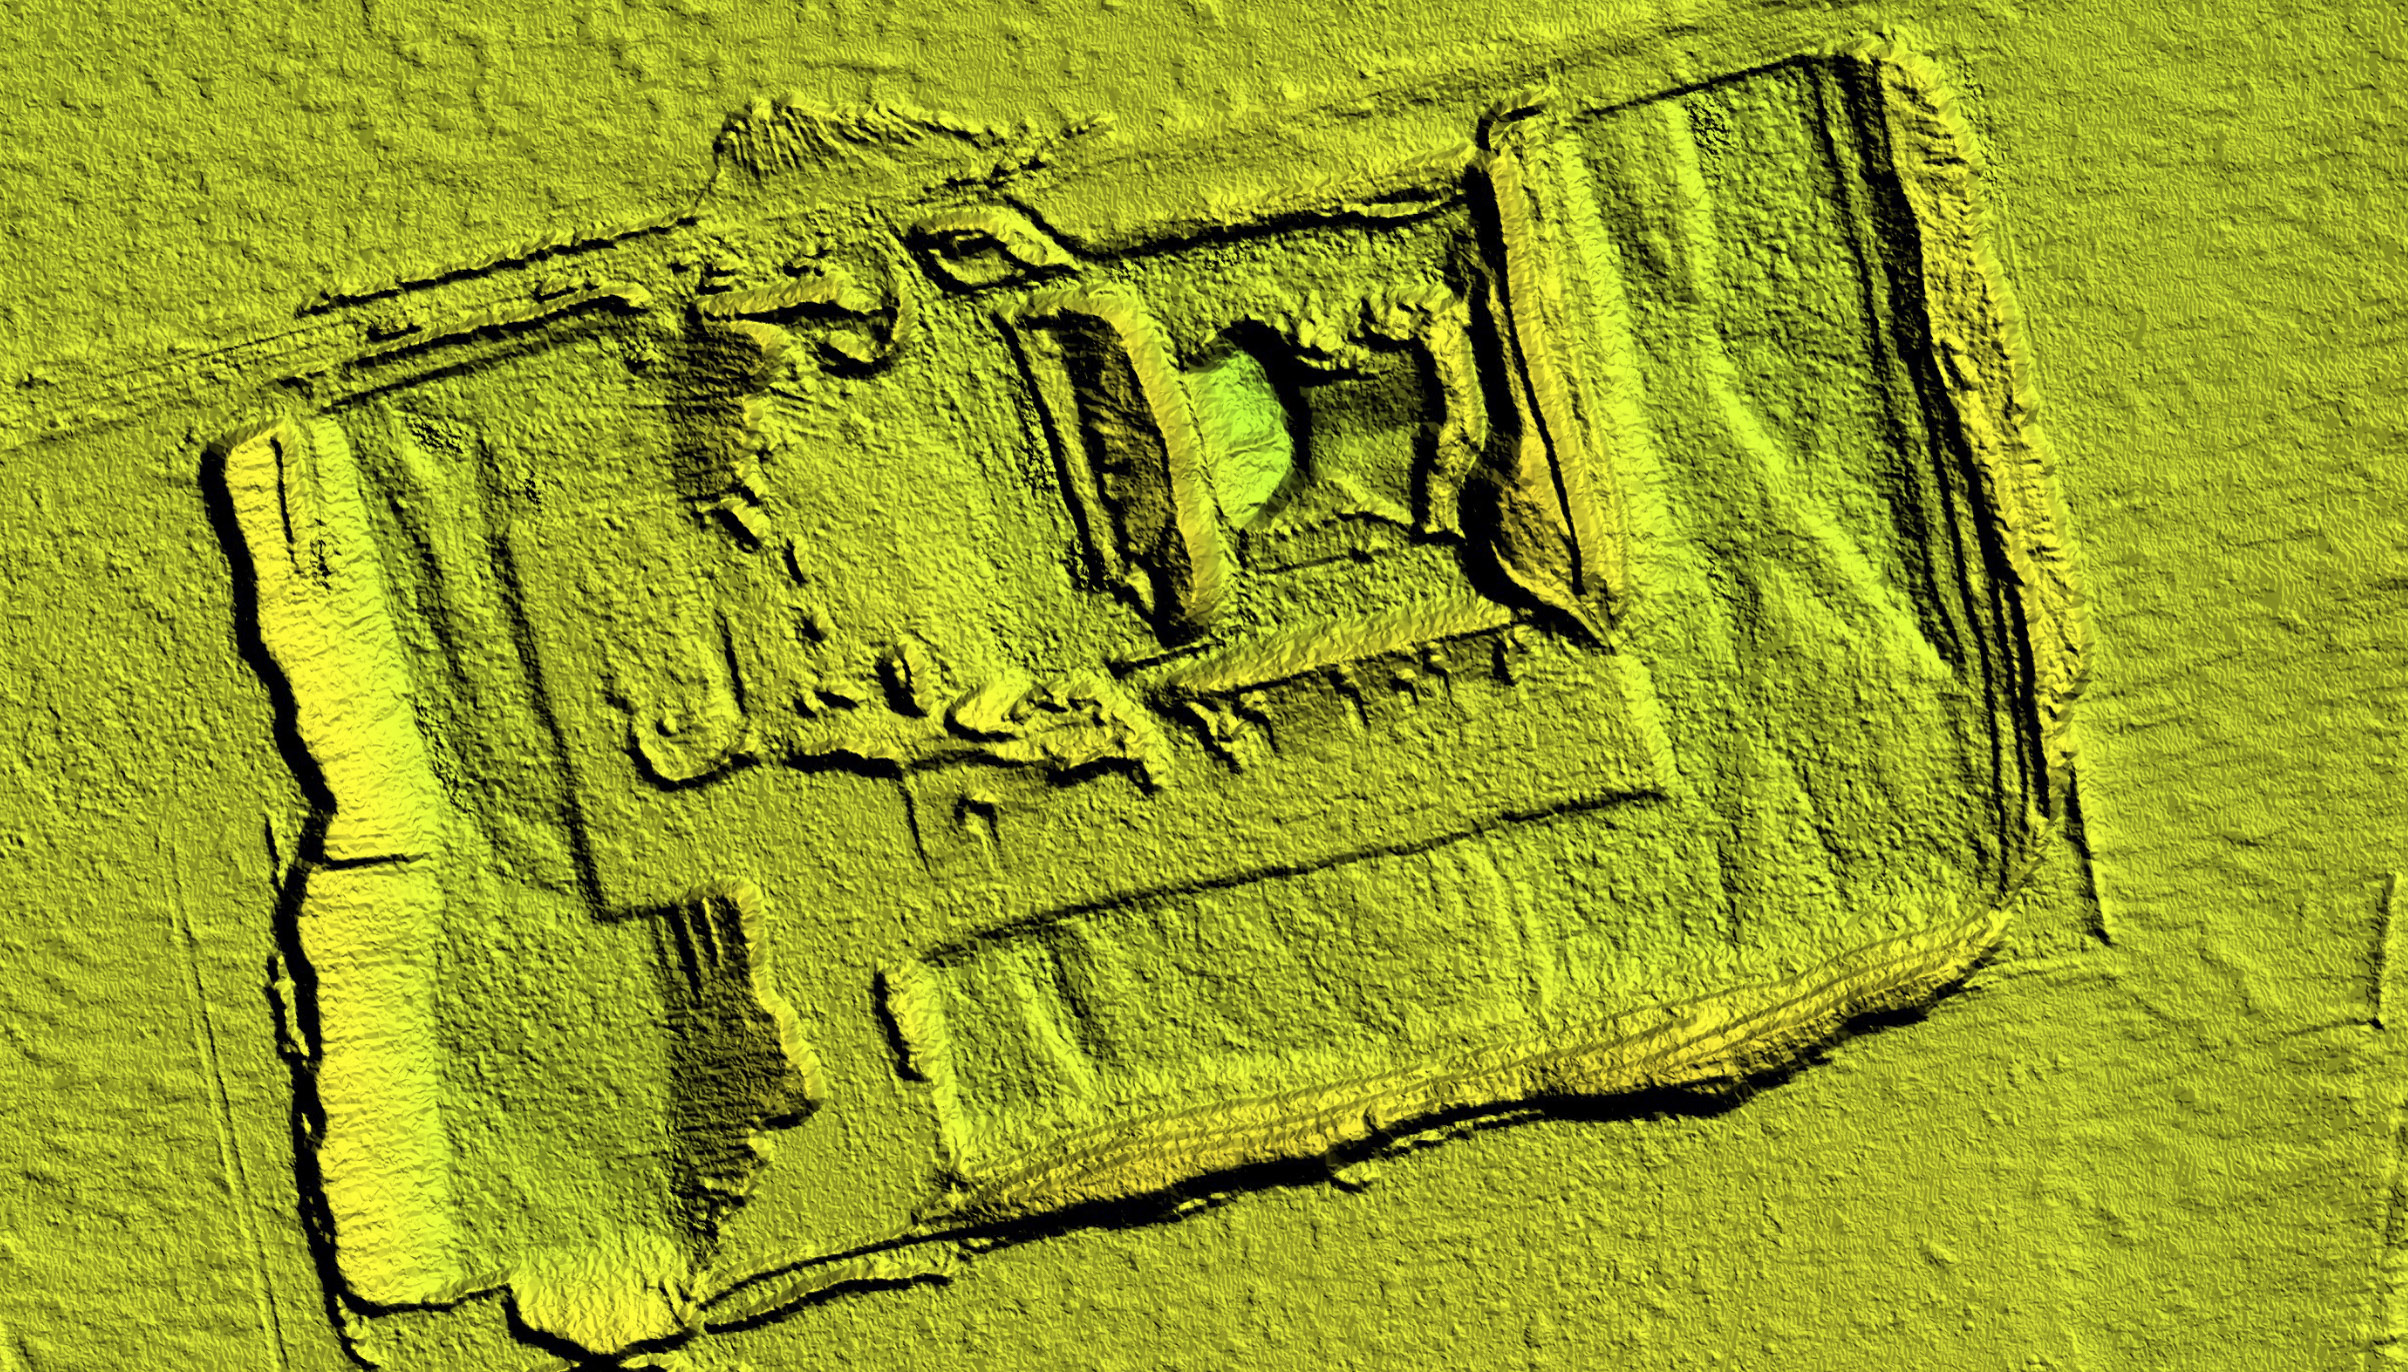
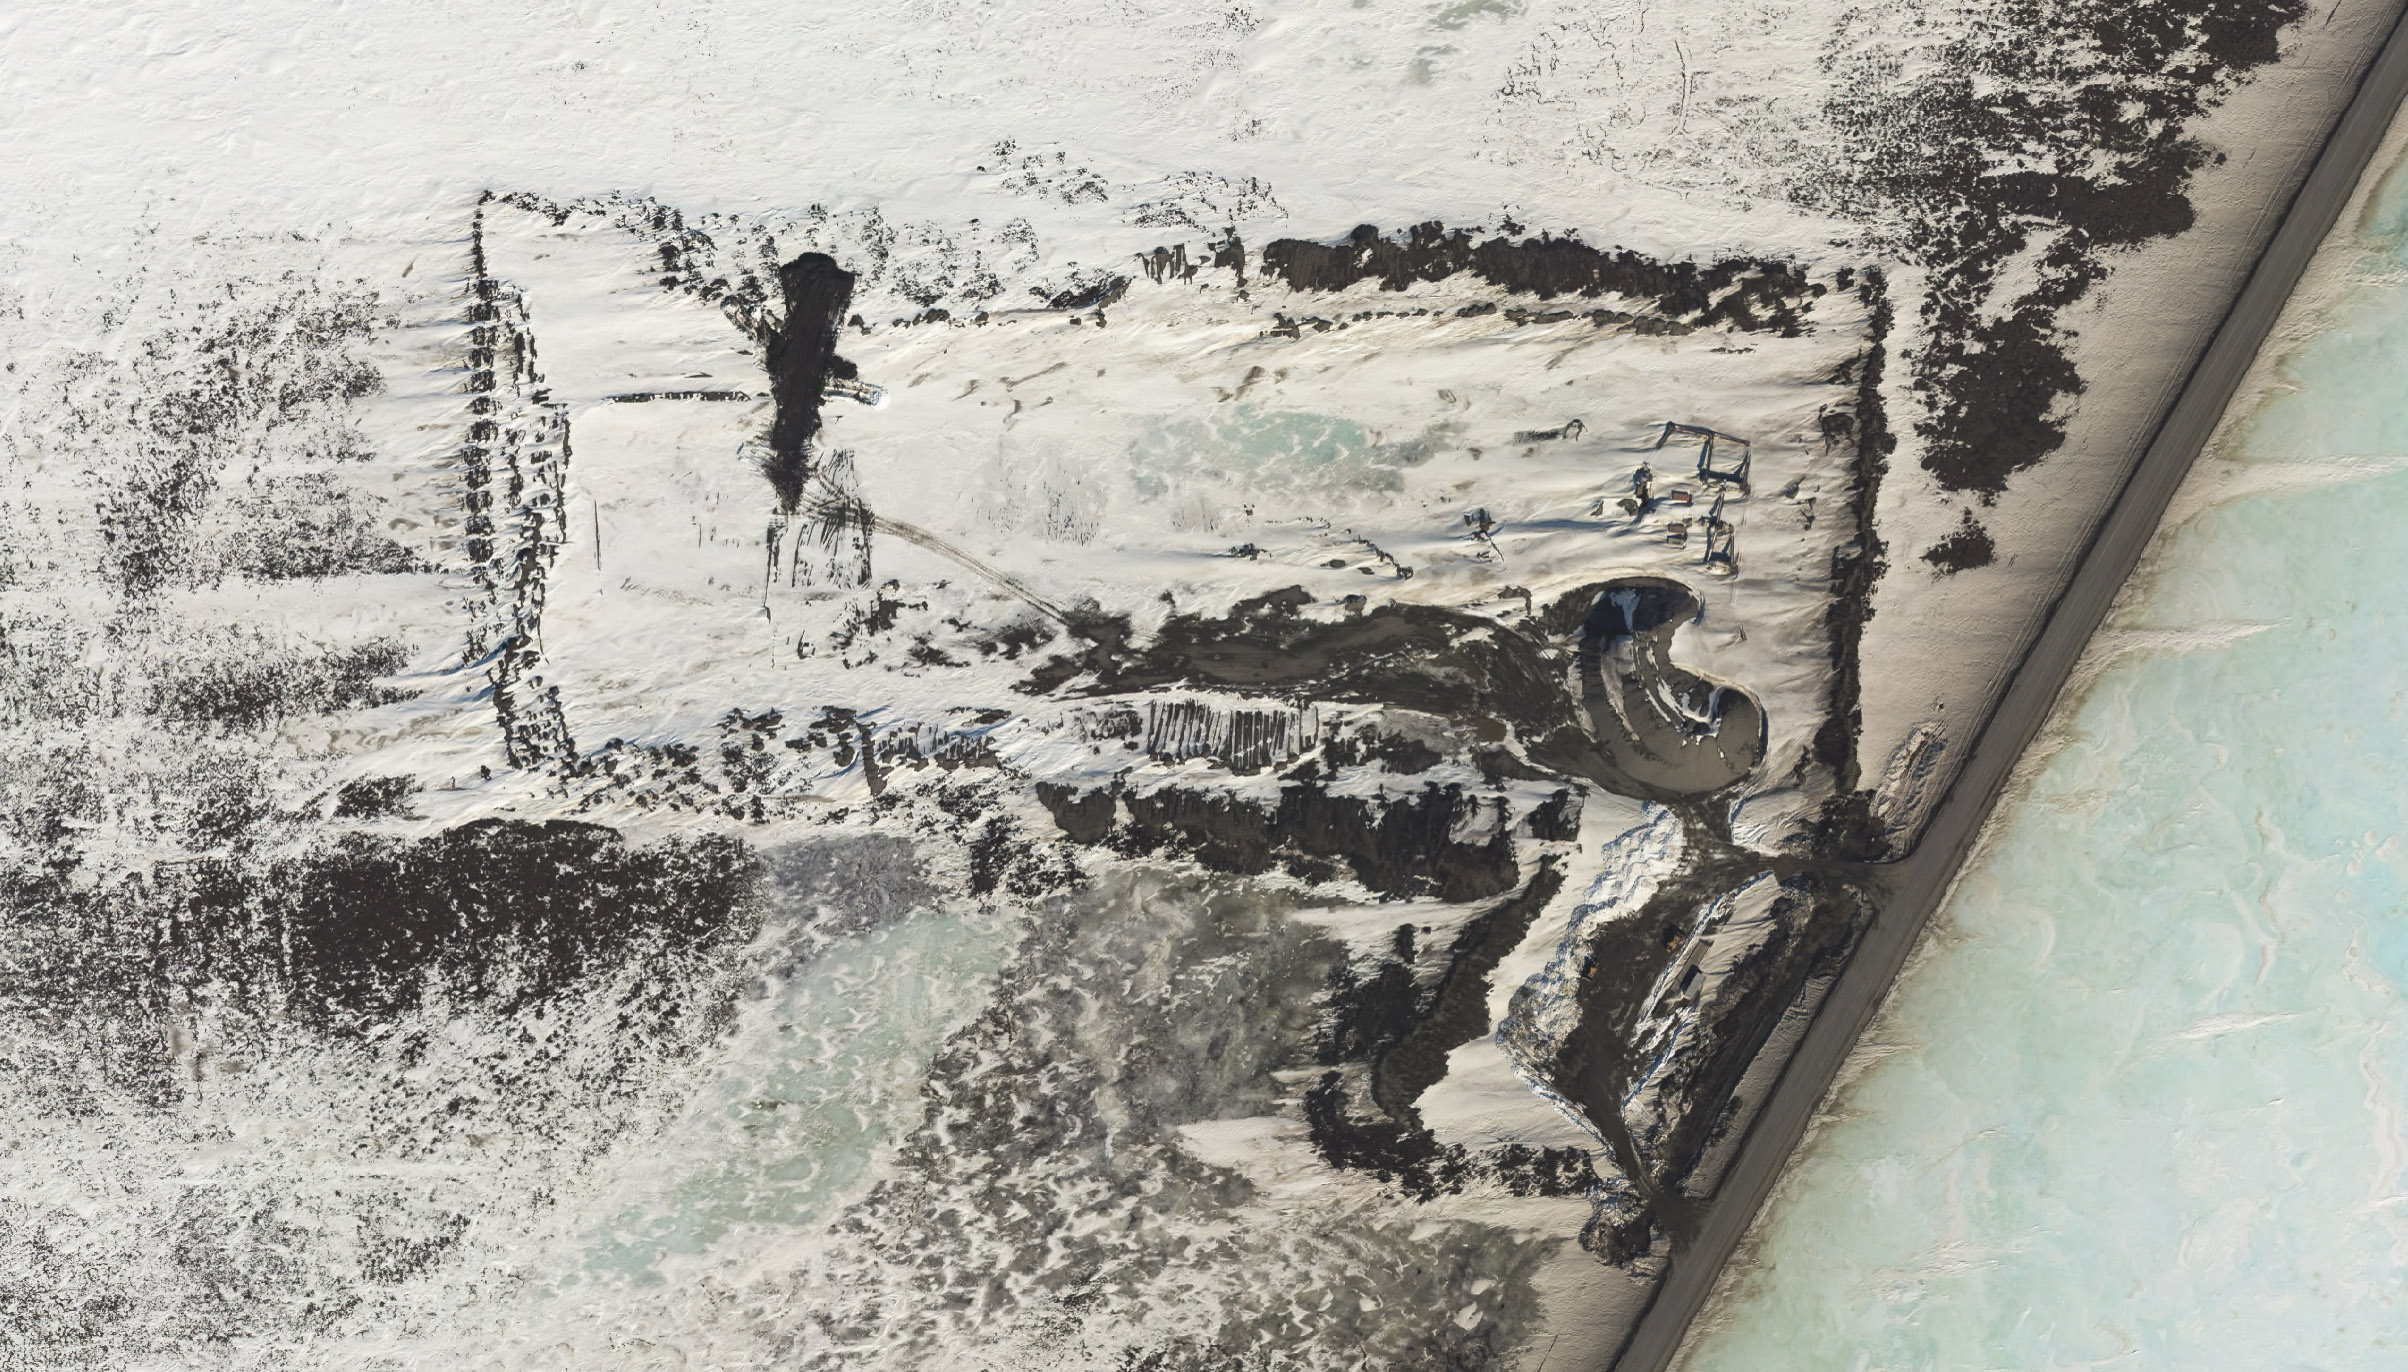
This is the material site on the southern edge of the acquisition, beyond the yellow polygon. This site is clearly being actively used and mined. Numerous earth movers are active, and a line of gravel haulers are waiting to be filled up. Note the amount of detail present here in topography — not only can you see individual bulldozer scrapes but you can see the topography of the bulldozers themselves.
Besides road-related dynamics, the map has tons of information useful to earth scientists. Here is a simple example of snow drifts created by the dike that we can measure. You can easily tell prevailing wind direction.
The drifts below these bluffs would be nearly impossible to measure for thickness, as they are not only many meters deep but likely hard as concrete. By making a map in summer, we can subtract that map from this one to measure snow depth every 18 cm.
 Here you can see topography of ice wedge polygons on the left (where the wedges clearly have not filled completely with snow) as well as the subtle topographic scars of ancient seismic surveys on the right. Mouse-over to see the image. Such damage can be prevented, or at least greatly reduced, by waiting for the ground to freeze and sufficient snow cover to blanket it. By making summer/winter fodar maps, we can know exactly when and where it is safe to travel with such large vehicles in near realtime.
Whether for road safety, hydrological monitoring, or preventing tundra damage, fodar has the potential to tremendously advance our capabilities.