Mapping Yukon River ice breakup
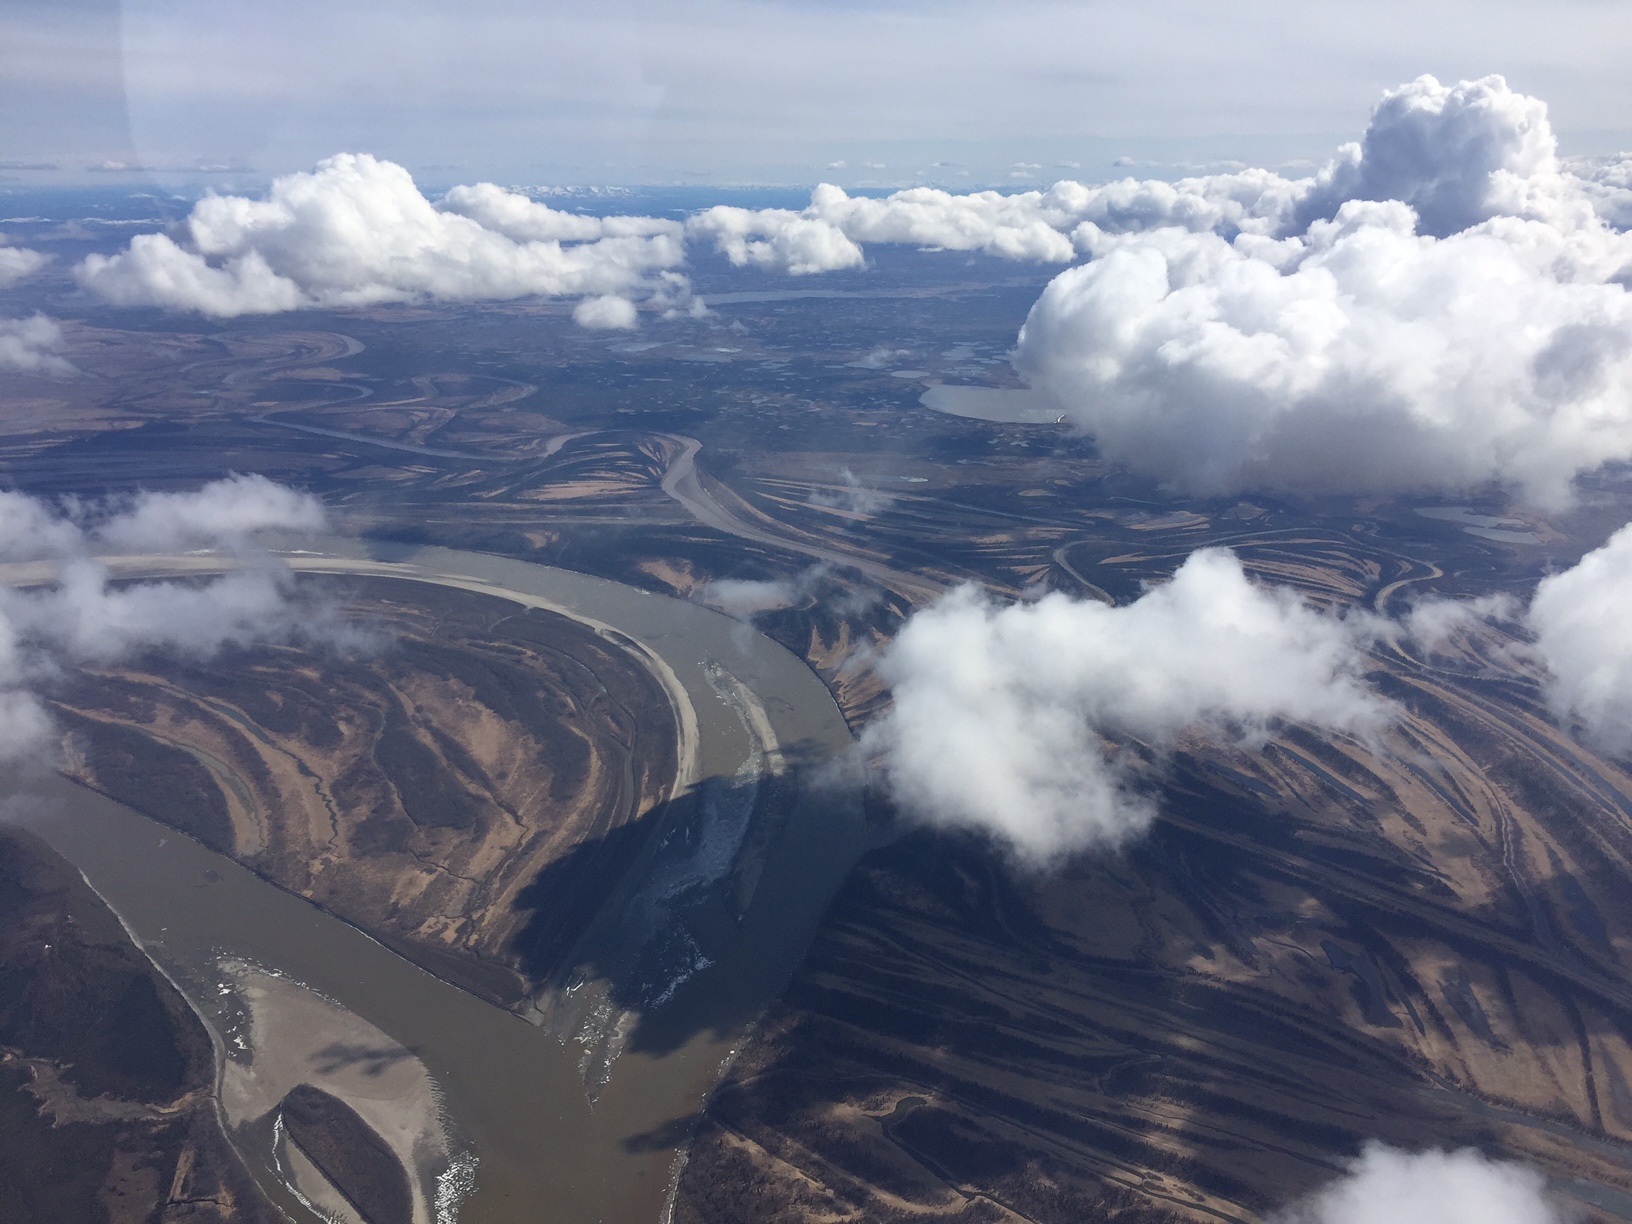
Today I flew from Fairbanks to Bethel via the scenic route — following the Yukon River to check out what was happening to the river ice.
I have been working on developing new techniques to study river for the past several years. For the past two years, Carl Tape and I have been studying a stretch of the Tanana River, just before it enters the Yukon River, where he has seismometers stationed, such that we can compare his shaking to my maps to better understand and predict ice jamming. You can see some fodar results from last year’s effort here.
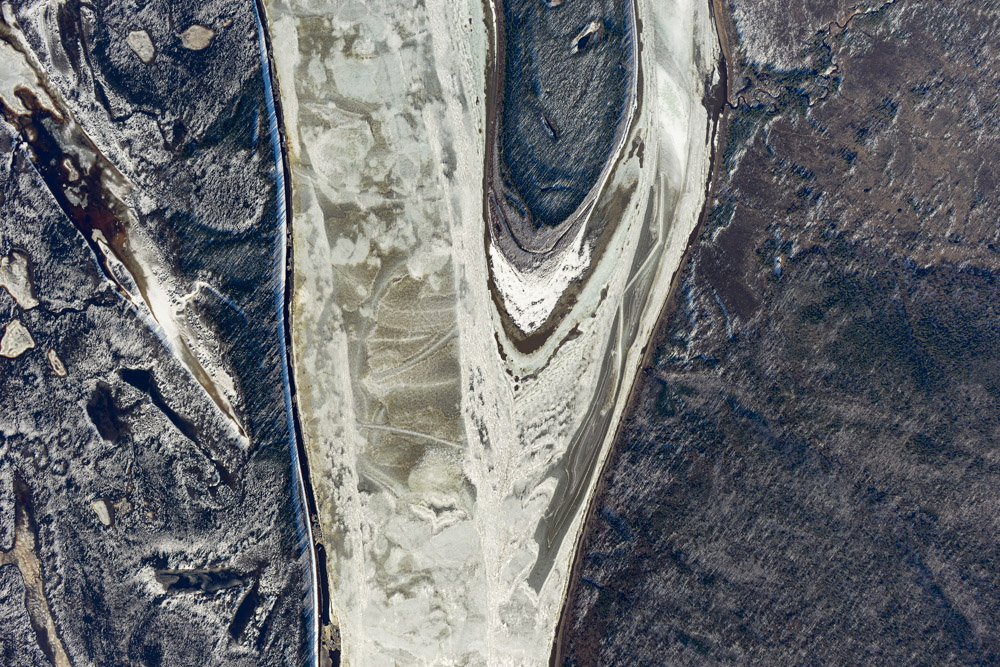
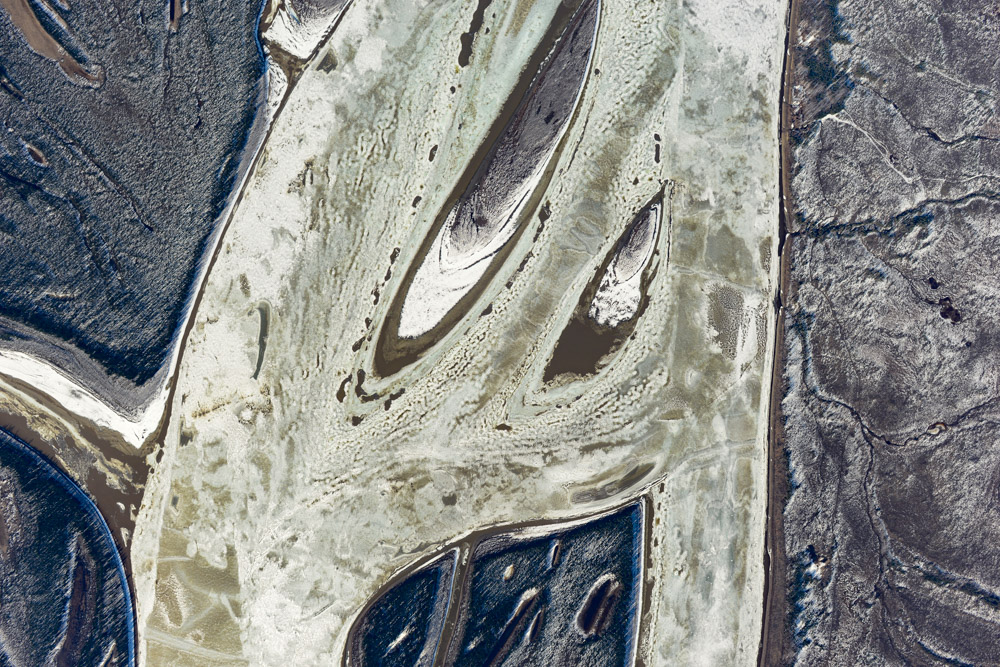
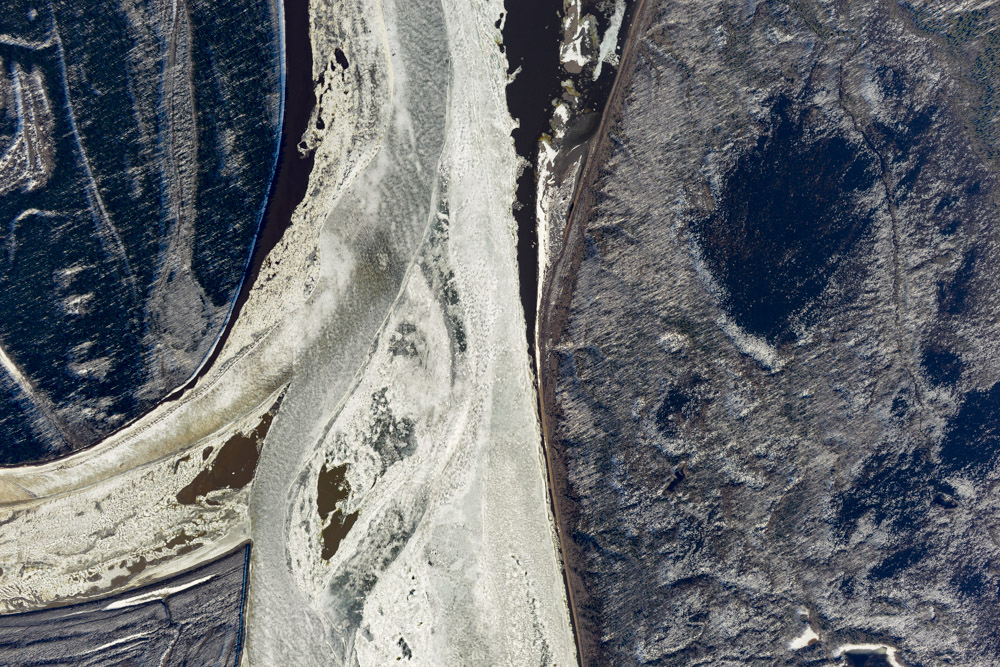
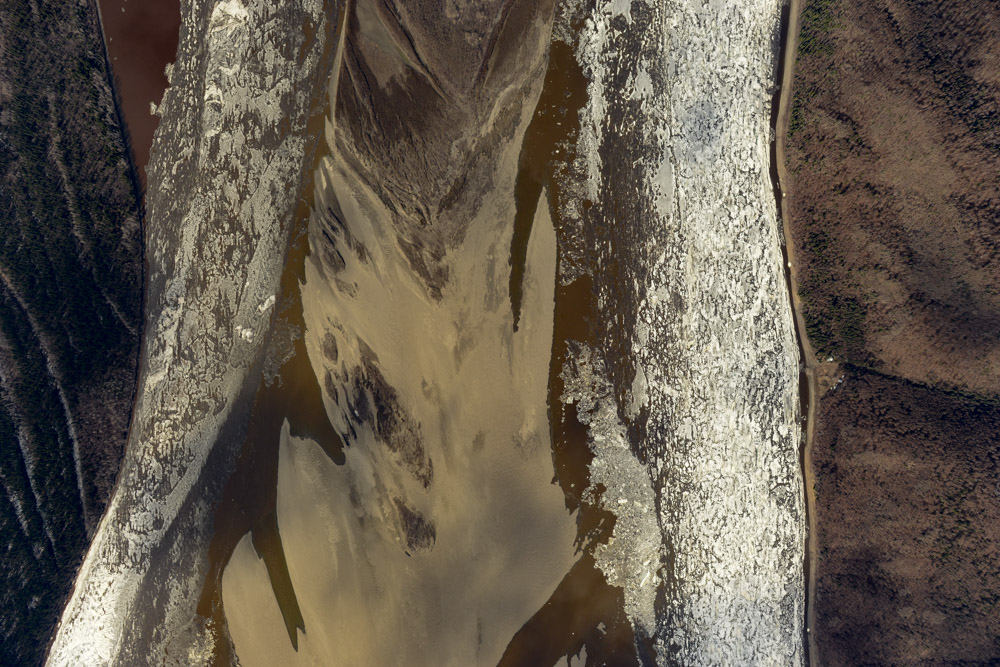
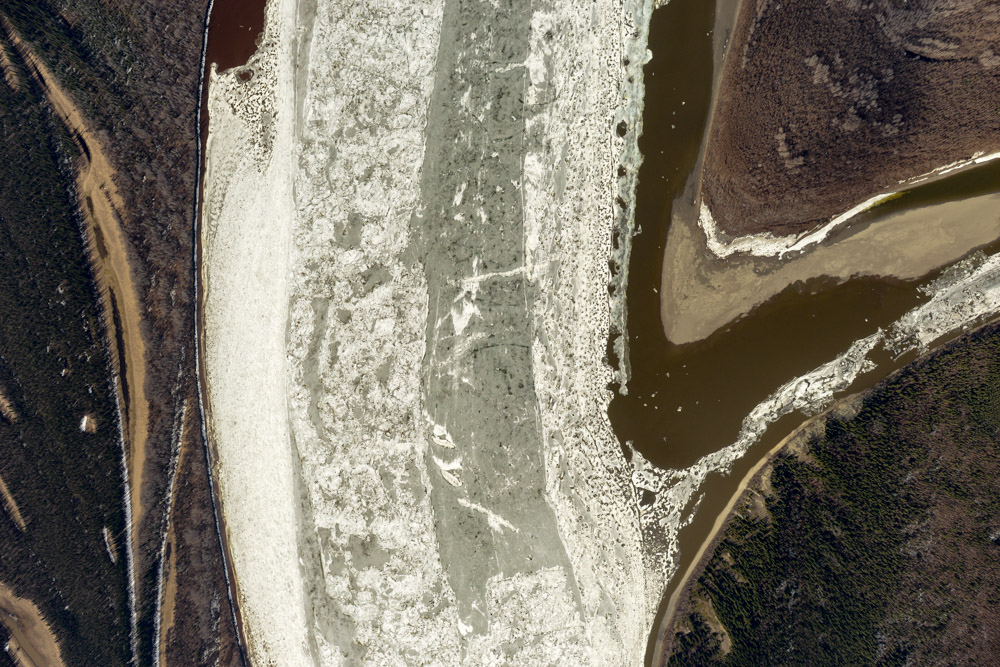
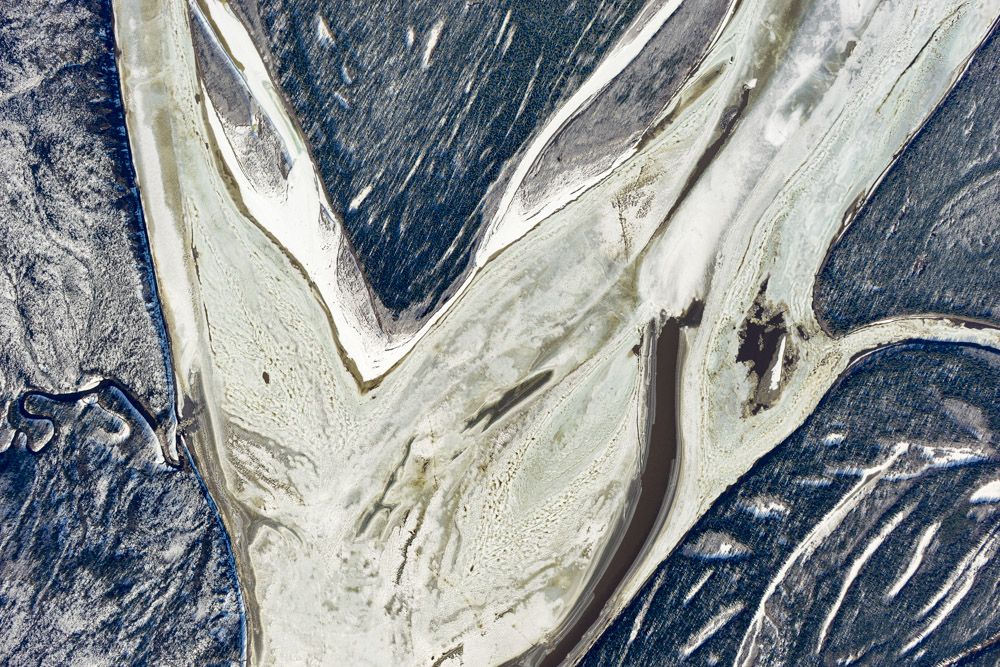
The Yukon River is much larger than the Tanana River, with much more devastating effects when large jams develop as too much ice tries to squeeze through too small a channel, damming the river and causing it to rise many meters, not only flooding villages and carrying away their homes but also depositing enormous chunks of ice in their backyards. So I thought since I was more or less headed that direction I’d map the Yukon again, just because I can.
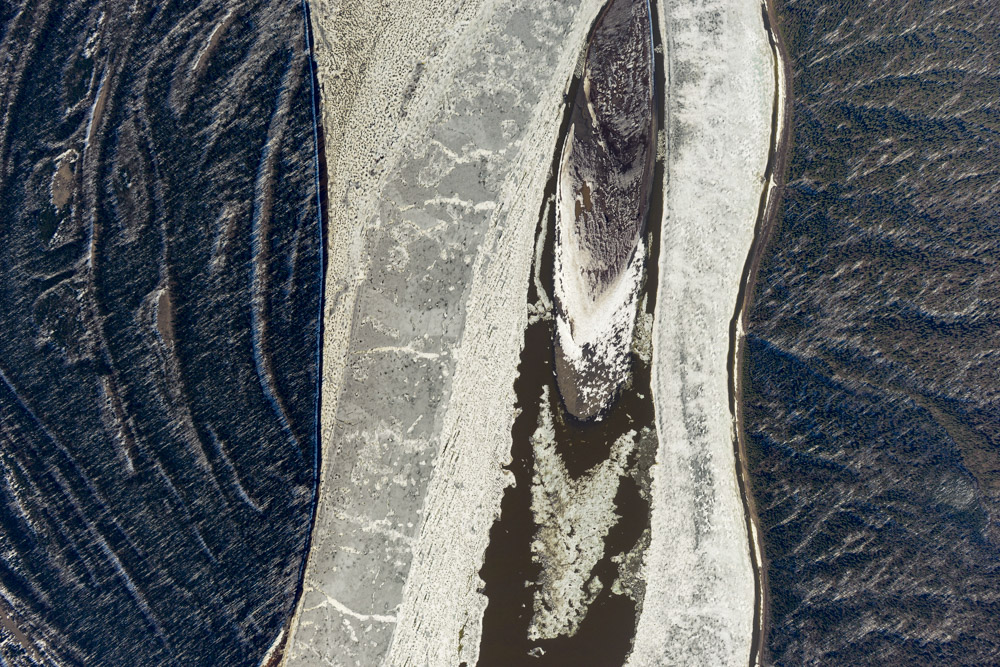
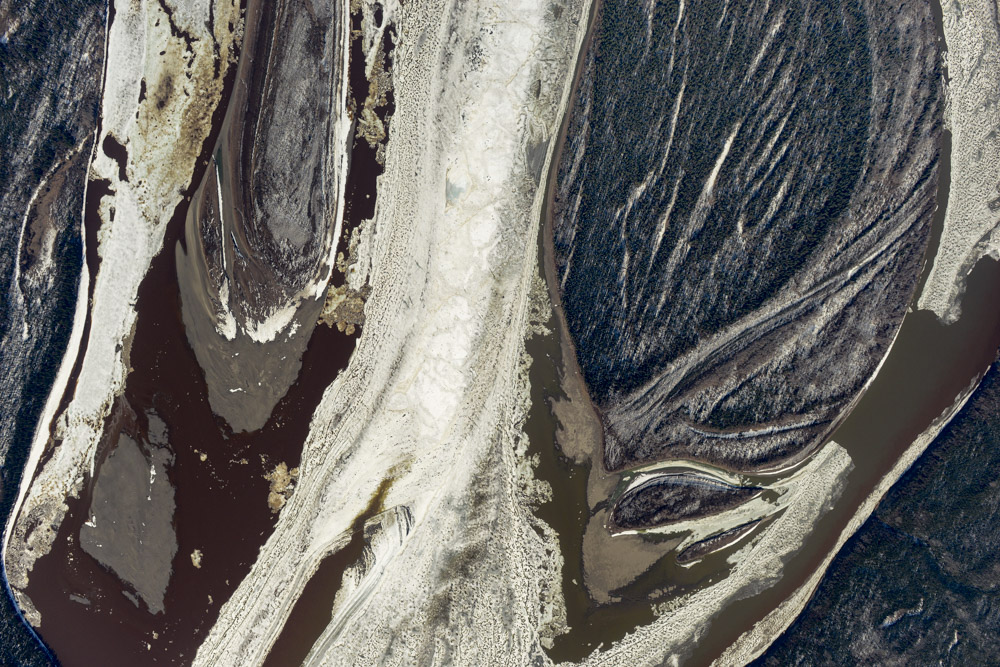
As I look back on the day and at the photos, it strikes me that we could fairly easily create an operational monitoring system for ice jam measurement. As you can see below, I could easily have mapped the entire Yukon River in Alaska in a single day, weather permitting. Doing this near-daily during the week or two when the action happens could yield untold insights into river ice dynamics, as well as improve near-realtime prediction — imagine having near-daily transects of ice elevation of over 1200 miles of river. Besides the elevation data, the imagery is ridiculously rich in content, and the combination of elevation and imagery priceless. Combine this with village maps like the ones I’m making along the west coast of Alaska, and you would have all the information you’d need to know to predict village vulnerability to ice jam flooding as jams are occurring, and prepare accordingly (hopefully beforehand…).
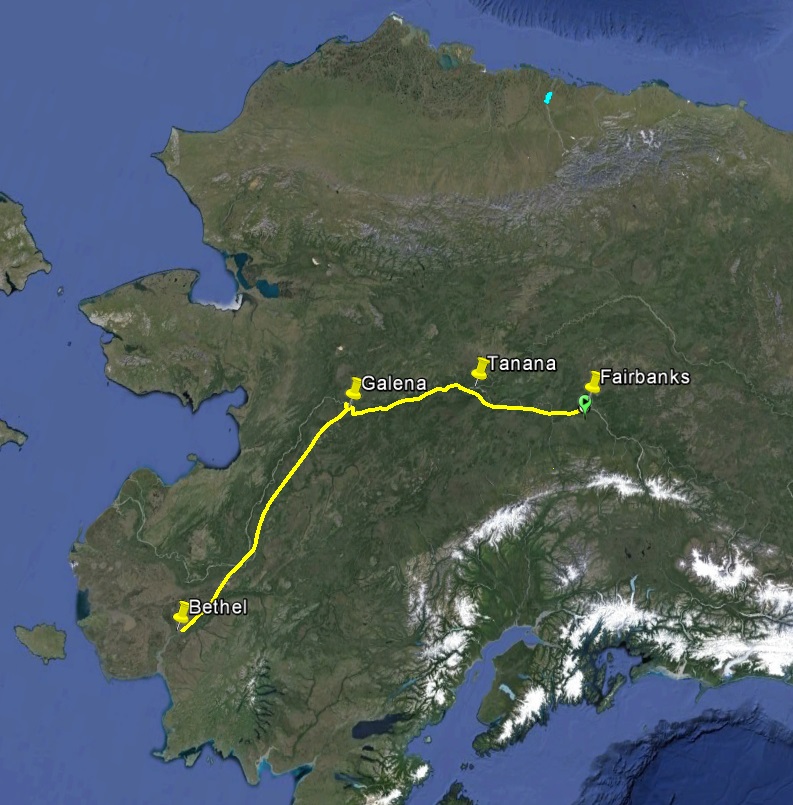
This flight was 650 miles, about half the length of the Yukon River in Alaska. I didnt see any ice above Tanana, but I did hear someone on the radio saying they were mapping some near the bridge, north of Fairbanks.
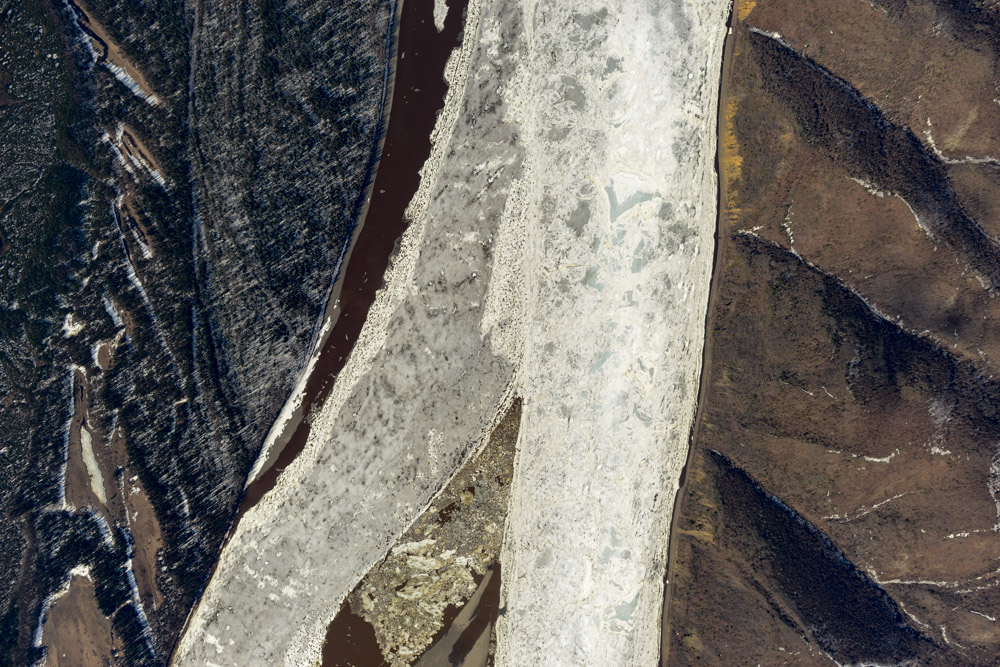
I would have mapped the whole river to where it cuts off to the coast above Bethel, but the early afternoon thermals were getting ornery up so I went above the build-ups — as a general rule I dont take the bumps below unless someone is paying me…
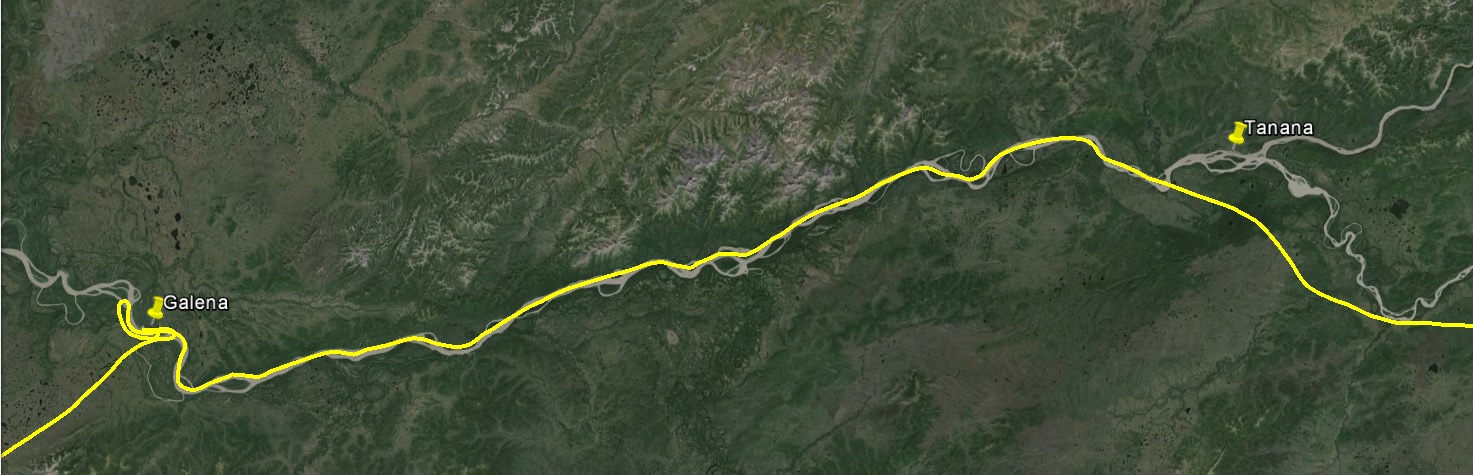
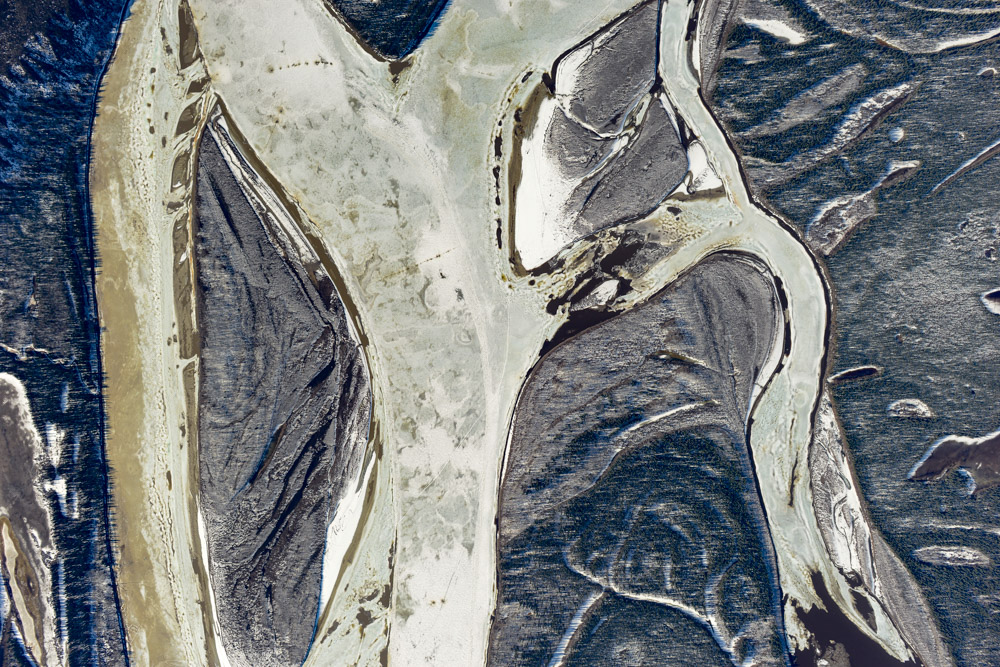
The stretch of the river that I mapped was about 150 river miles. I often get asked the question “Cant you do this with a drone?” The short, snarky answer is”Why would I want to?”, but usually I give the long, gratuitous answer, for example, “Unless your drone carries bombs, by law it has to be flown within line of sight of the operator, which is less than a 1/4 mile for someone with eagle eyes, plus you must also have a separate camera operator and observer to check for airplane traffic. So let’s see, just for this 150 mile stretch, that would be 150 x 4 = 600 relocations and redeployments for 3 people, using a drone that probably has a 20 minute battery life, so also include a portable generator, a few dozen batteries, food for several weeks and — oh yeah, the ice is rotten and maybe causing floods so you’ll need a helicopter to move all that stuff. Or you can hire me for a few hours and have your map the next day.”
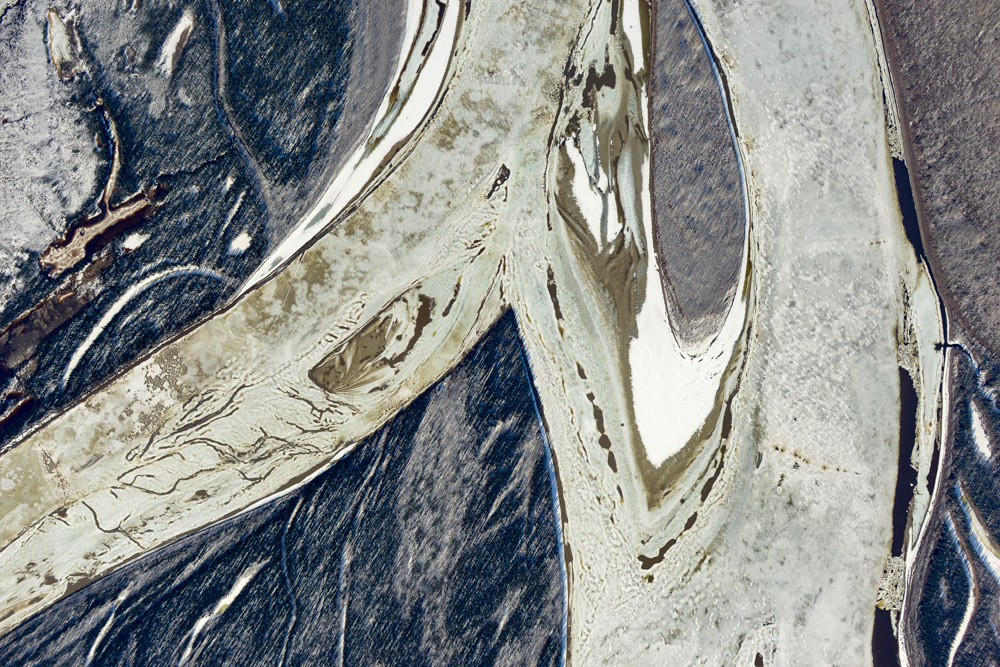
Regardless of how this technology may advance our understanding of dynamics like ice jams, at some level the beauty of nature is simply unpredictable…