
West Coast Village Data Delivered!
Processing over 50,000 photos covering over 1200 square kilometers, we have now finished creating high resolution digital elevation models and orthoimages of all 29 villages from Wales to Bethel and delivered them to the State yesterday, just 4 months after signing the contract and a bit more than two months after acquiring the data. This delivery is just phase one, over the next few months we will deliver a mile-wide swath of coastal data between these villages.
The State needs these data for several purposes. Alaska’s coastline has not been mapped since before Statehood, and not only has the coast changed since then but those methods were coarse in comparison to what is possible today. Knowing where the coastline is and understanding the topographic connection between land and ocean is critically important for predicting tides, the impacts of storm surges, and tsunami danger. Having an accurate baseline of coastal topography is required if we are to systematically assess and understand coastal erosion and the impacts that sea level rise and climate change are having on it. Until now, it was simply unaffordable to make maps of this accuracy. We developed fodar, however, to provide an airborne solution that was just as accurate as existing methods, but 10x cheaper. Four months ago, Alaska DGGS’s Coastal Hazards Program saw the potential of fodar in suiting their needs and awarded Fairbanks Fodar this coastal contract through an RFP with stiff competition, and the first results are now ready to share. Each map has a spatial resolution of 10-20 cm and comes with a digital elevation model (topography) and an orthoimage (a perfectly co-registered picture), and in total add up to more than 30 billion pixels of data.
Fodar is an airborne digital photogrammetric technique that we developed based on Structure-from-Motion software. You can learn more about the technique of fodar by following these links.
https://fairbanksfodar.com/snow-depth-paper-published
https://fairbanksfodar.com/new-papers-published-on-fodar-measurements-of-alaskan-coastlines
https://fairbanksfodar.com/understanding-fodar
You can get a better sense of the goals of the project from this blog post from the field and the video you will find there:
https://fairbanksfodar.com/a-first-look-at-the-latest-map-of-unalakleet
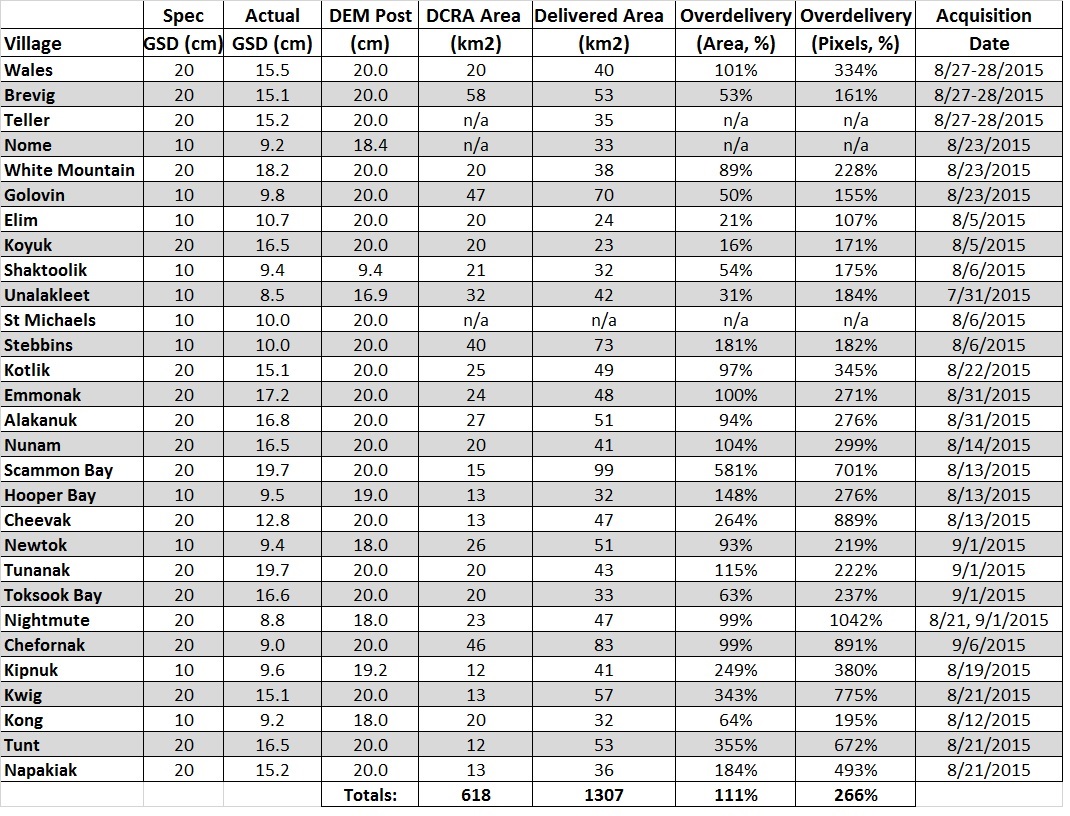
This table presents a list of all villages acquired and delivered, along with some details about them. We acquired more data than required to ensure that we captured the data within the village boundaries without gaps, but we provided all of the extra data to the State as it is still useful. In the examples that follow at the end of this blog, the actual village outline (DCRA Area) is shown in red. We also acquired the data at higher resolution than required when possible to further improve the usefulness of it. To our knowledge, these data are the best topographic and orthoimage data of any villages in Alaska.
The data will not be publicly available until this spring, as the State will now perform its own final validation checks and metadata reports, and then serve it online for download. One large and time consuming task will be to hydroflatten all of the water bodies, meaning that because fodar does not work over water, the noise that is present there must be manually edited out, and there a lot of lakes, lagoons, and oceans in these data. In the meantime, you can interactively view much of these data in 3D using Fodar Earth.
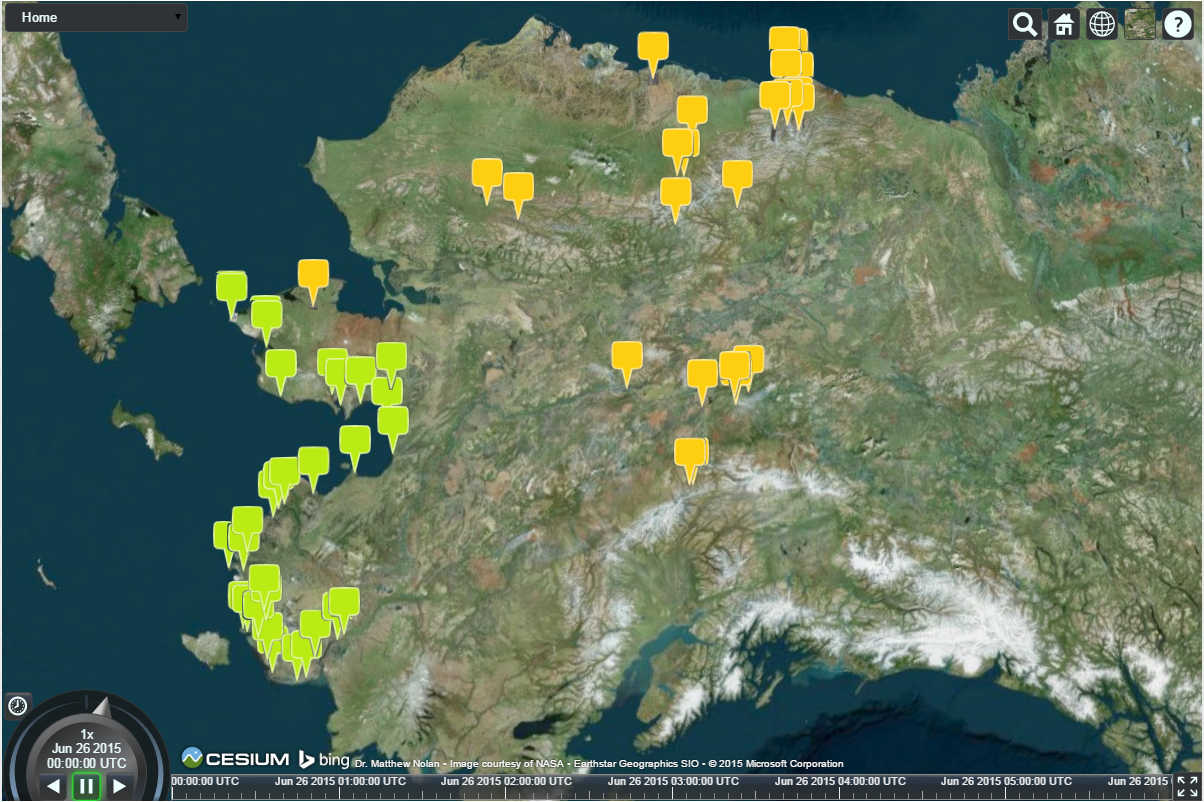
Most of the data (green pushpins at left) is now available online in 3D at Fodar Earth, the rest will be added soon. Use the drop down menu to fly directly to a village, then navigate with a mouse (click the question mark for control info). Note that you can change the background imagery with options in the upper right, and that this can help distinguish fodar data from other data sources in the base layer.
Data Accuracy
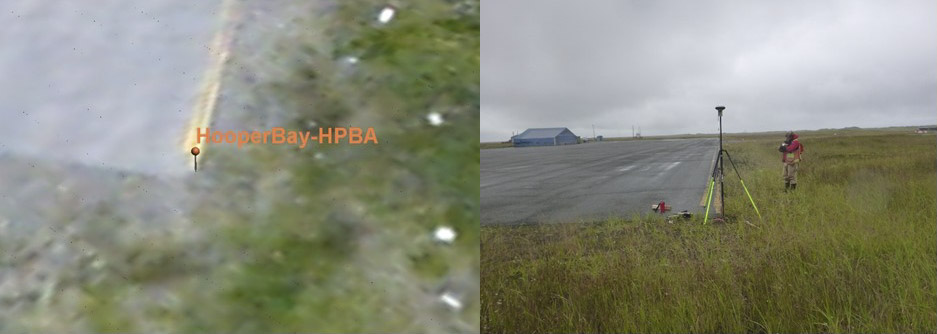
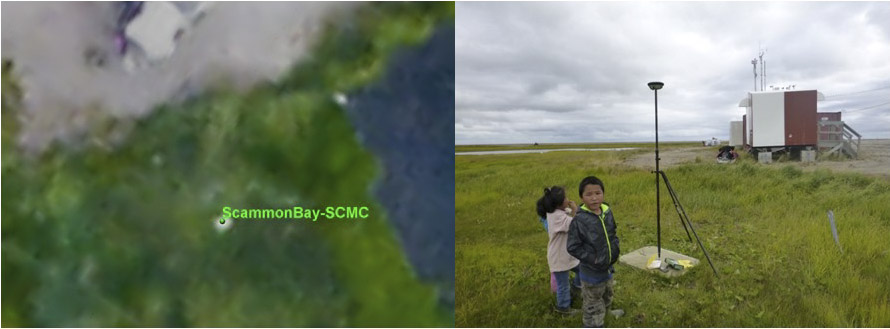
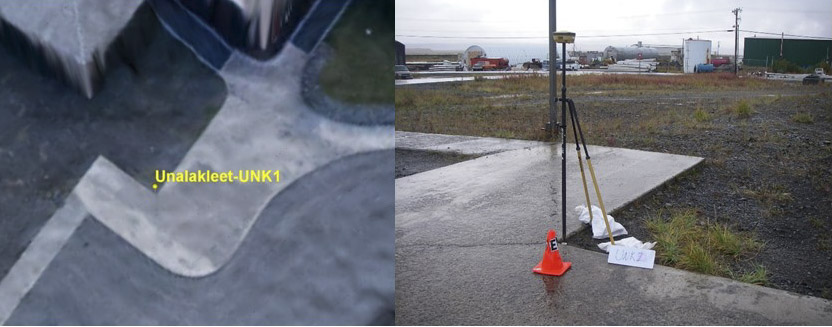
We compared 27 of the village maps to ground control points measured on the ground within those villages. These GCPs had an accuracy of better than 1 cm. Below are a few examples of the comparisons of actual photographs of those GCPs to 3D visualizations of the fodar maps. In all cases, the horizontal alignment was perfect, or as good as could be determined by eye (<10 cm). Vertical alignment was largely 10 cm or better. For example, of five GCPs in Wales, all points fell within +/- 10 cm of the mean. We also compared our July 2015 map of Unalakleet to a similar map we made in September 2014 and found that nearly all points were within 10 cm of each other, such that real change on the order of centimeters could be detected between mapping dates. Below are some examples of the quality control checks from our report, as well as some examples showing the subtle details that our maps contain.
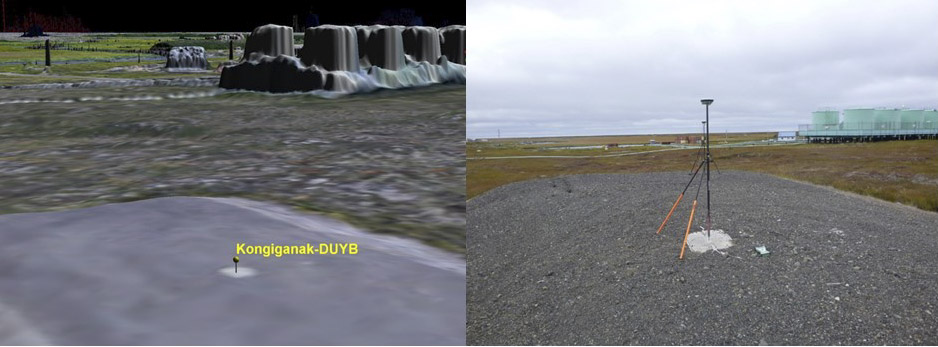
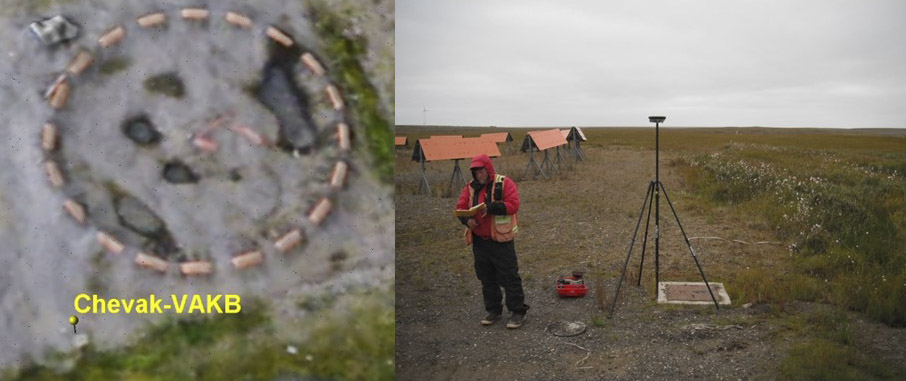
Below are a few examples of our comparisons to survey-grade GPS on the ground. At right is a photo of the GPS measurement, at left is that coordinate placed onto a 3D visualization of our data. In all cases horizontal alignment was essentially perfect, as seen here. The vertical scatter of multiple-GCPs within a village was always within +/- 10 cm.
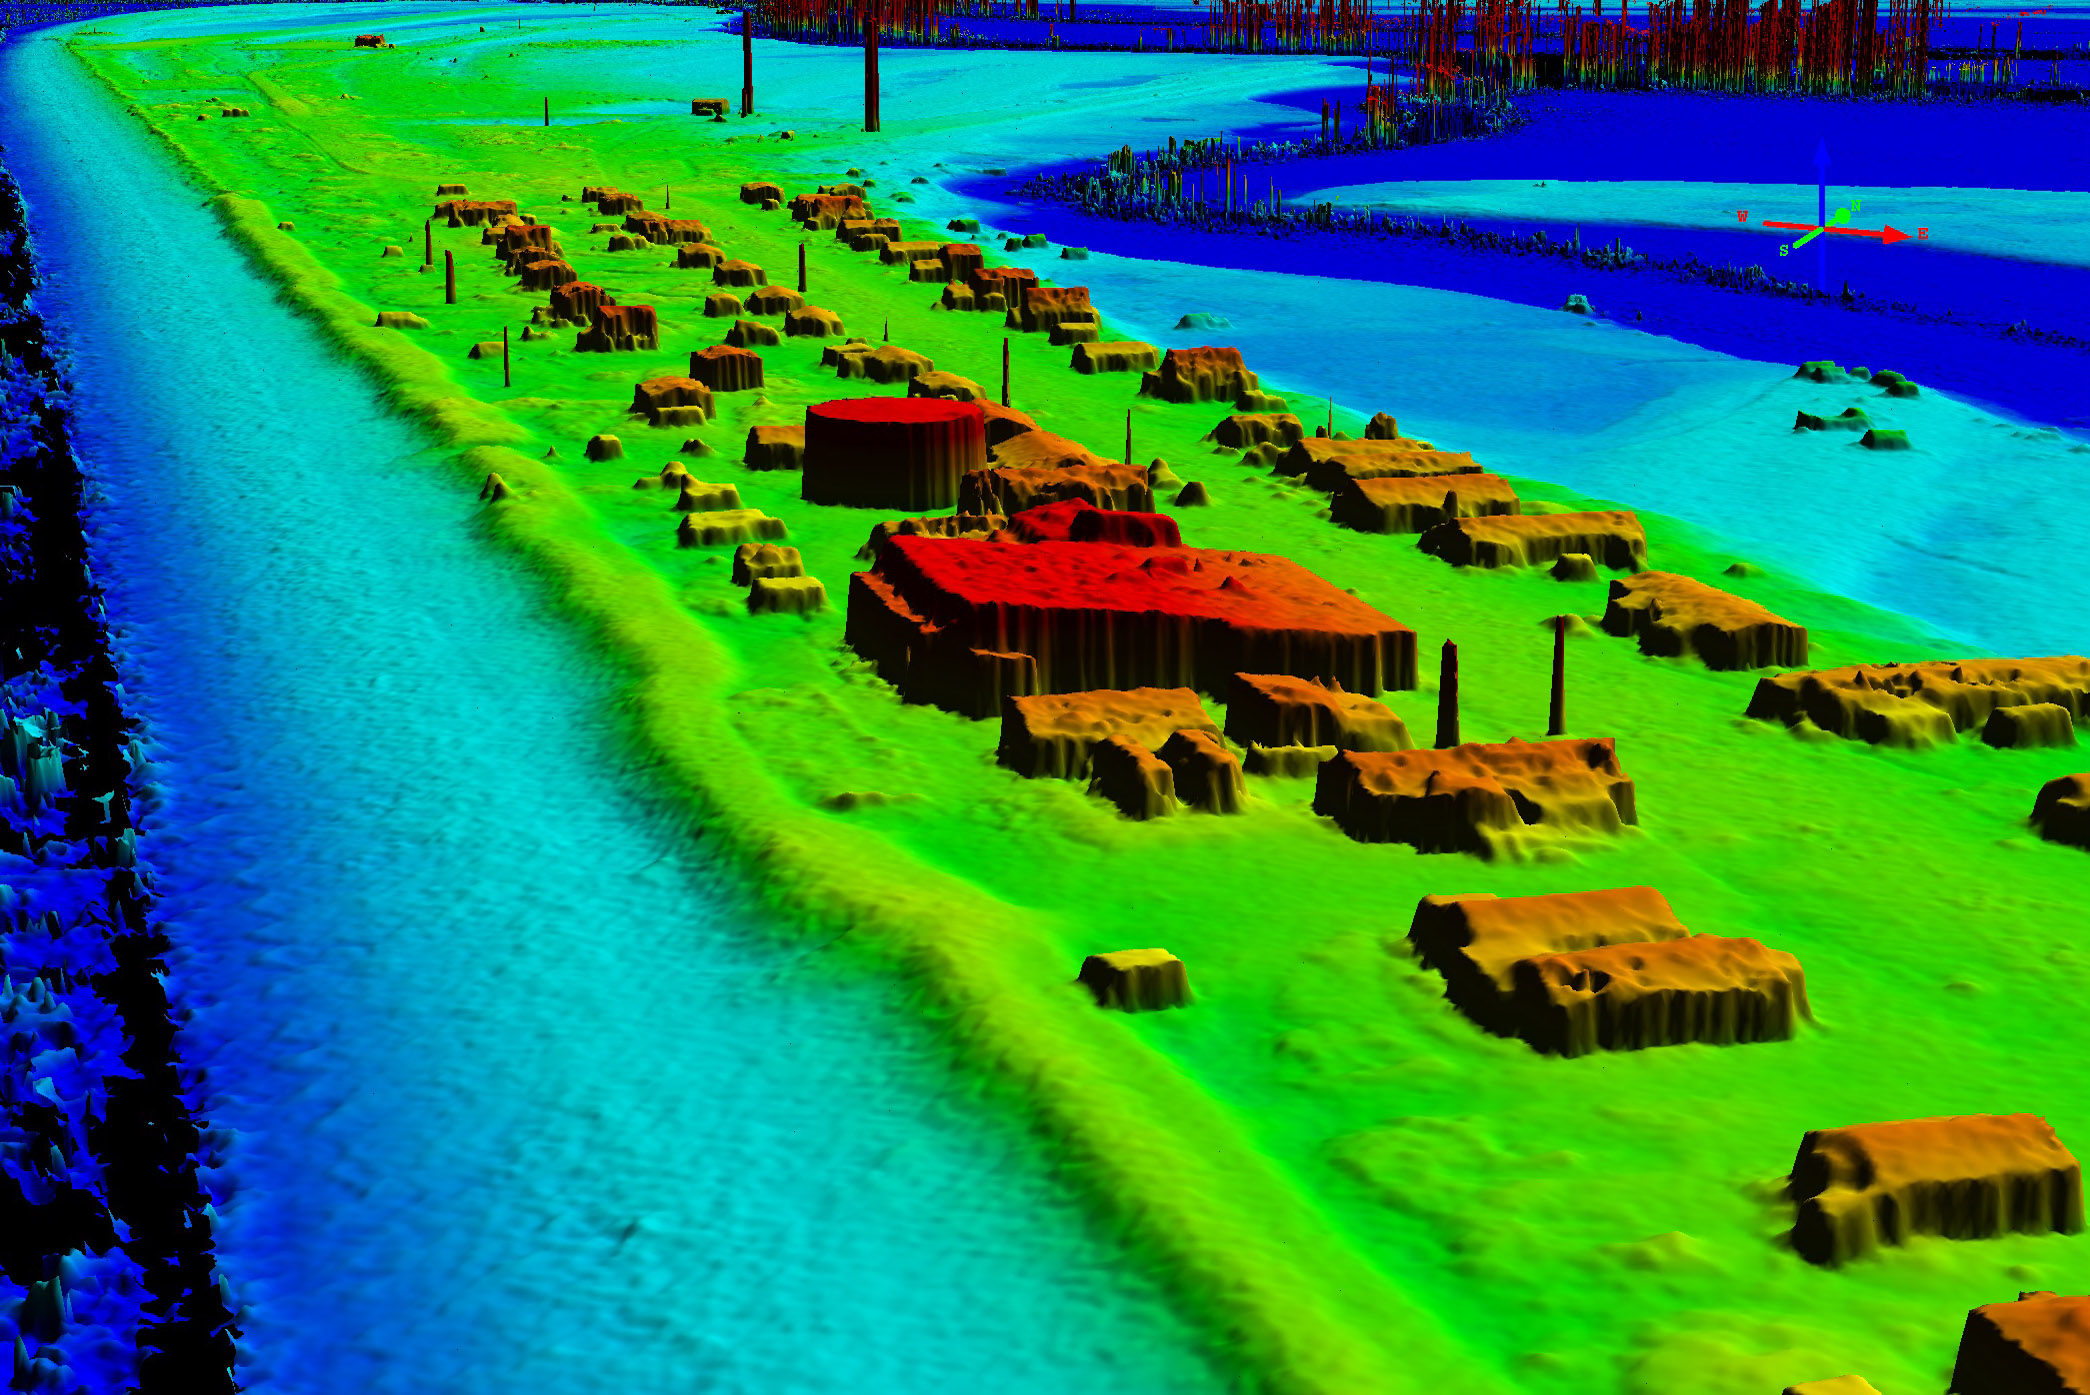
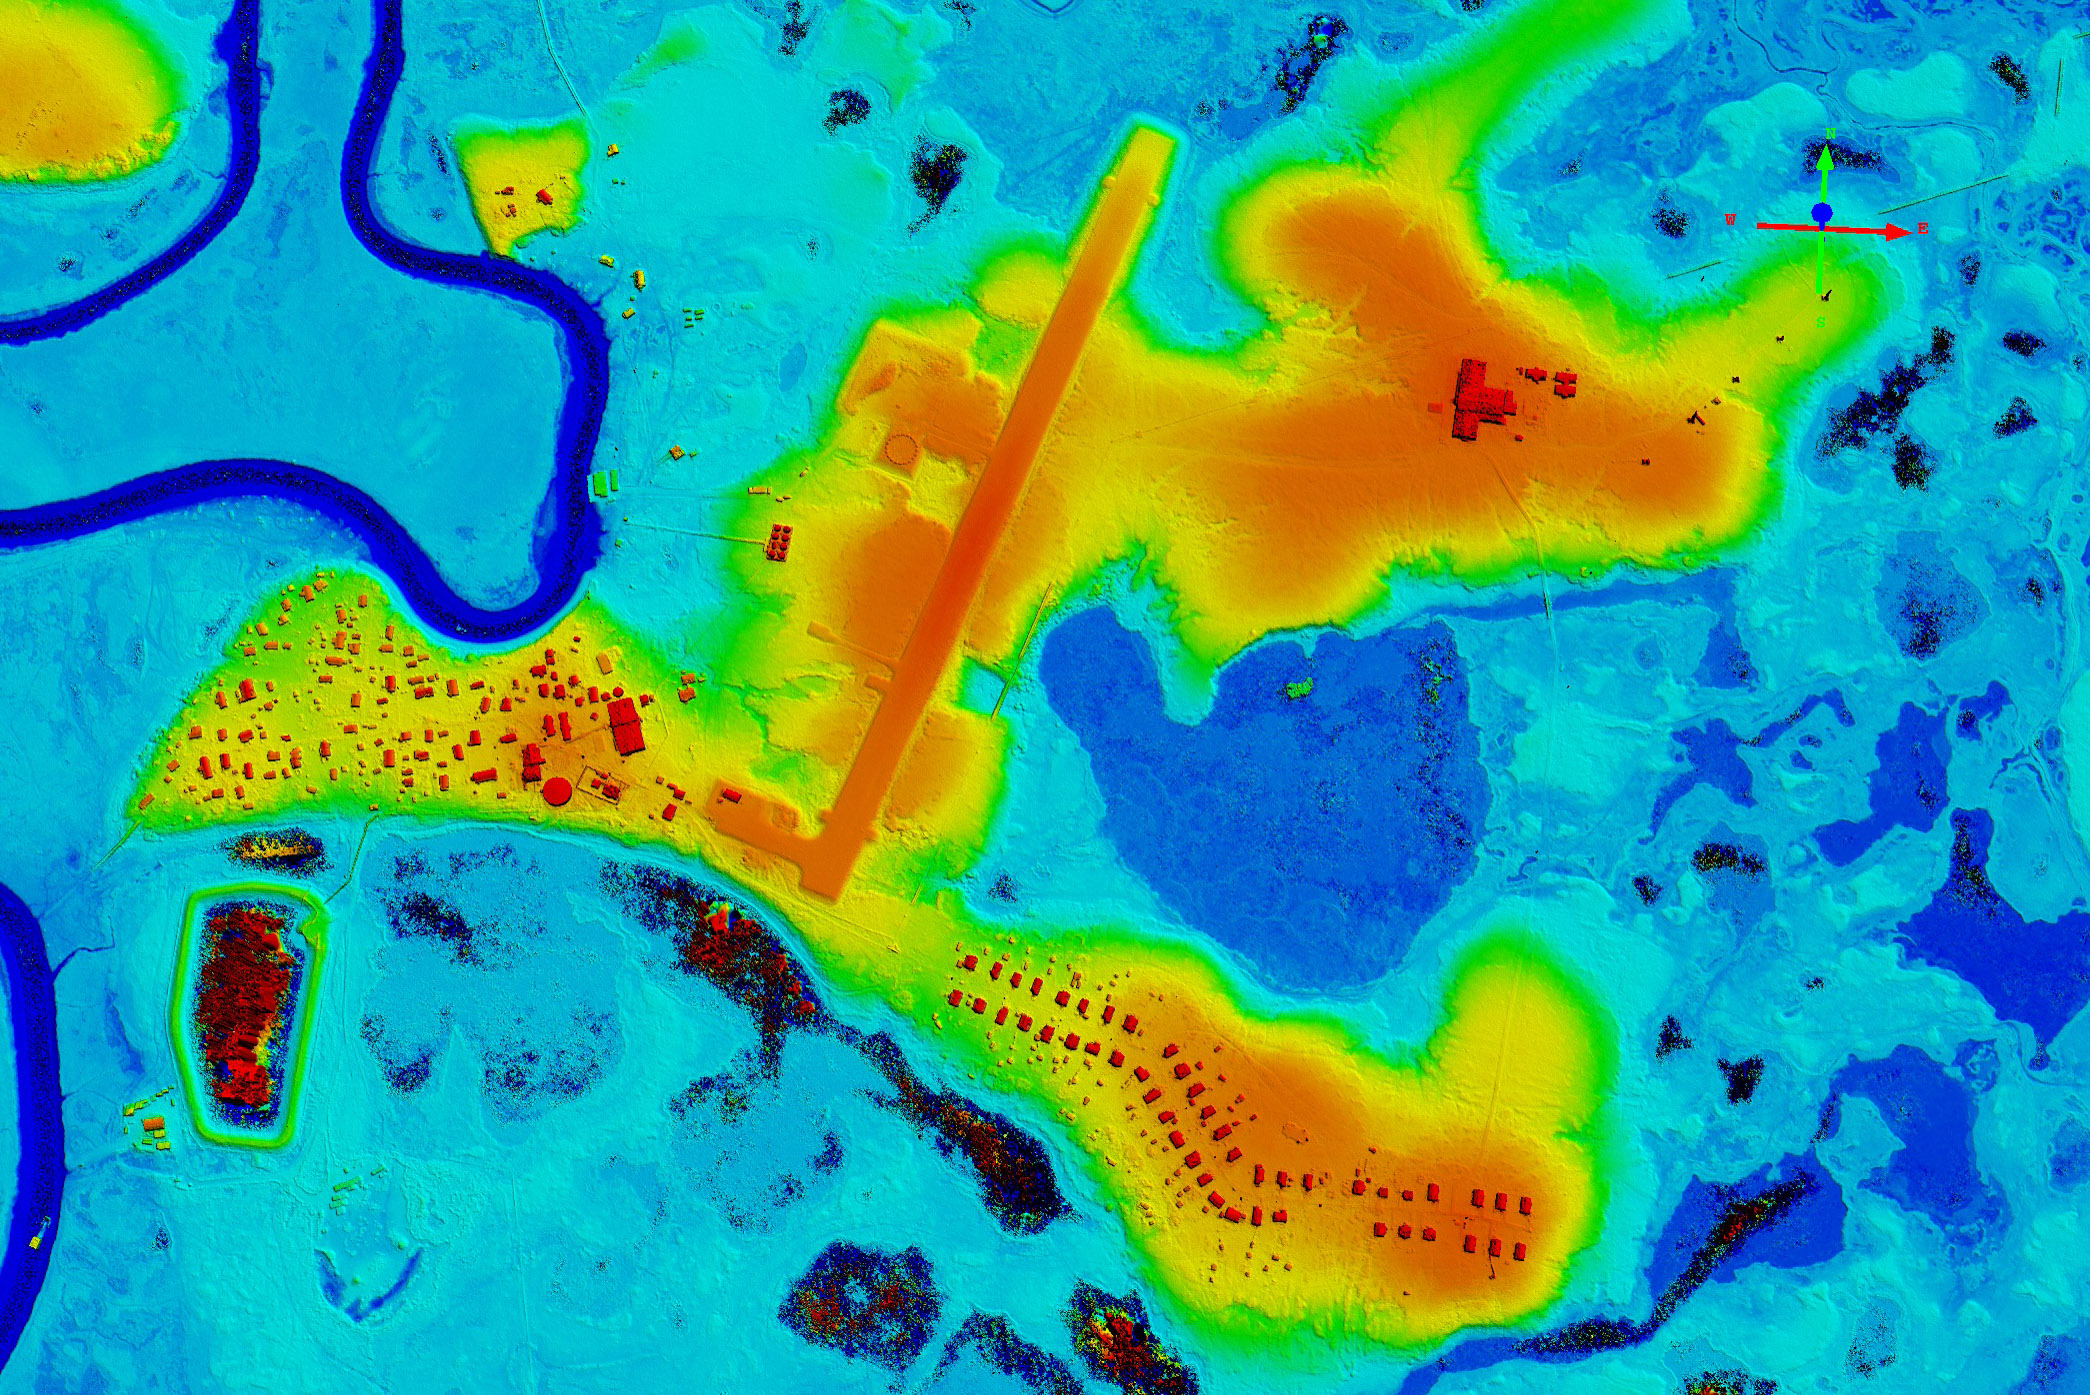
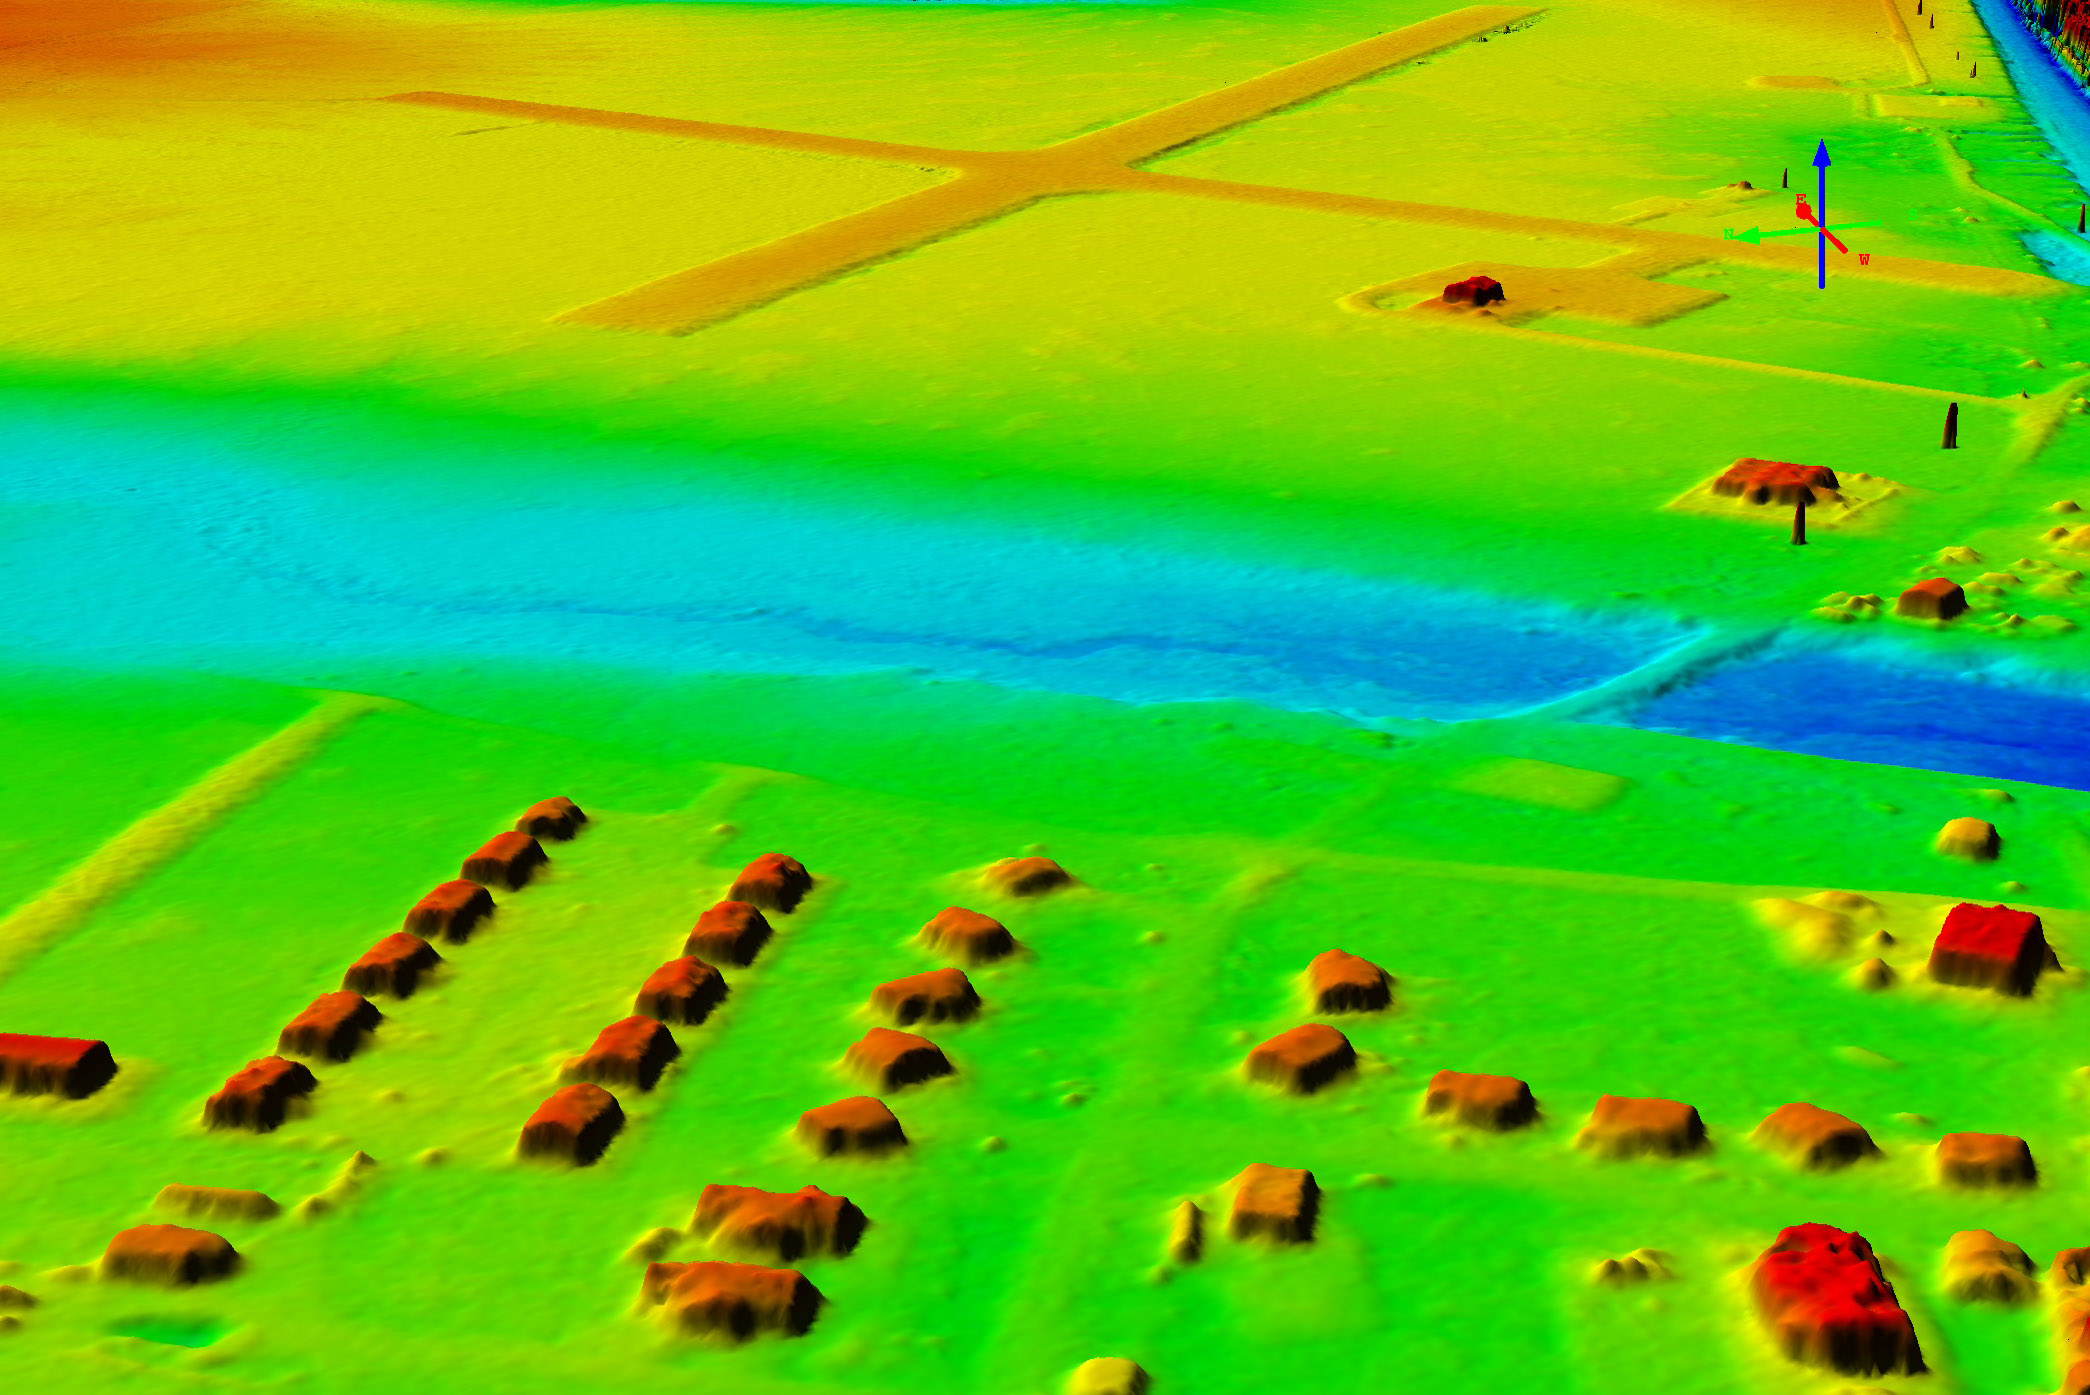
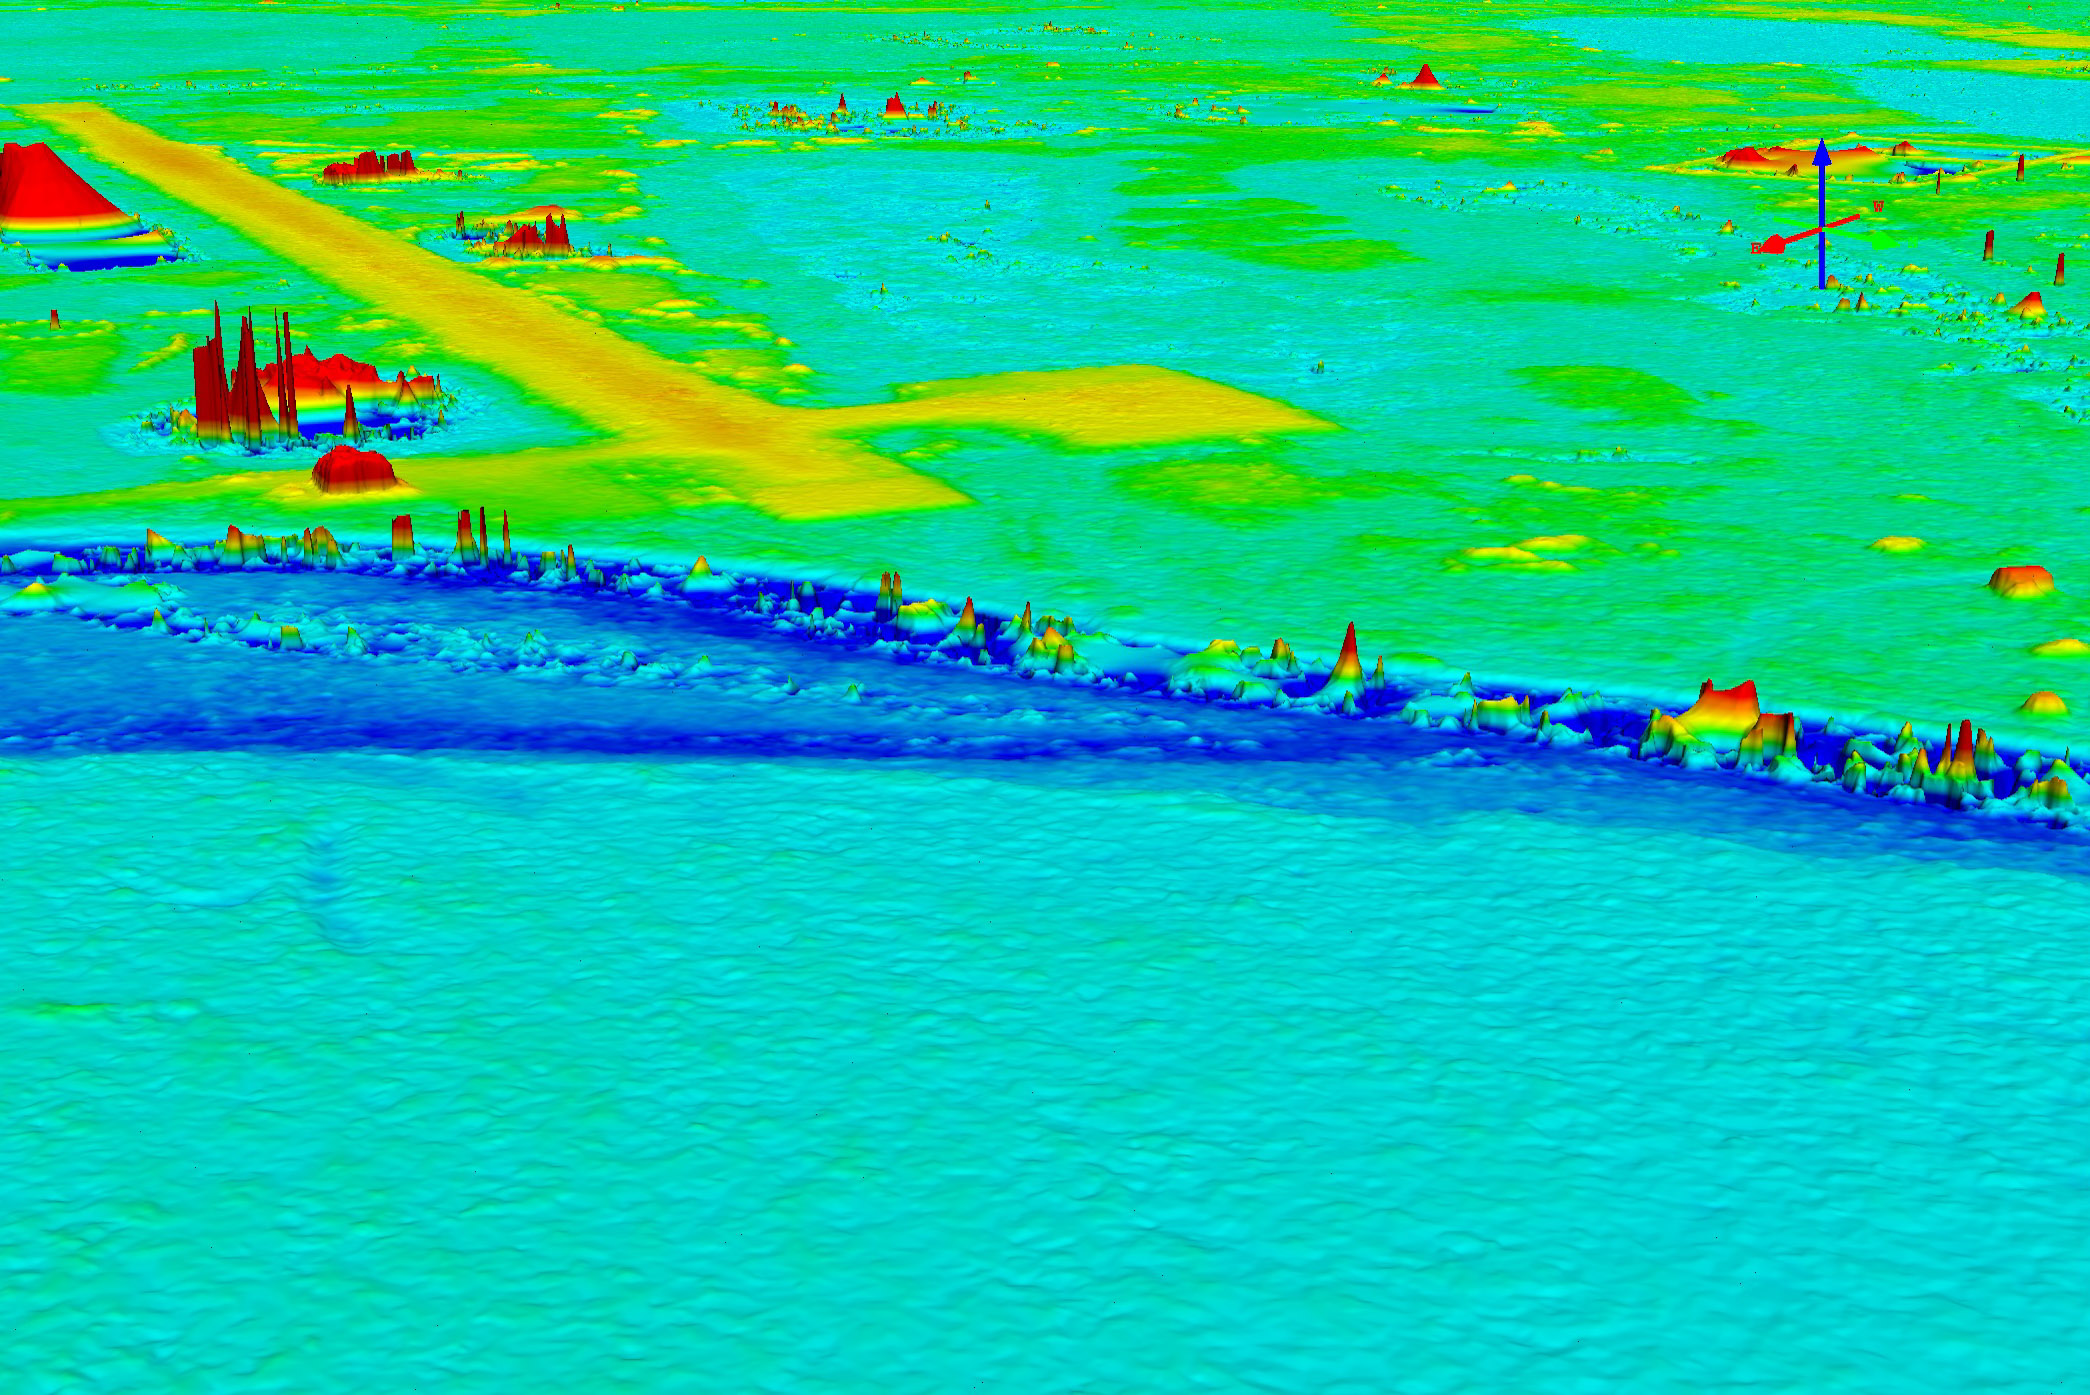
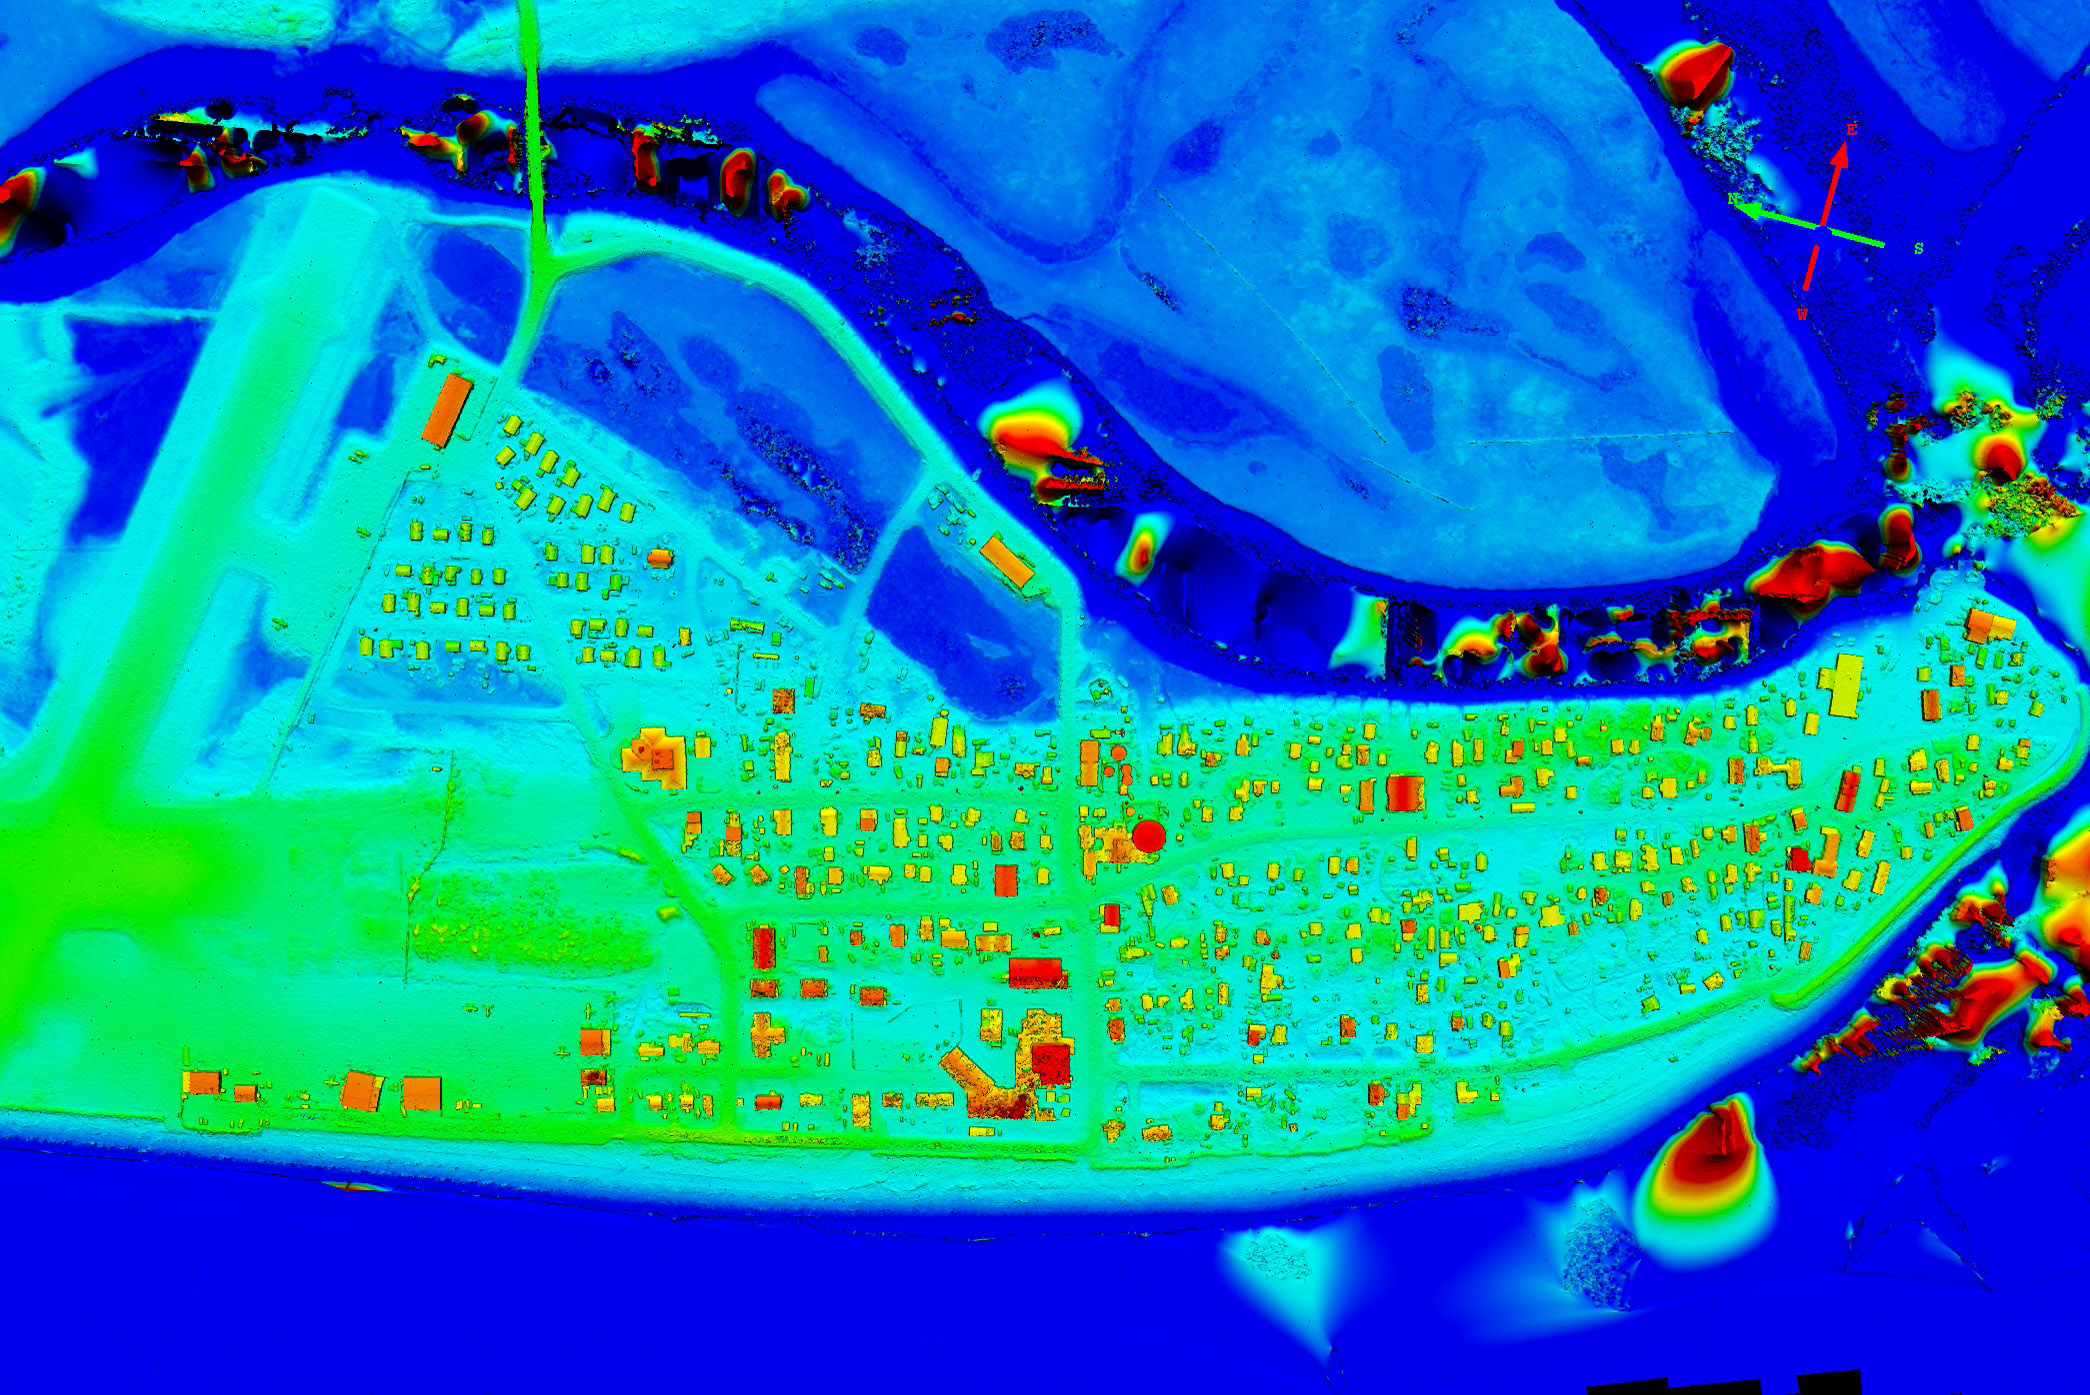
Here is Shaktoolik, with color coded topography; in all of the images on this blog, red means high and blue means low, though the values vary between images. Mouse-over to see the color orthoimage draped over topography. Many of these villages are at risk from storm surge and sea level rise. Here the village of Shaktoolik is just a few meters above sea level, protected by a thin, mad-made berm. The power of fodar is not only measuring these man-made objects, but subtle natural topography as well, such as the wave-cuts seen in blue on the left of this image.
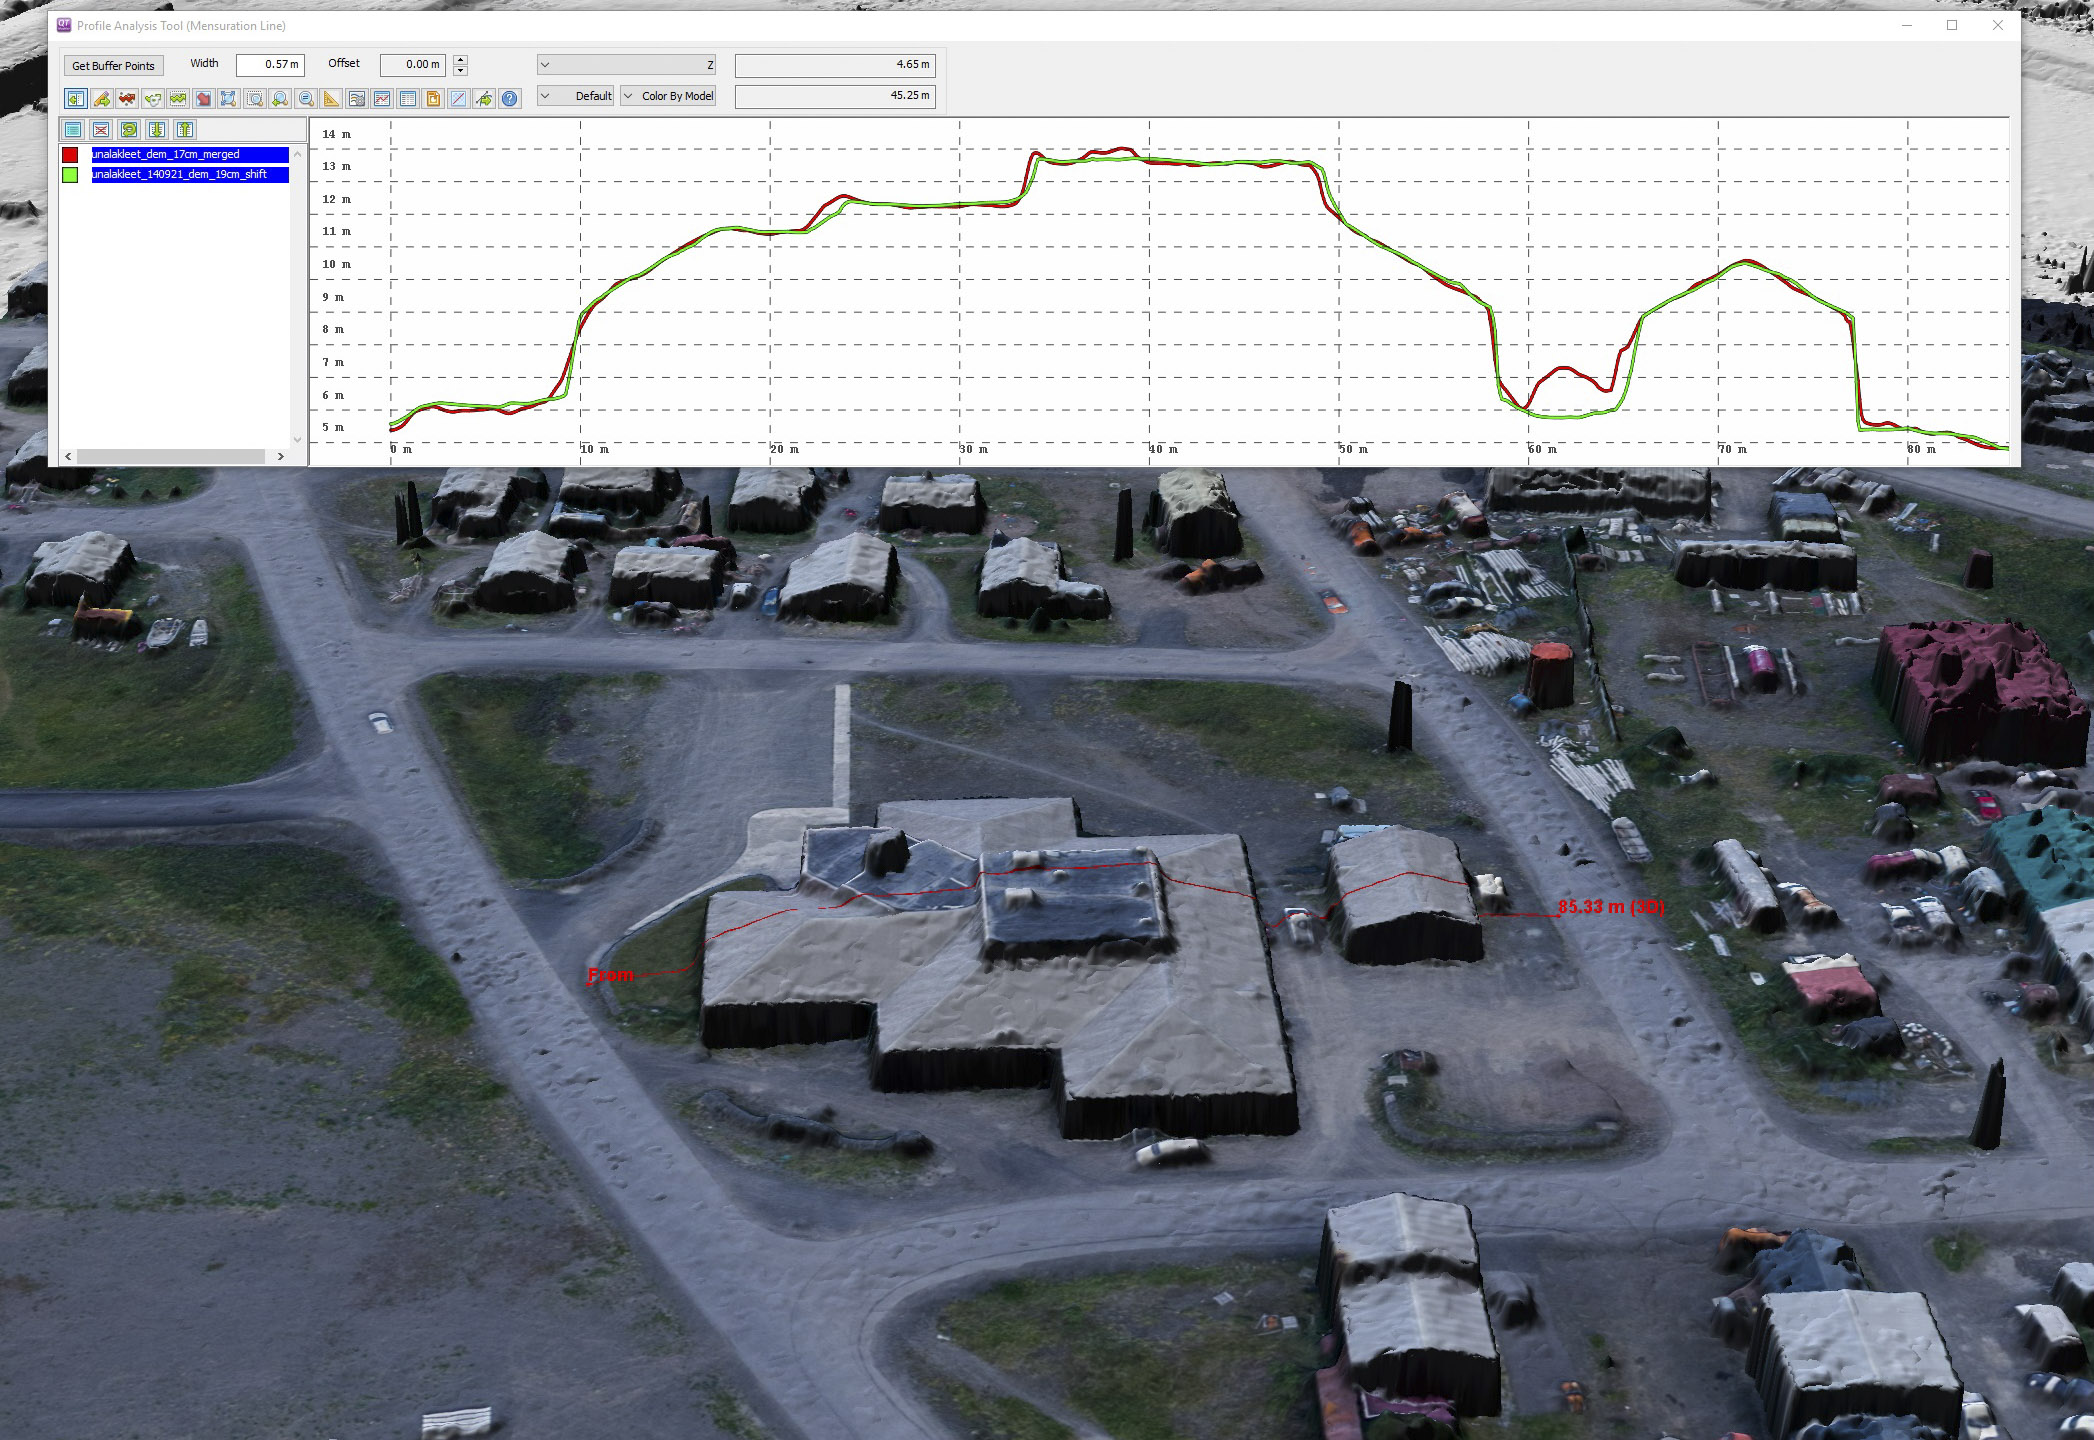
This is a comparison of two maps we made of Unalakleet — one in 2014 and one in 2015. Here a profile line has been drawn across the complex roof of the clinic. The red and green lines in the plot above show the topography from the two maps. As can be seen, the correspondence is almost perfect. Where the two diverge at right between the two buildings is where a car was parked in 2015 but not in 2014. More rigorous analyses like these have demonstrated that our fodar data is repeatable to +/- 10 cm, allowing us to detect and measure tiny changes between mapping dates. Careful examination of this image will reveal that cars, snow machines, and boats have moved between dates, as well as some gravel extraction.
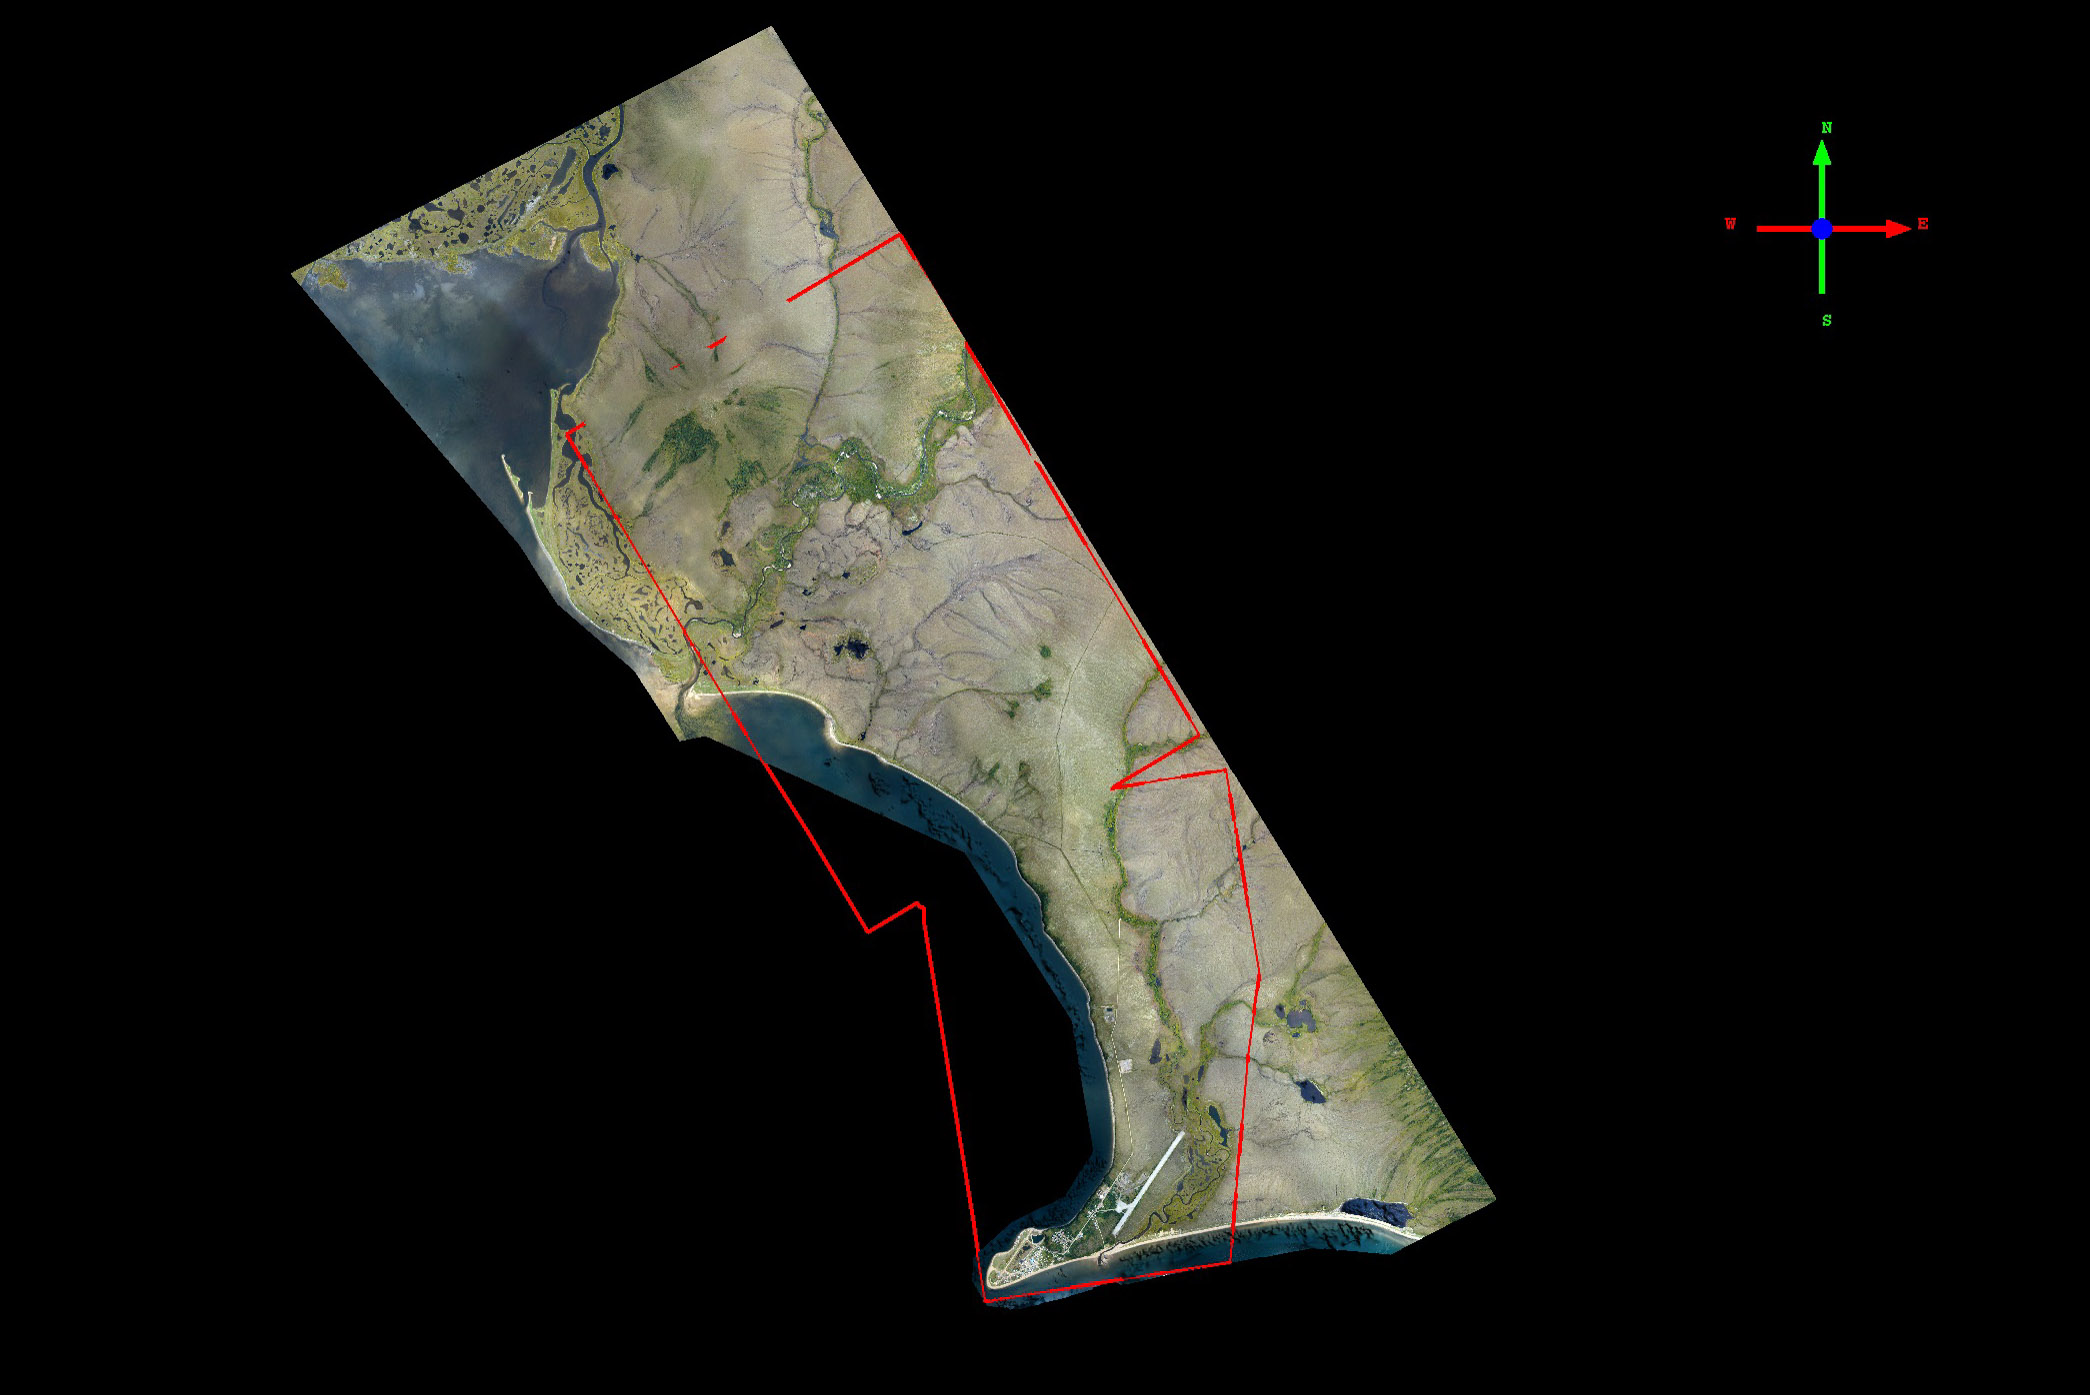
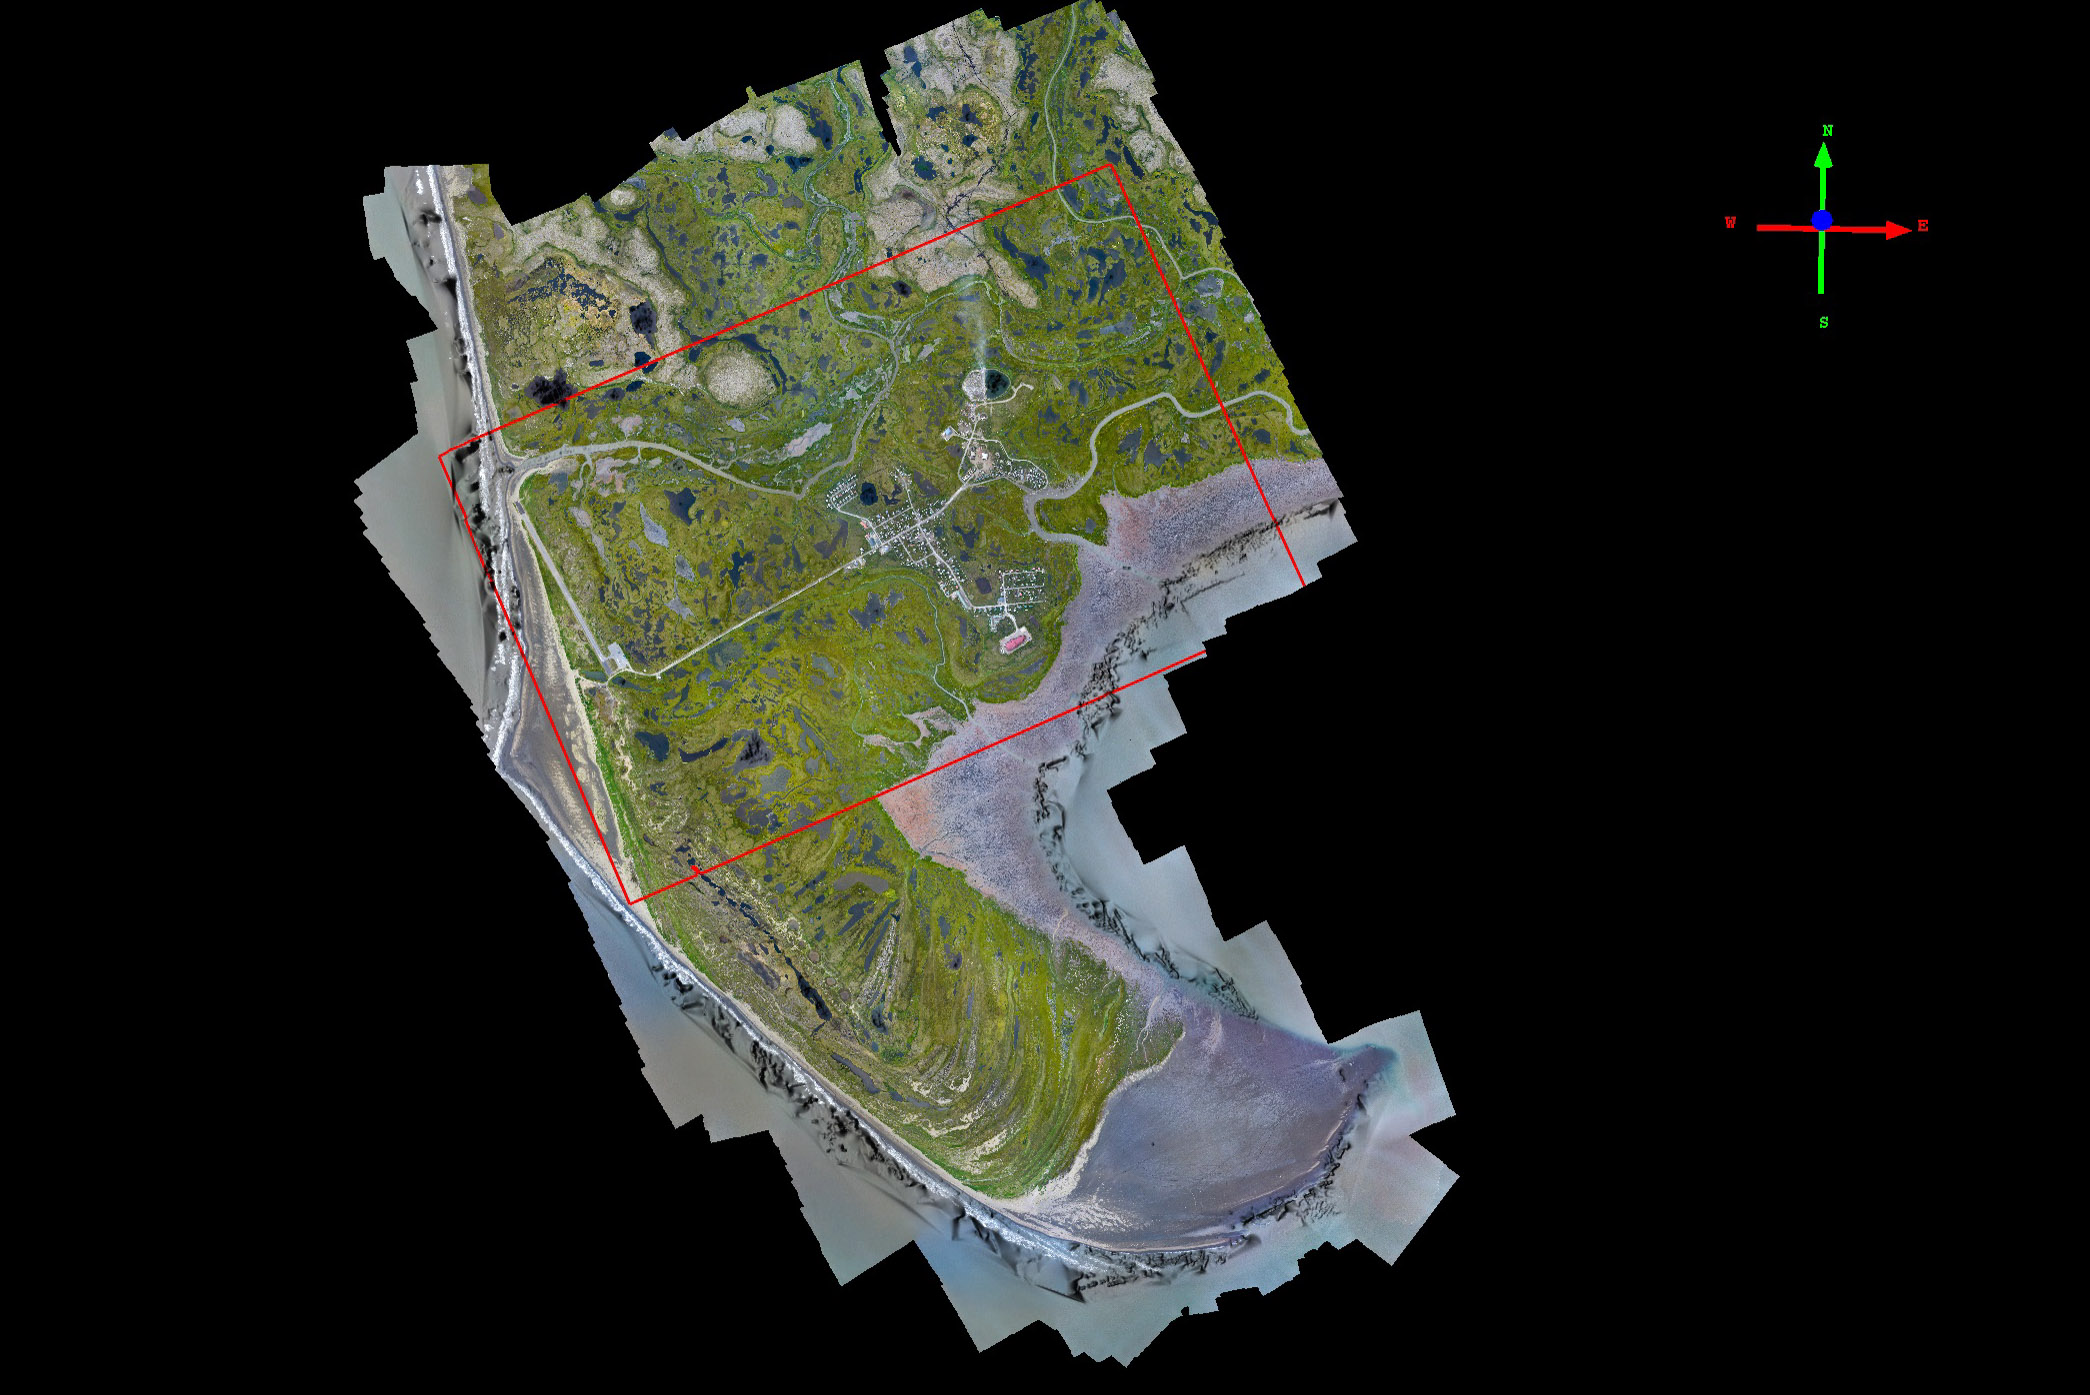
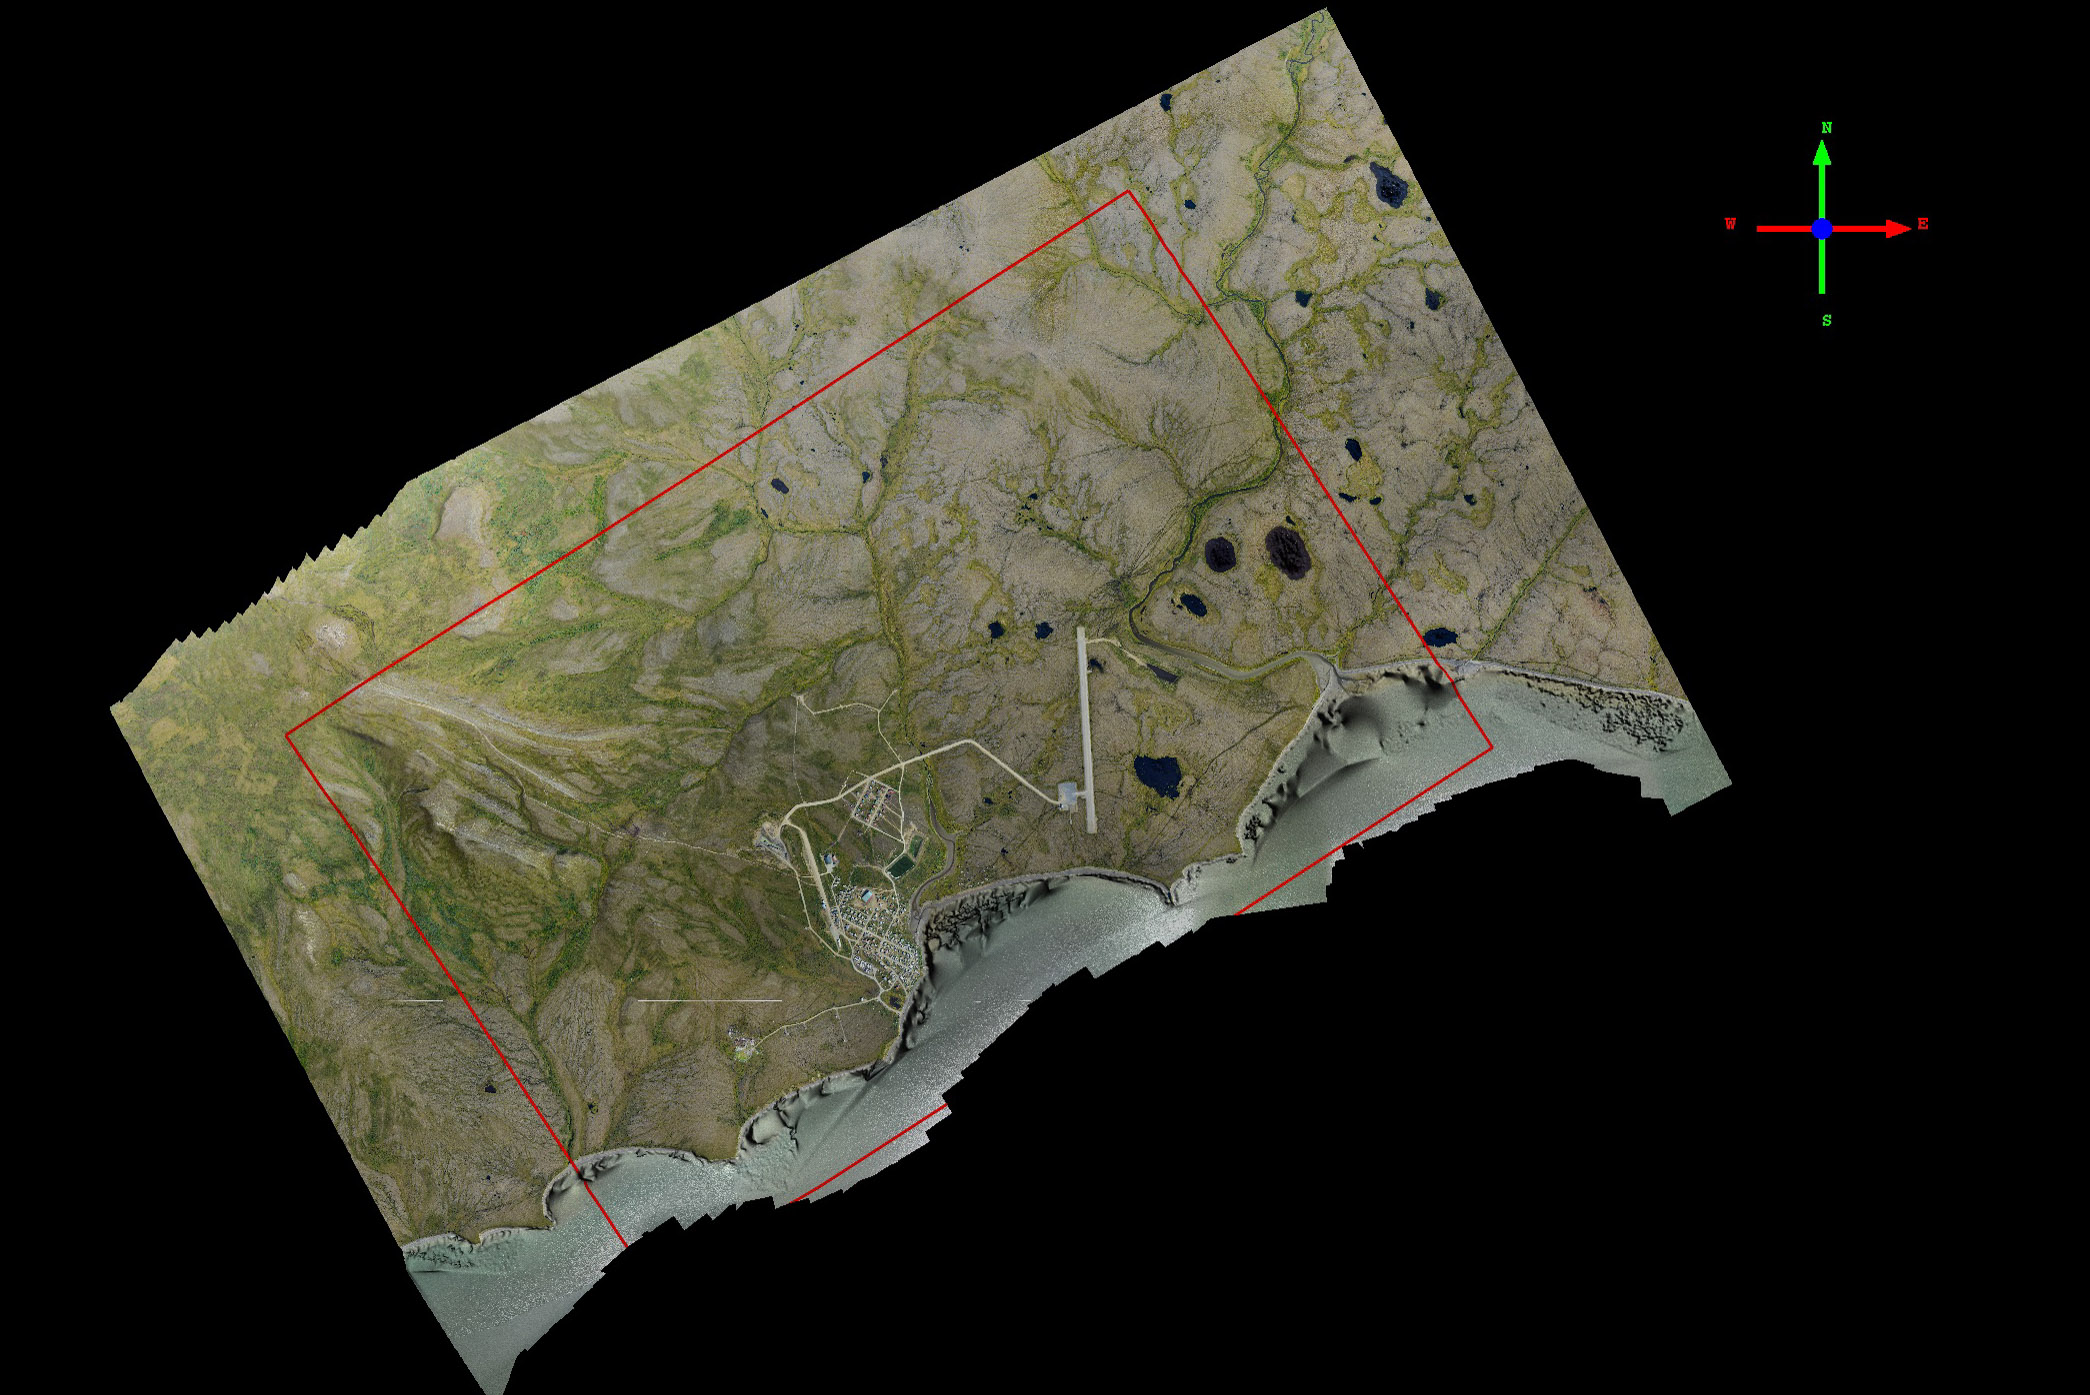
Even villages a mile inland are at risk from ocean flooding. Here you can see that the village of Kongiginak is built essentially on low-lying islands in the surround swamps that are tidally-affected. Mouse-over to see the fodar imagery overlain.
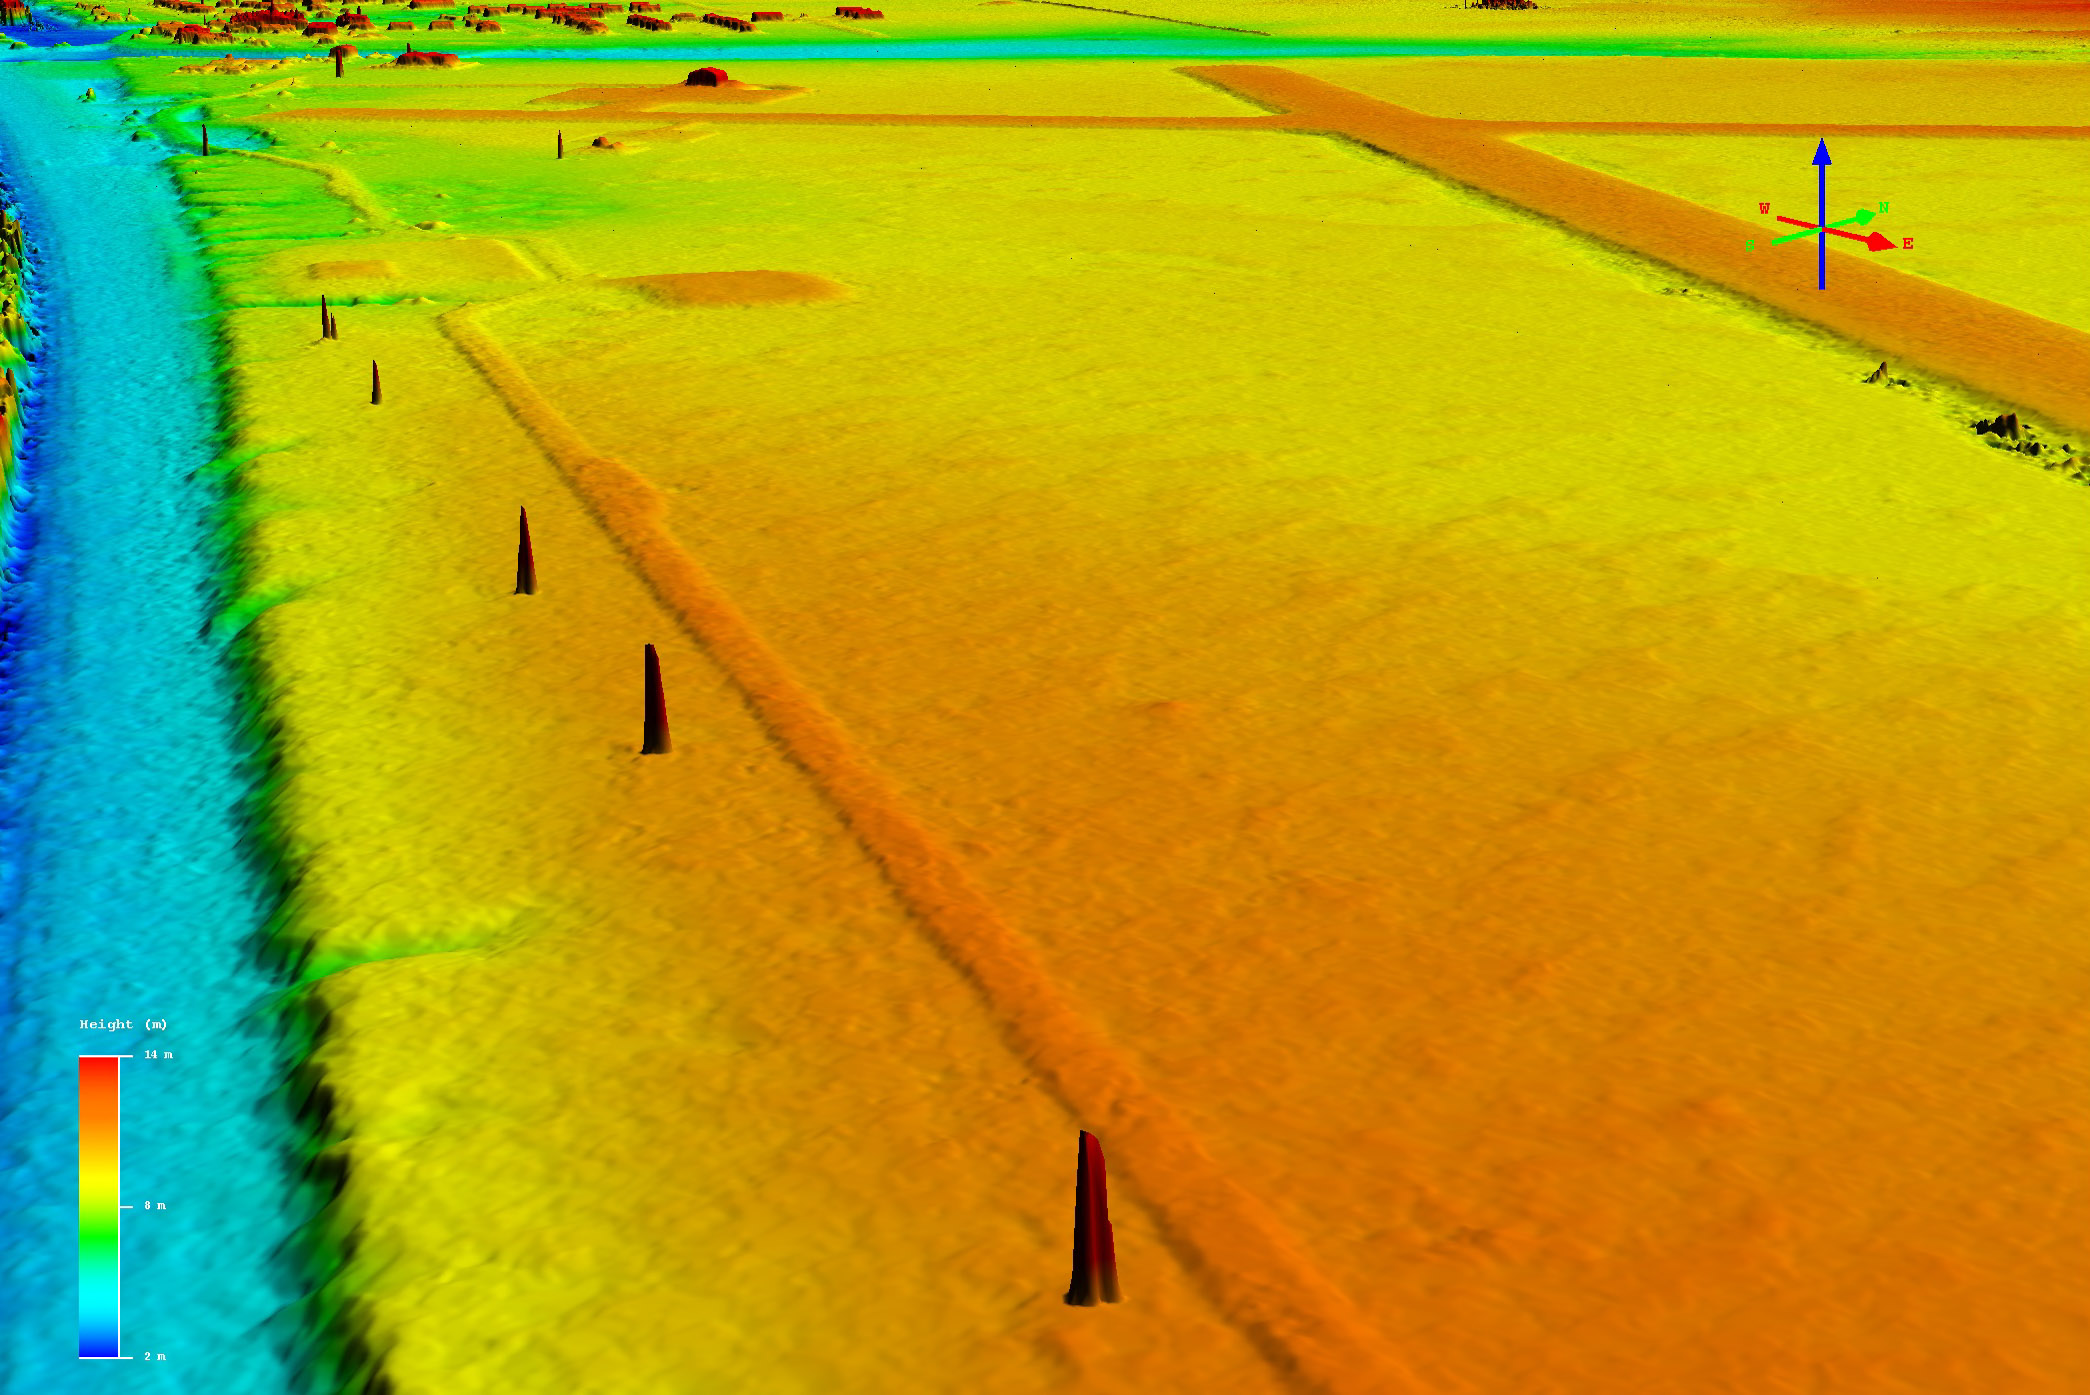
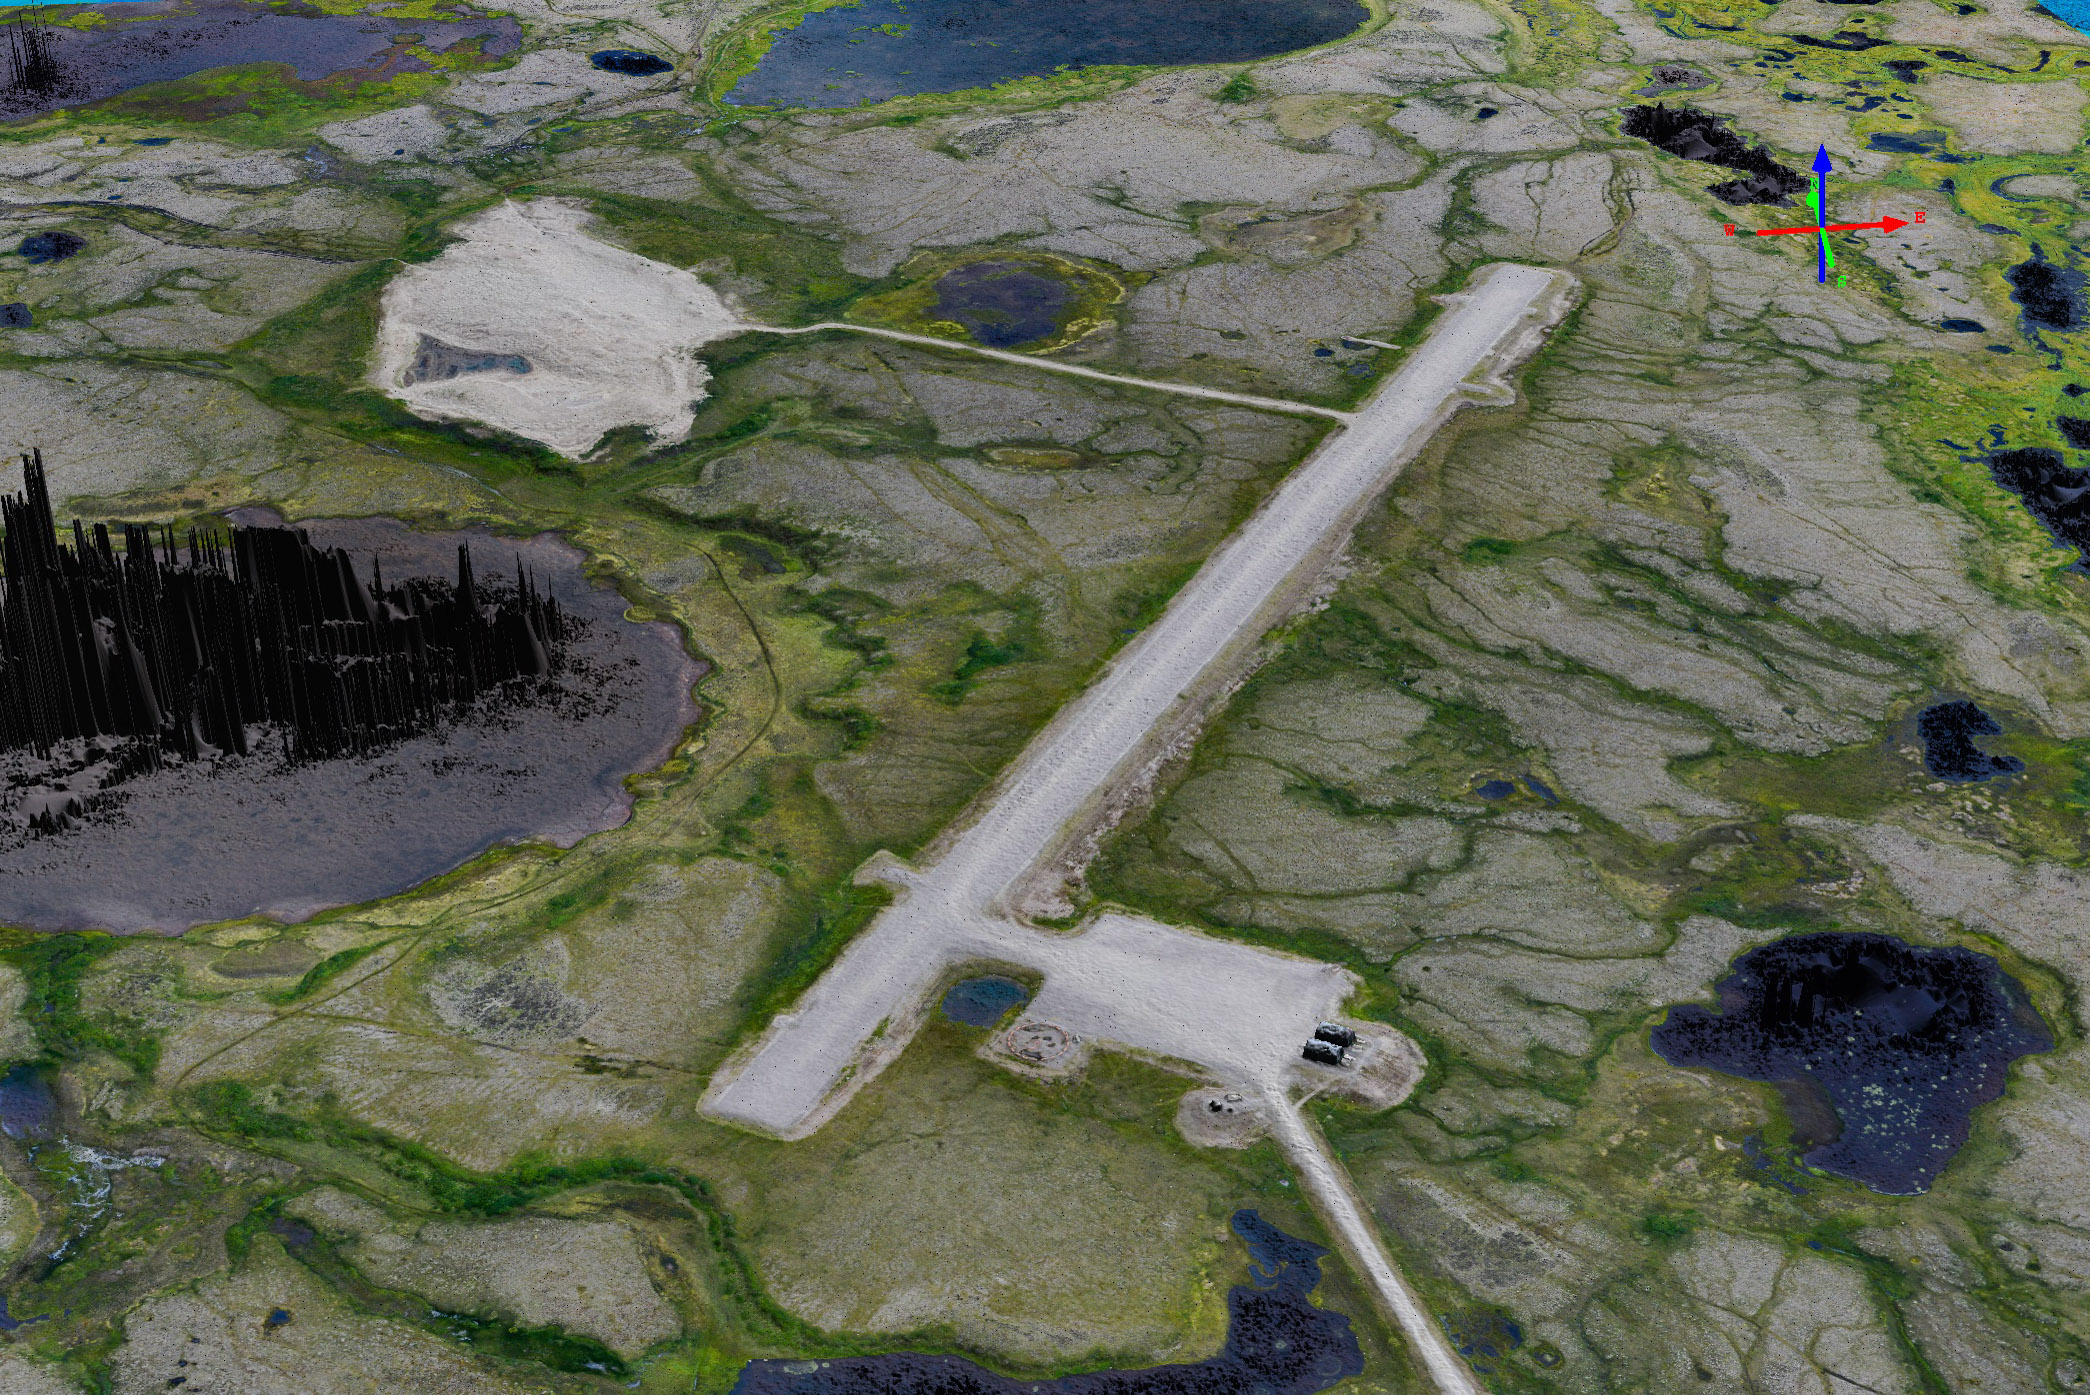
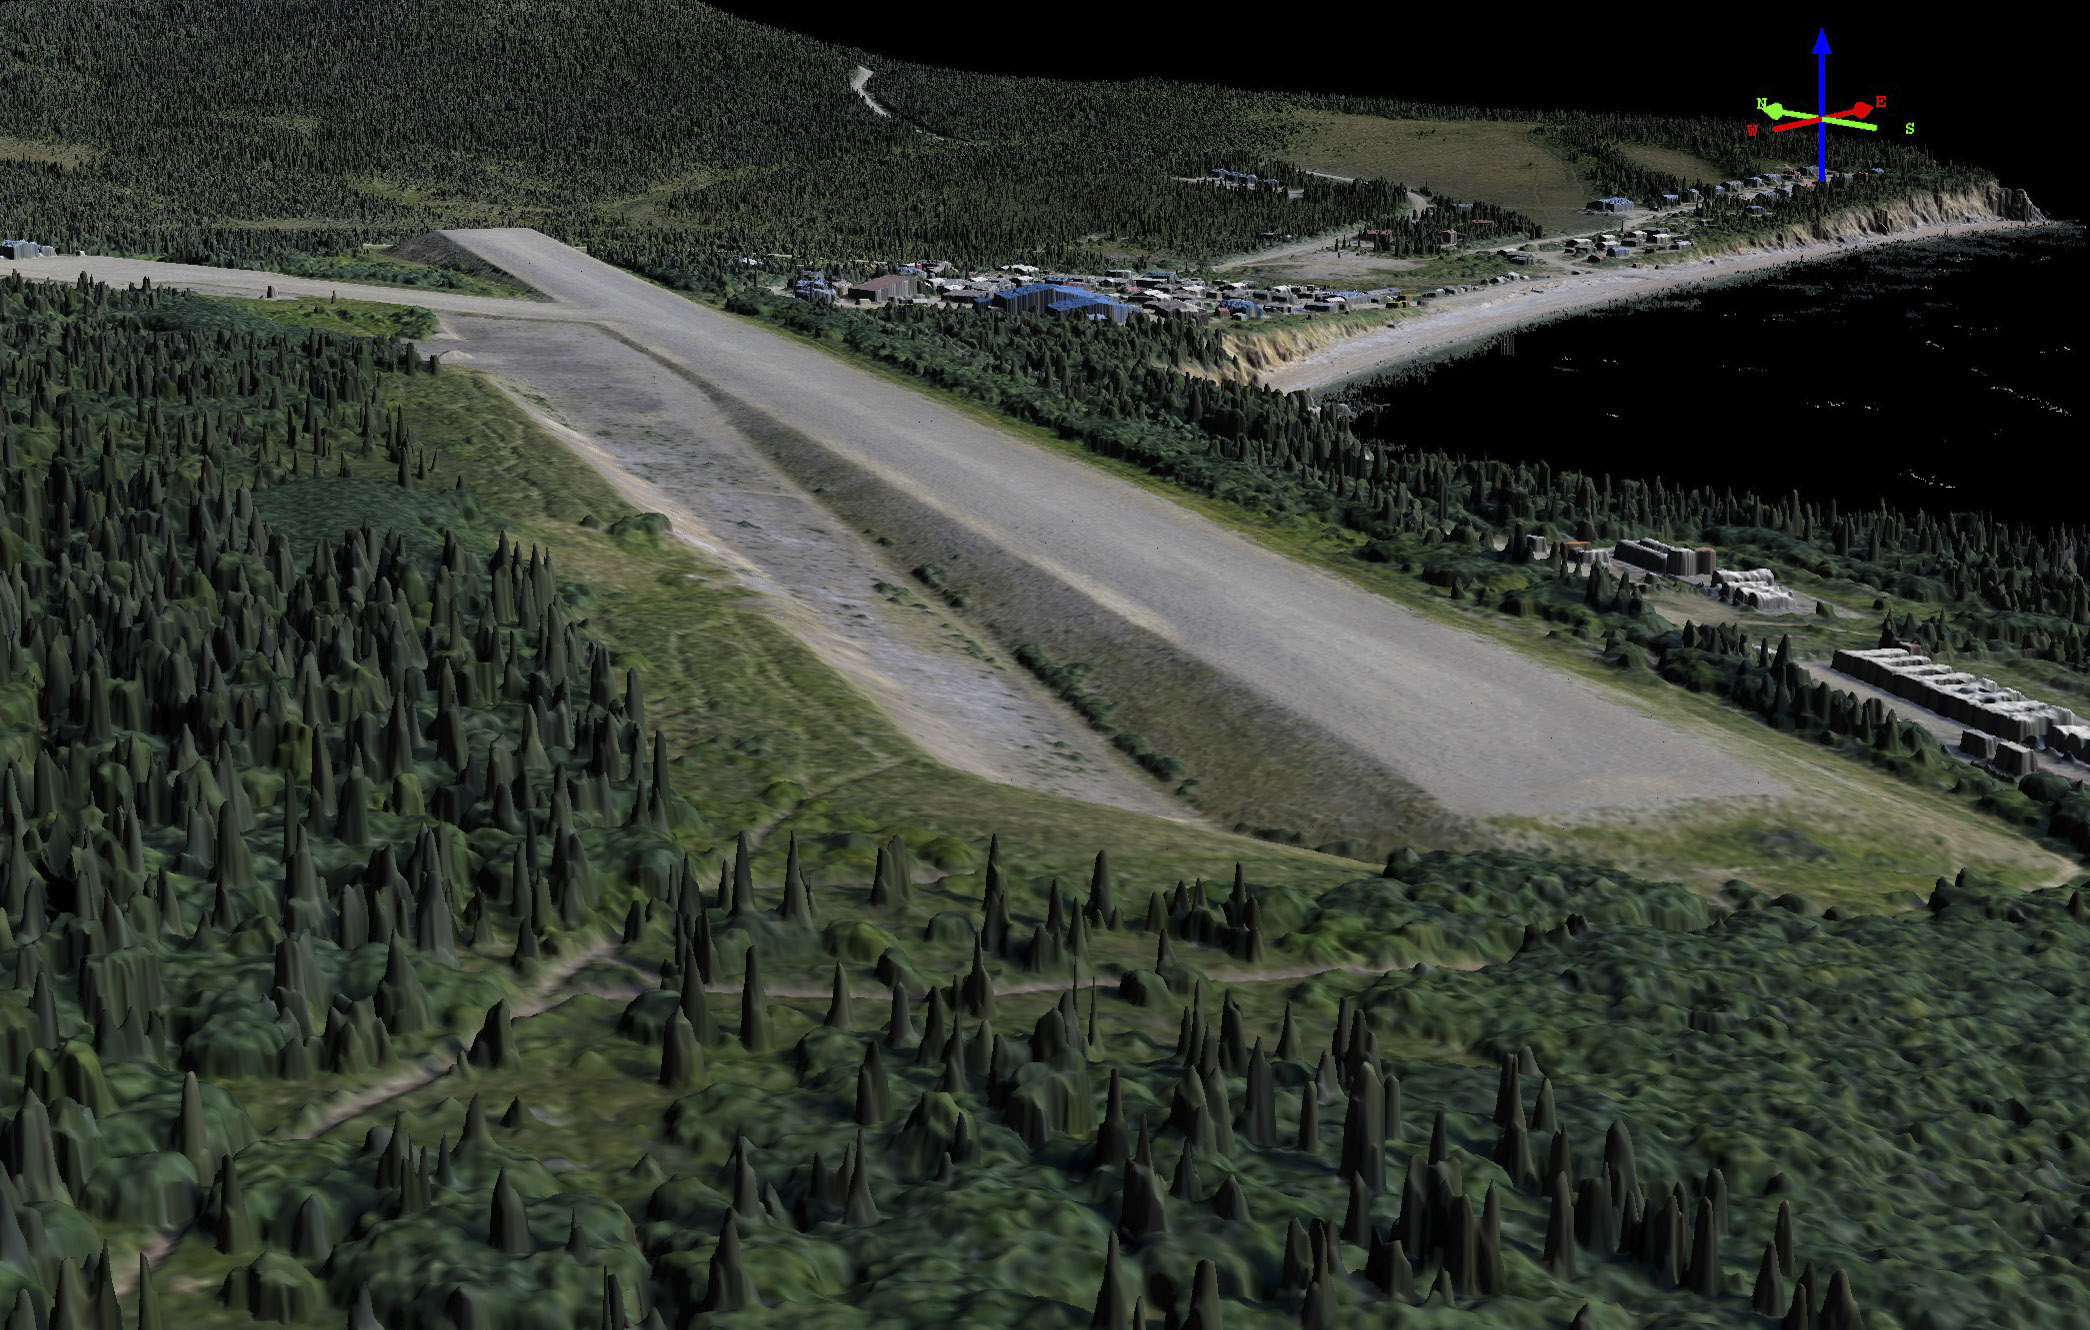
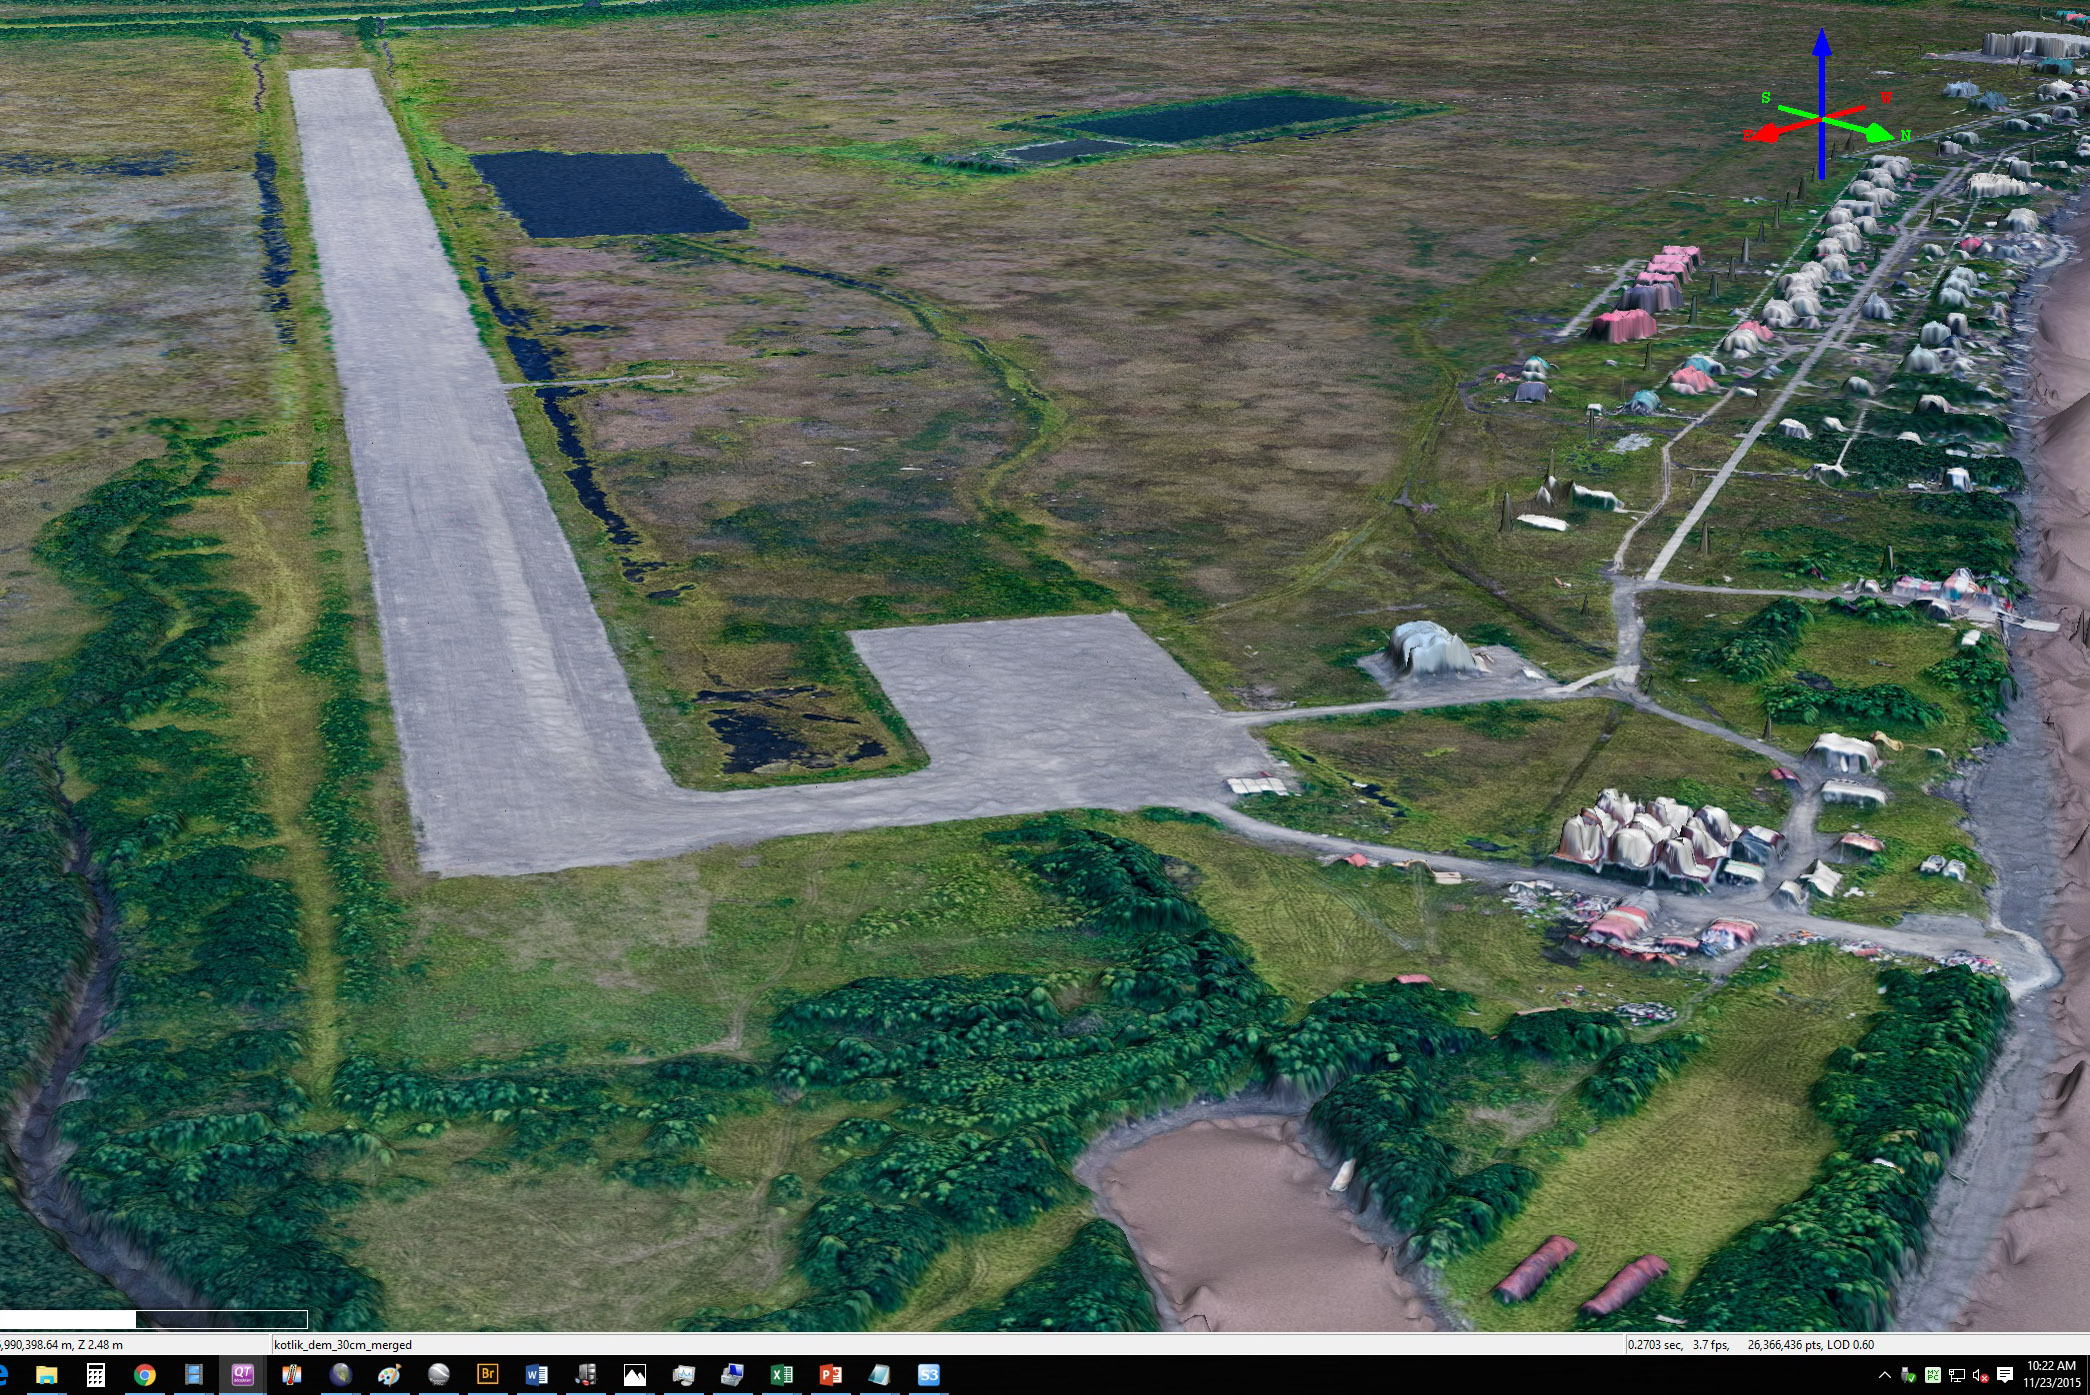
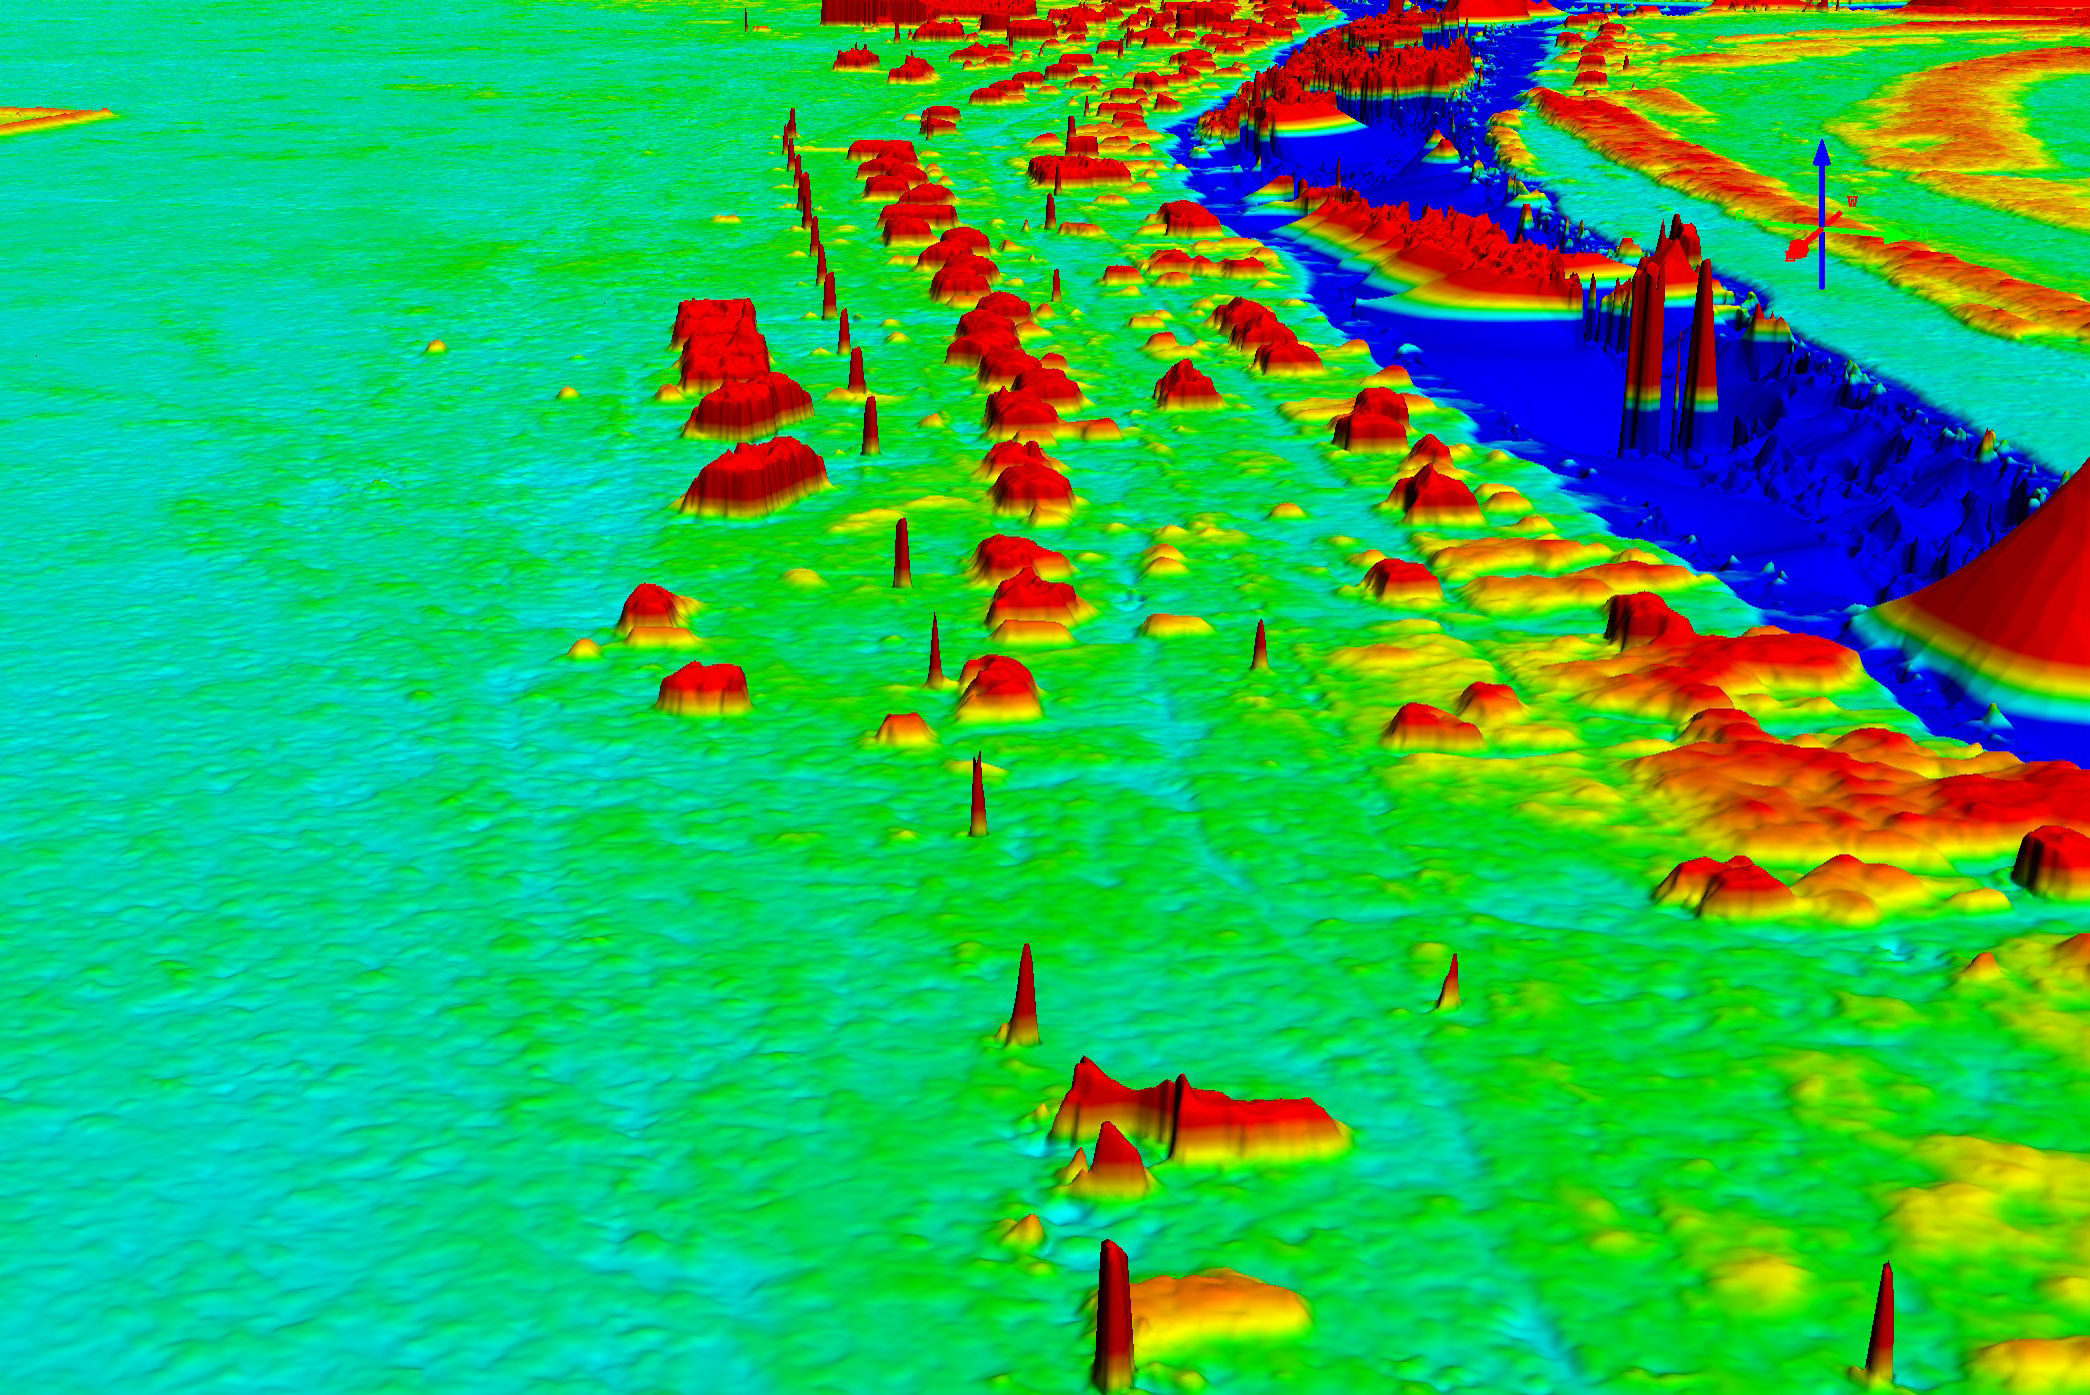
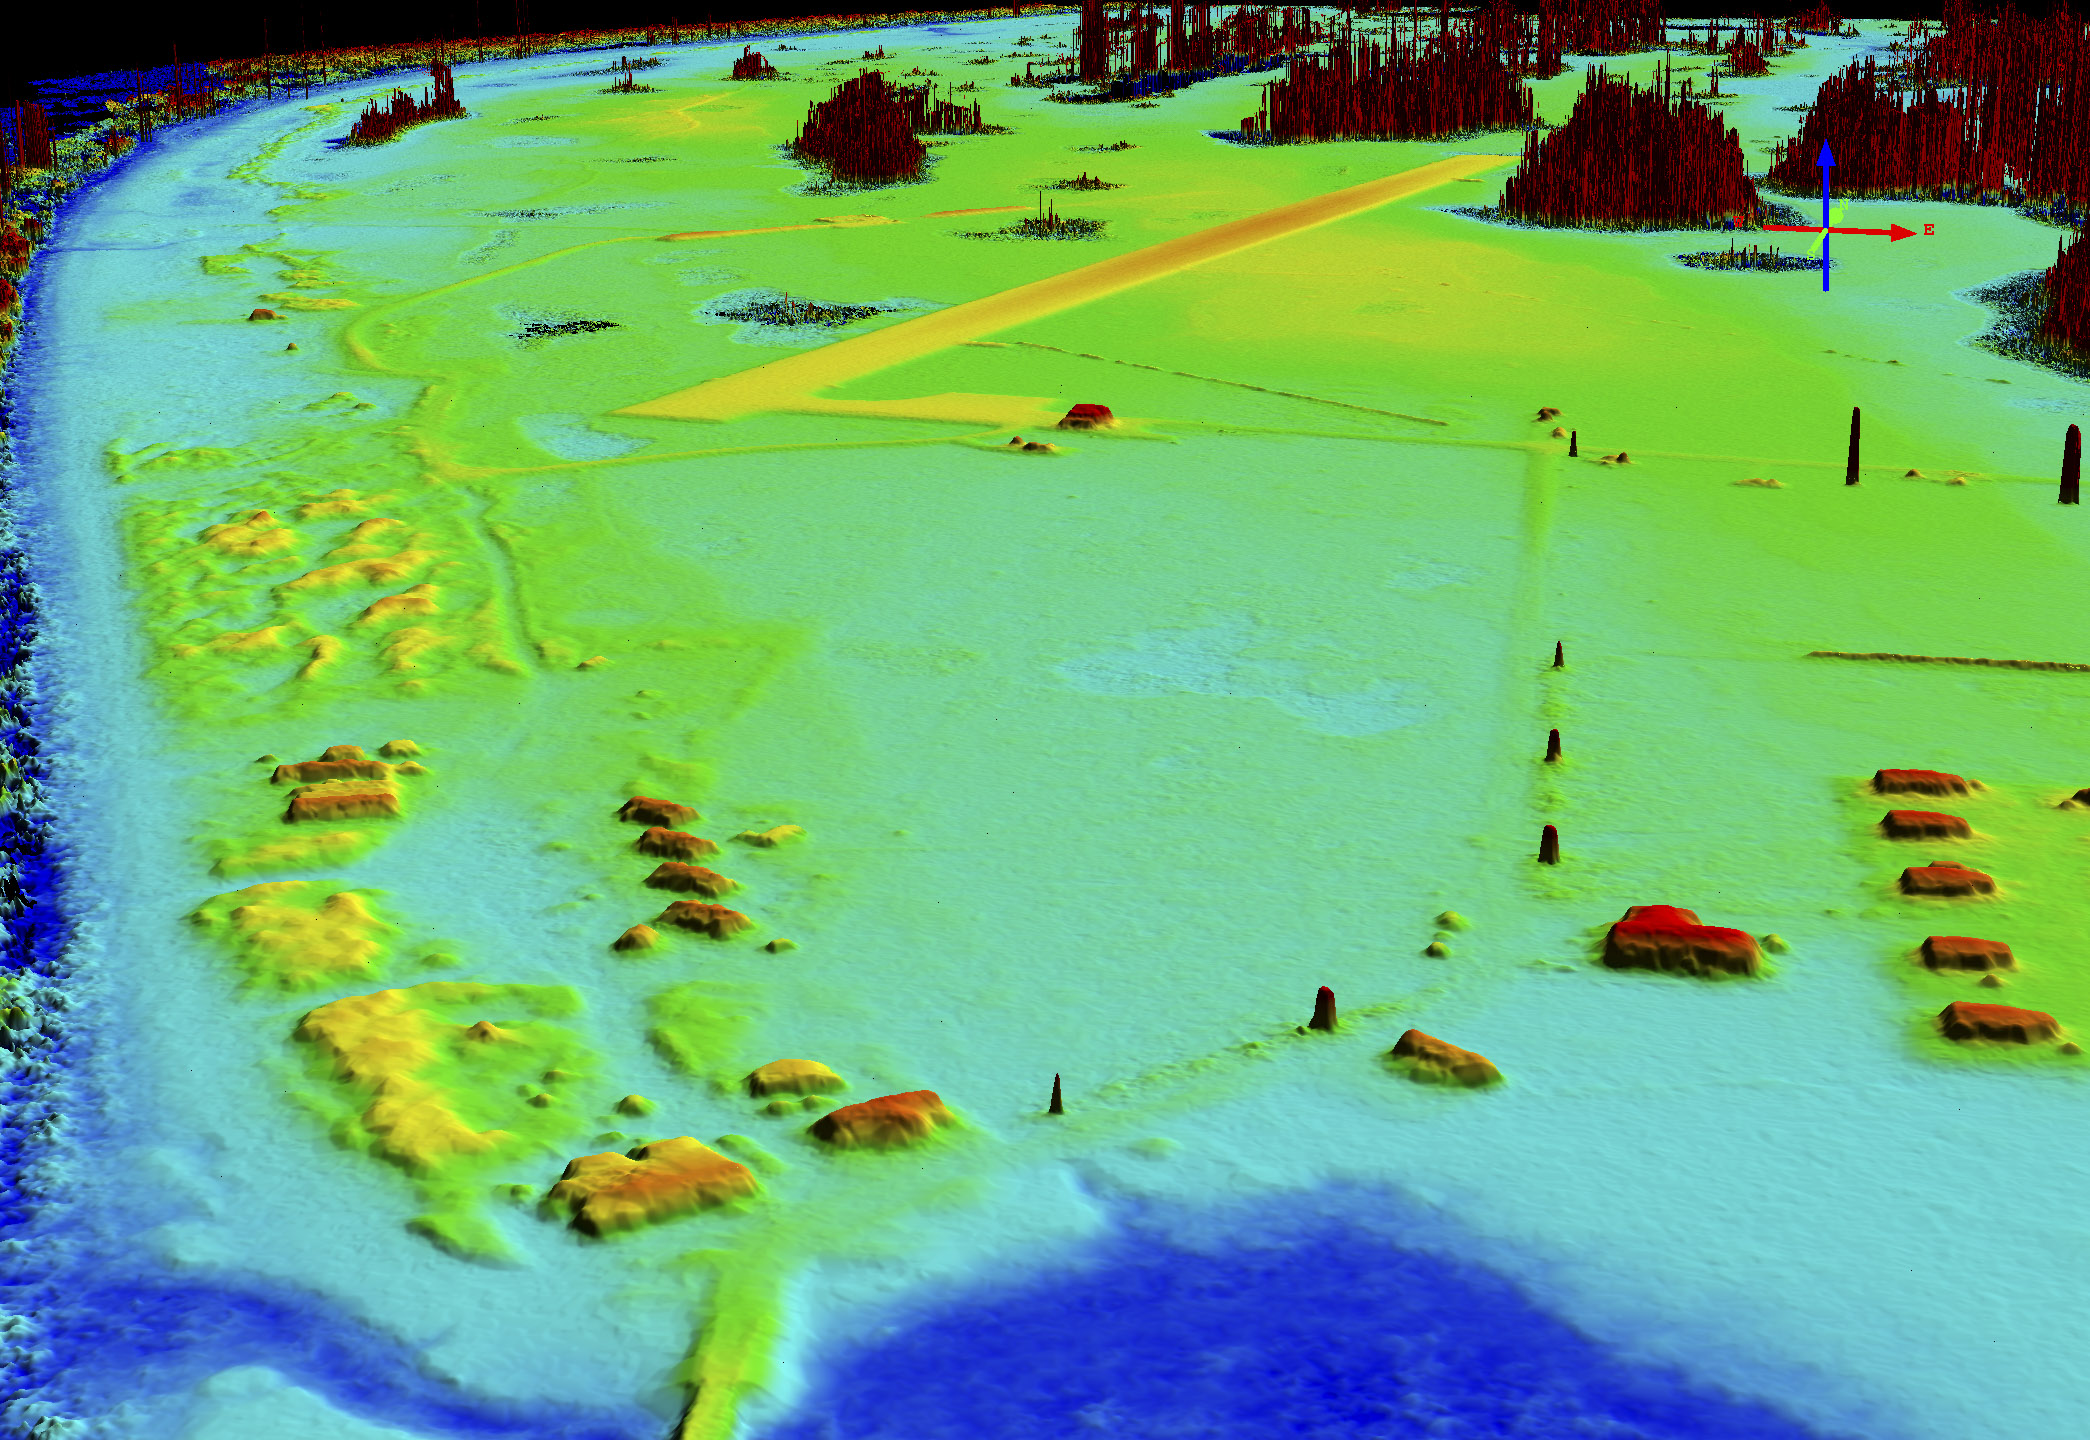
Here is the runway at Emmonak. These fodar data are useful not only for assessing flooding risk, but for infrastructure measurement as well. Here you can see the crown on the runway (yellow), which is less than 20 cm in height. You can also see the topography of boats and planes.
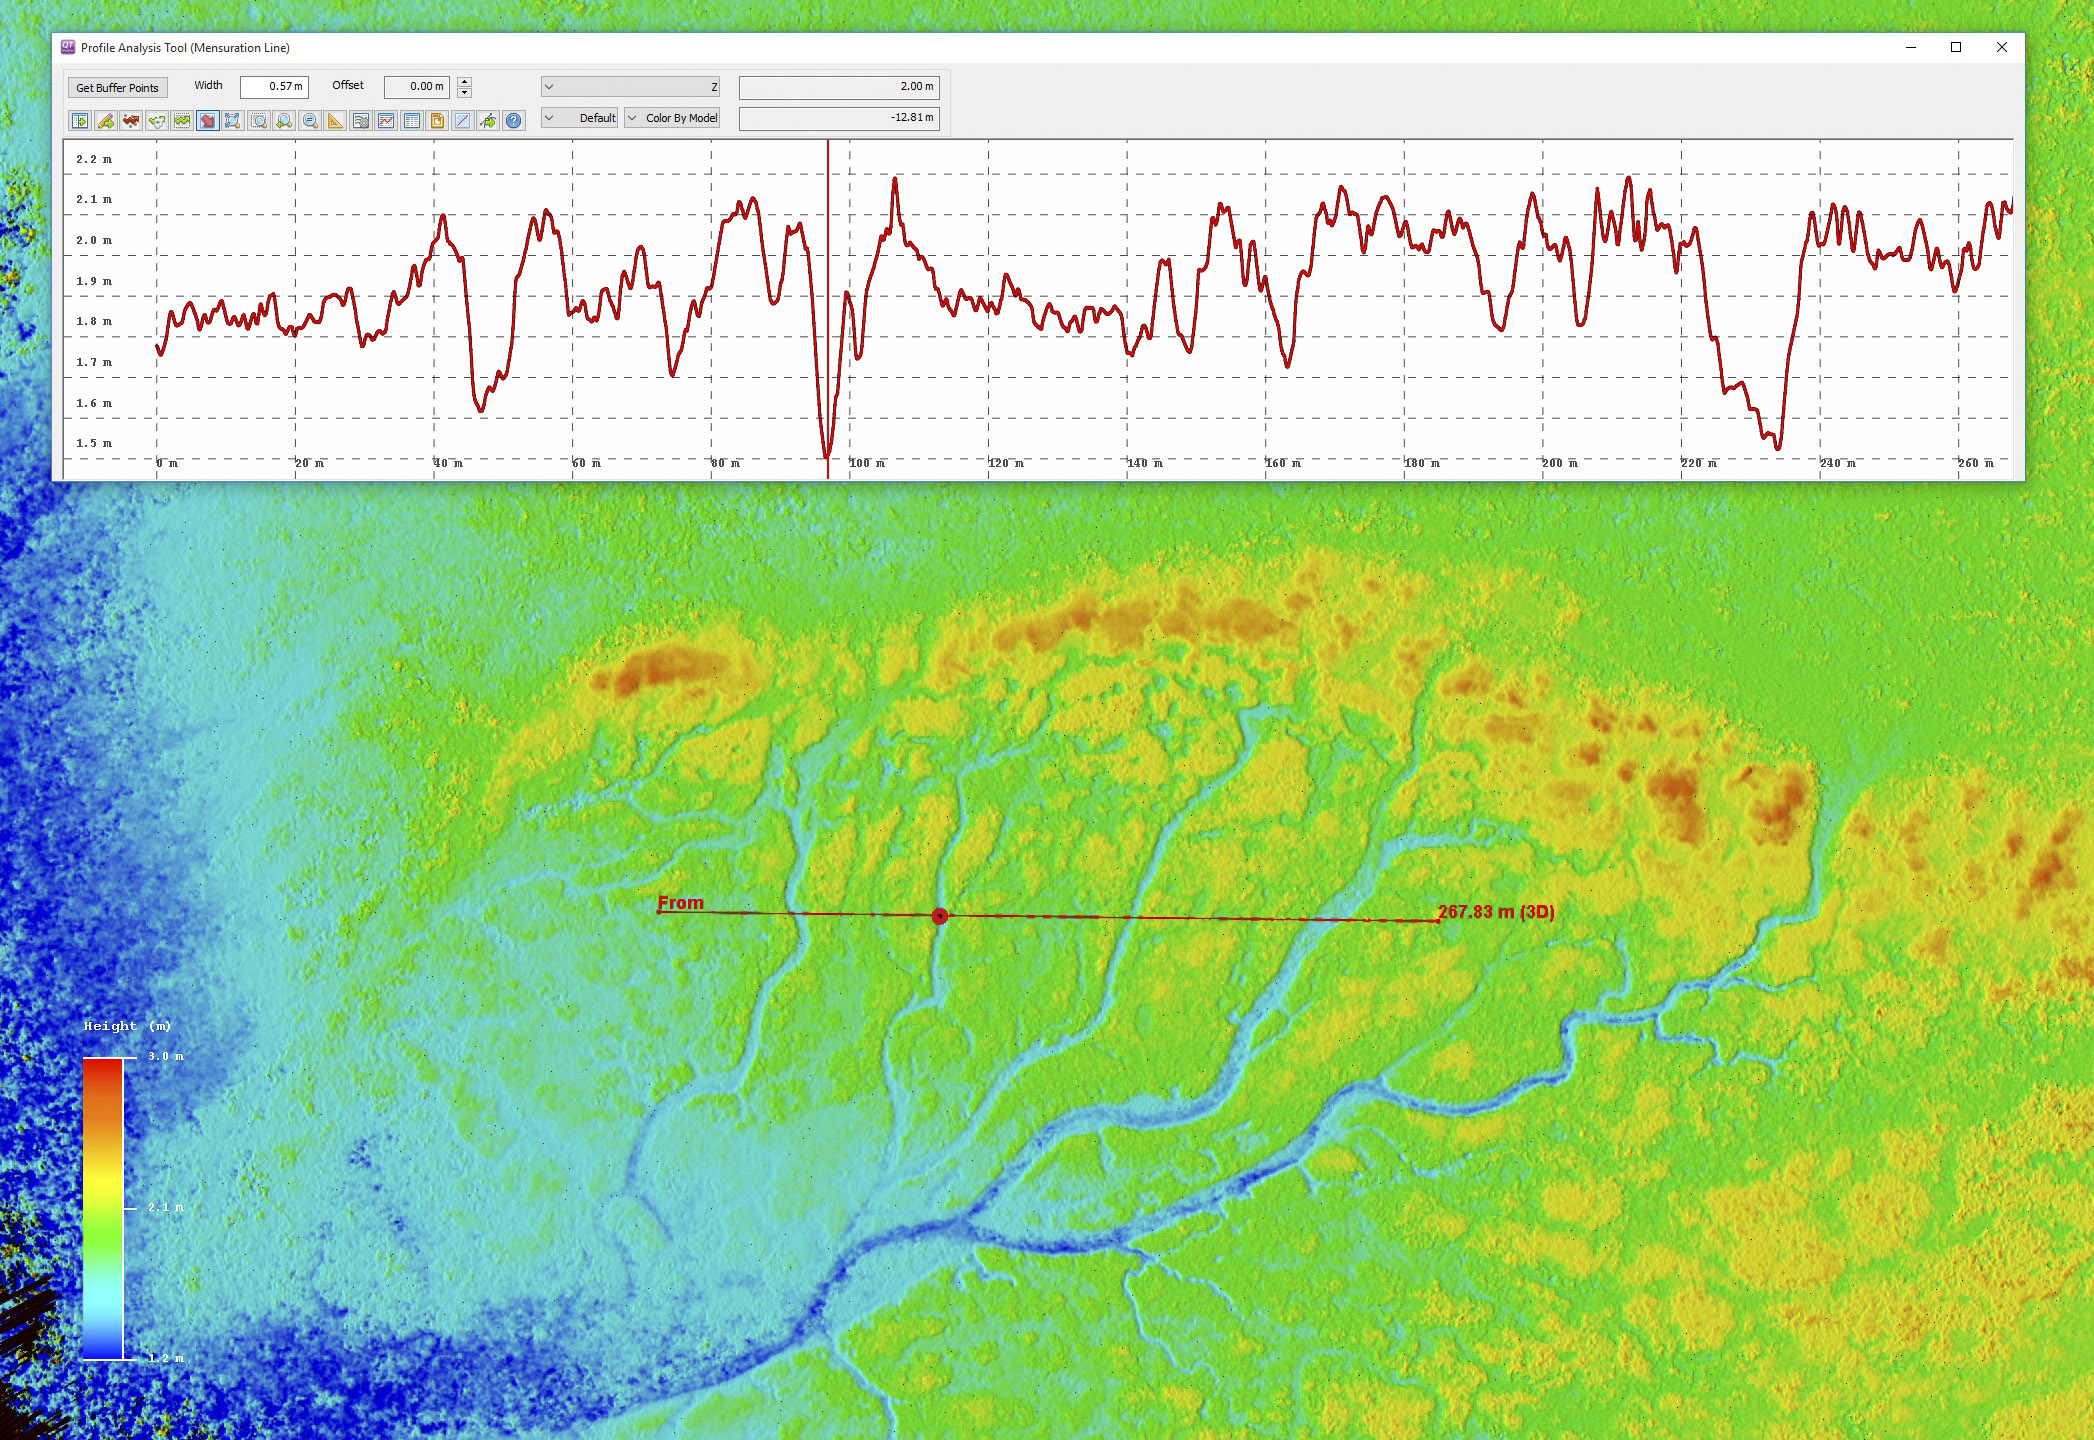
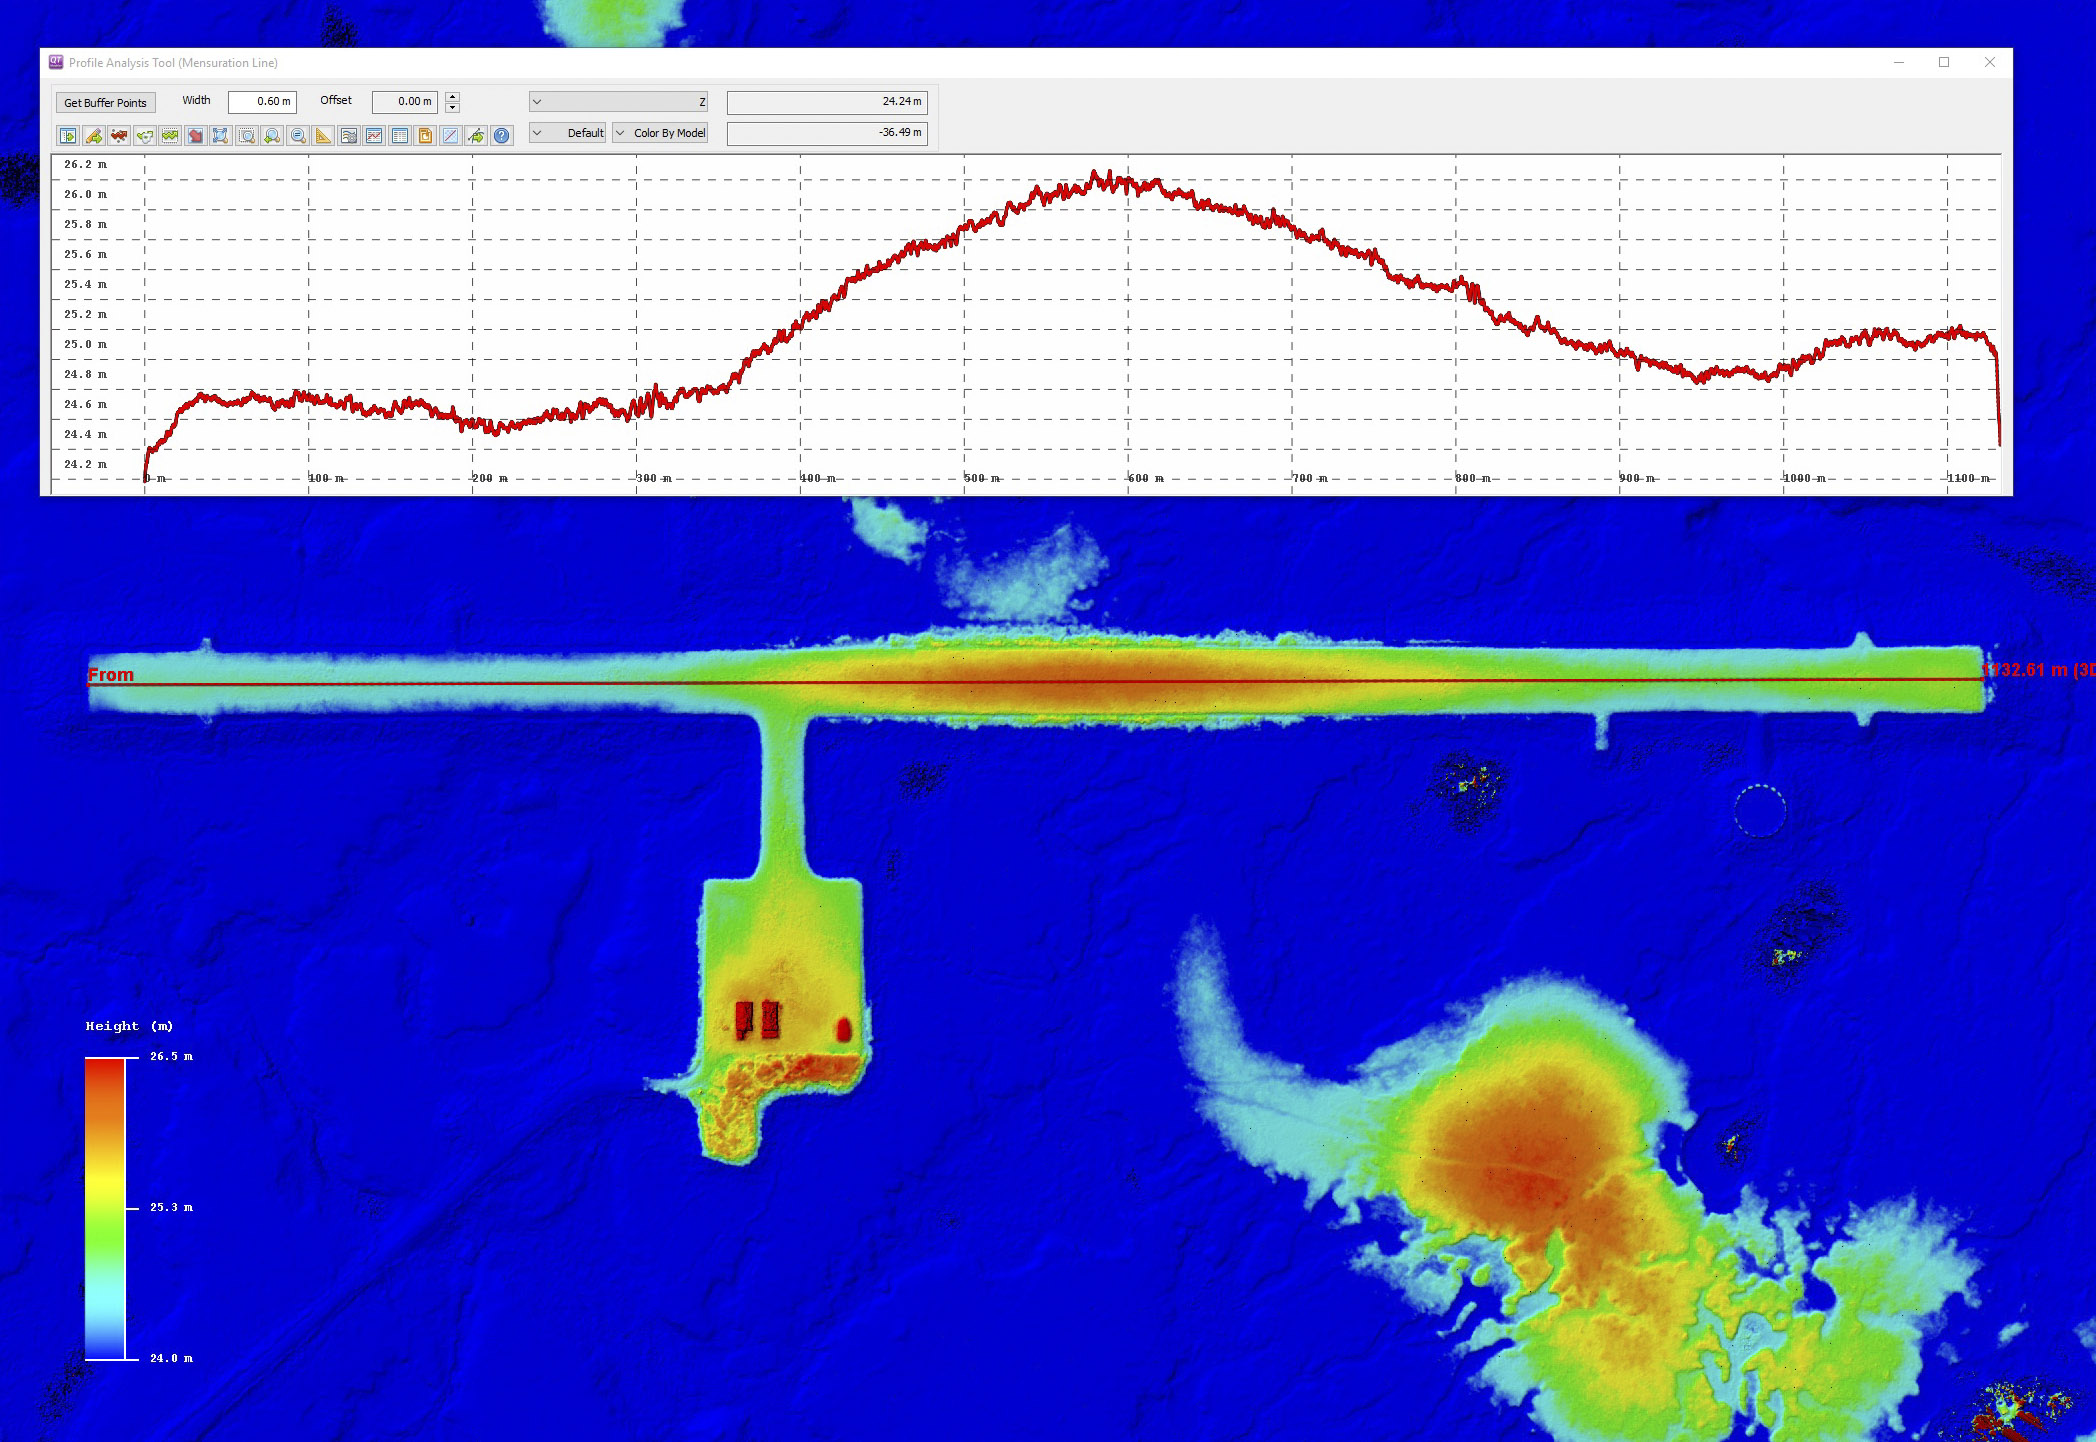
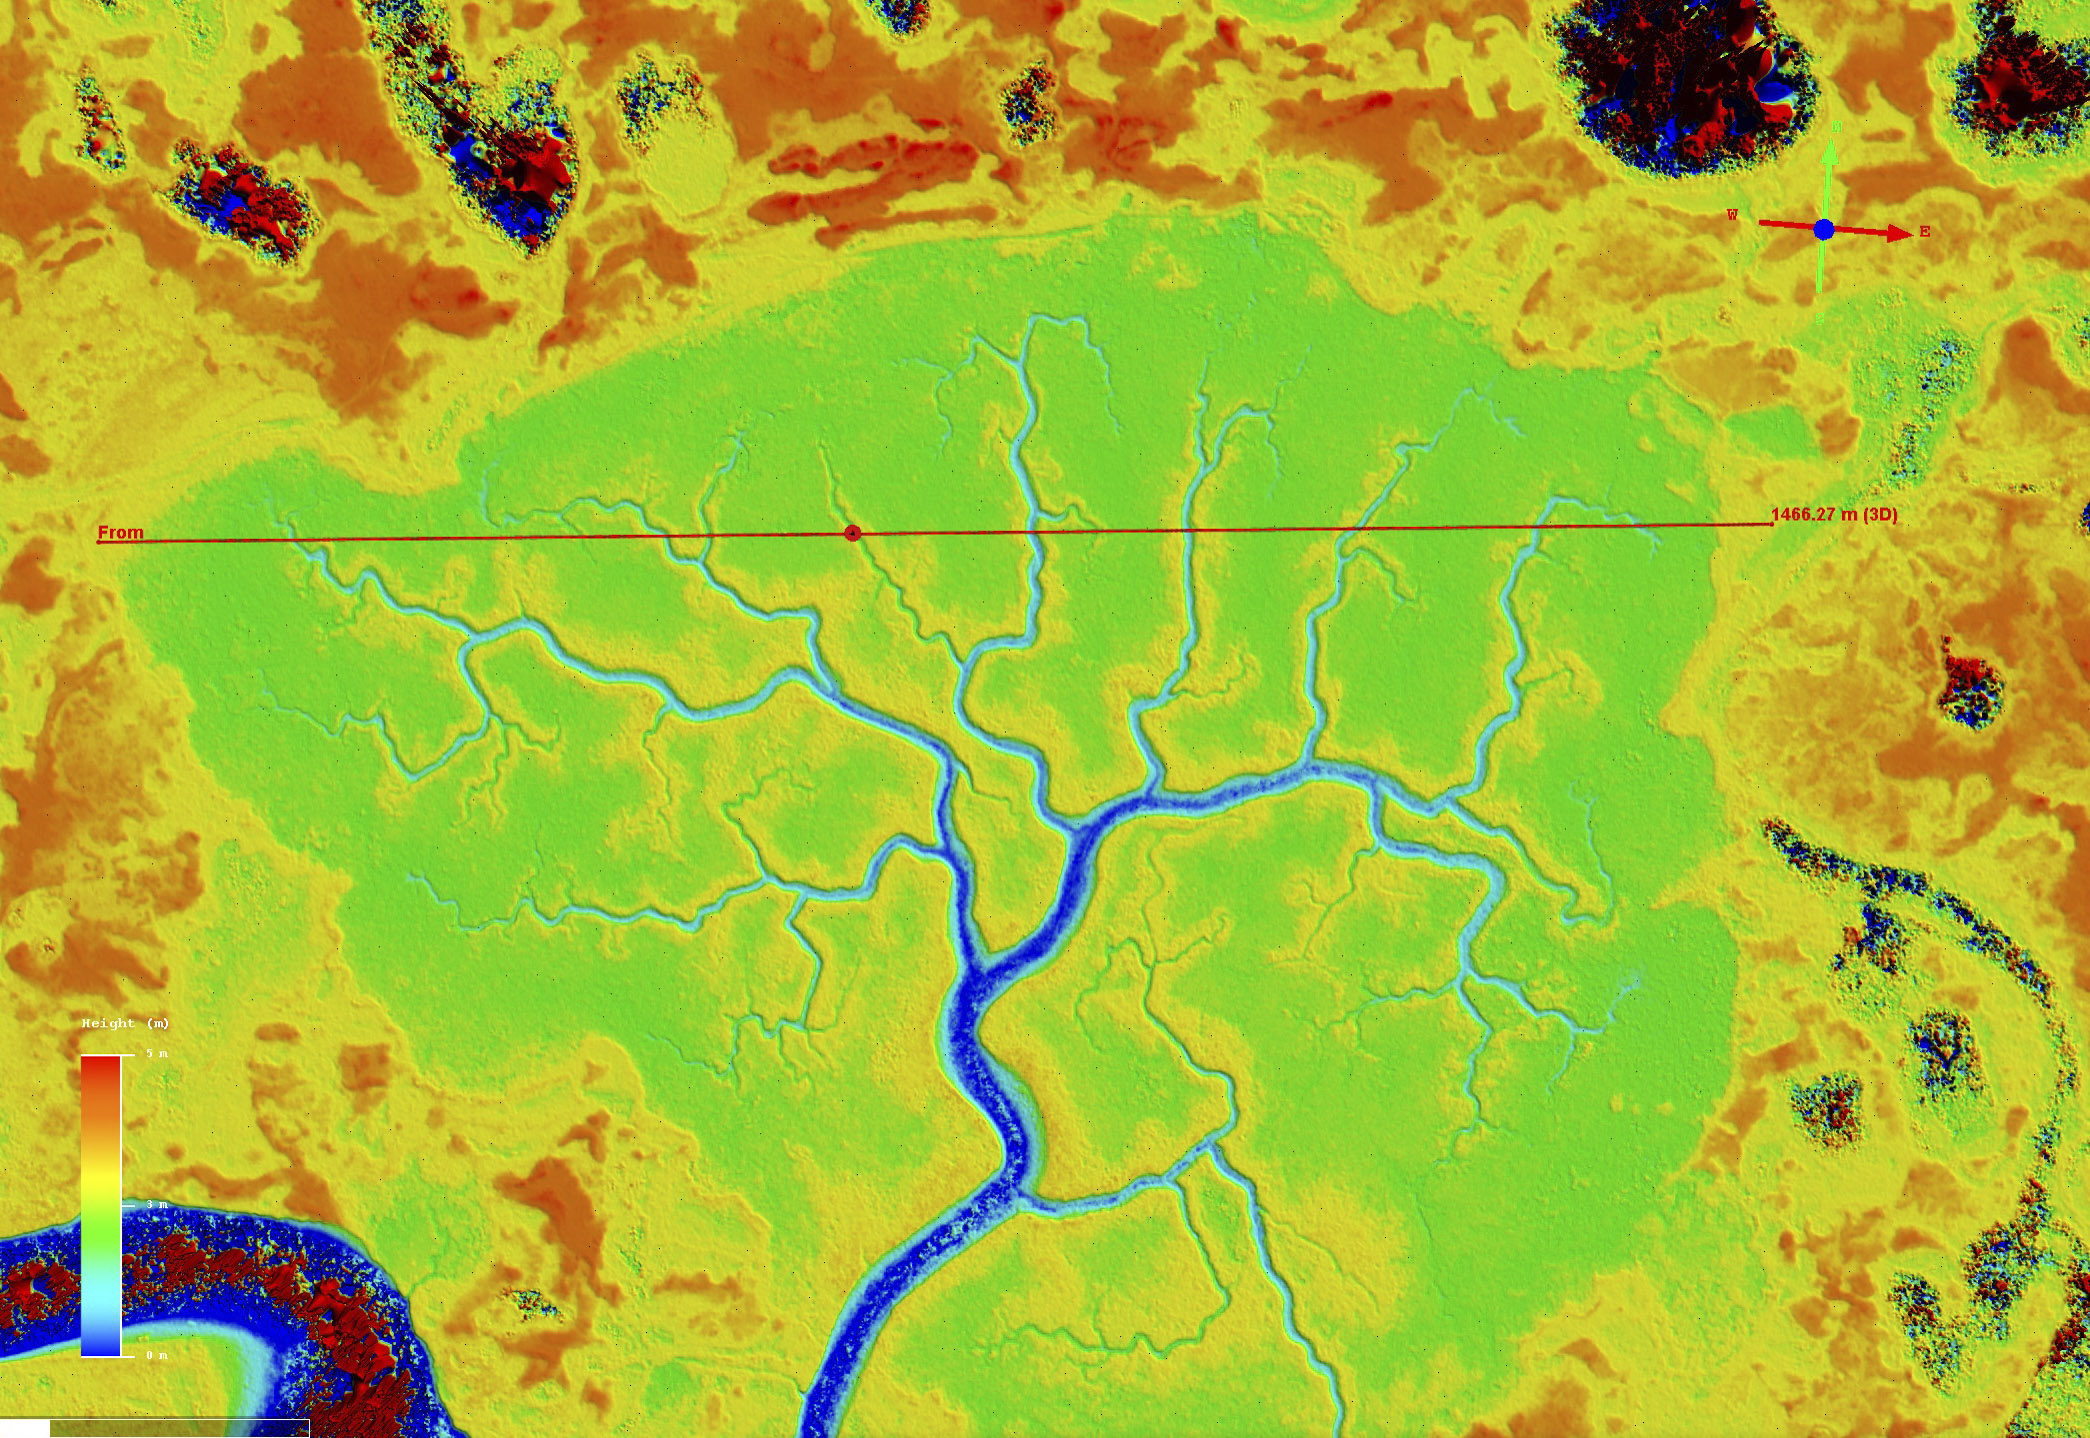
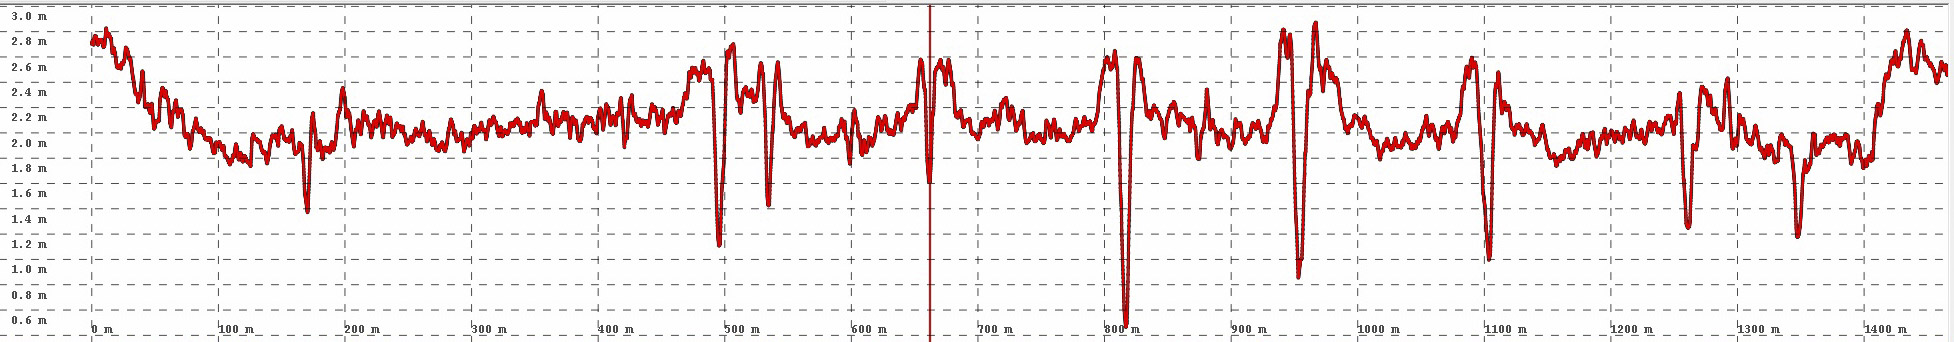
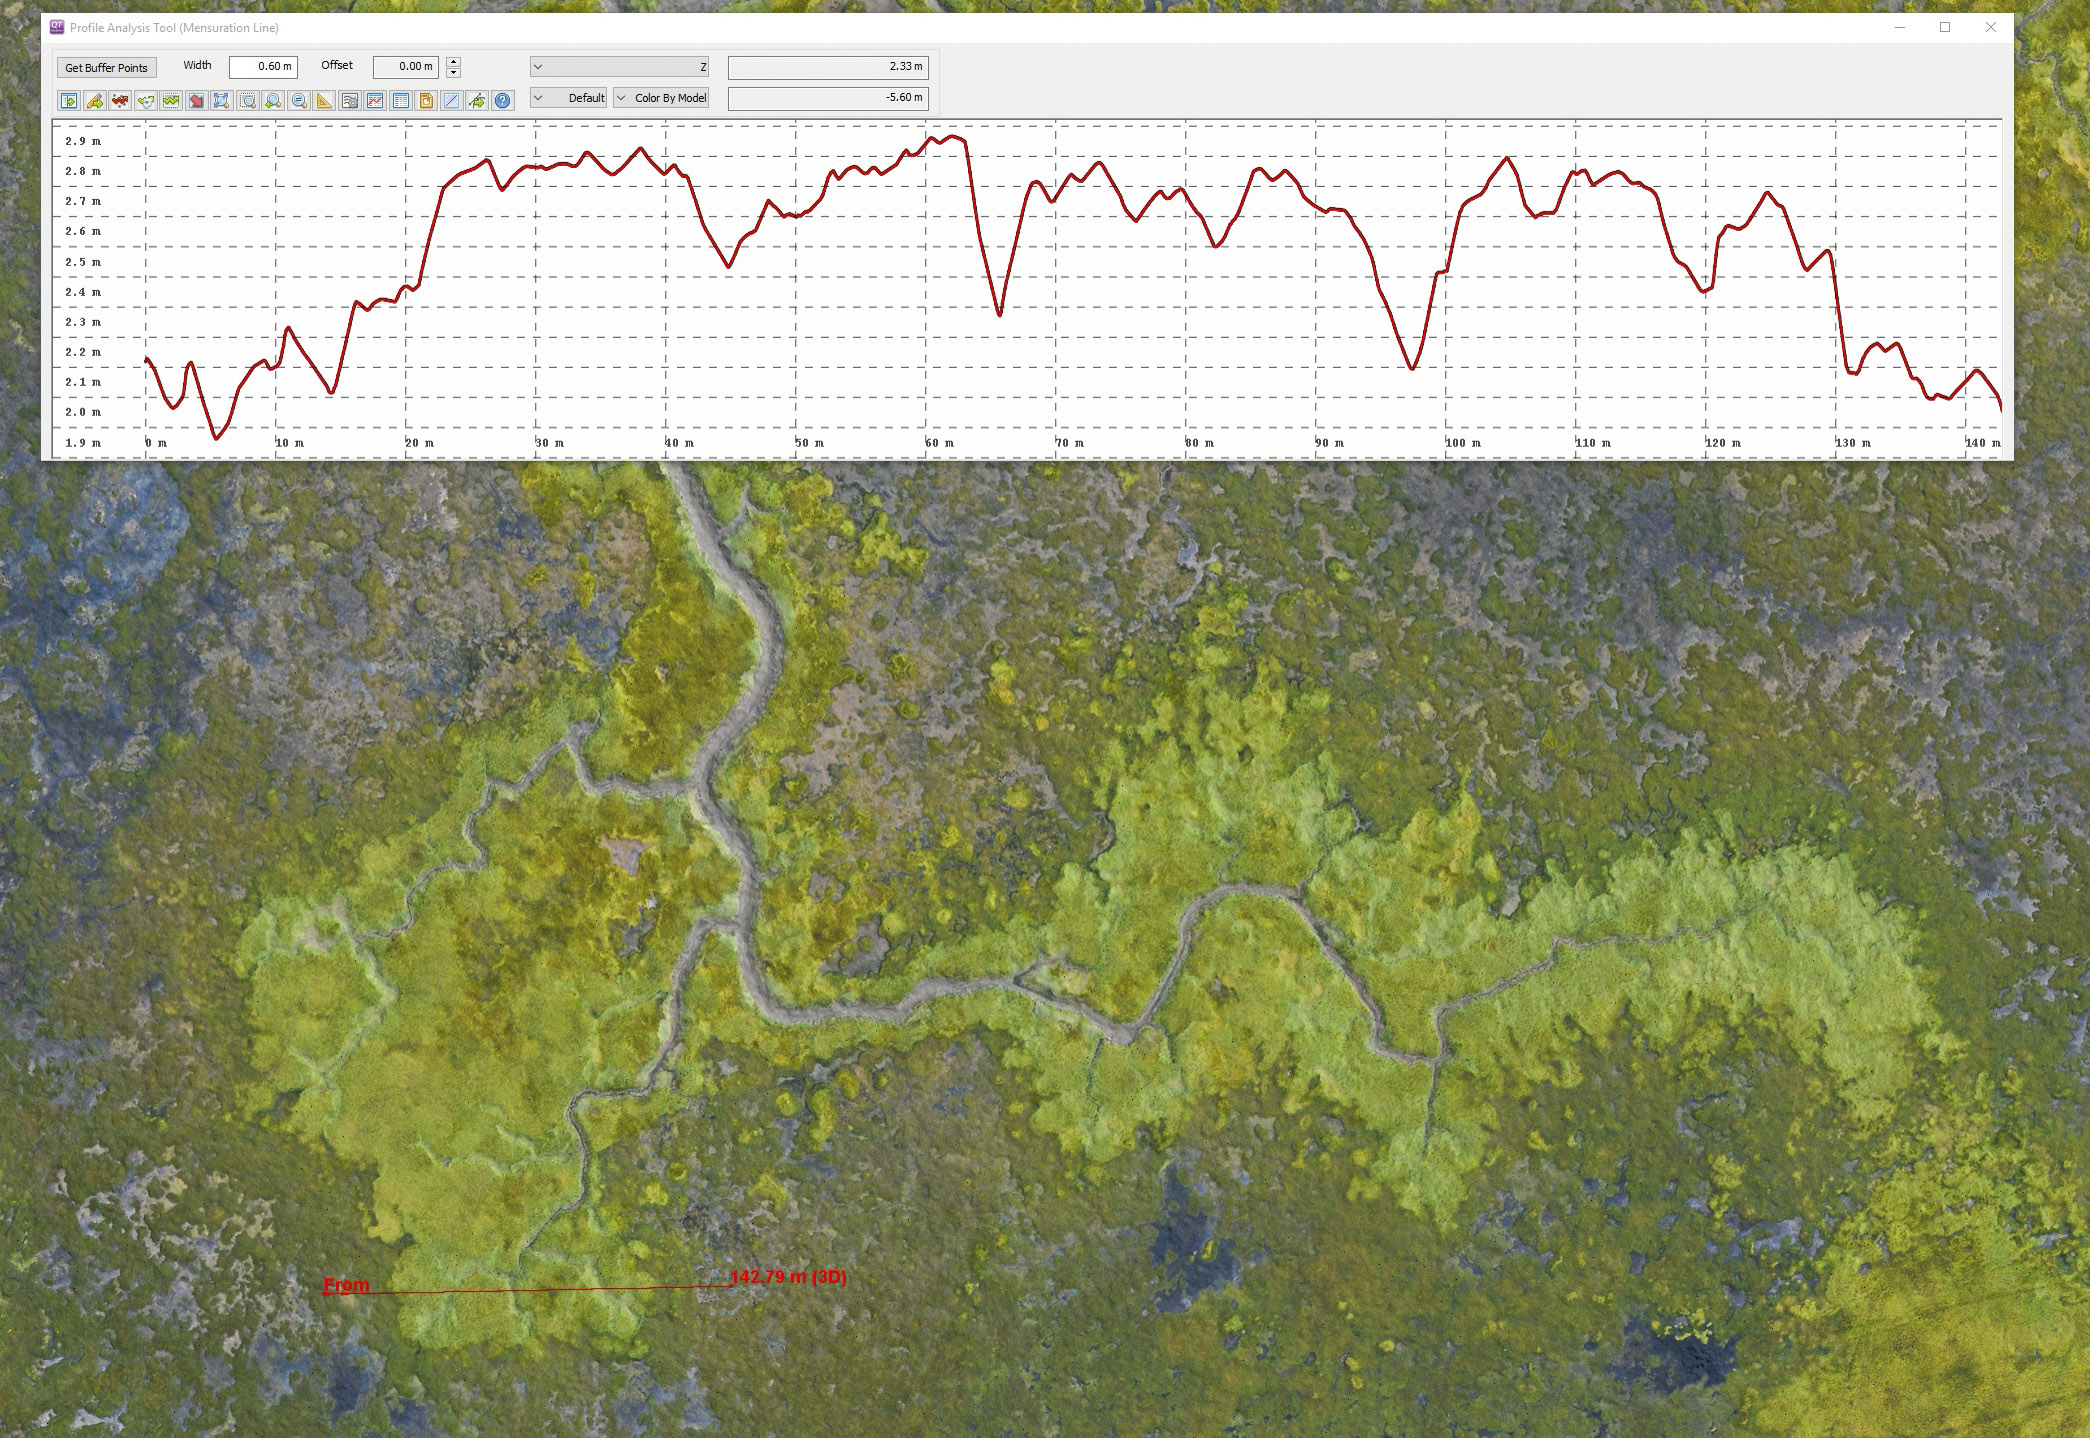
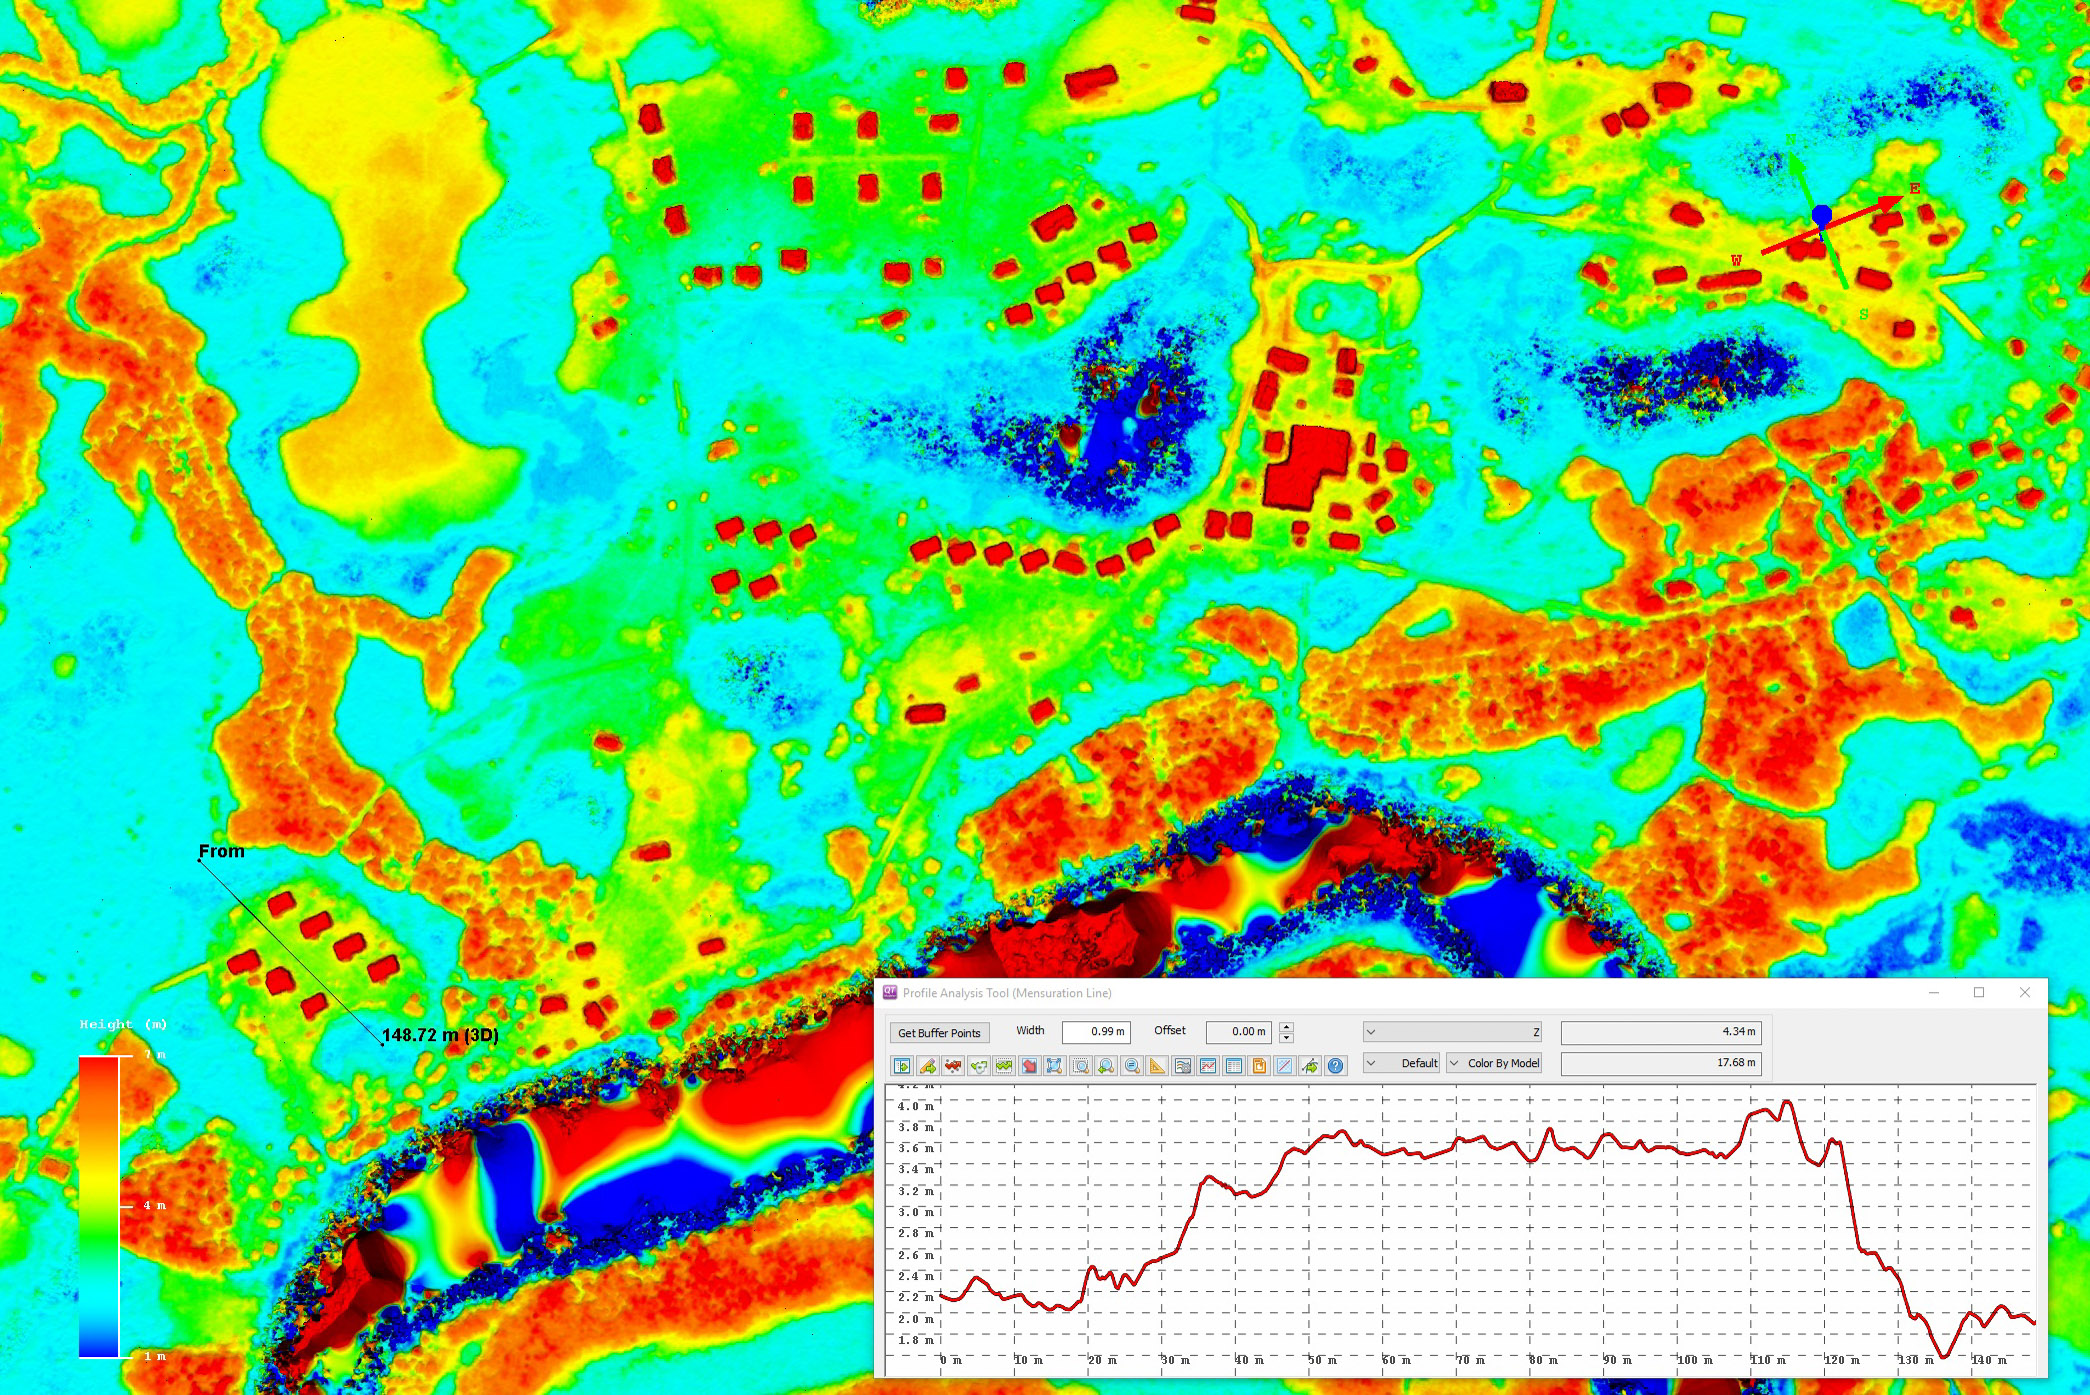
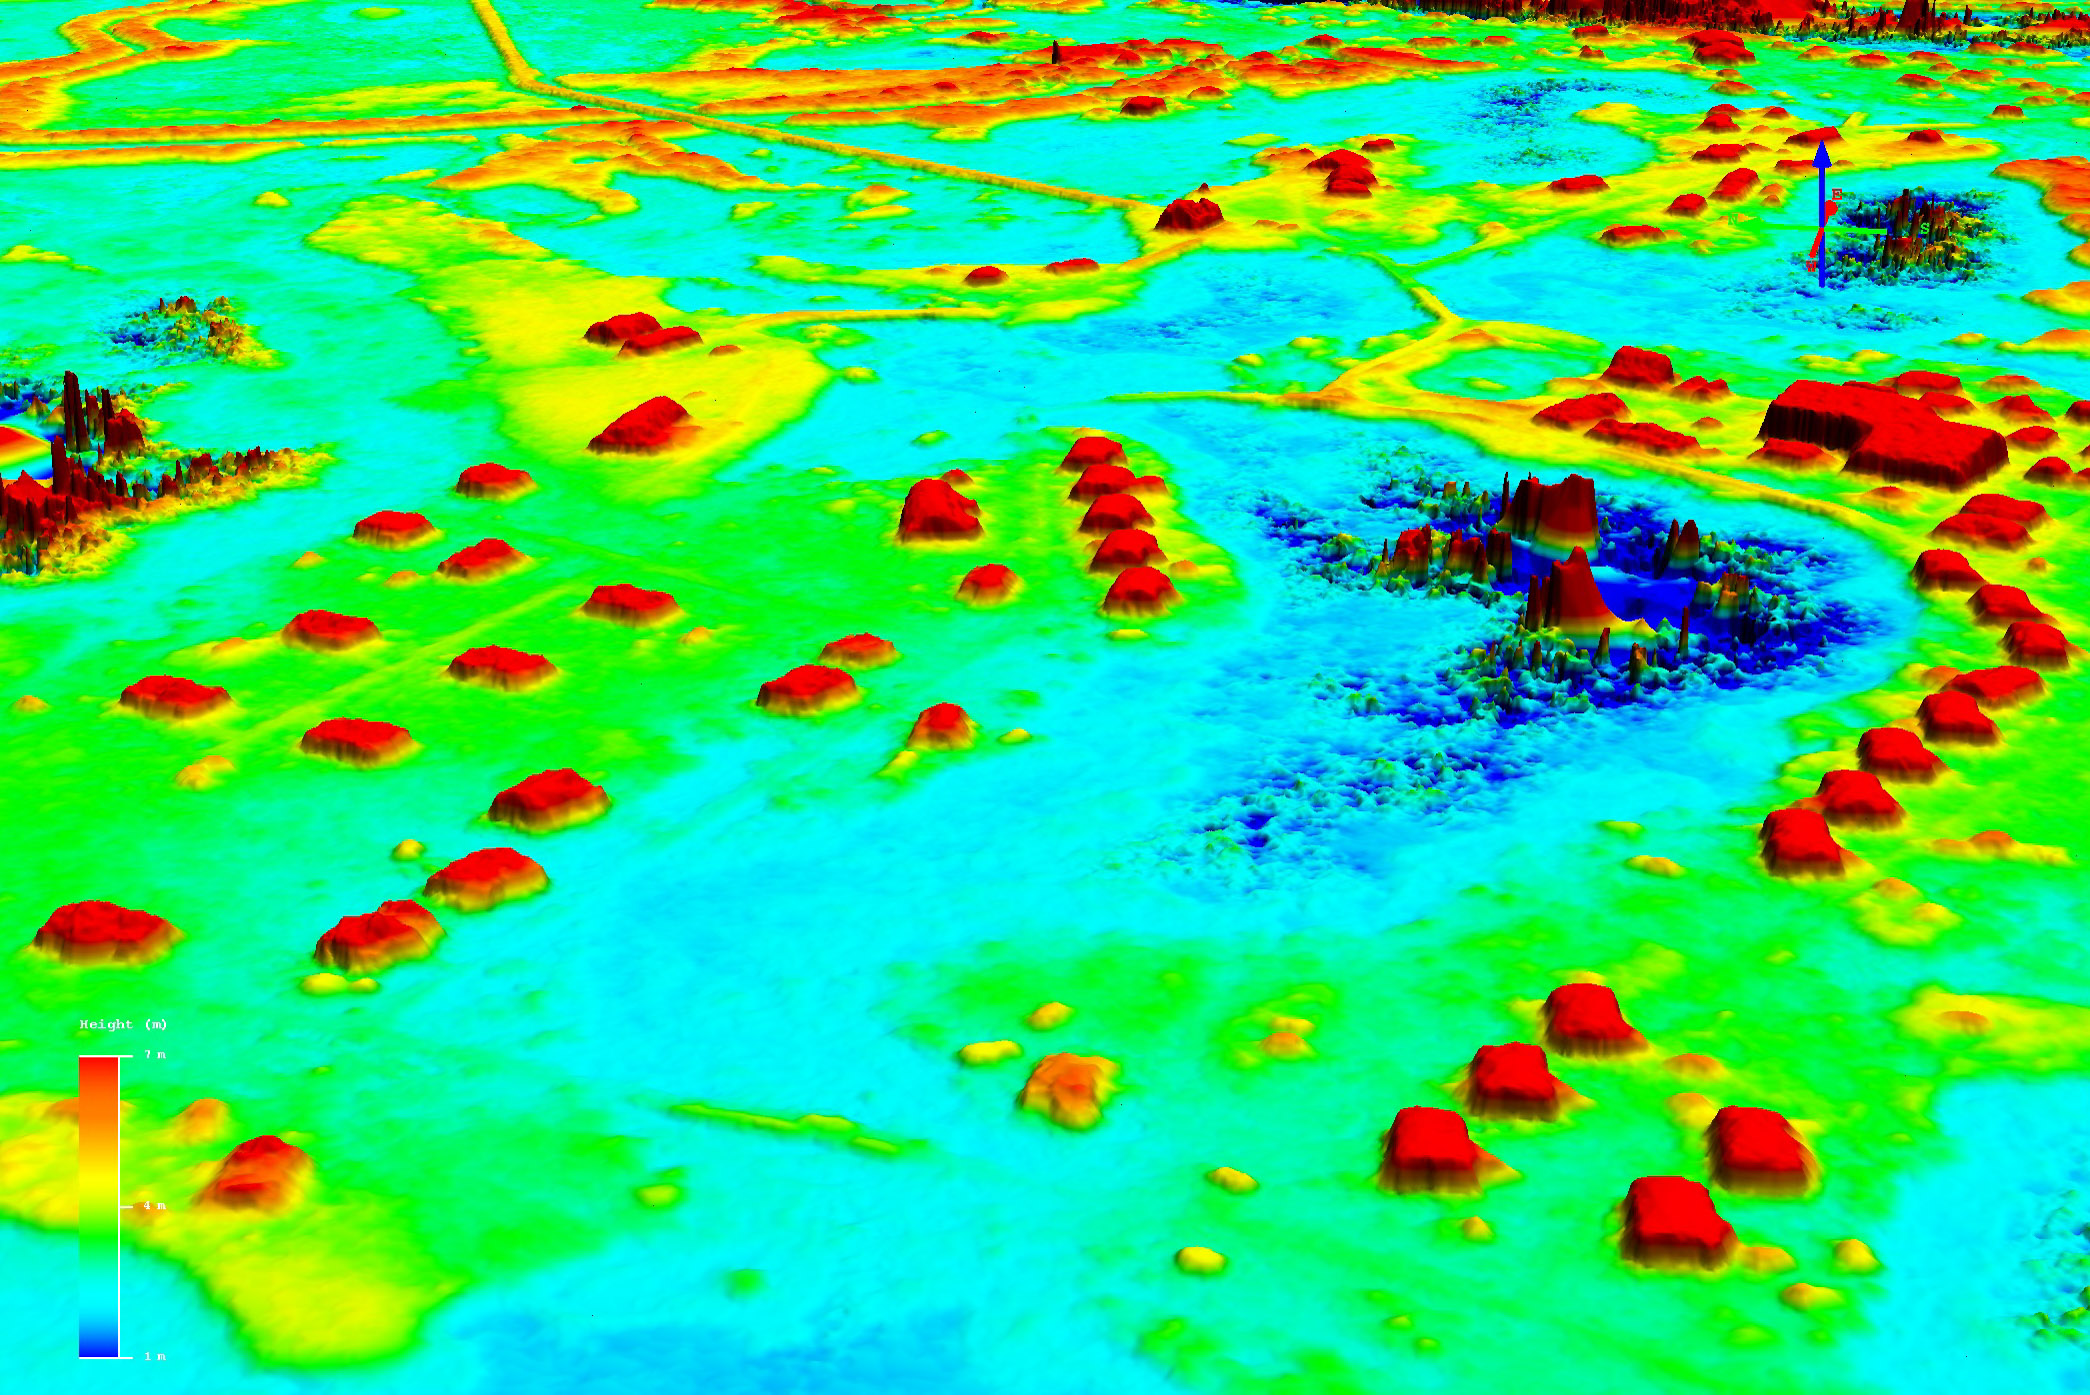
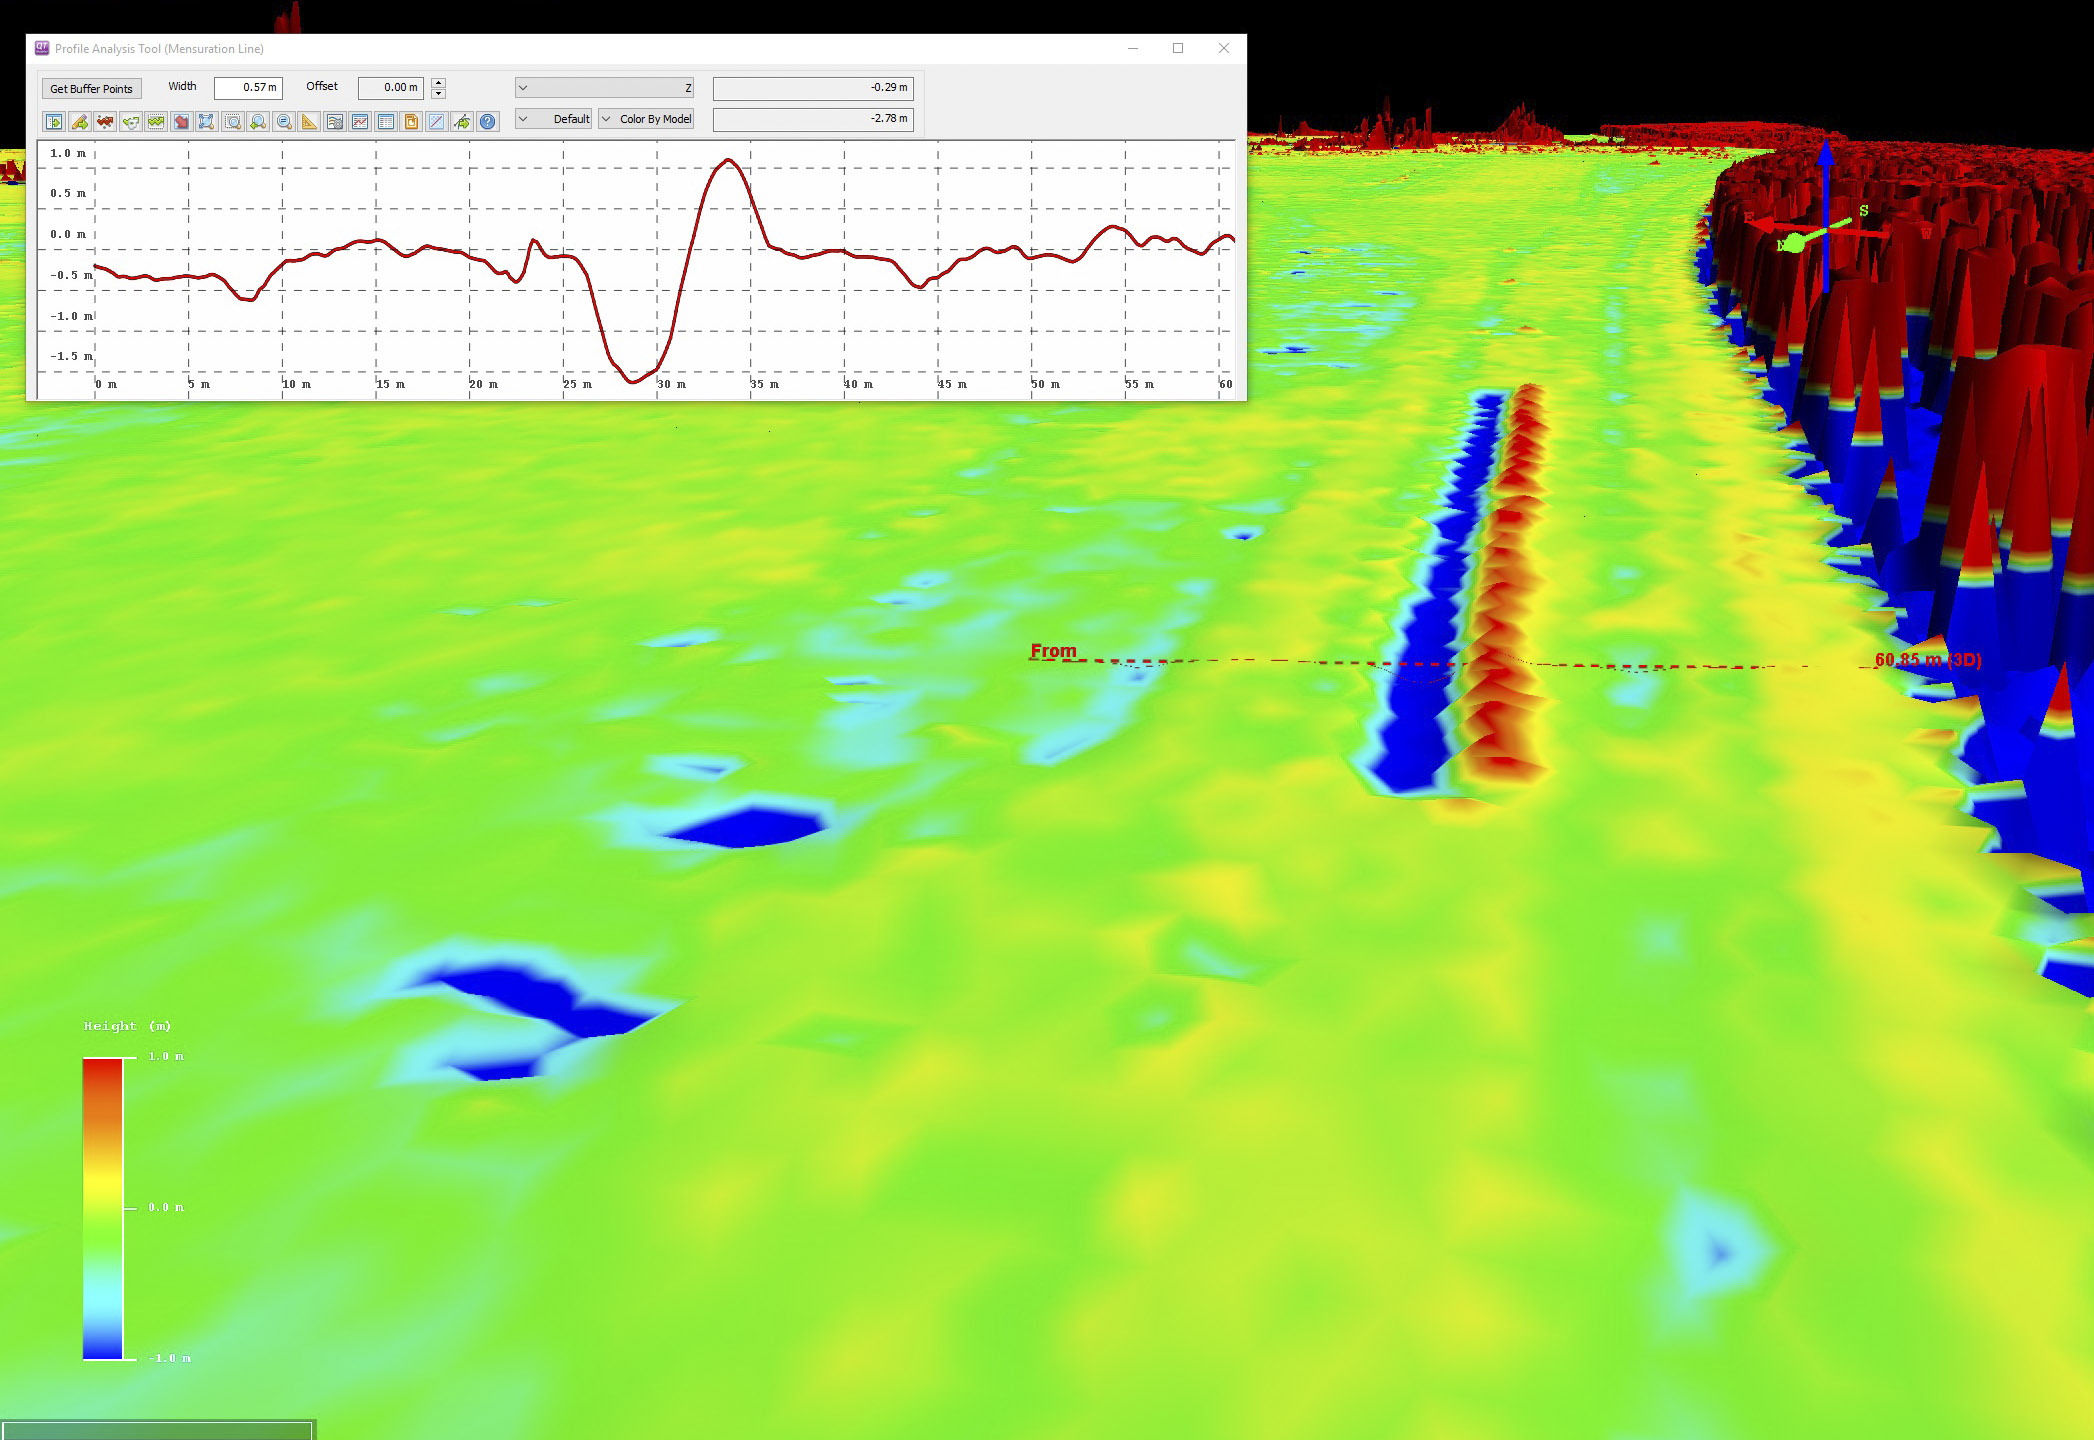
The power to understand subtle hydrological features along the coast is astounding. Here is a small drainage feature about 300 m across, and fodar topography is able to measure each stream channel, even those only a few inches deep. Here the plot at top corresponds to the red line on the map, with vertical ticks of 10 cm.
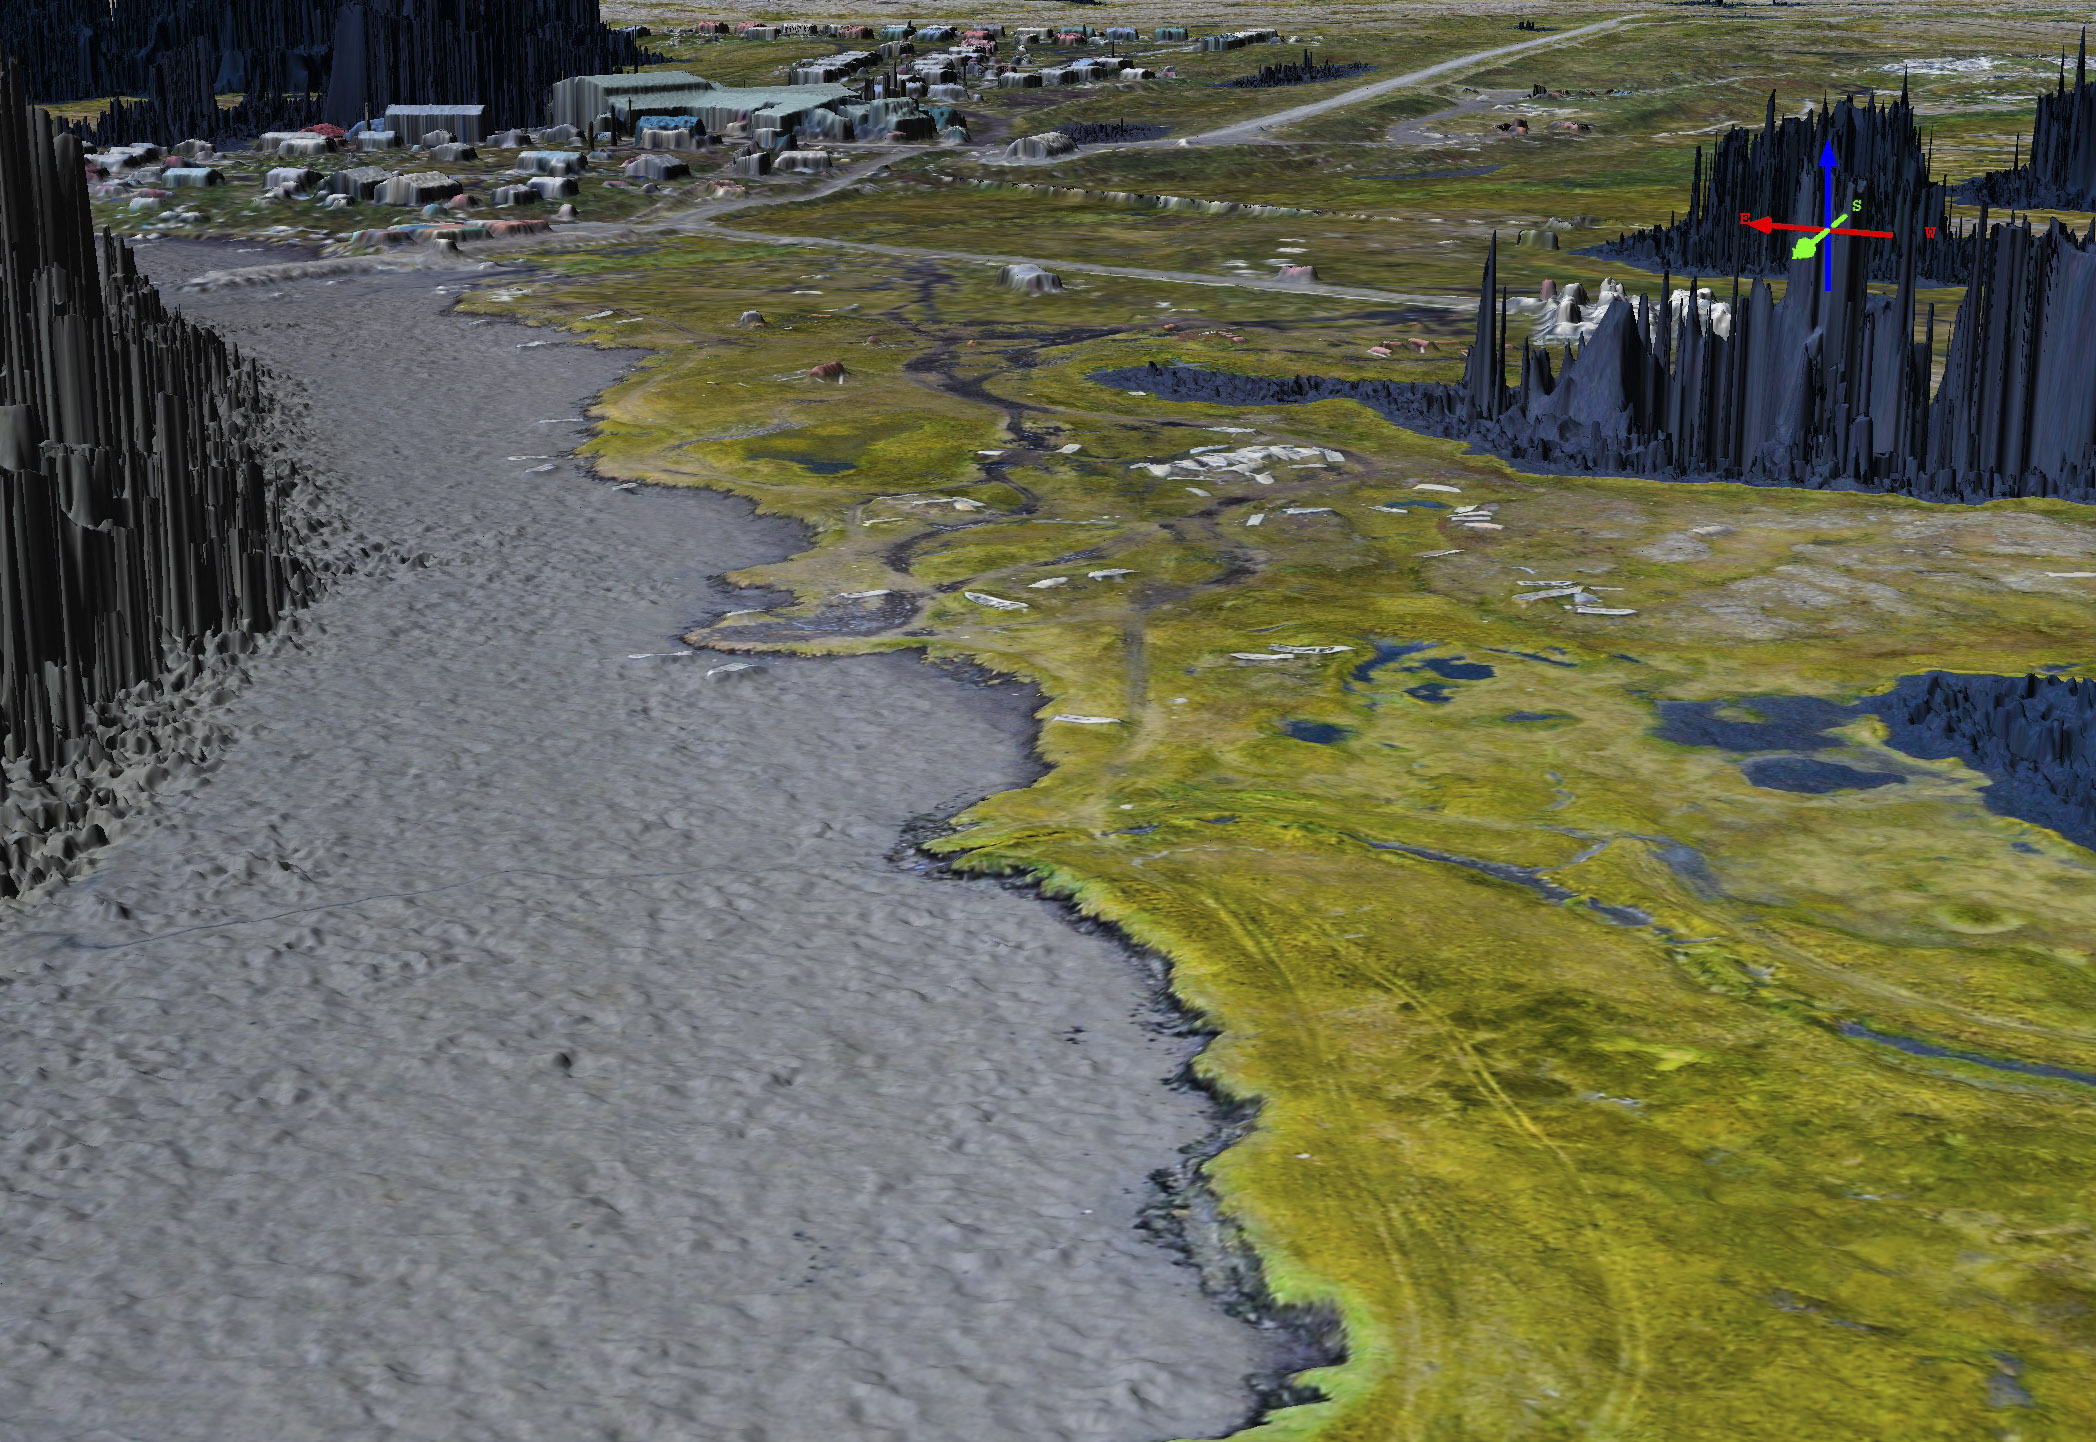
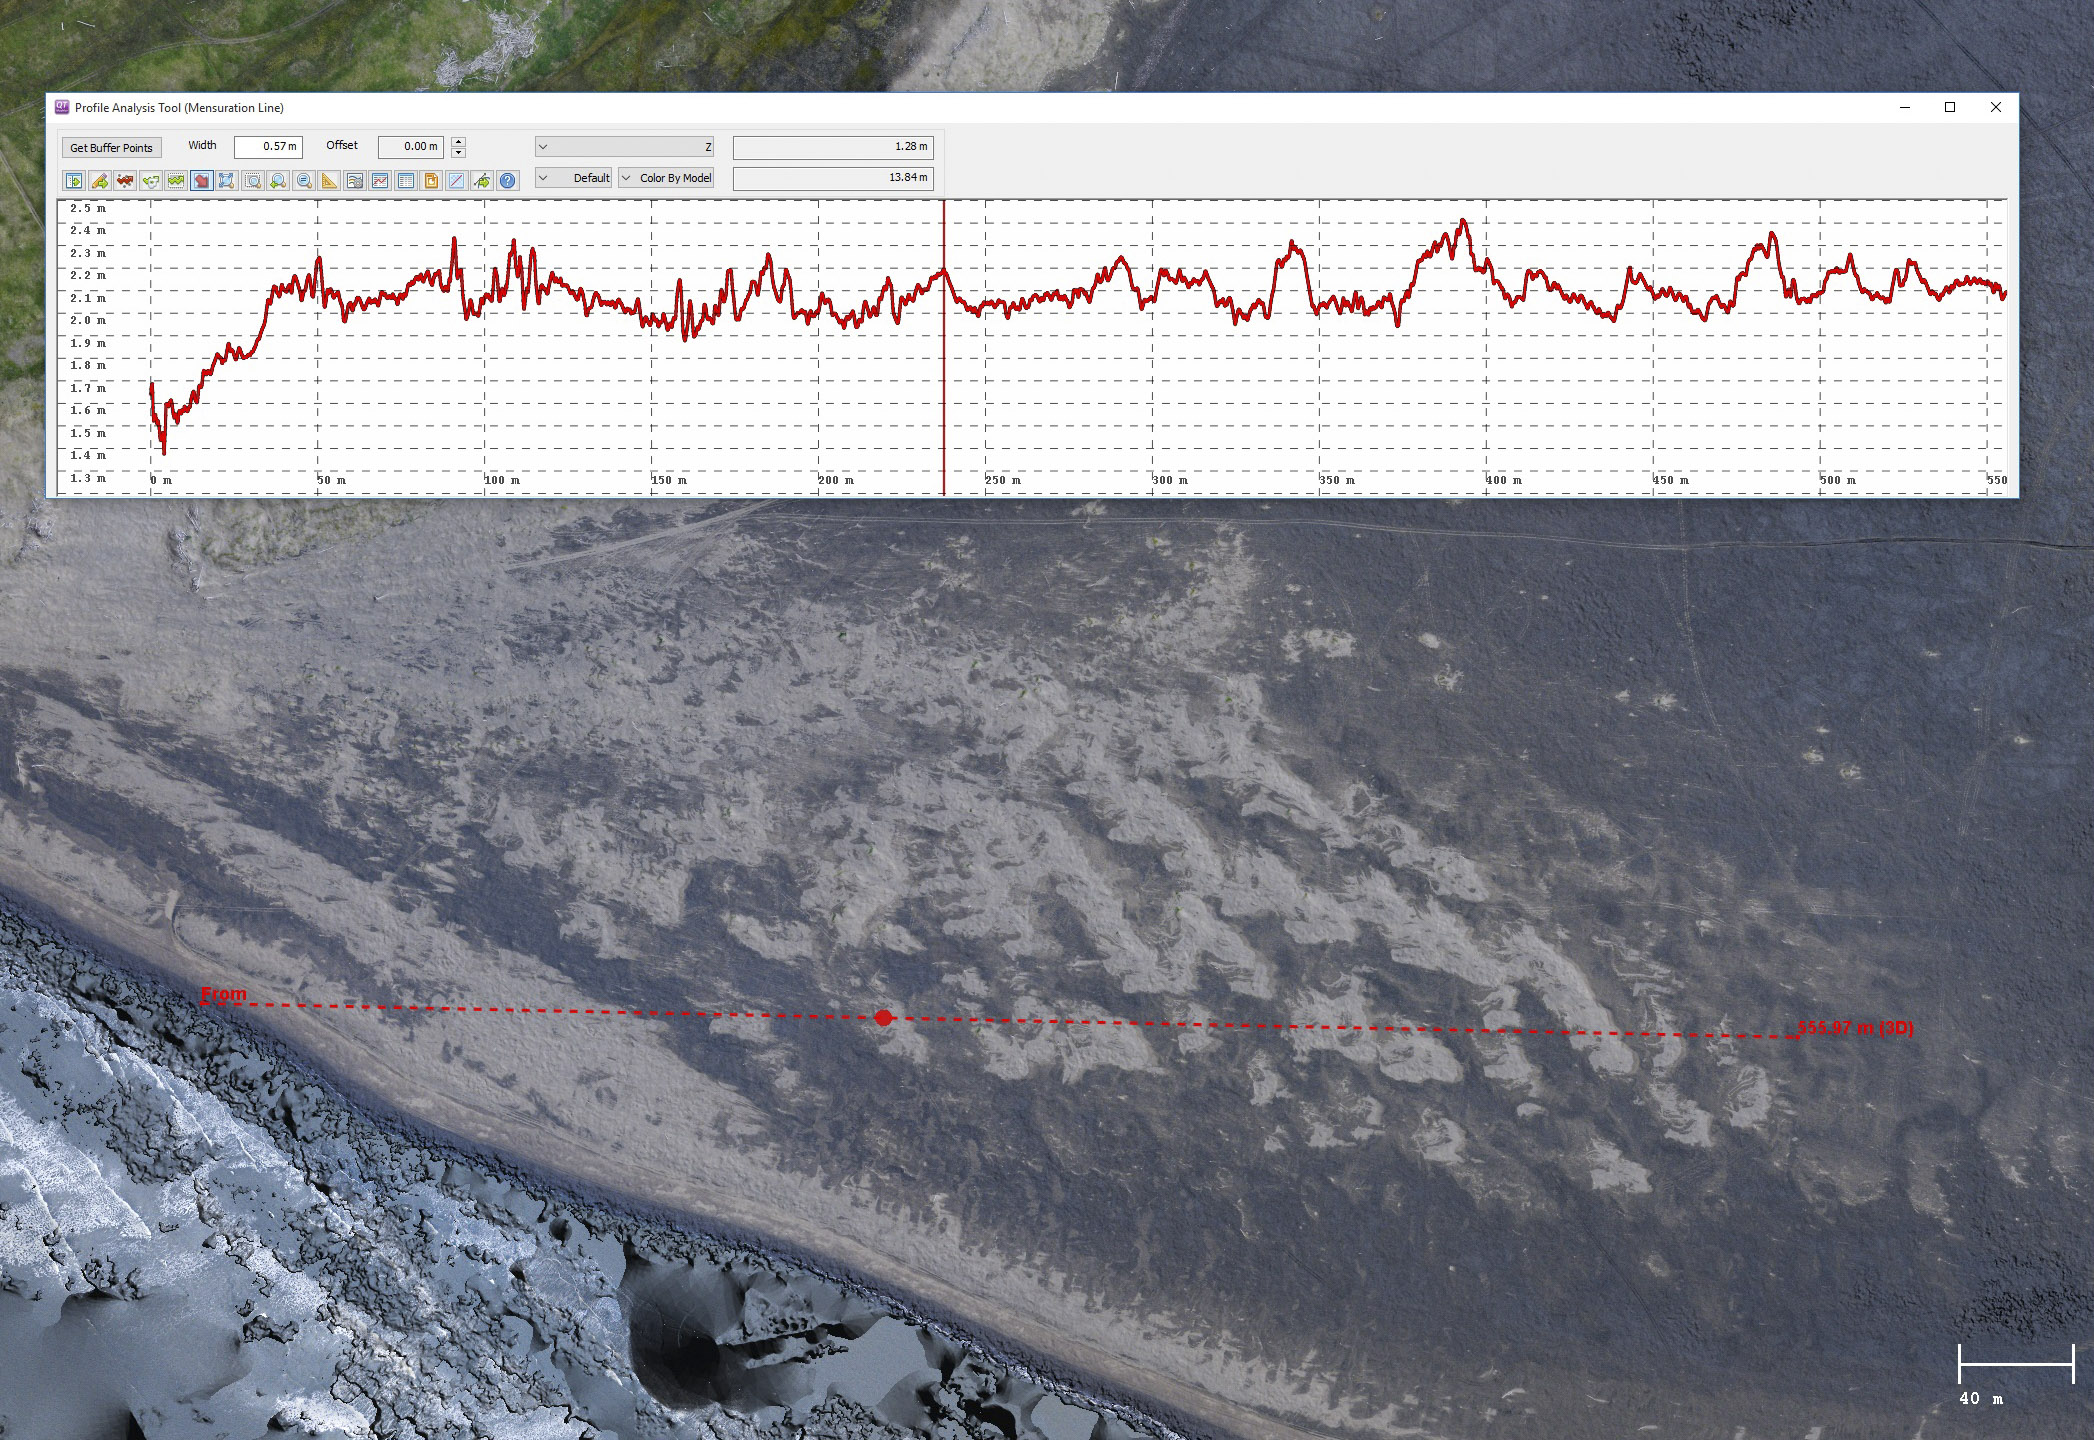
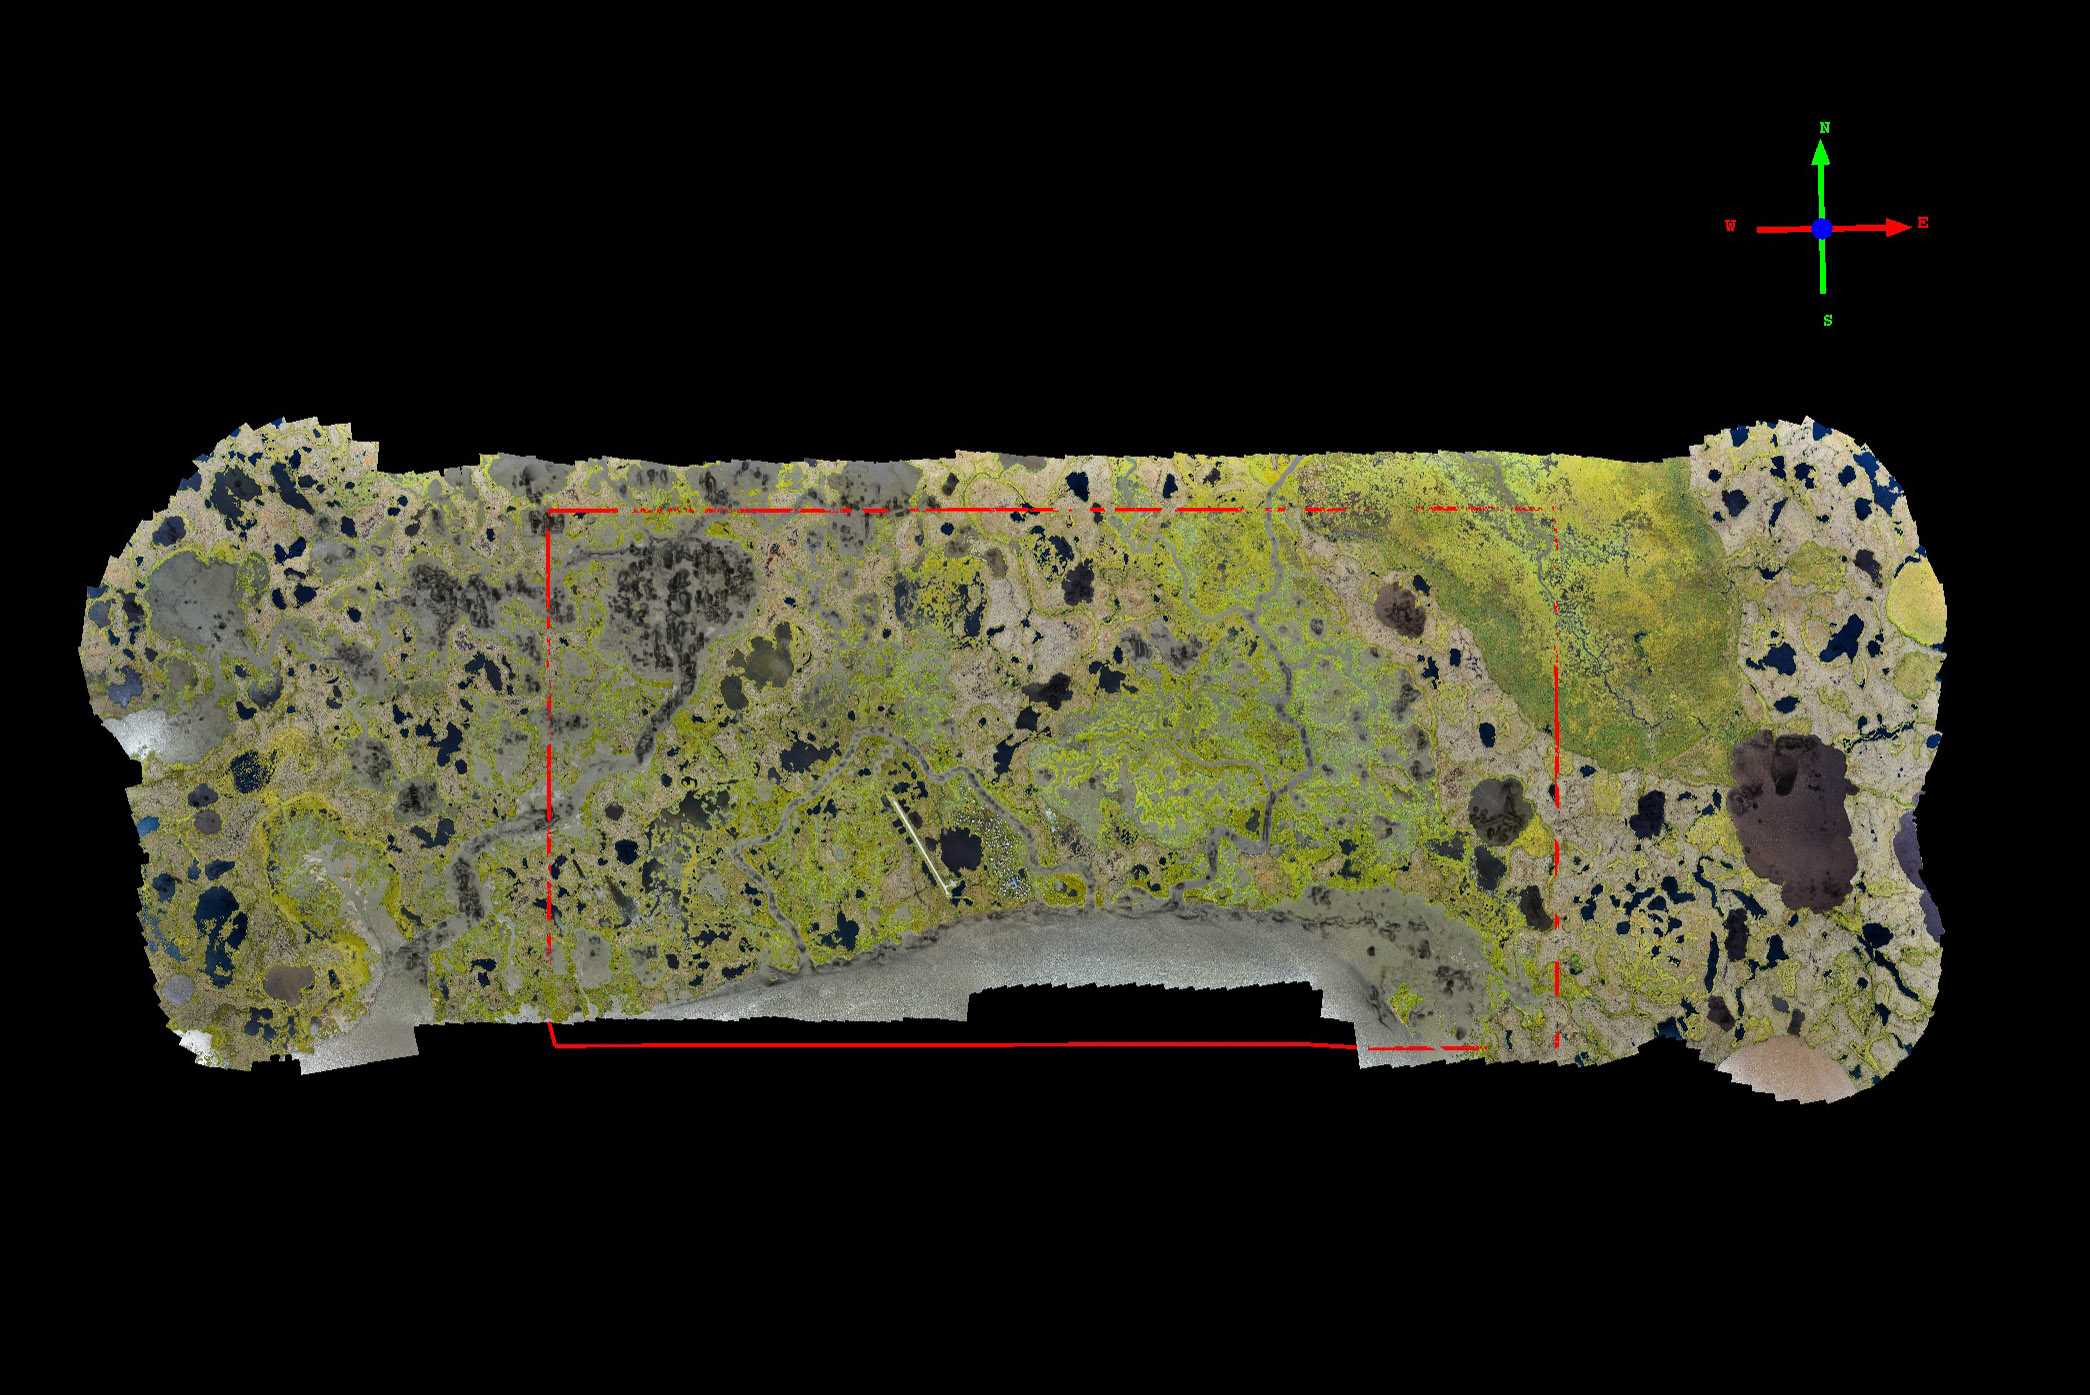
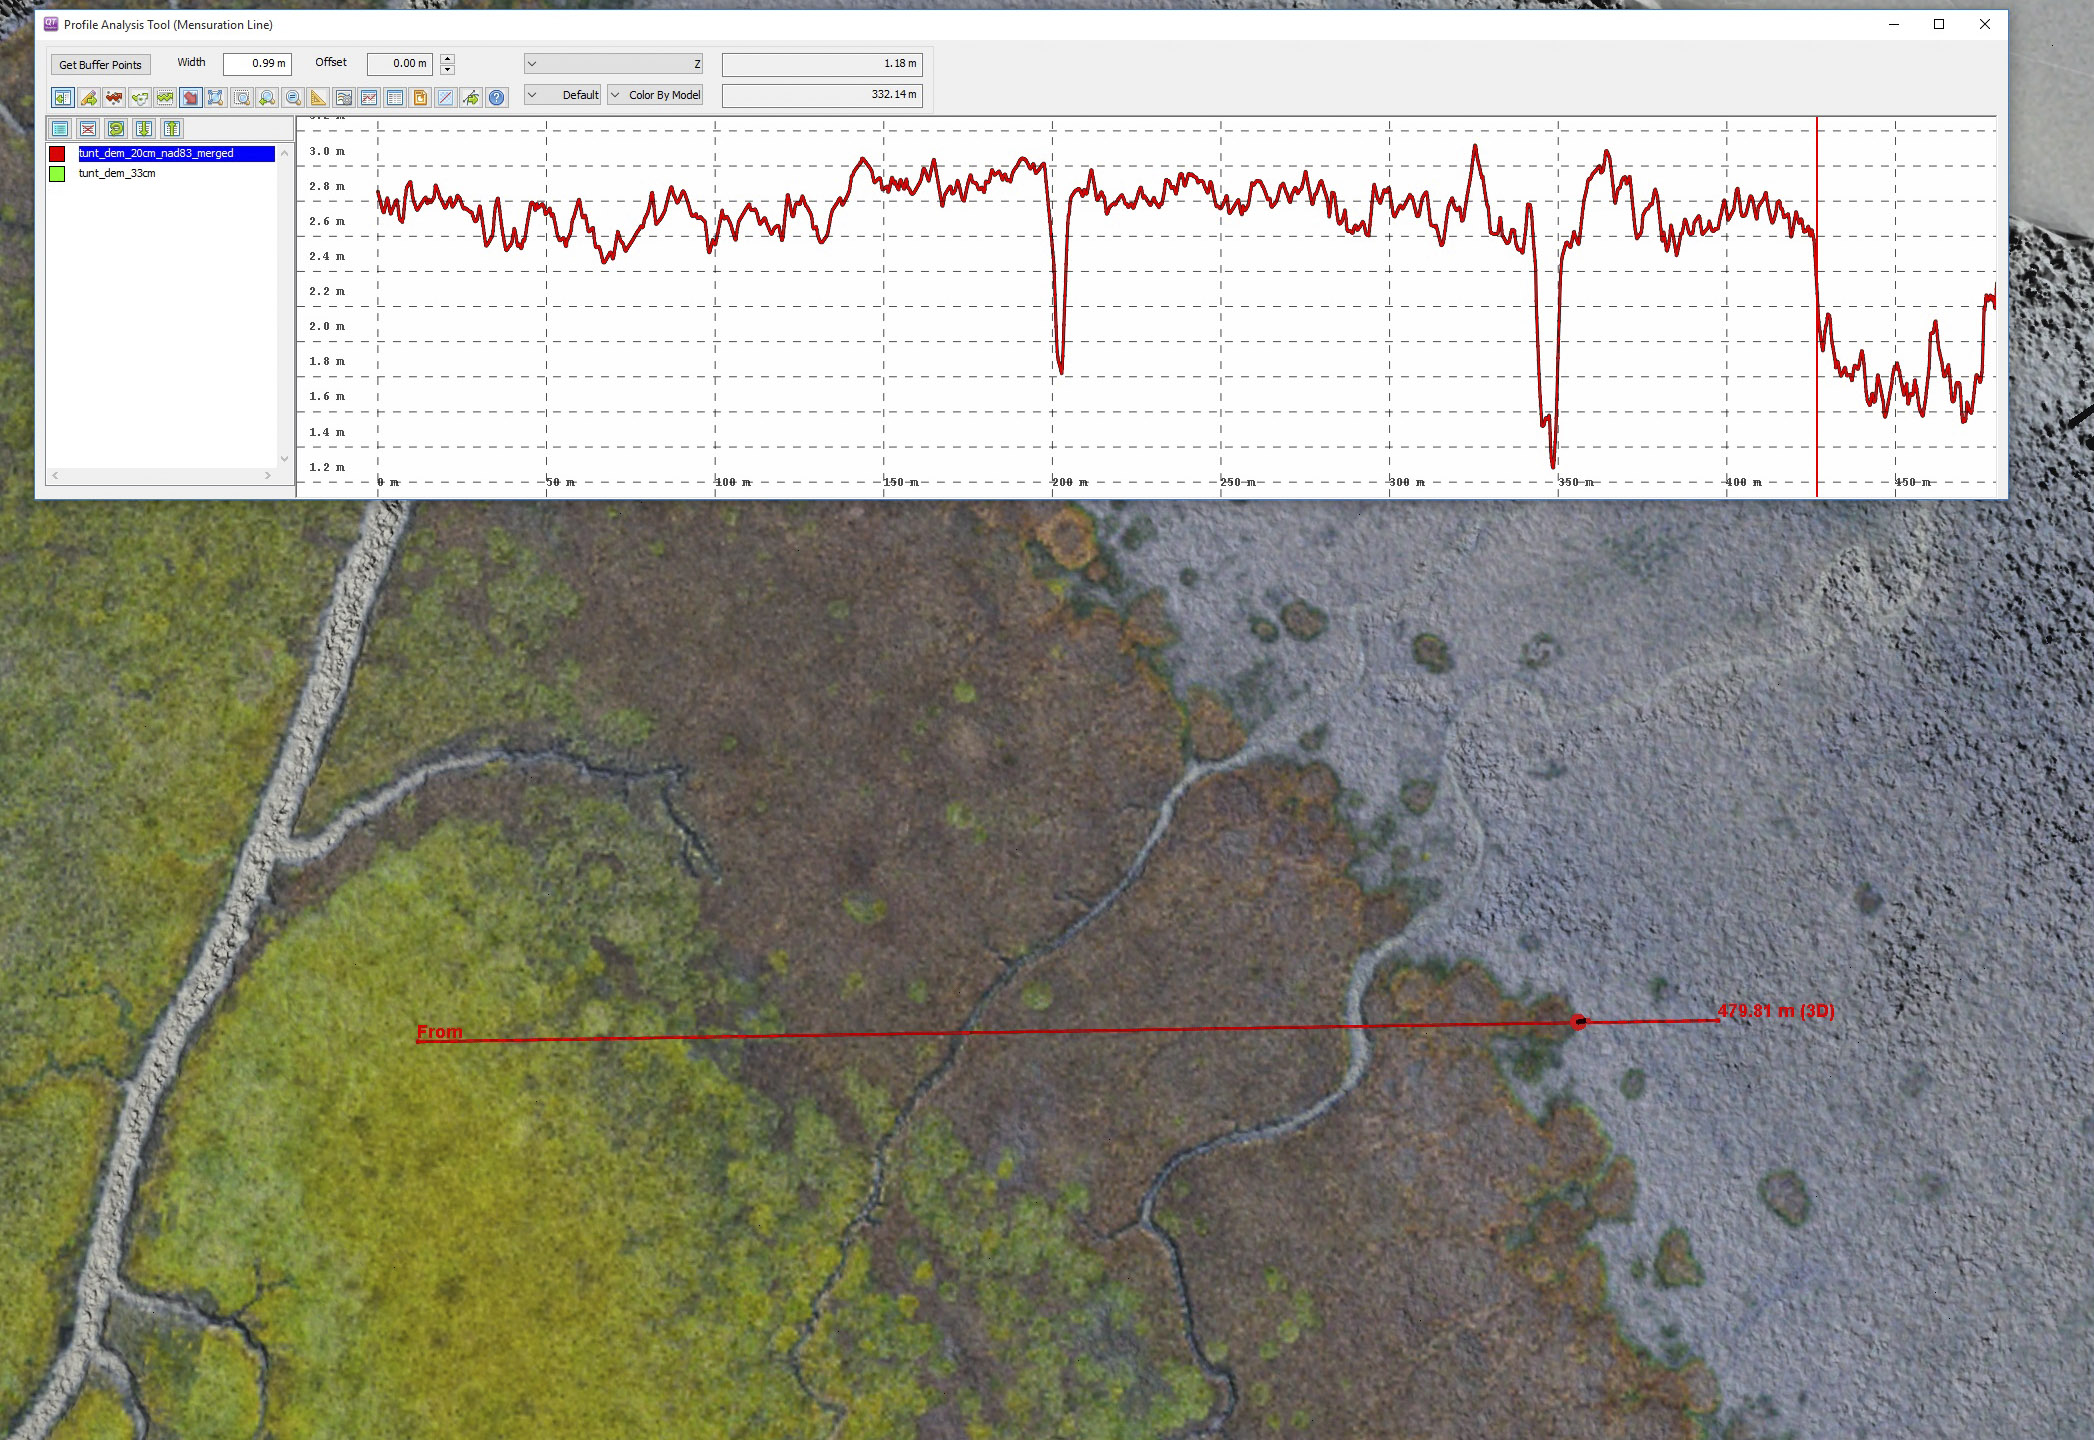
Here is a section of coast near Kwingillingok. These data were all acquired at the lowest tides possible, so that we could acquire the maximum amount of ocean floor as possible. Here broad mud flats are exposed. As can be seen from the plot above (10 cm vertical ticks), the bright green tundra is regularly submerged. However, it is unclear whether that happens with every tide or just especially high ones. One of the main goals for these data is to determine the Mean High Water line, so that we will know how frequently that bright green tundra is submerged.
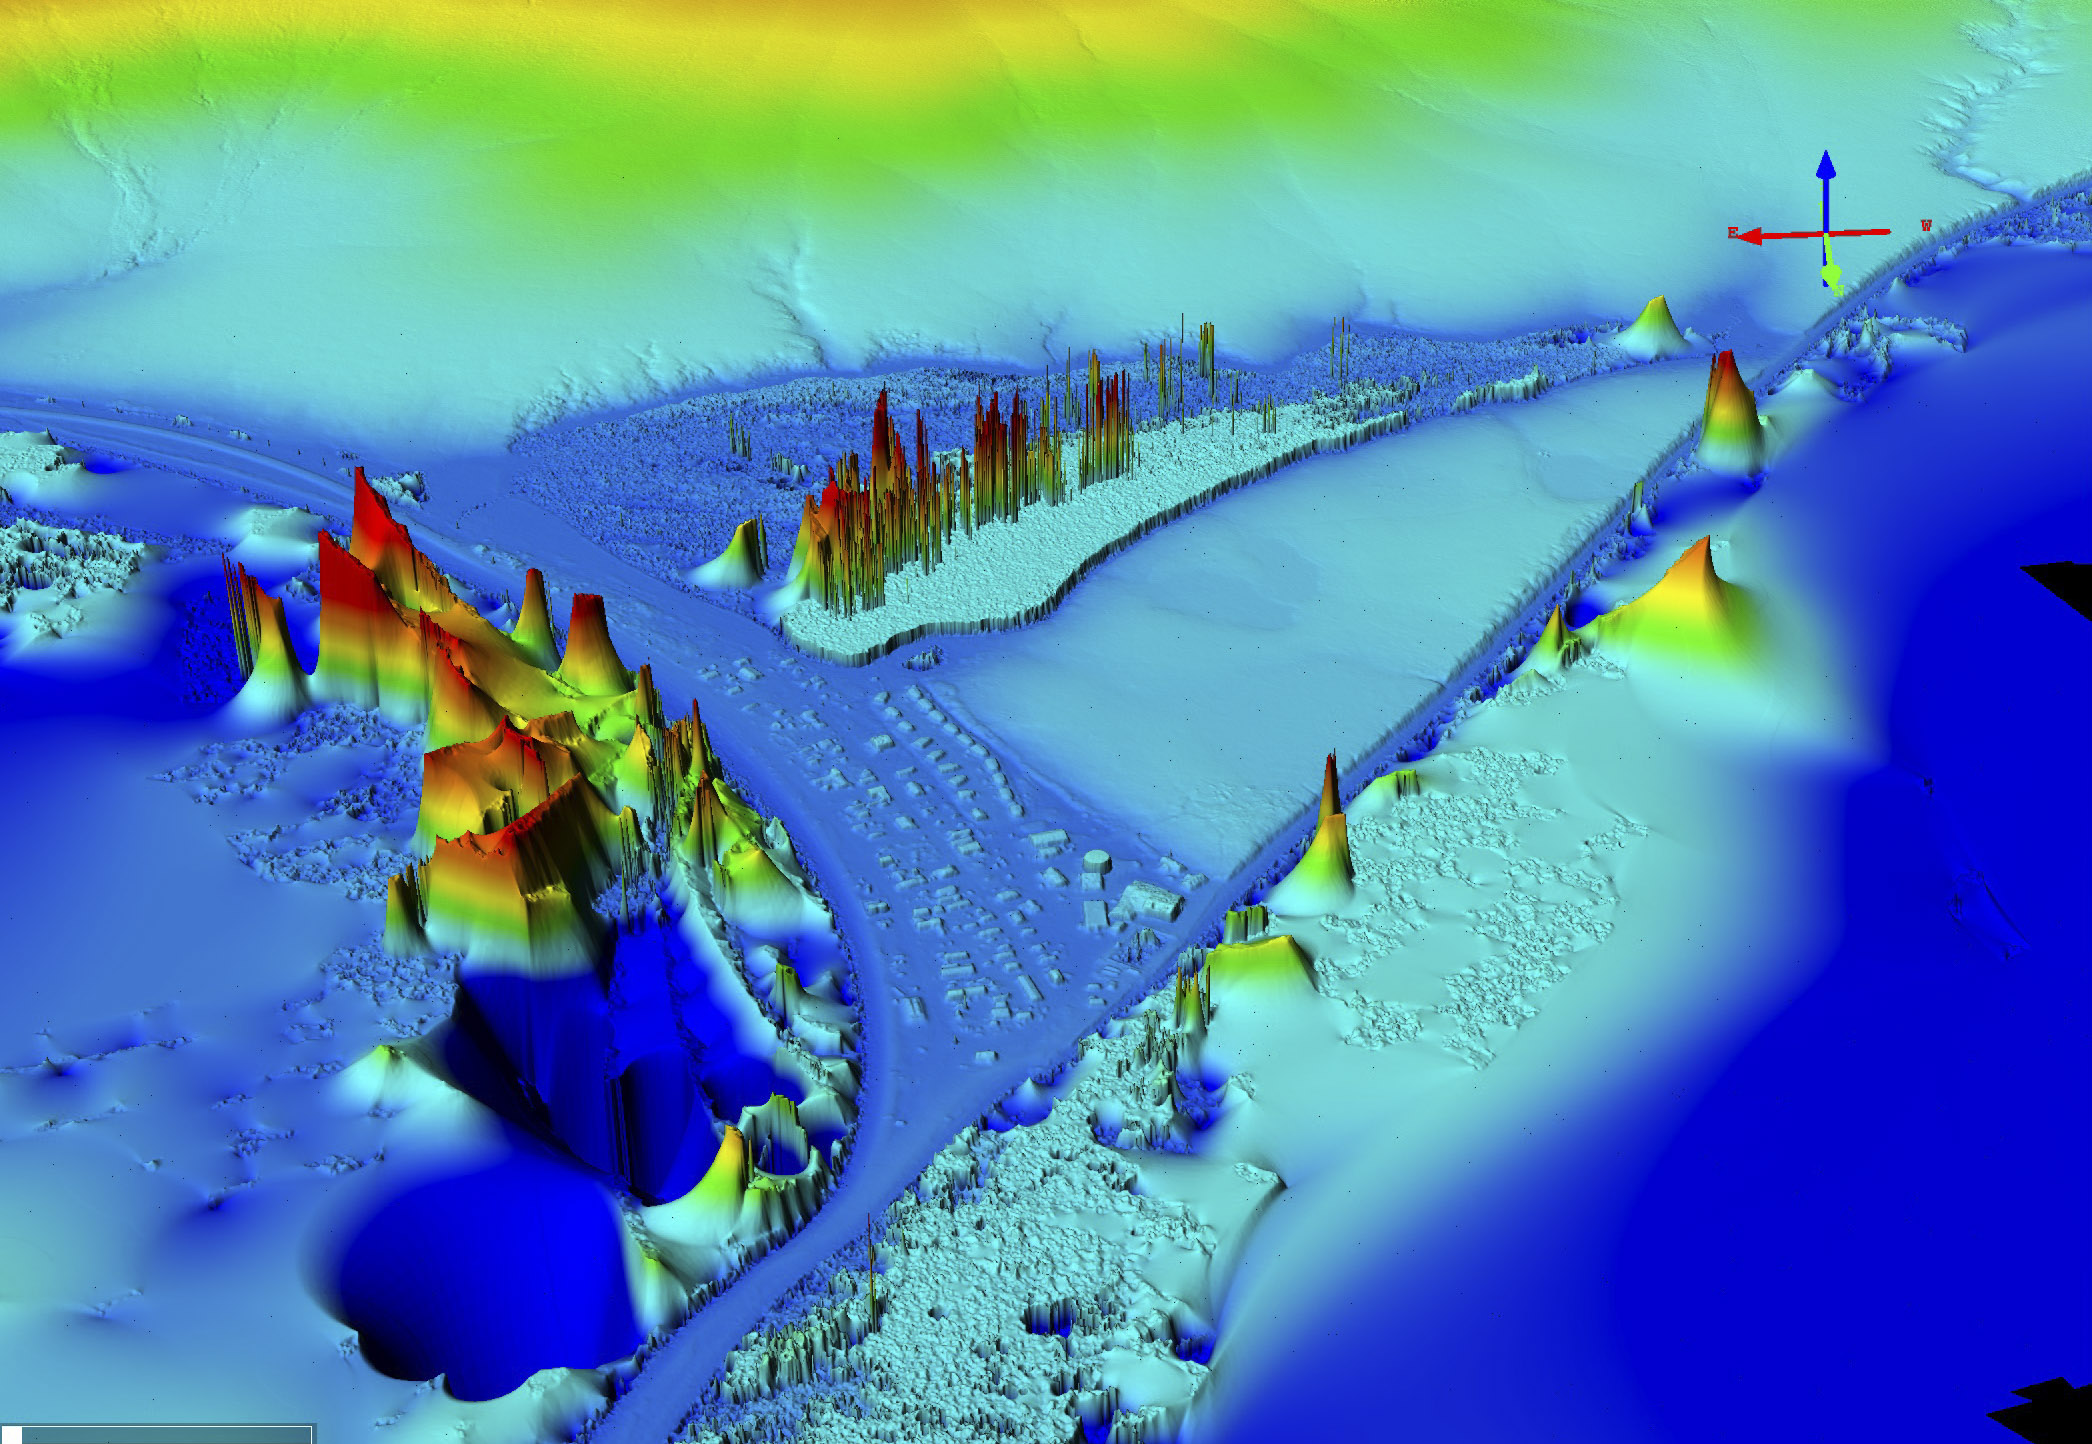
One thing to note when viewing the images below or in Fodar Earth is that fodar does not measure the topography of liquid water, so you will see bizarre and sometime giant topographic anomalies in the ocean, lakes and rivers. Here are some examples of that in Teller. One of the next steps for processing these data is to edit out this noise in water bodies.
Below are example data from each village,
presented in alphabetical order.
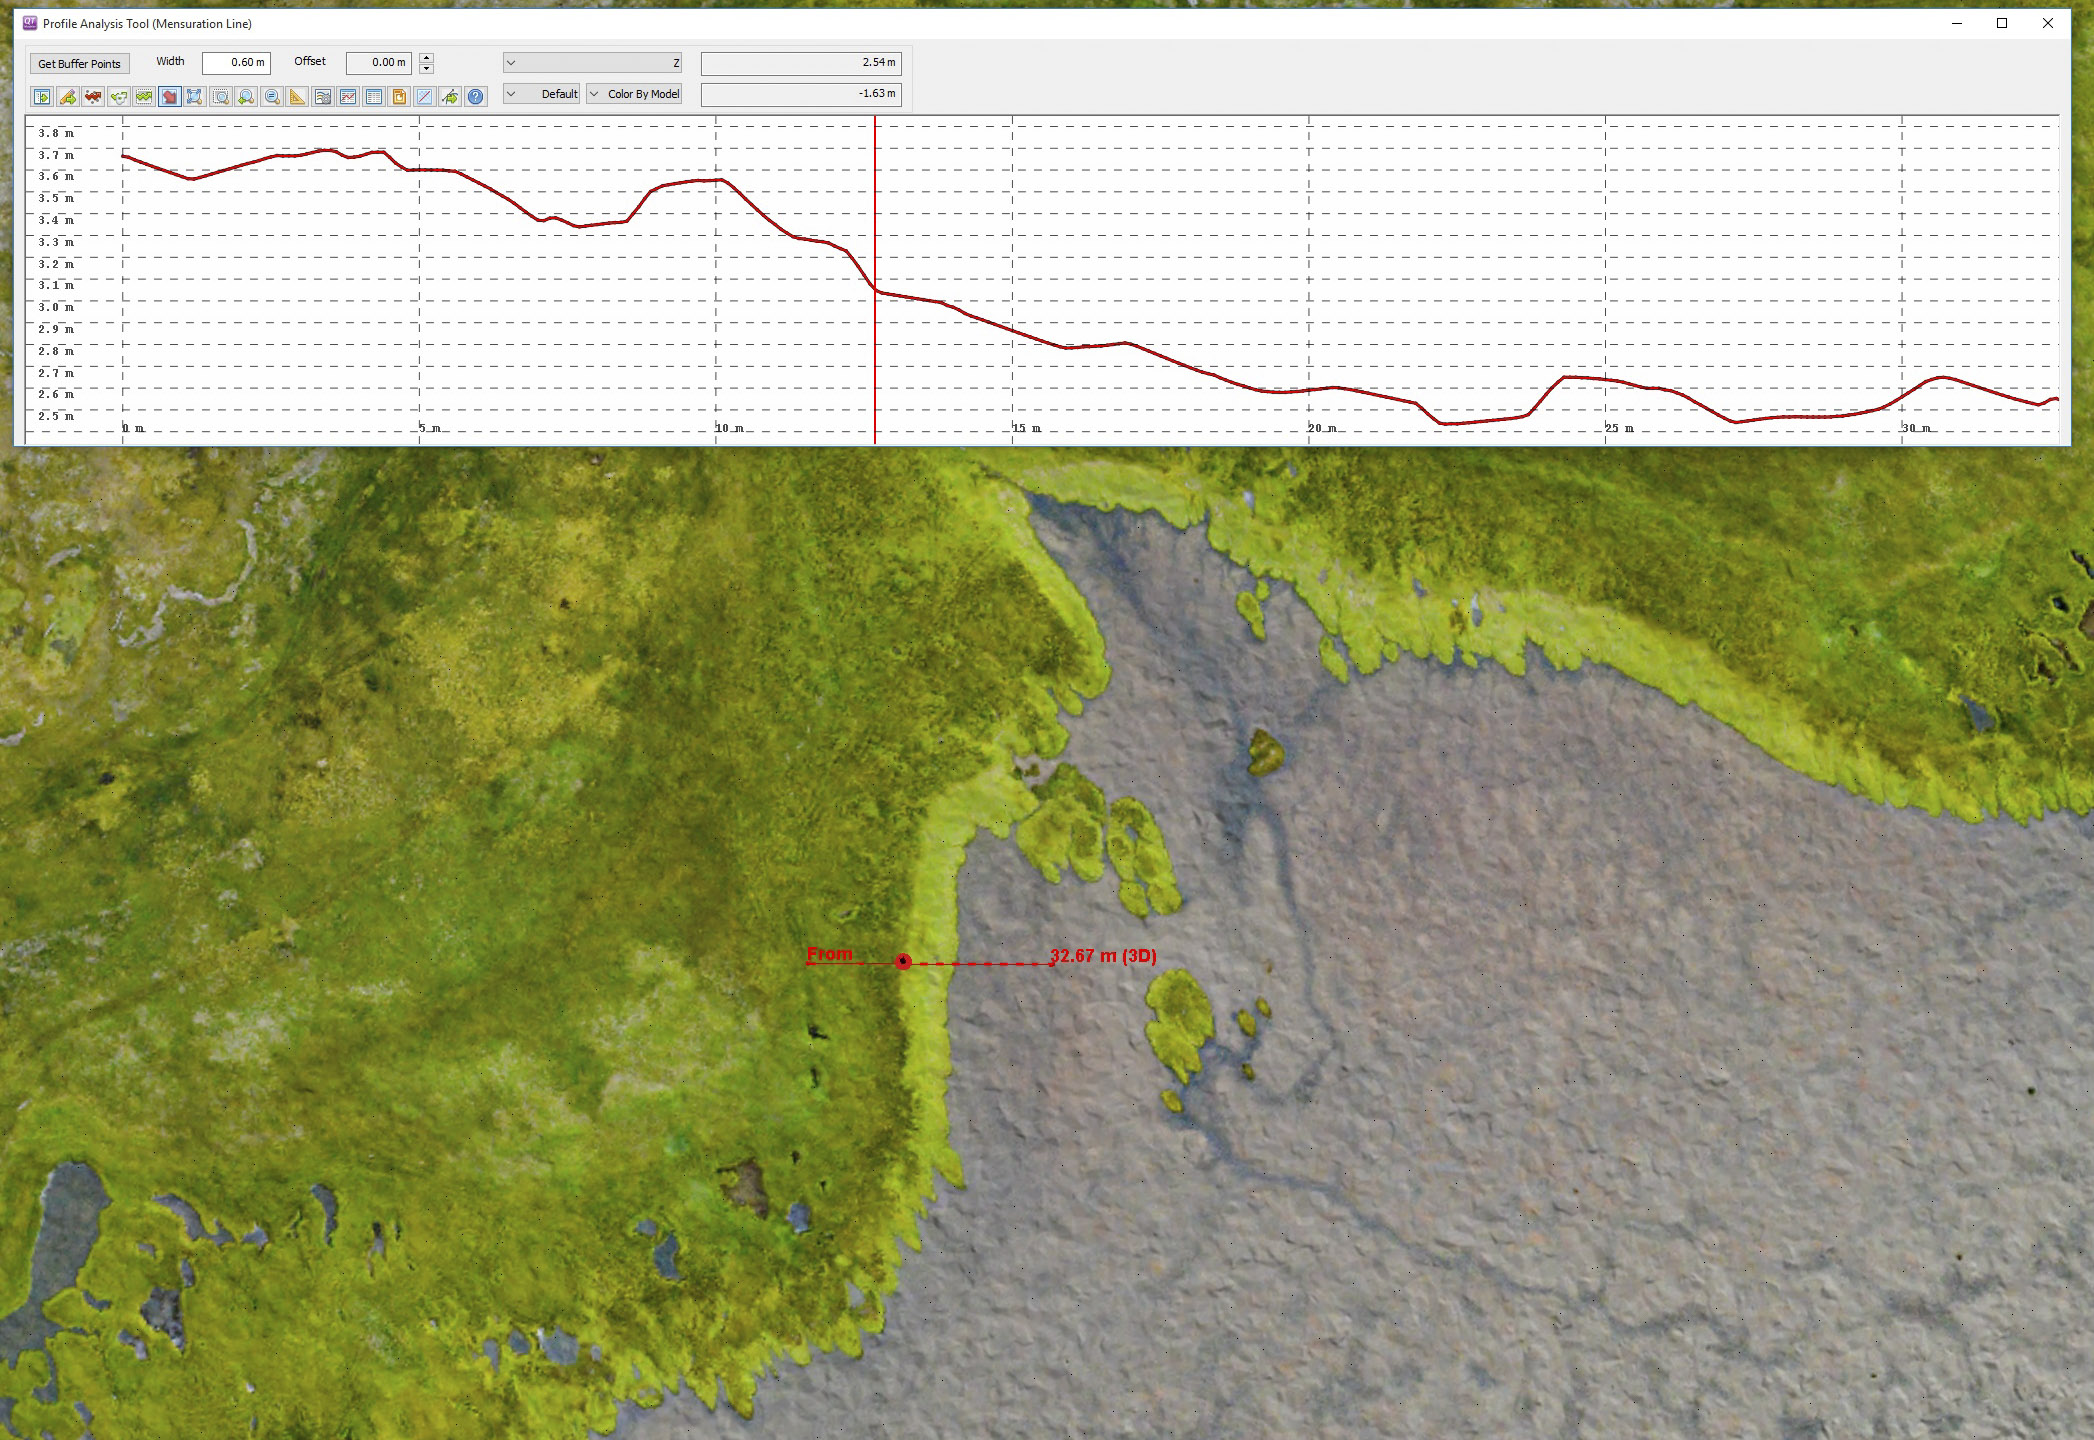
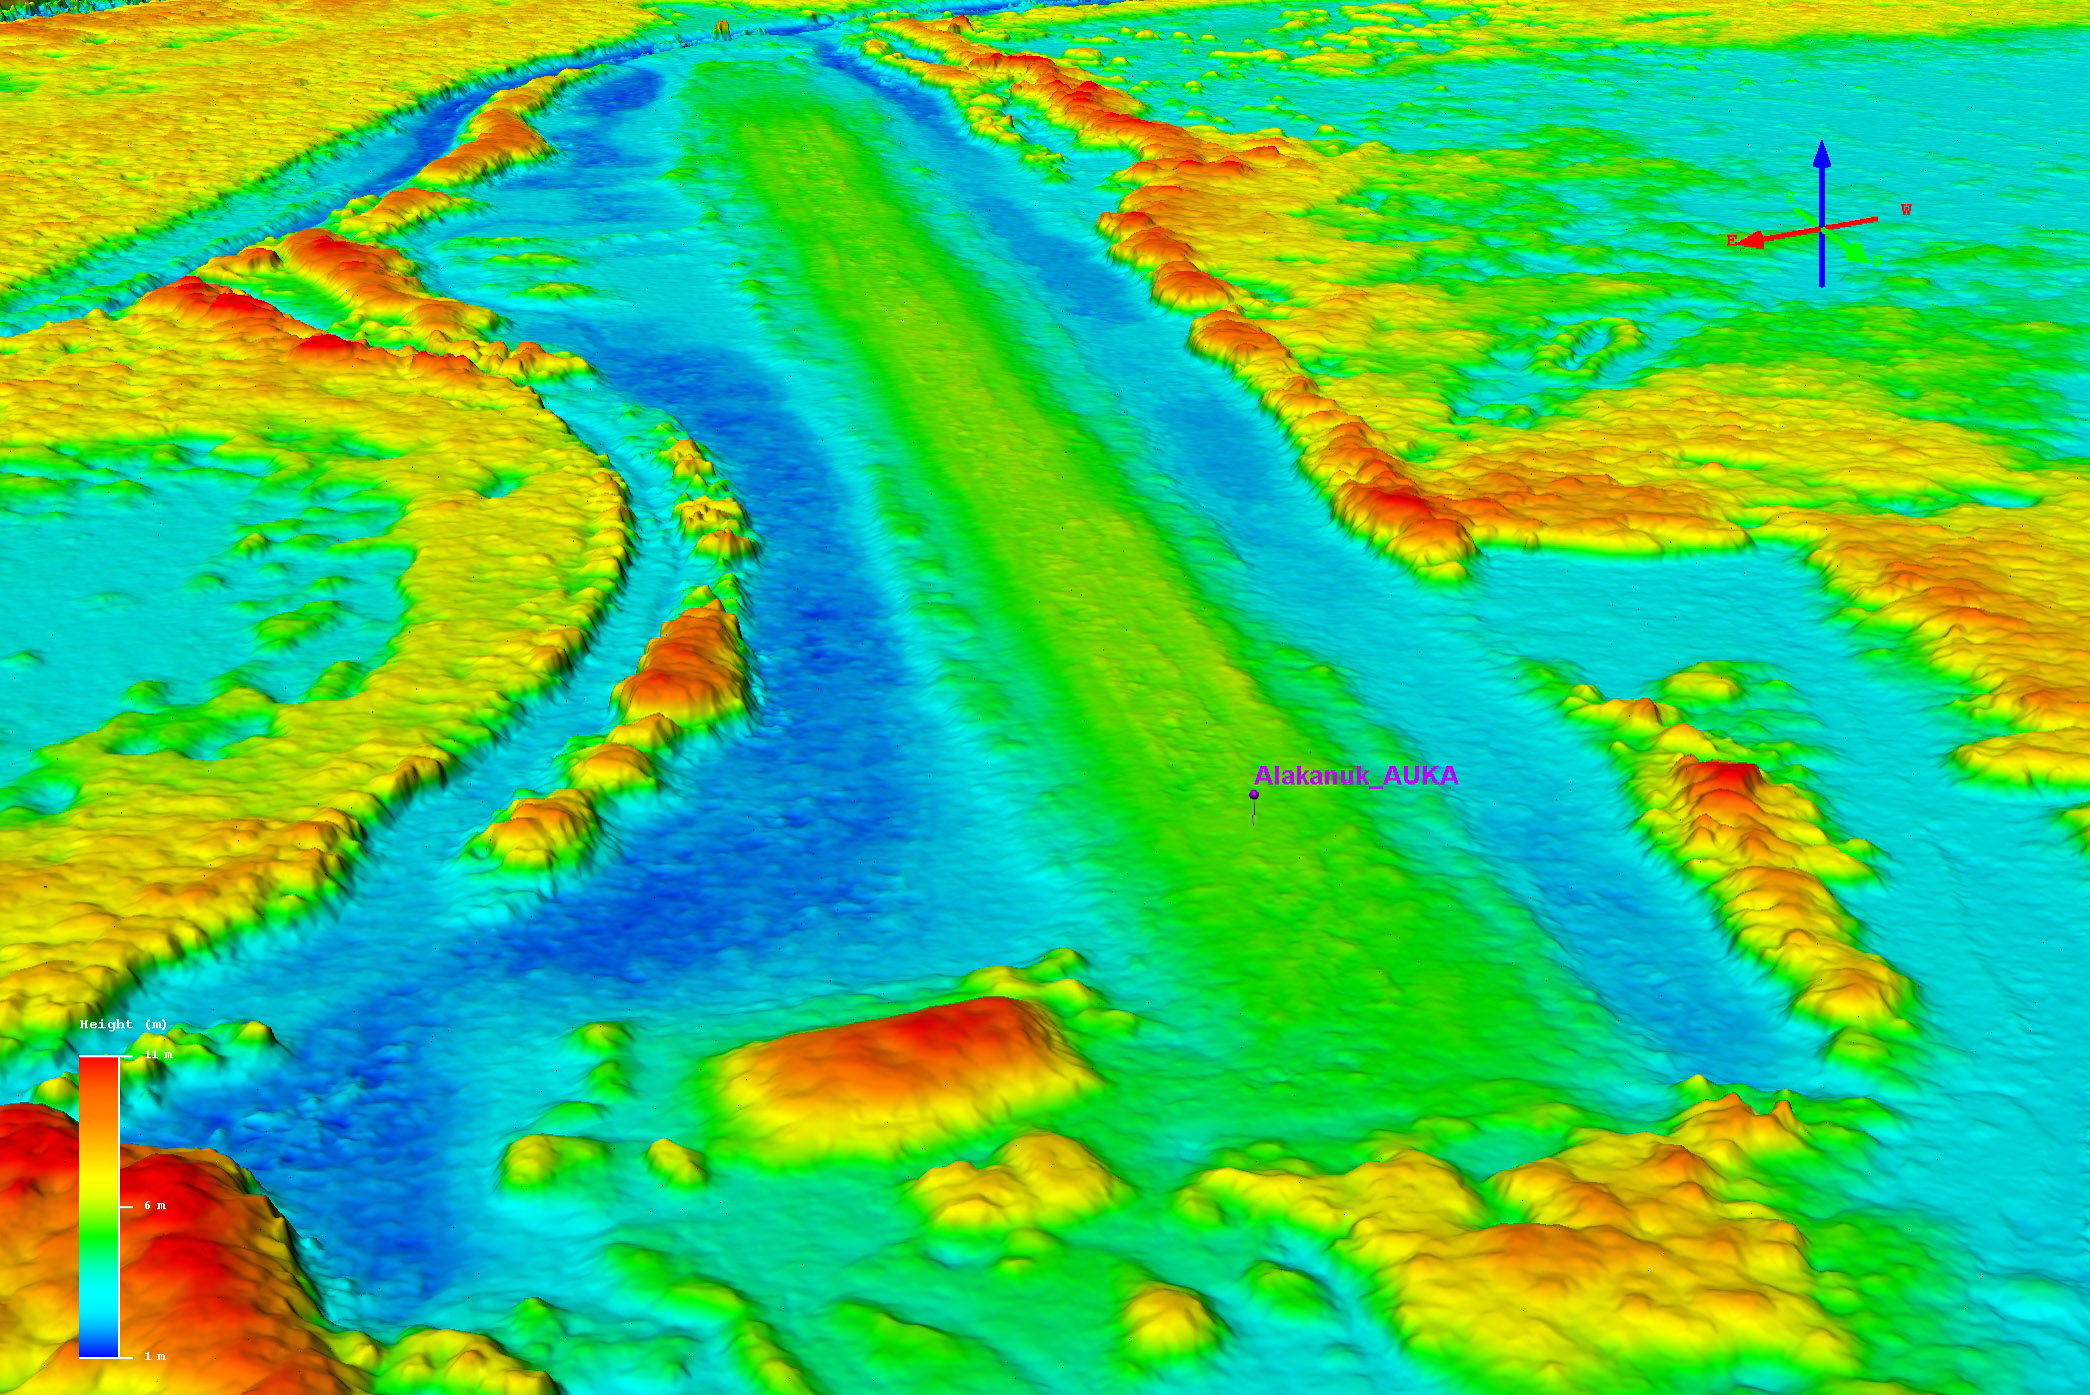
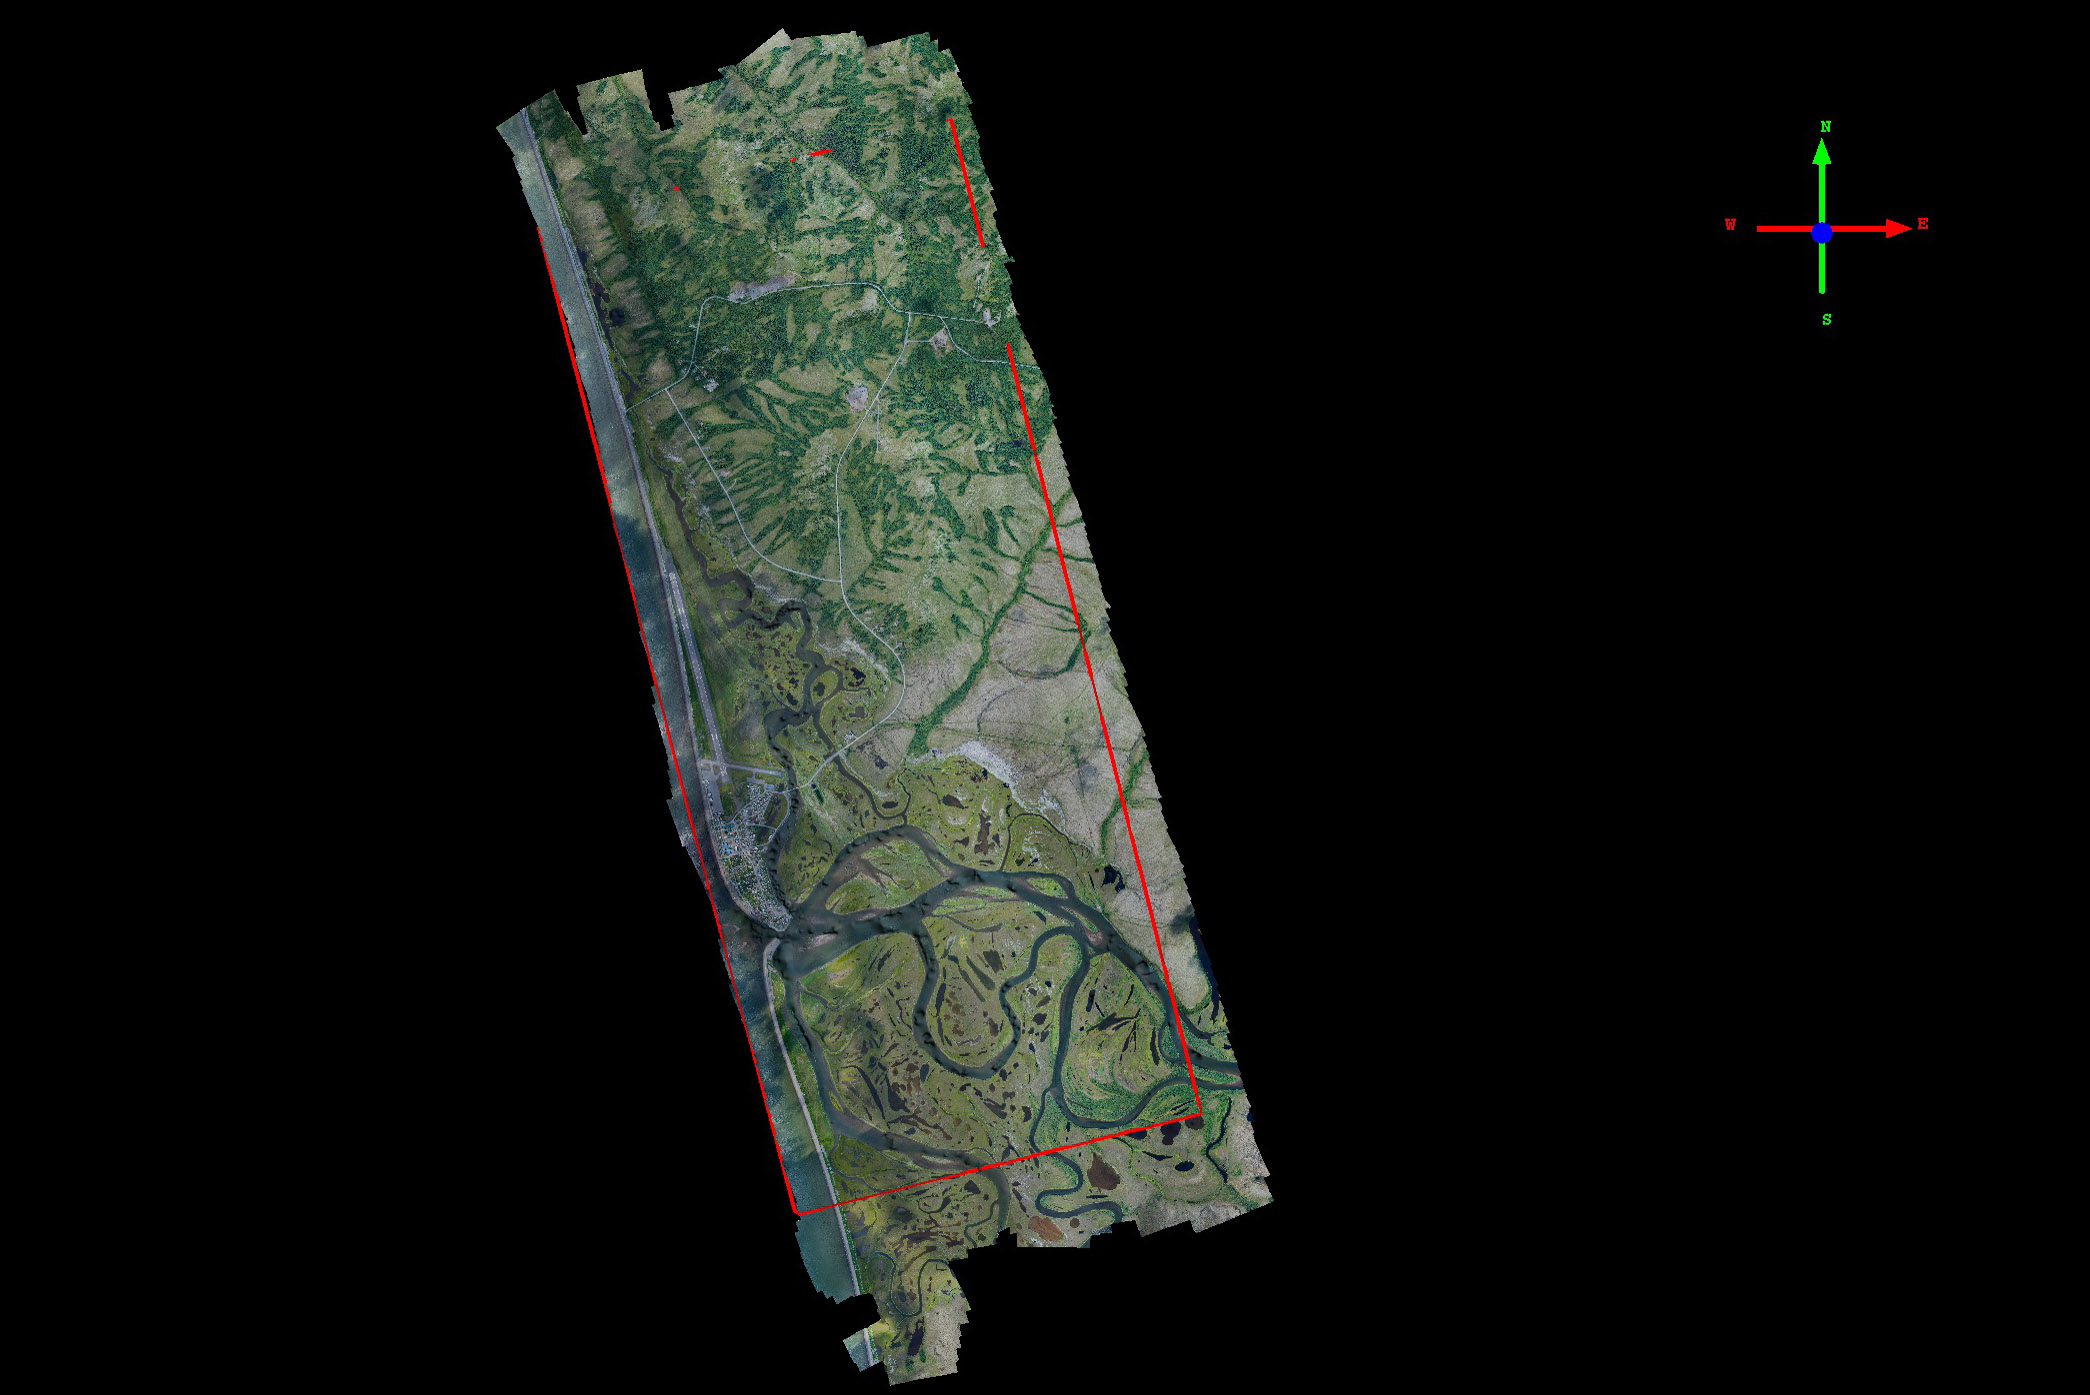
Alakanuk
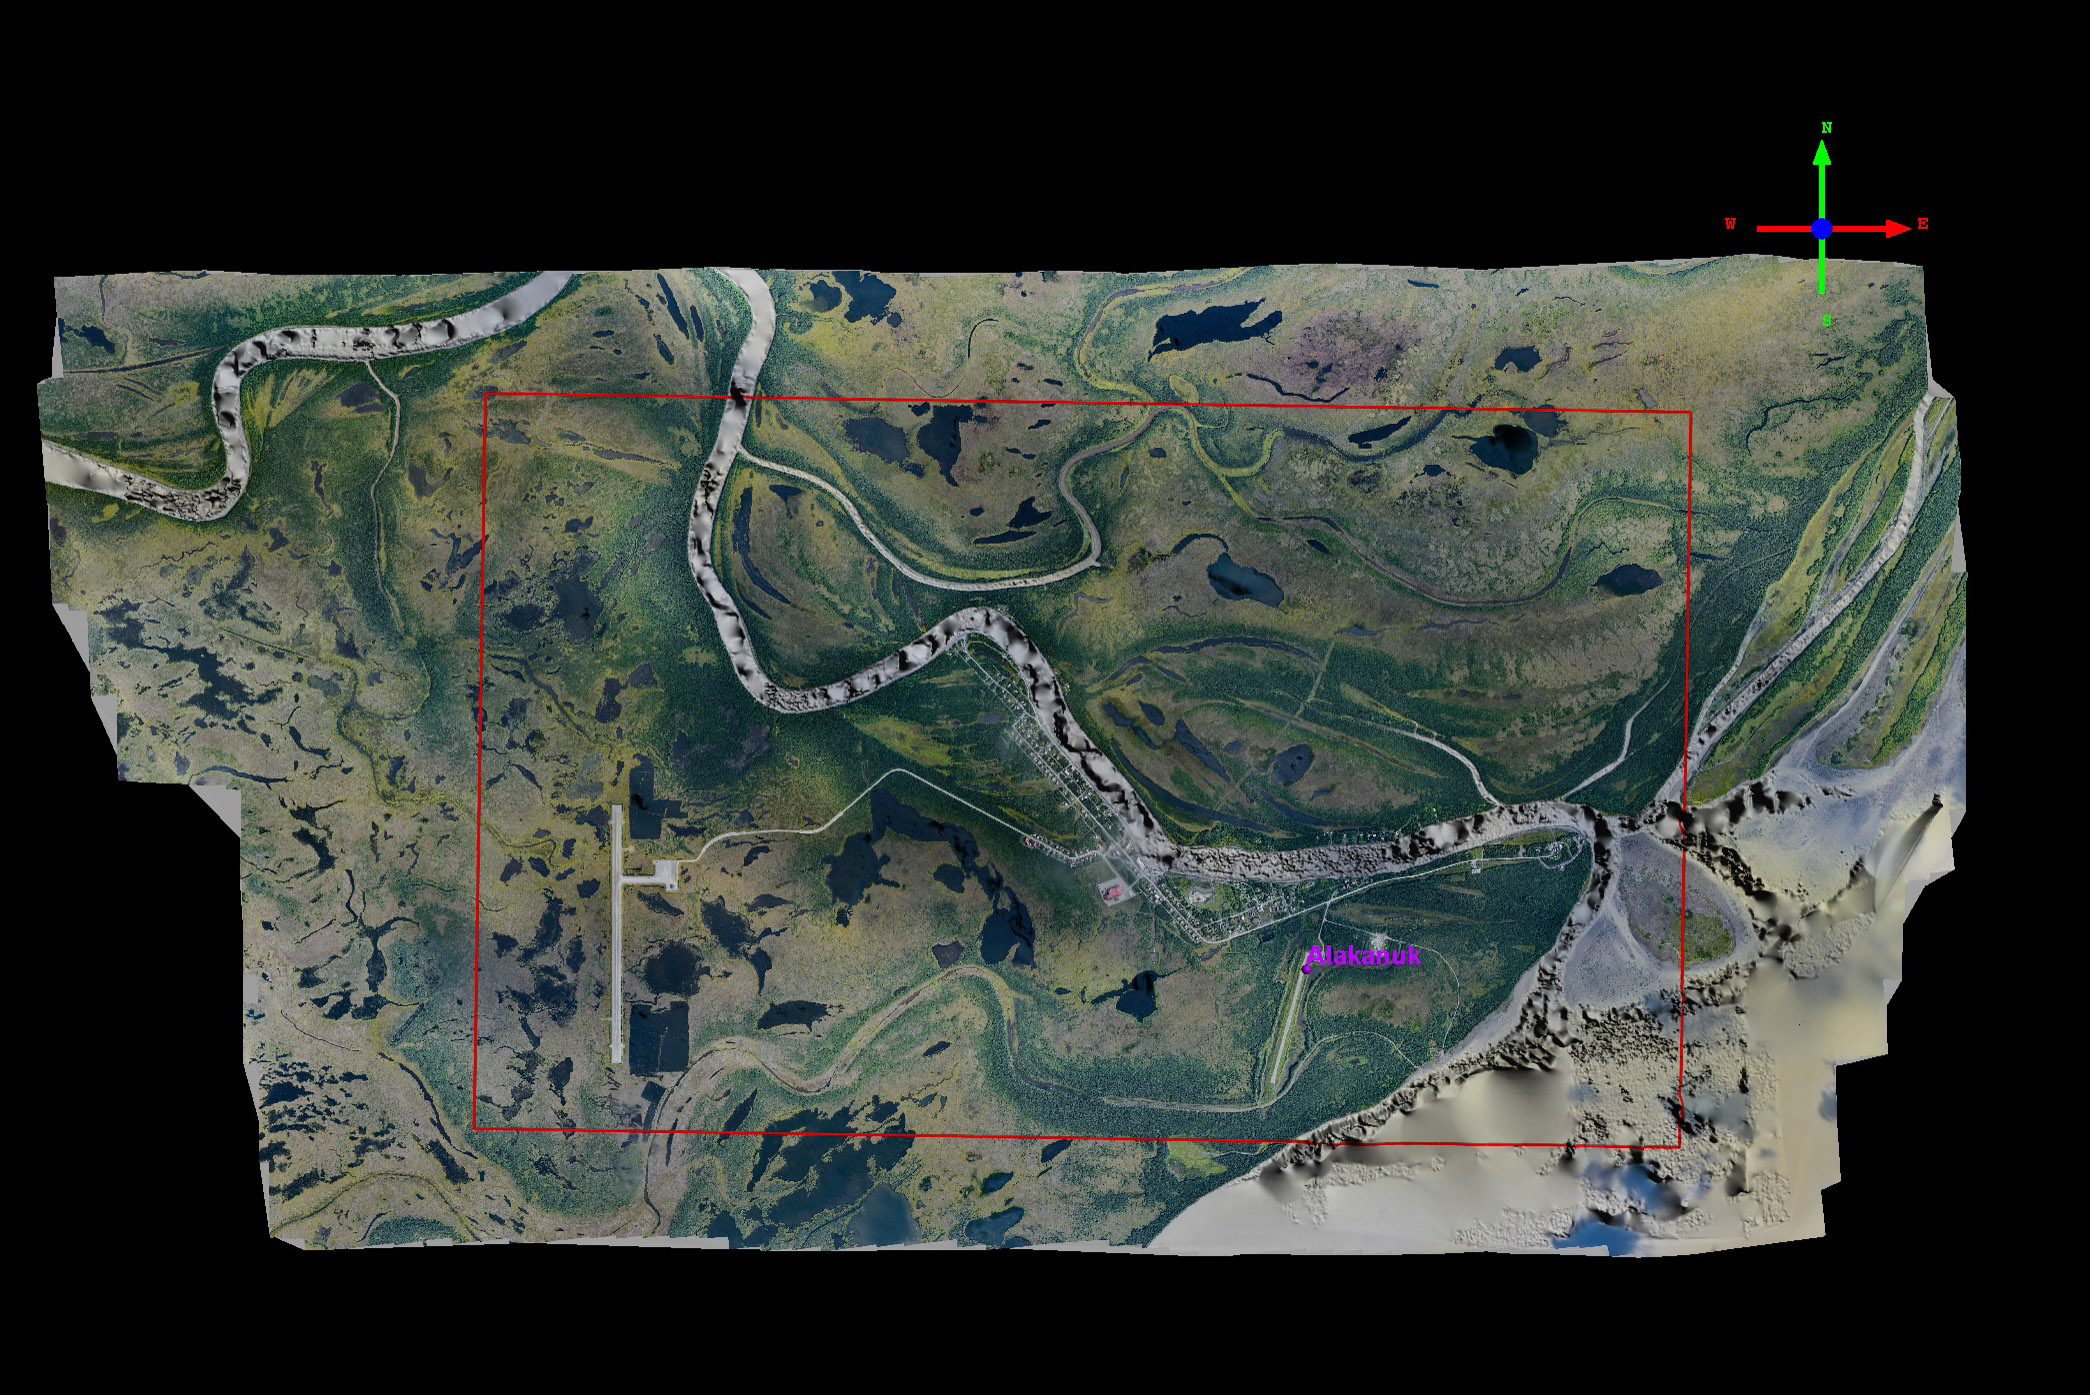
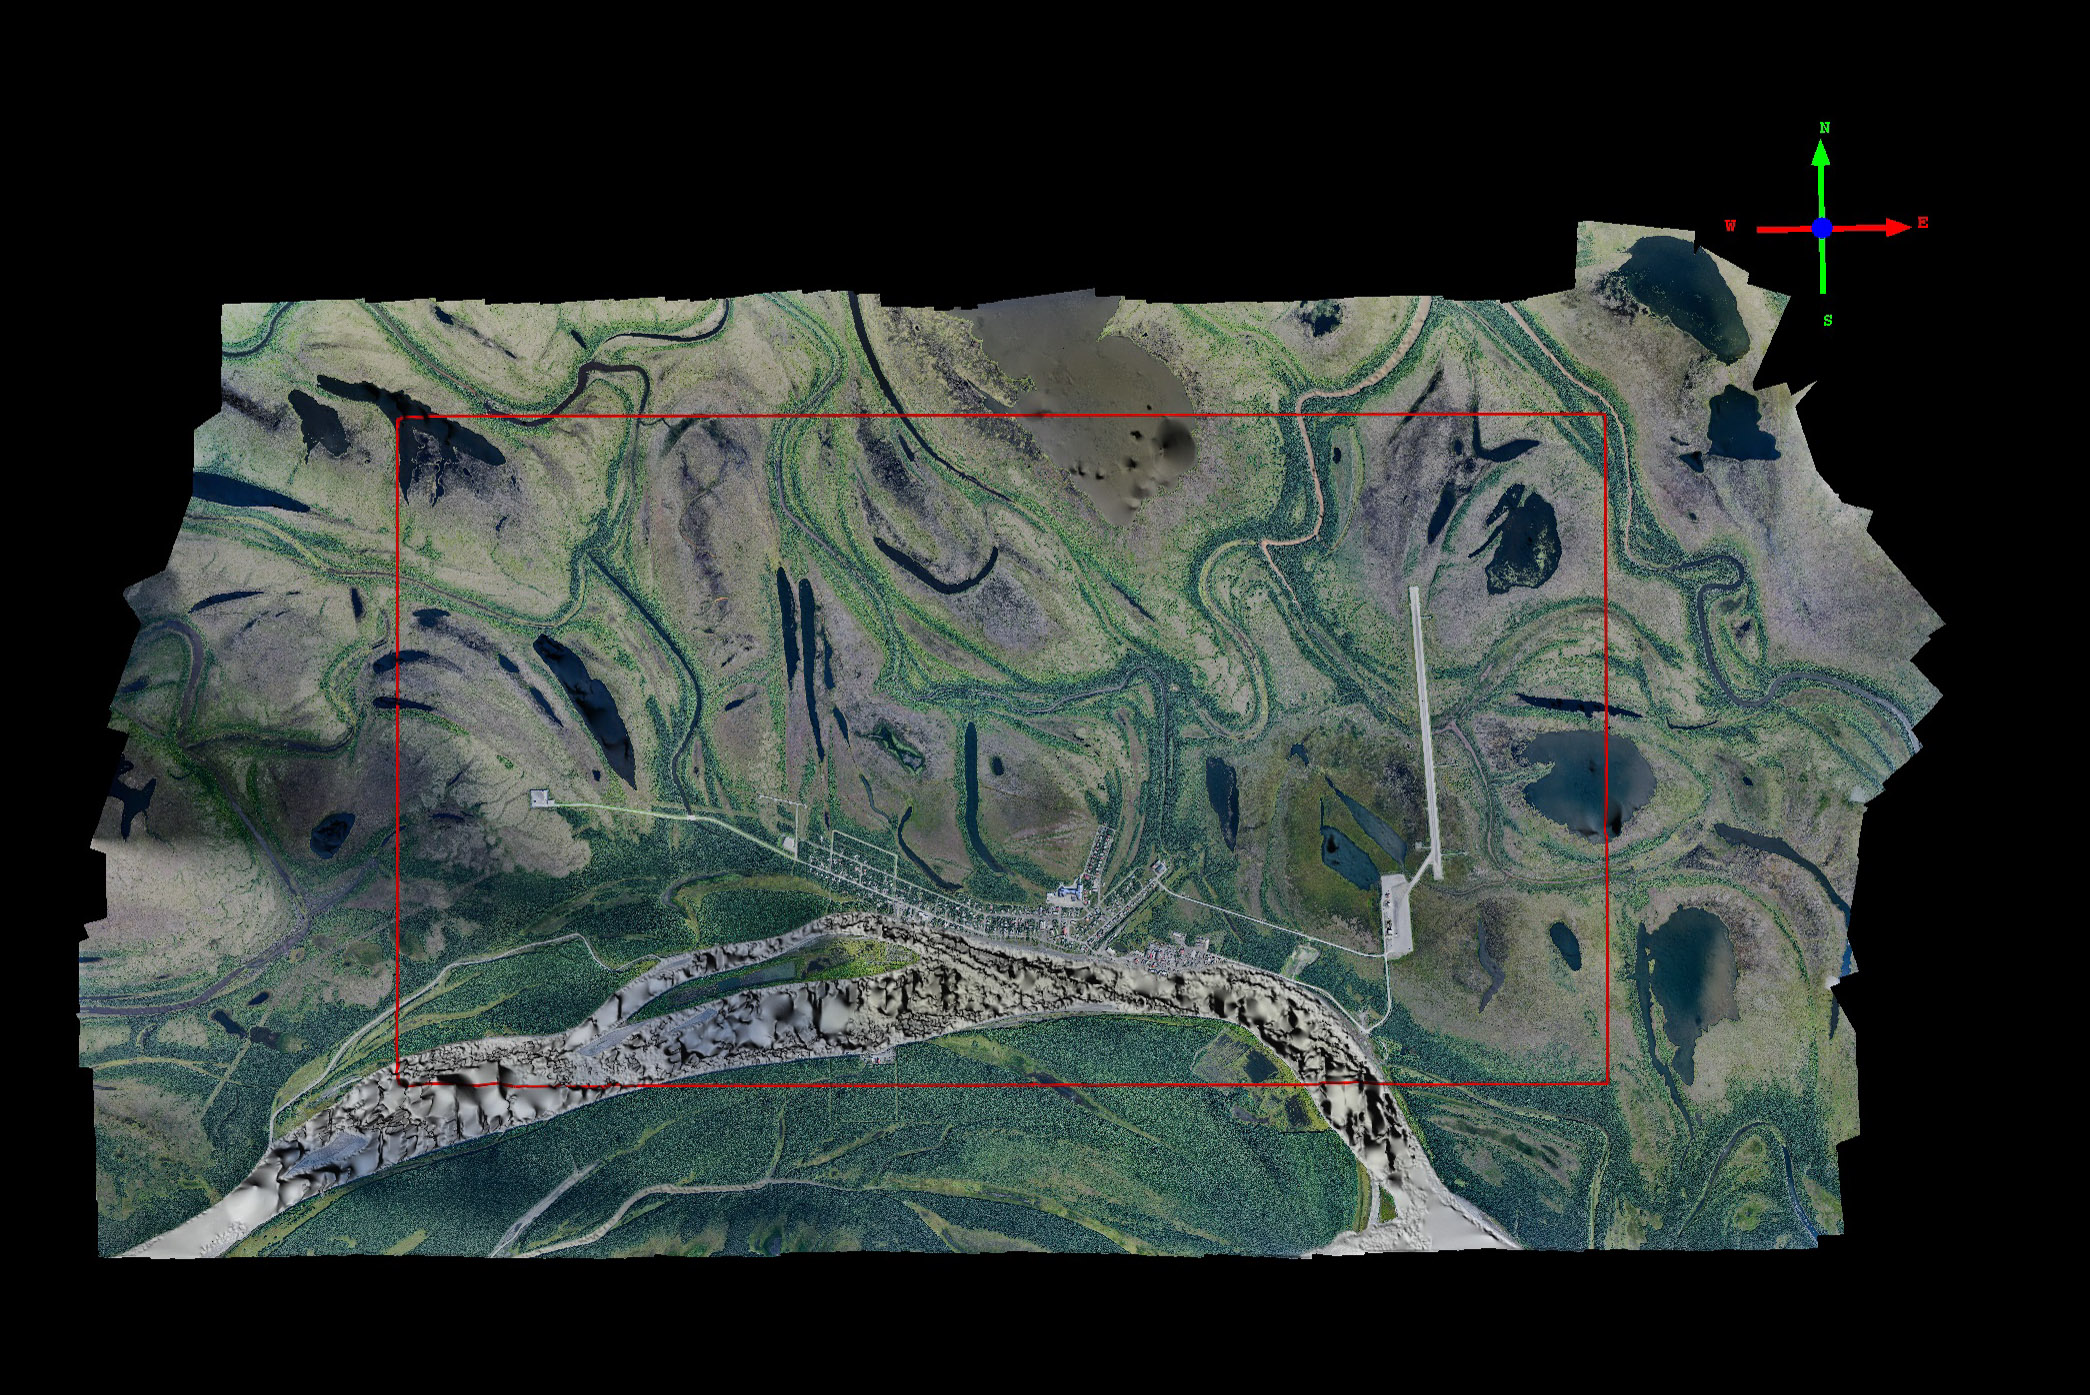
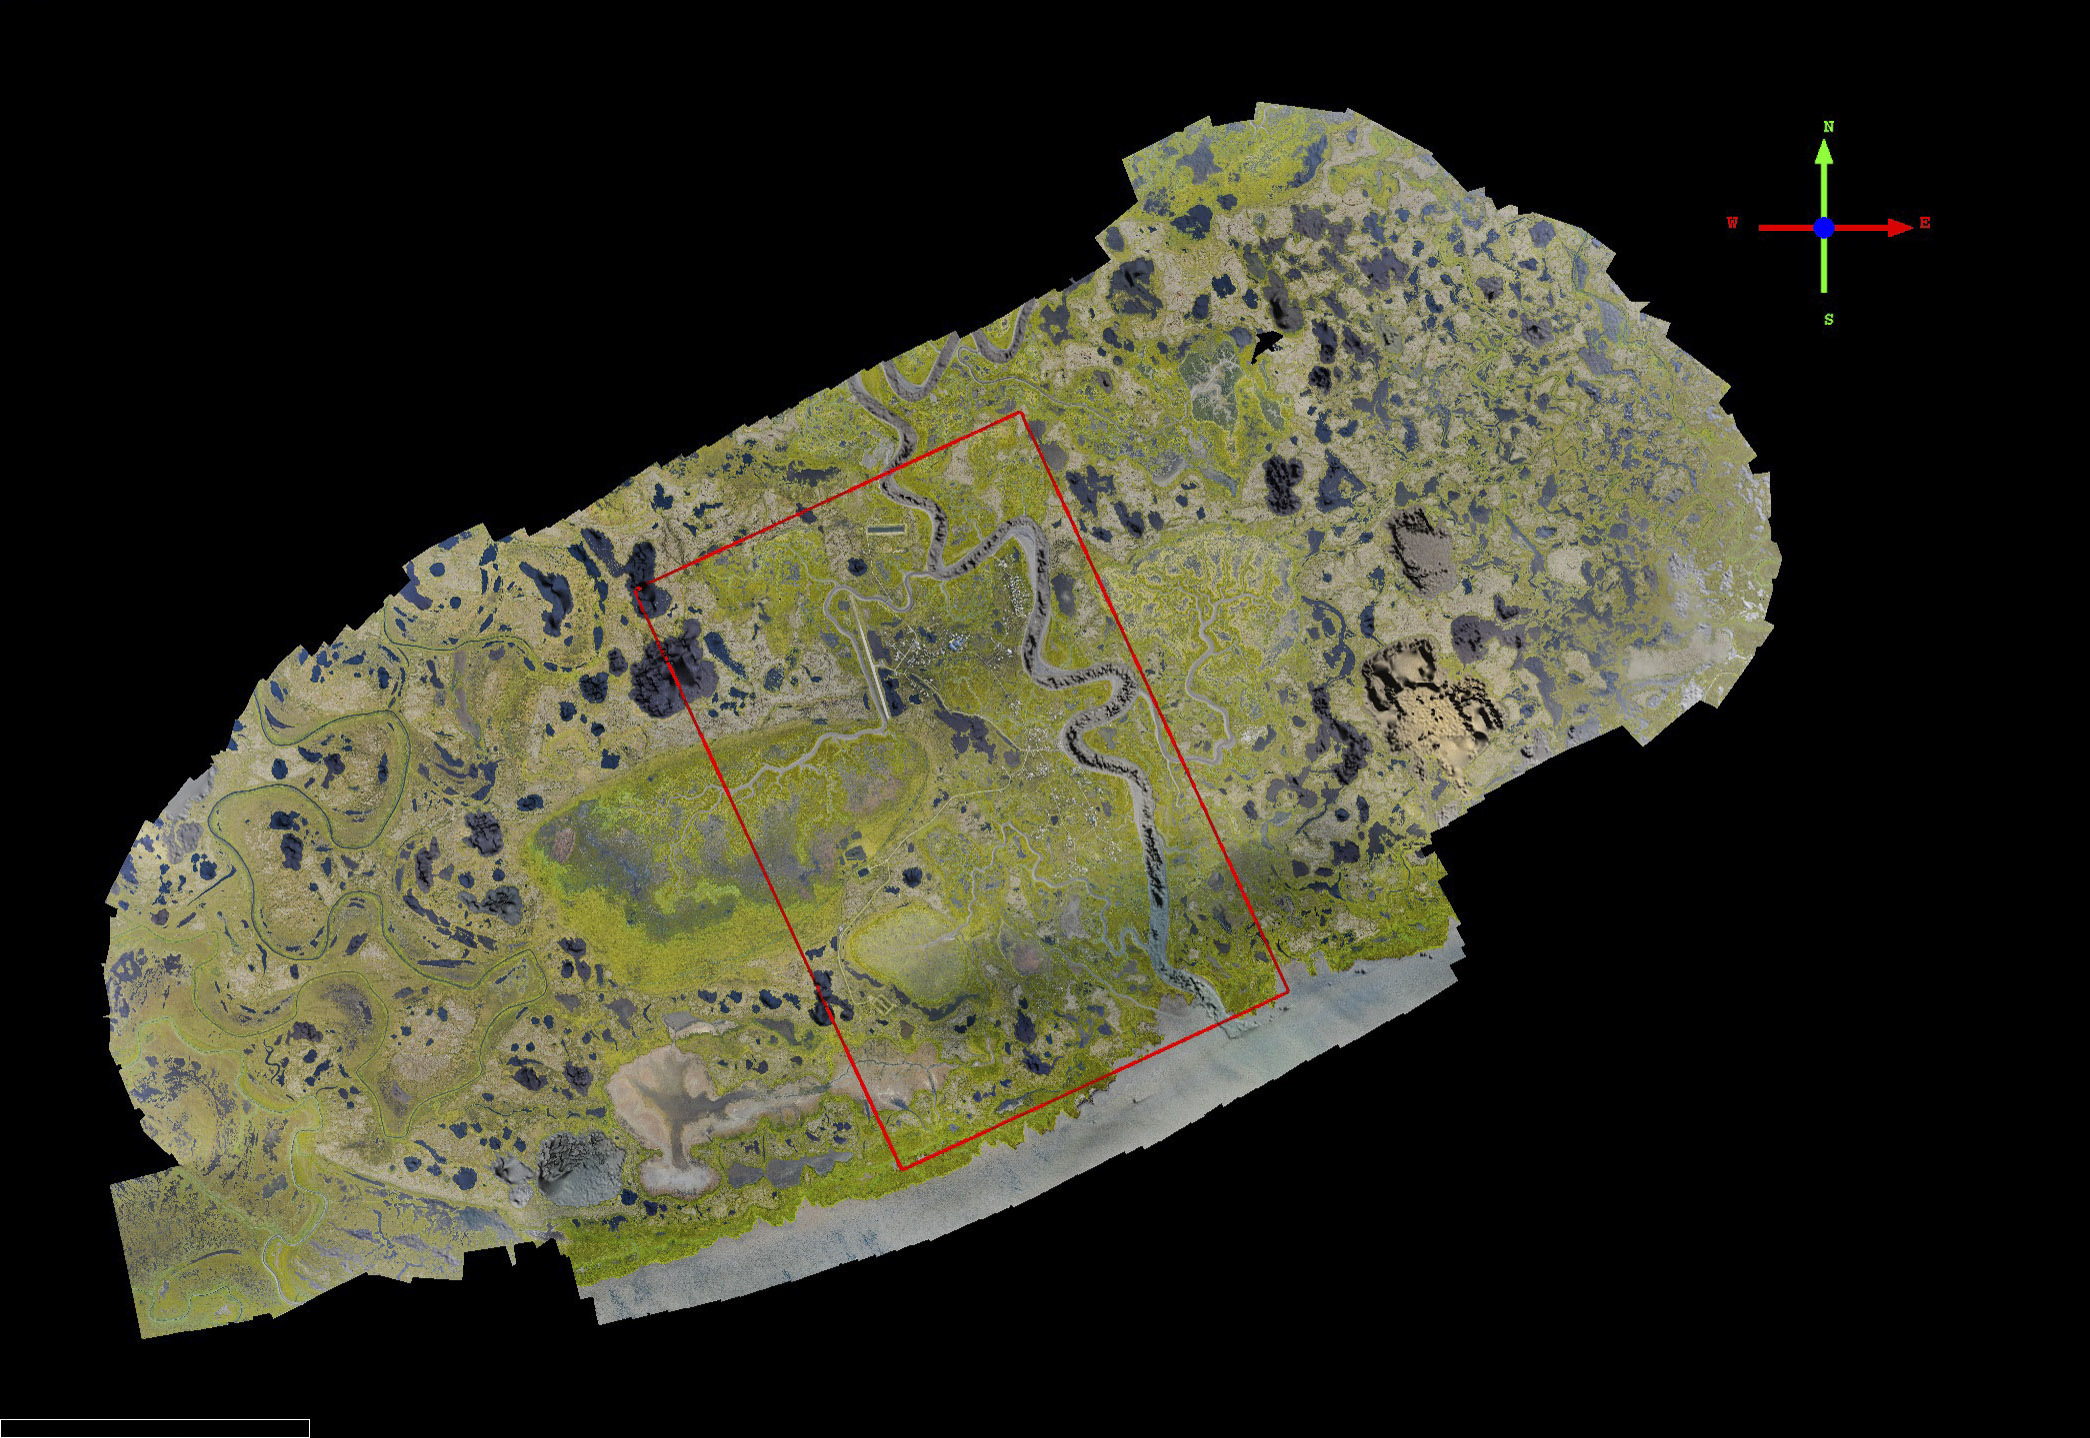
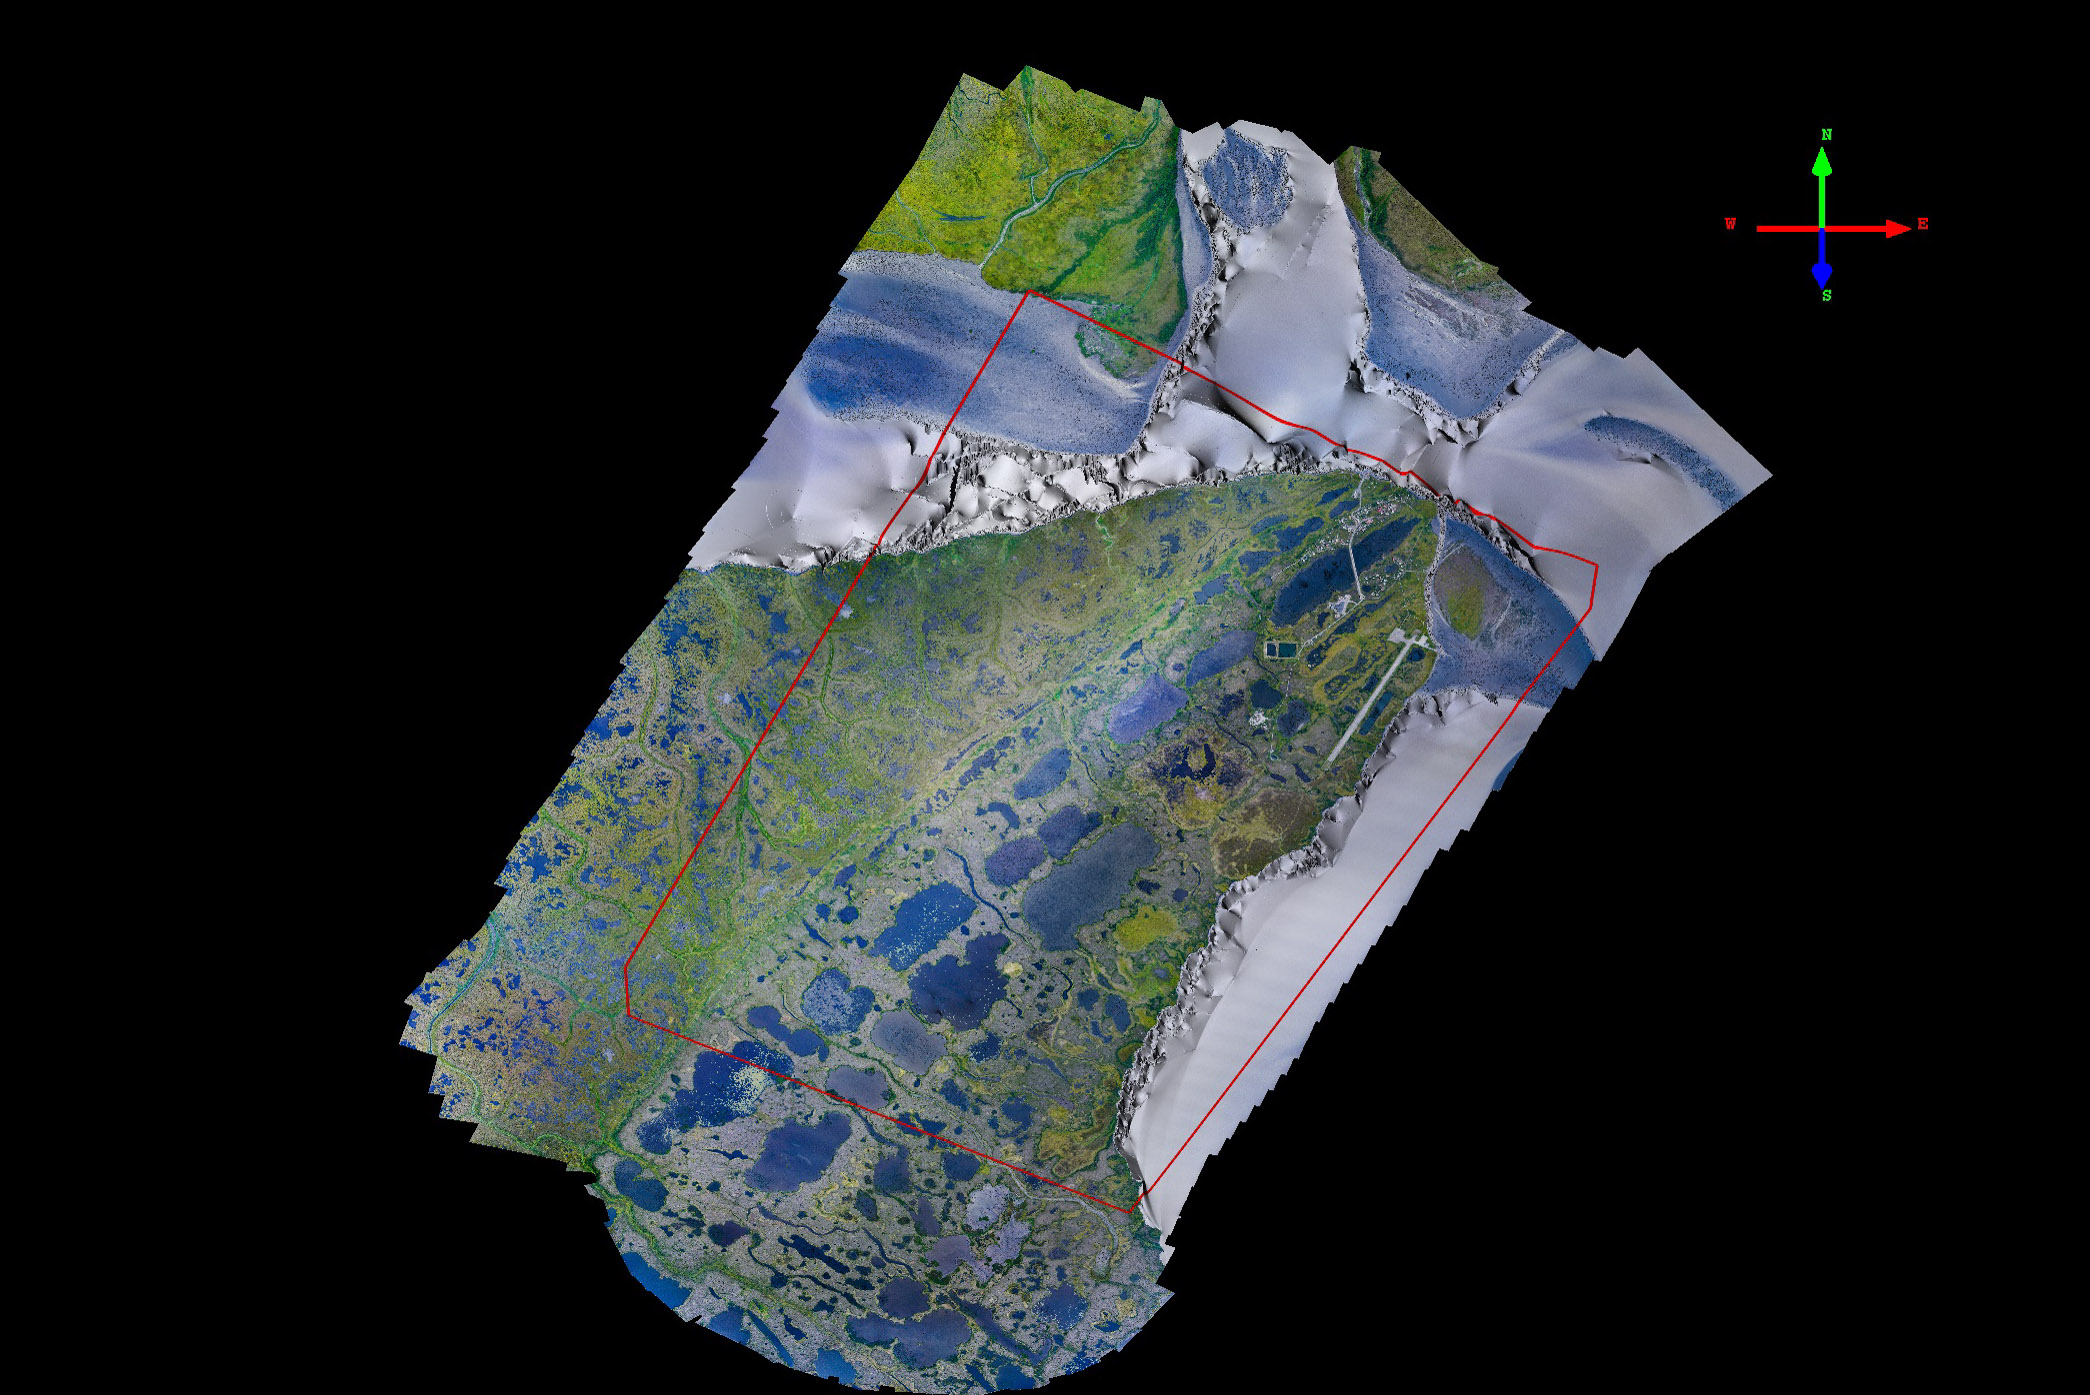
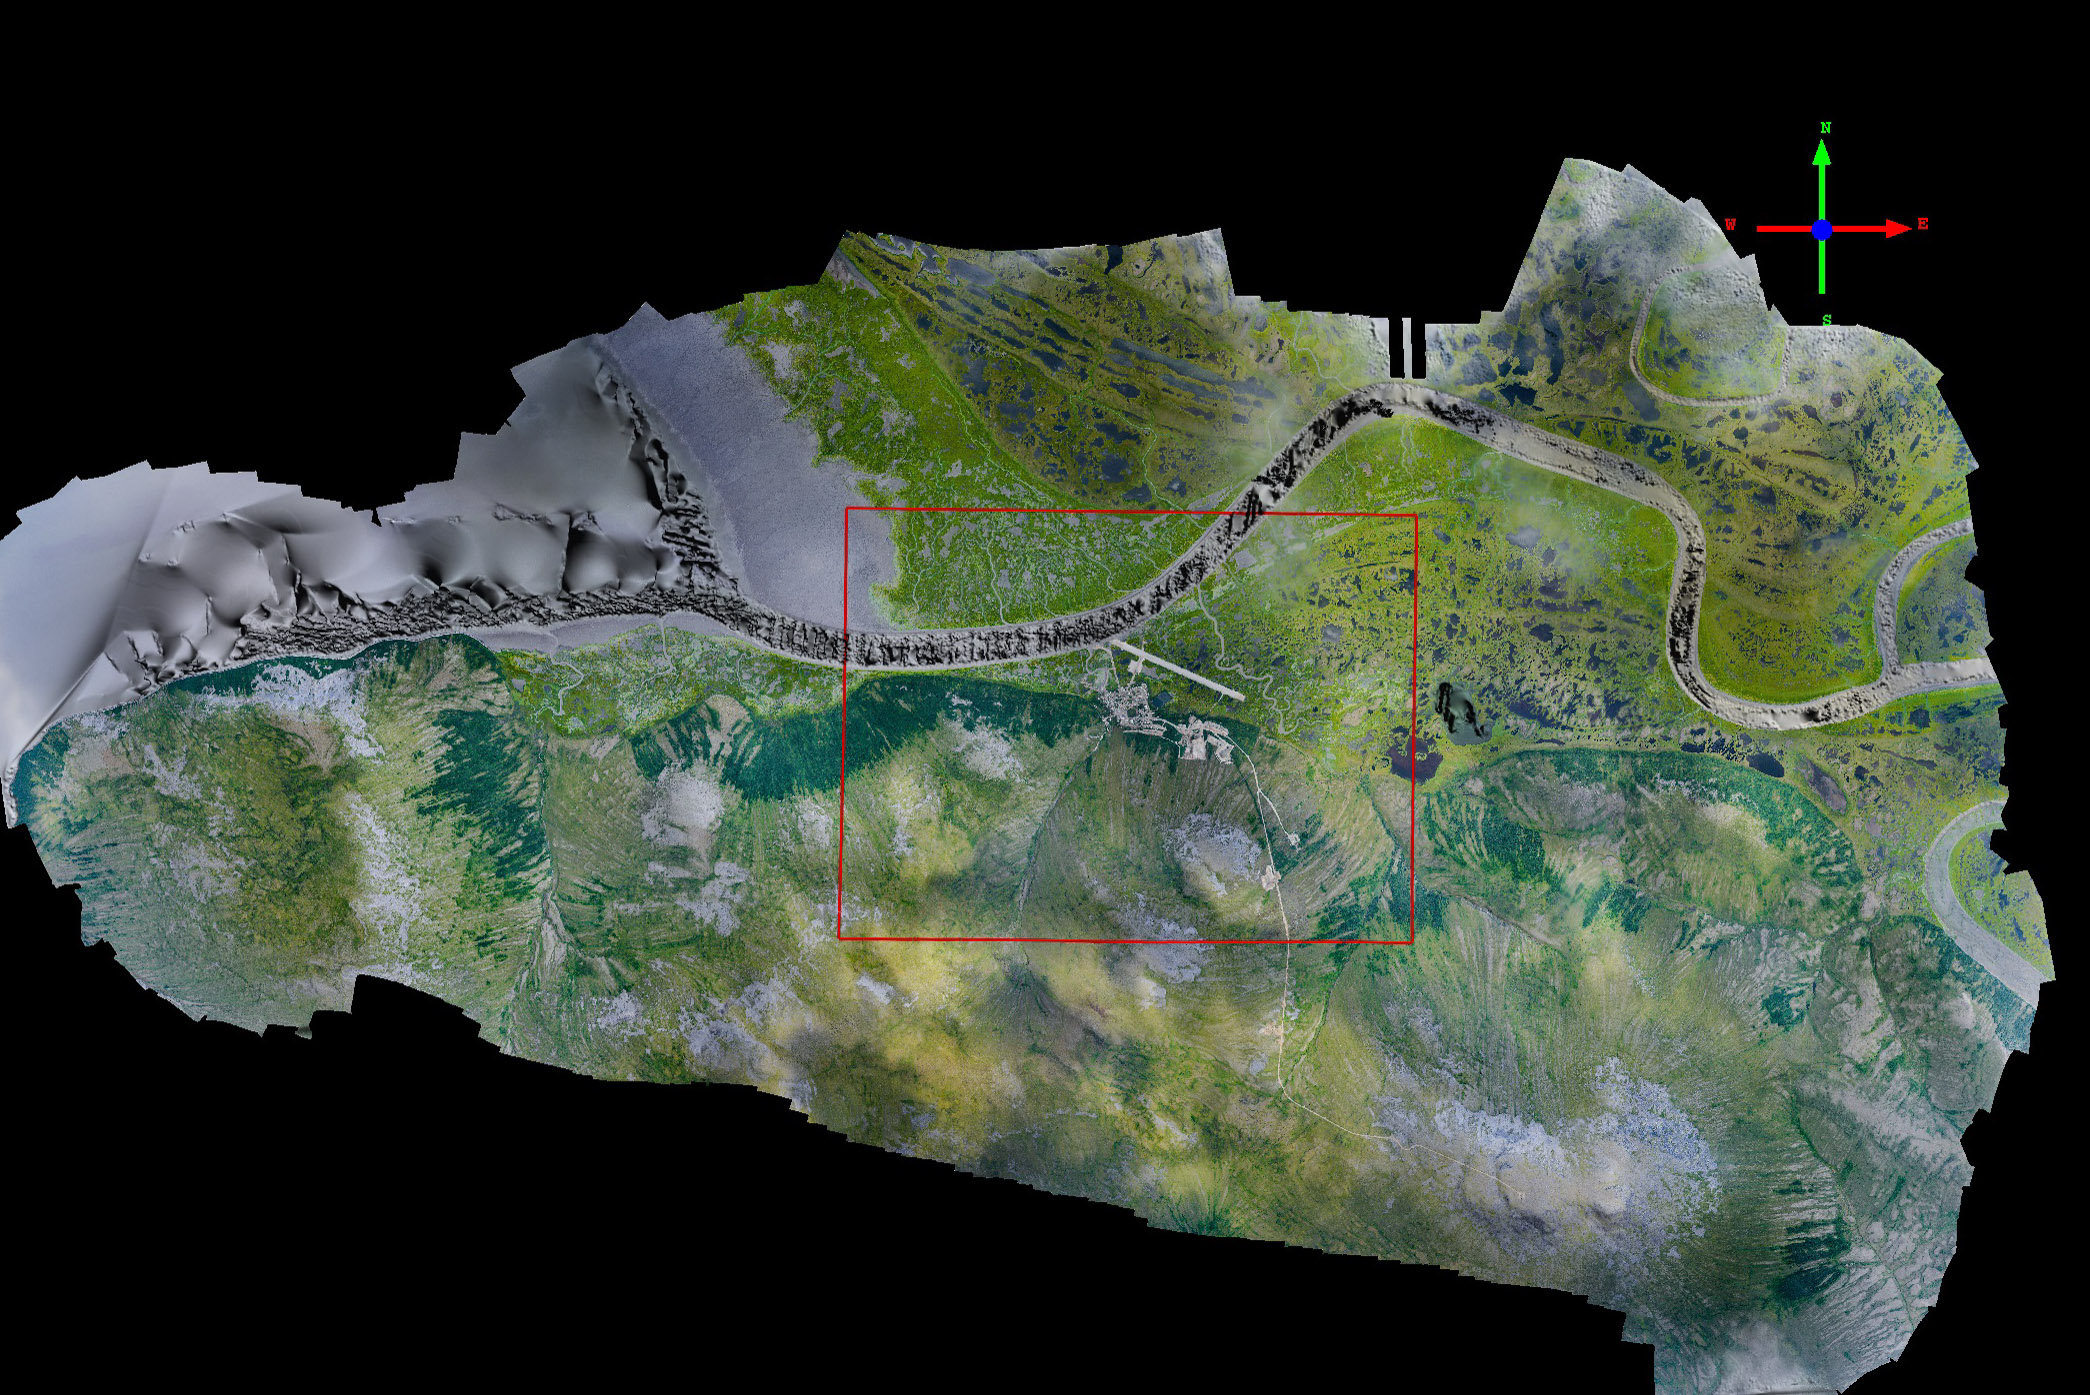
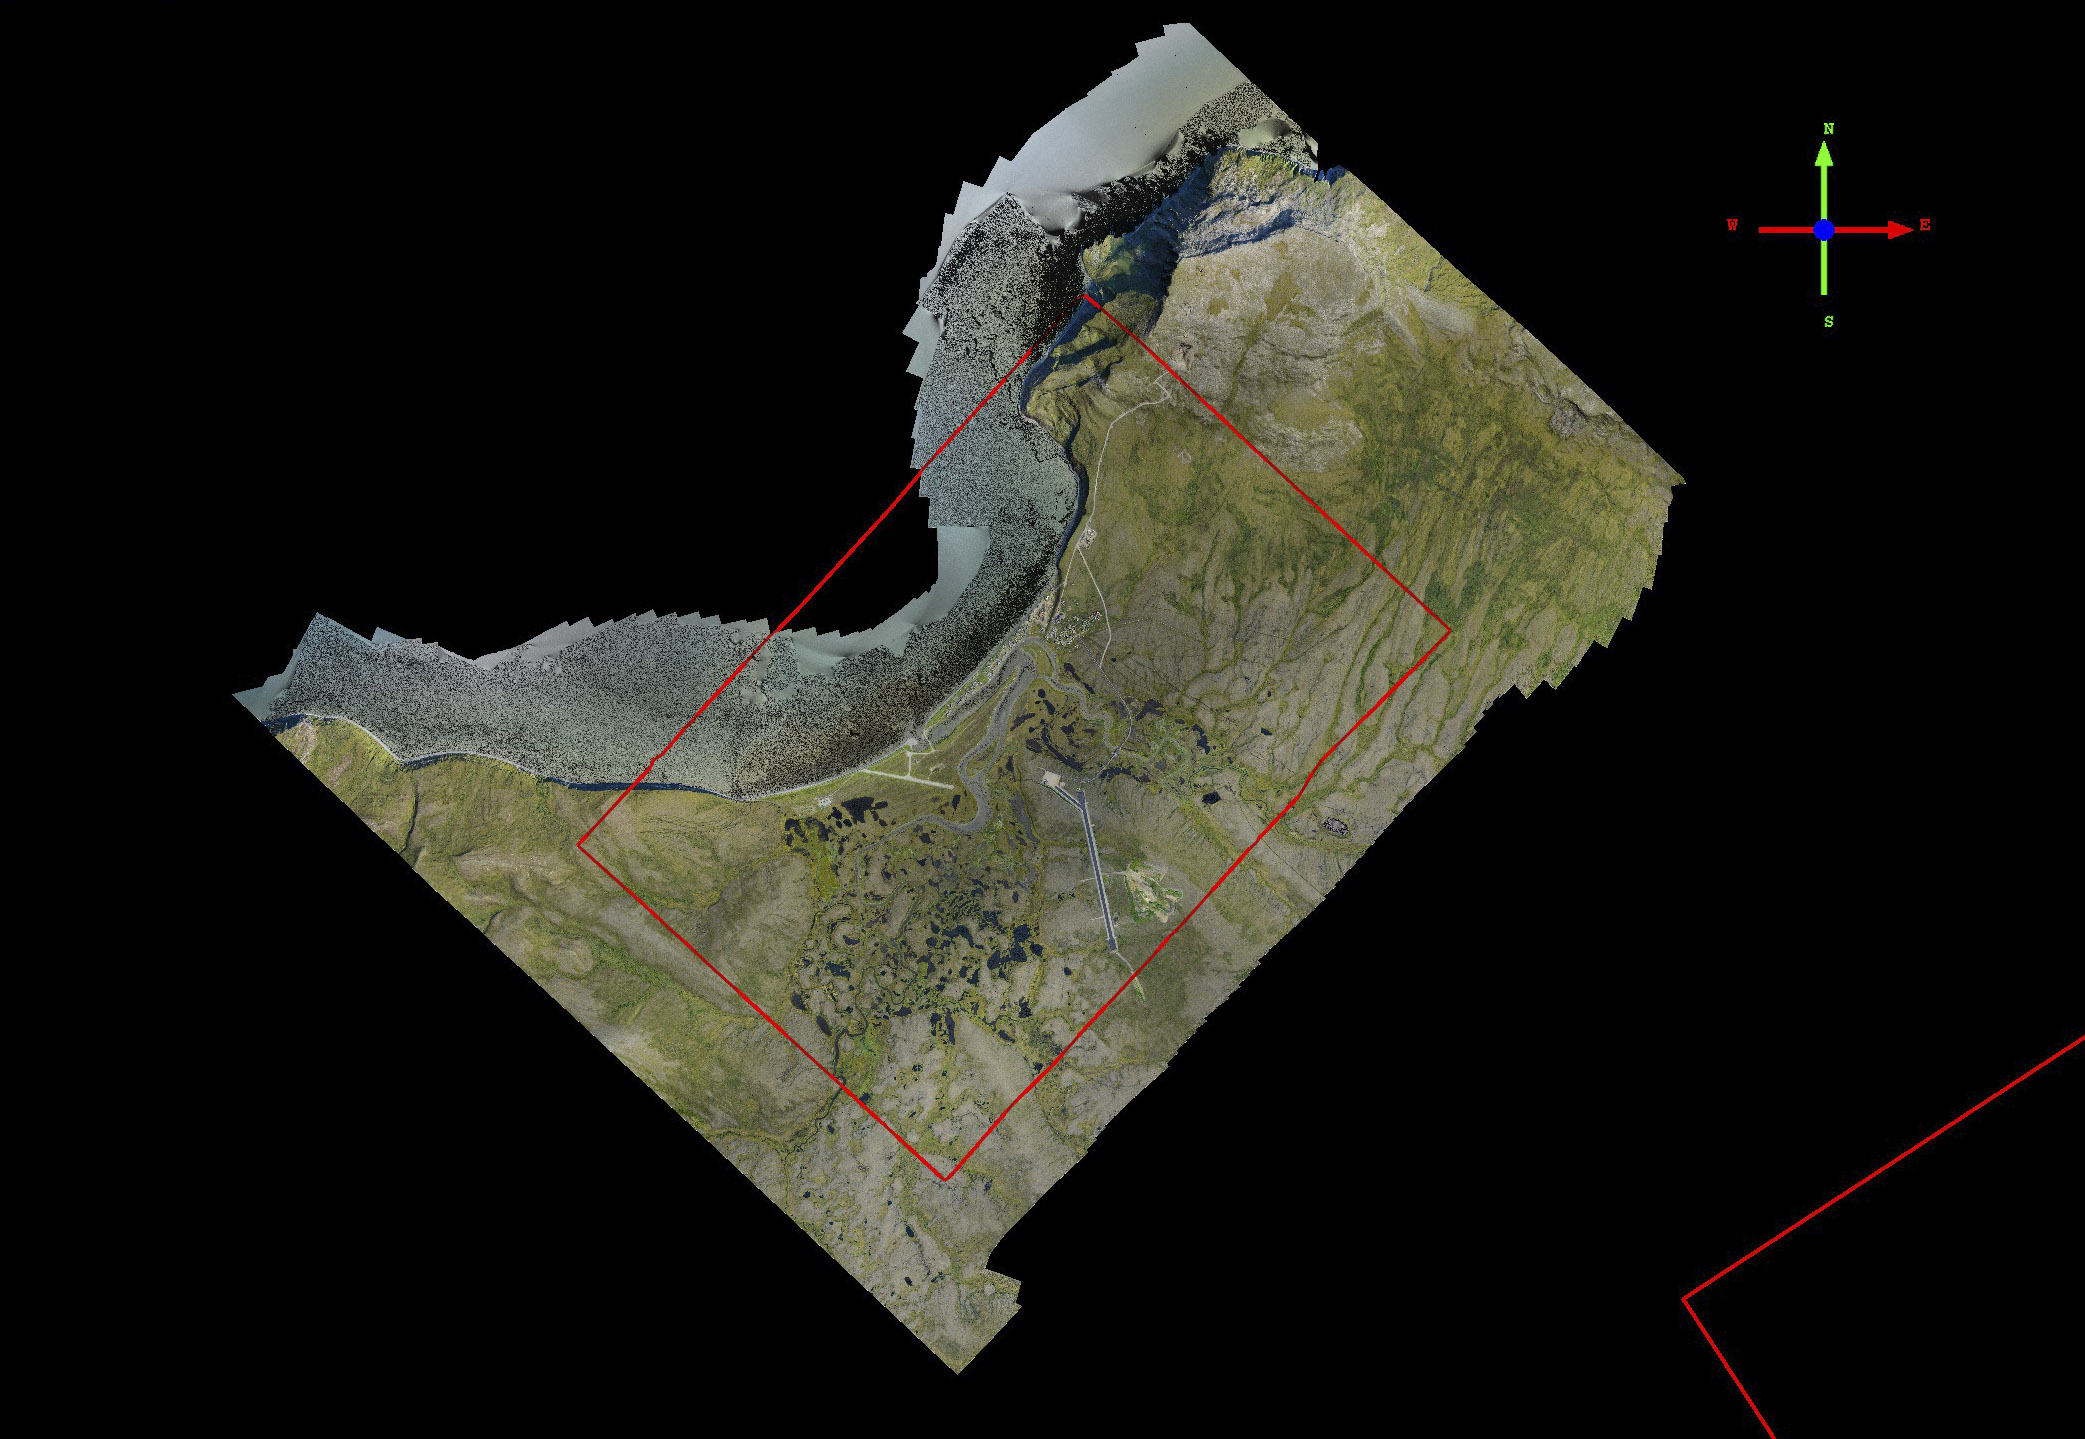
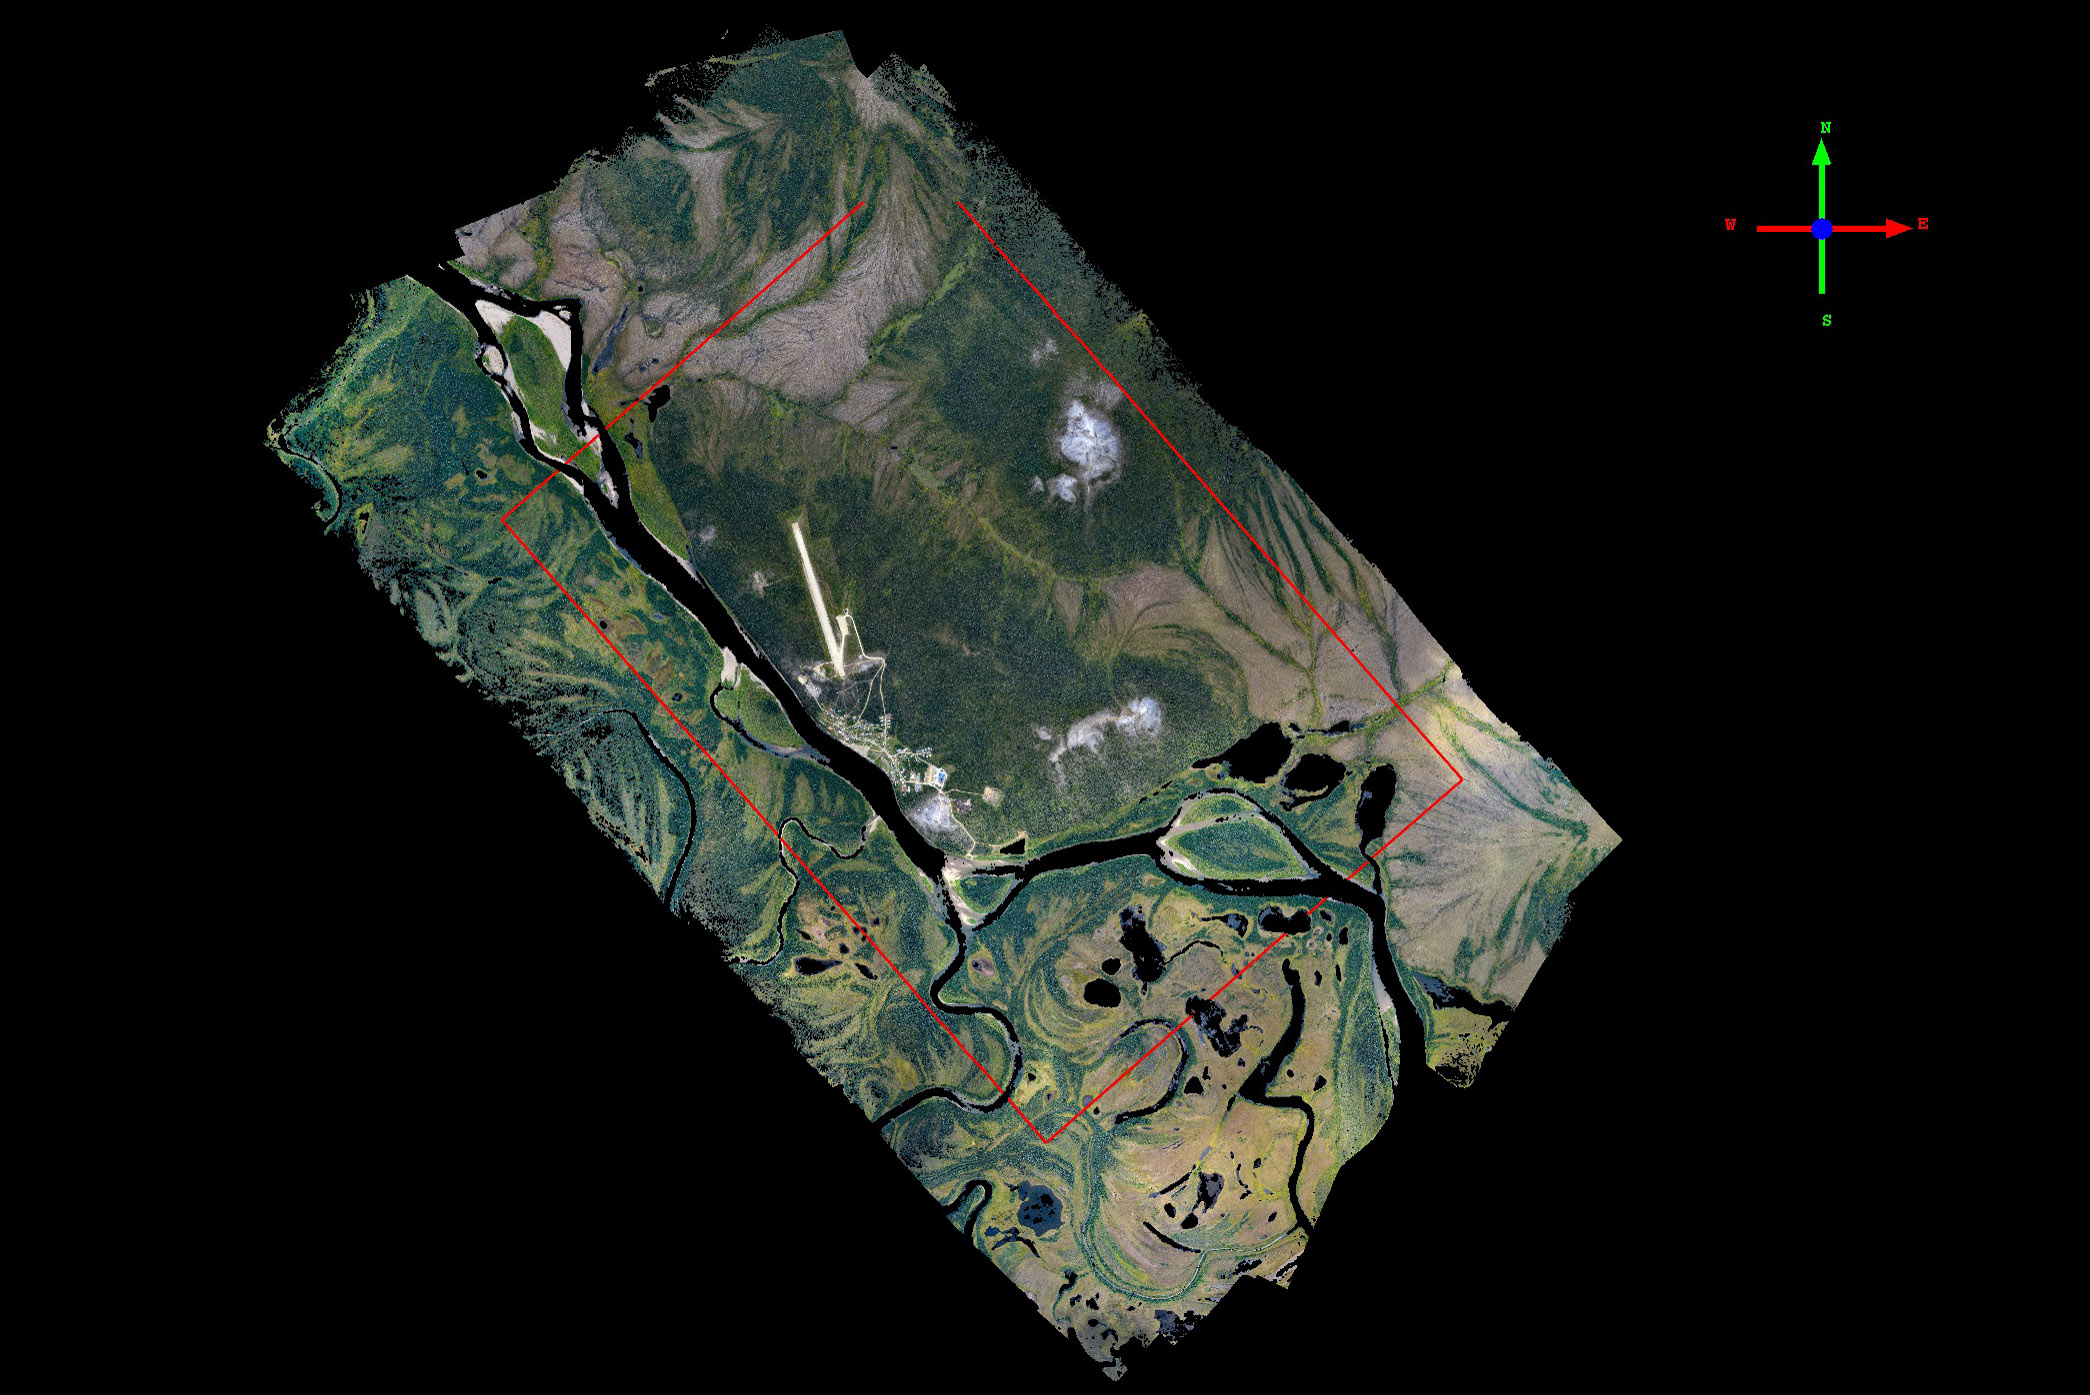
Here the red rectangle is the village boundary specified in the contract. As can be seen here and in all the subsequent visualizations, we acquired and delivered a lot more than this. Mouse-over to see the topography, color-coded with height (red-high, blue-low).
Here is the old runway at Alakanuk. You can still see the crown. The marker is one of our GCPs, set within the “X” indicating to pilots that this runway is no longer in use.
You can learn more about the acquisition of the Alakanuk data here.
Brevig Mission
Brevig Mission is just north of Teller and set within a common village outline. It is set in a spectacular location. Others must realize this, as there was a lot of new home construction going on this summer.
The houses at left are still under construction. I like Brevig Mission, and not only because it has a cross-wind runway.
Here you can see small wave-cut scarps, small gullies draining the tundra into the ocean, power poles, roads, runways, and some cool permafrost features, both as an image and topography.
You can learn more about the acquisition of the Brevig Mission data here and here.
Cheevak
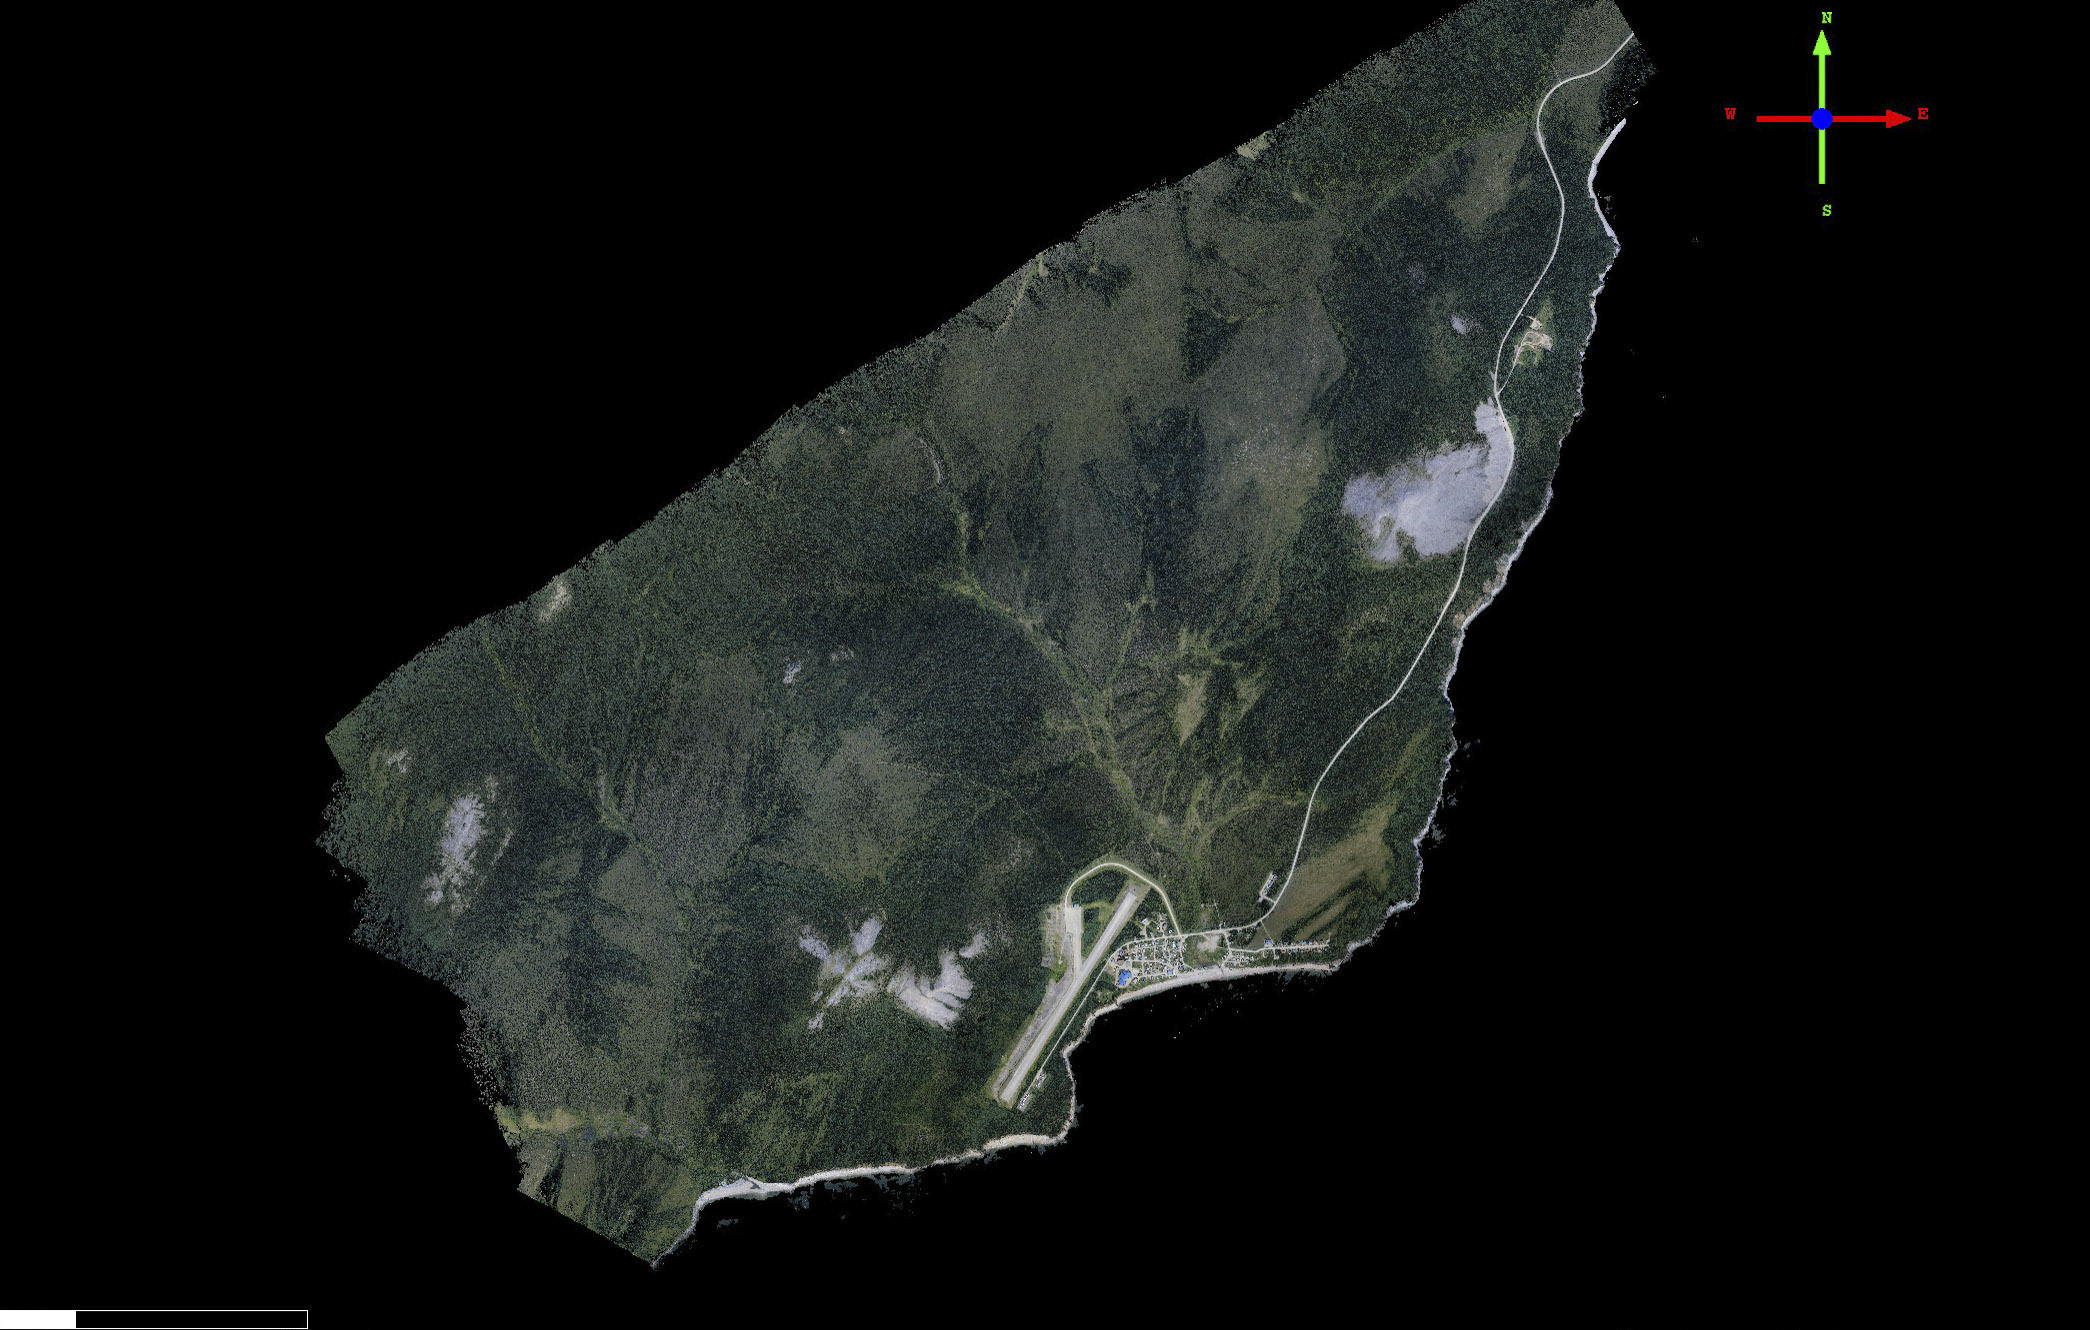
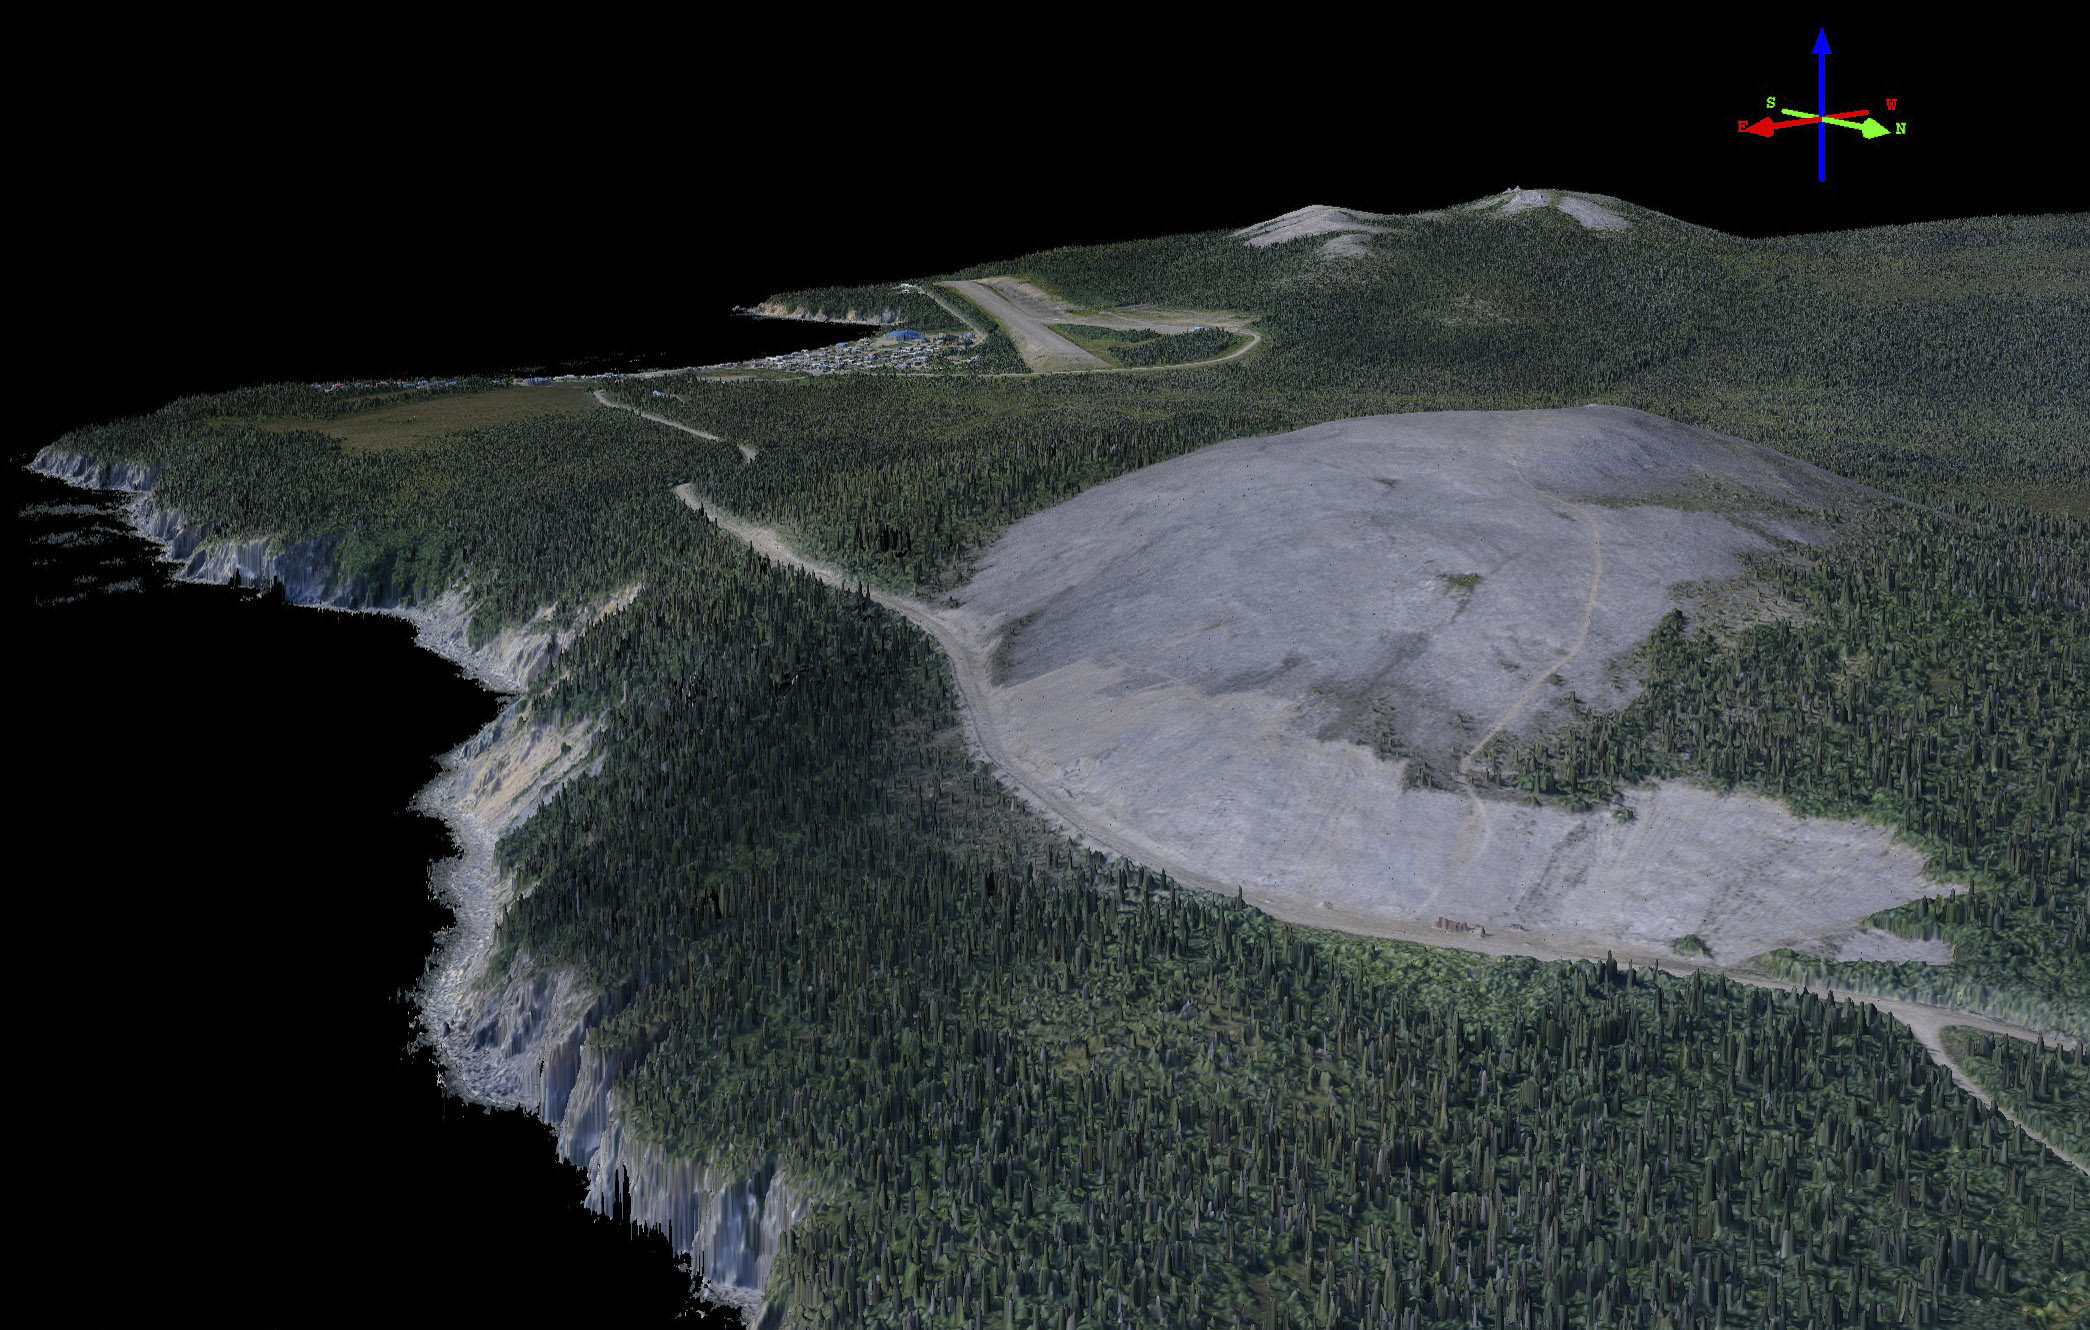
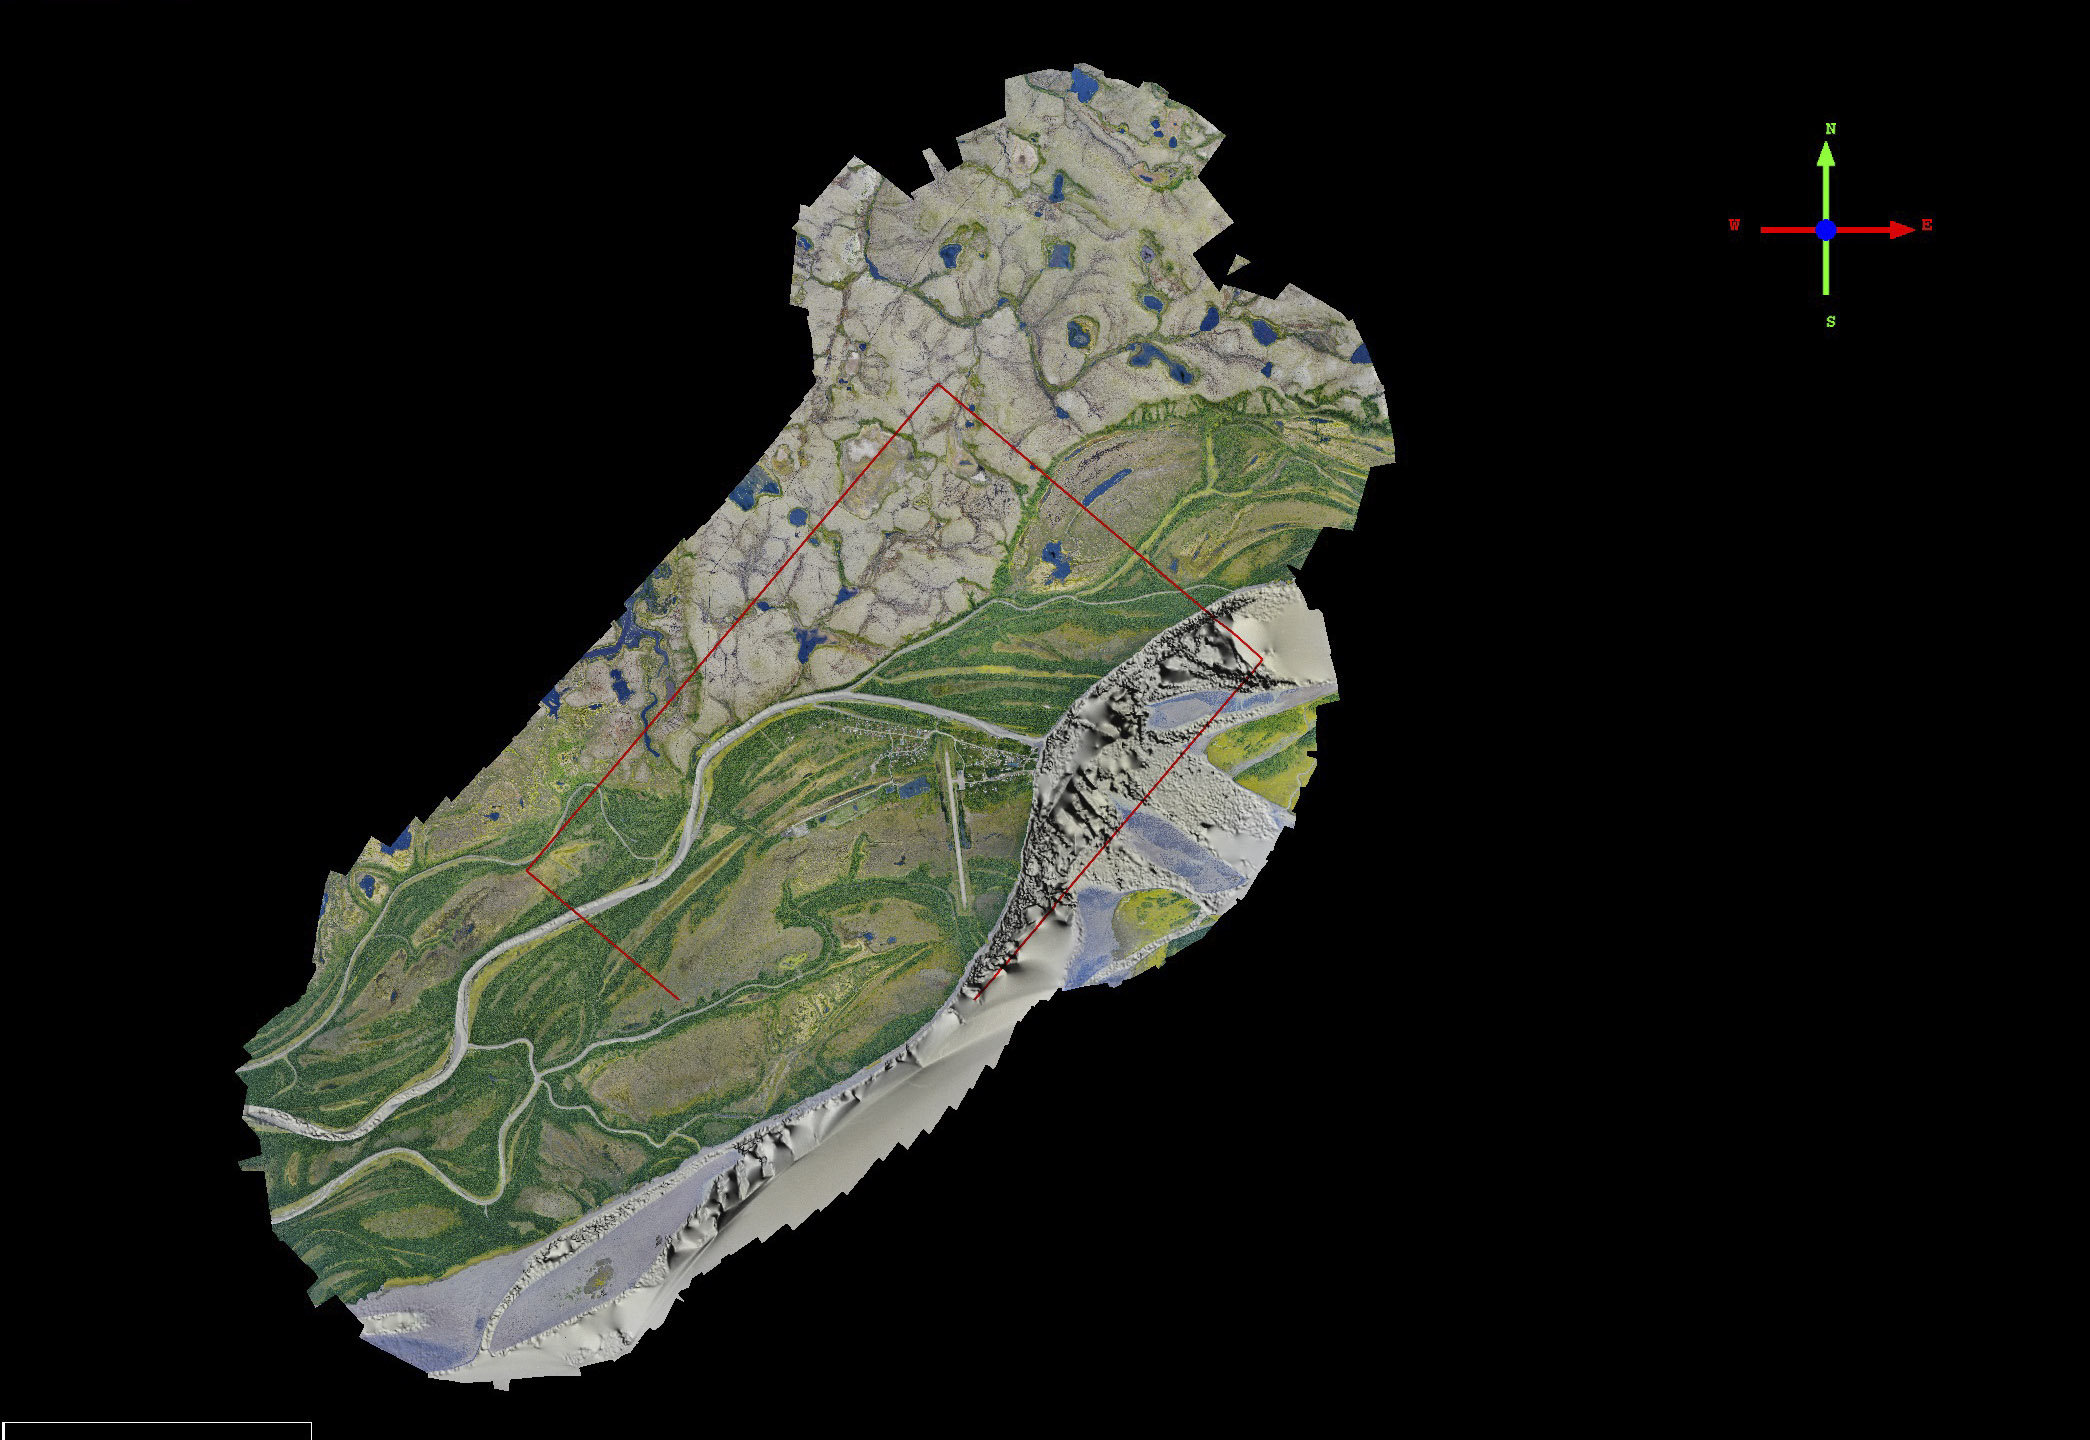
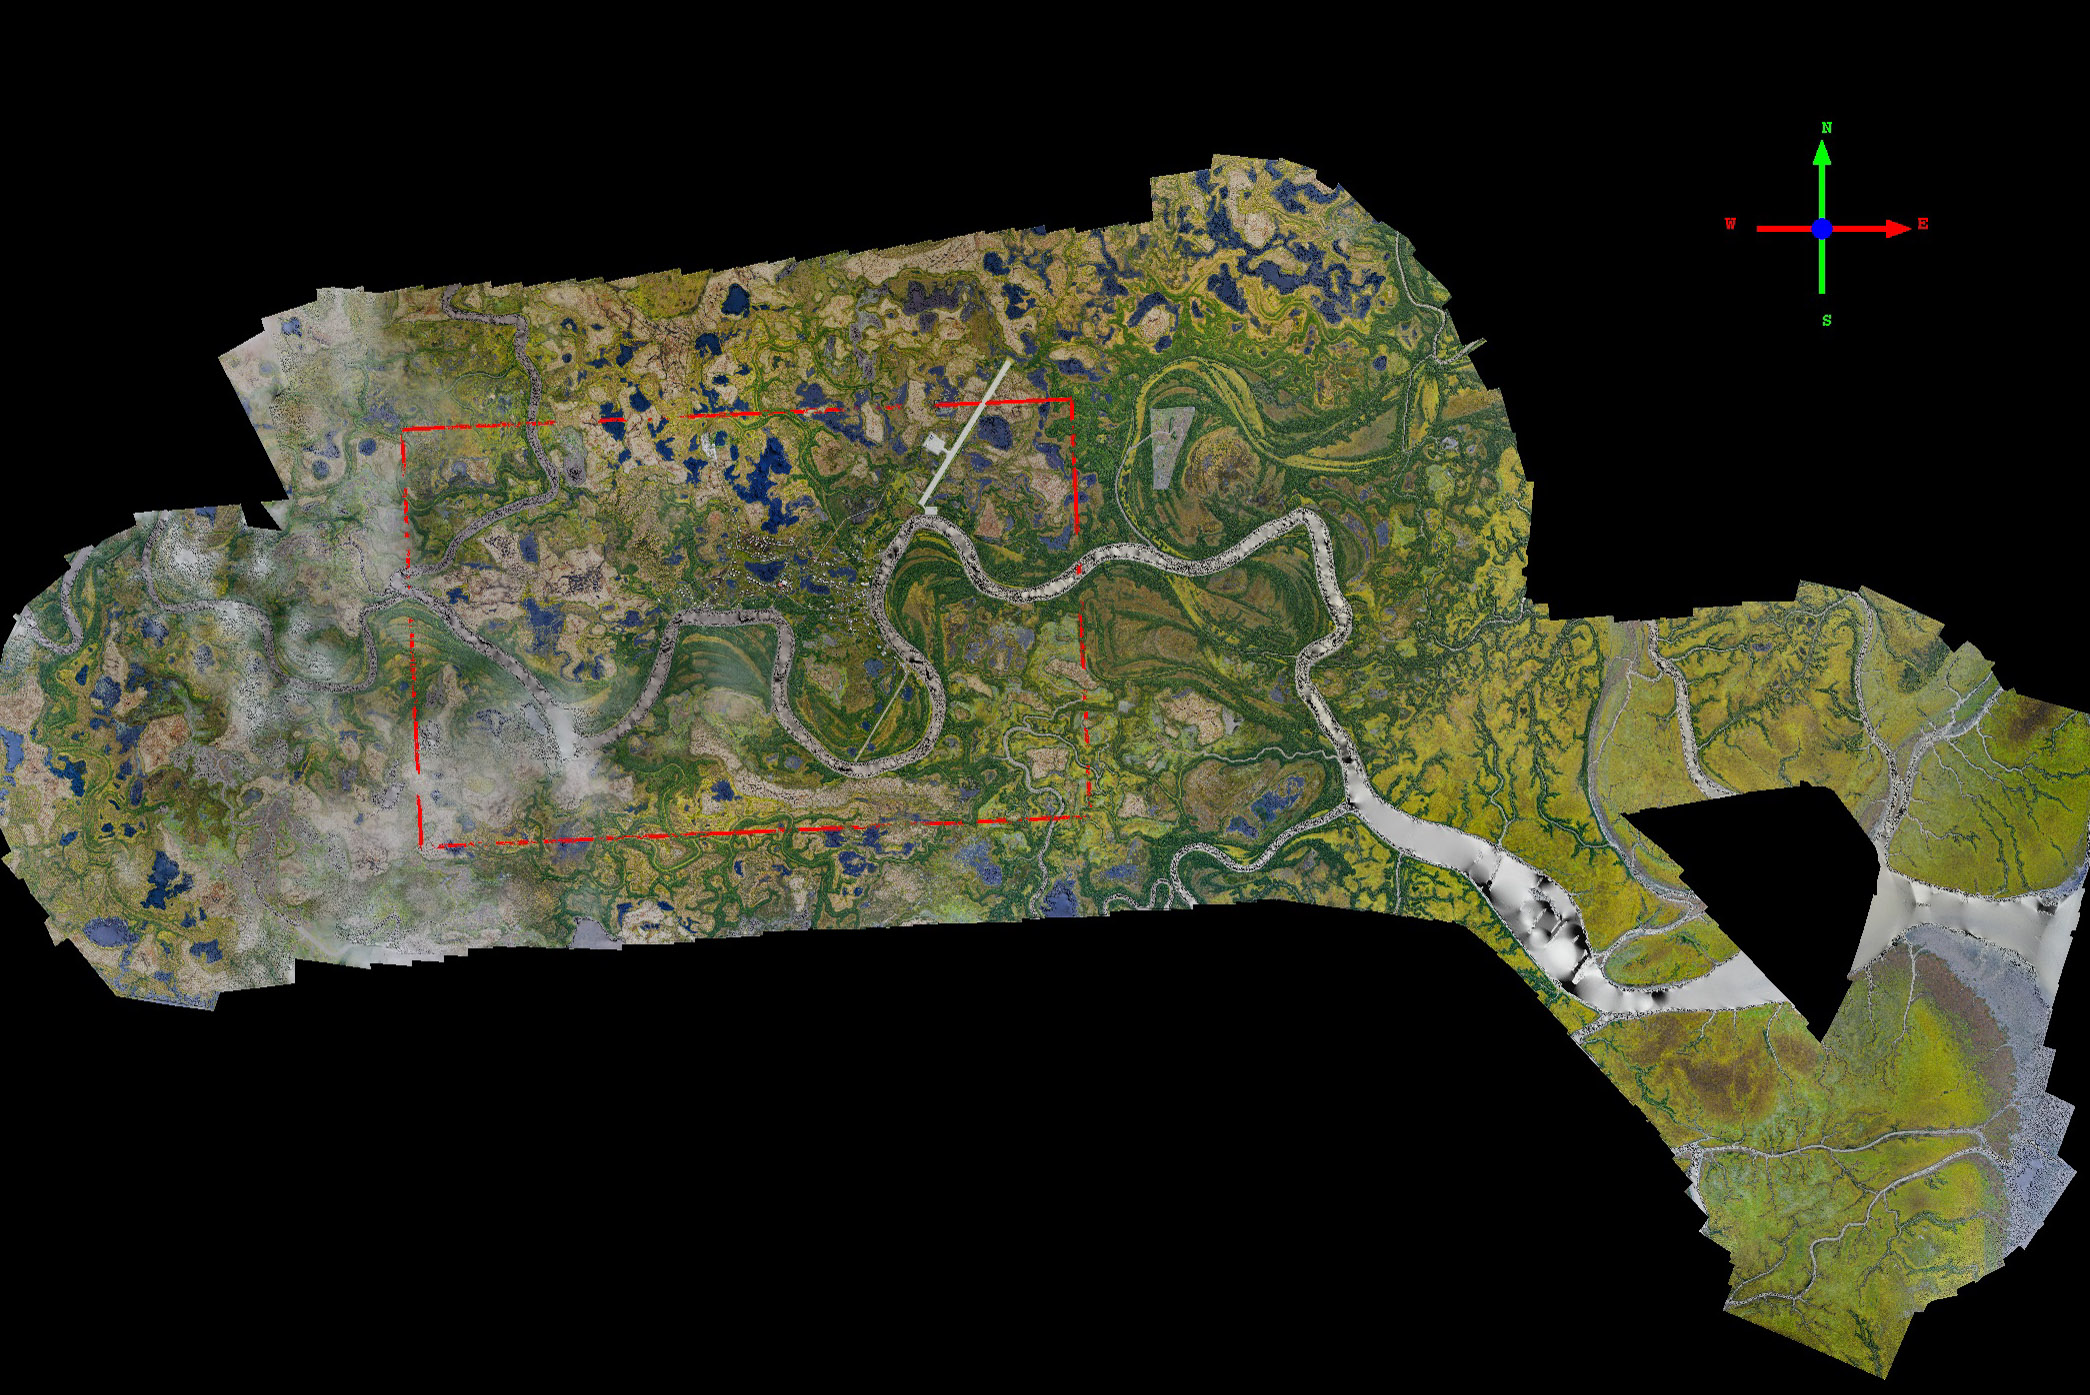
Cheevak is a bit inland, thus the swath at bottom connecting it to the coast. The town and runway are essentially on an island, which you can see by mousing-over.
Here is a close up of the runway. Unless you saw the topography underneath (mouse over), you couldn’t tell why it built in this spot from the air. It’s just a bit higher than the surrounding swamps. The road at left leads to a gravel mine.
Despite being a few miles inland, Cheevak is still a boating community. If you look closely, you can see boat topography.
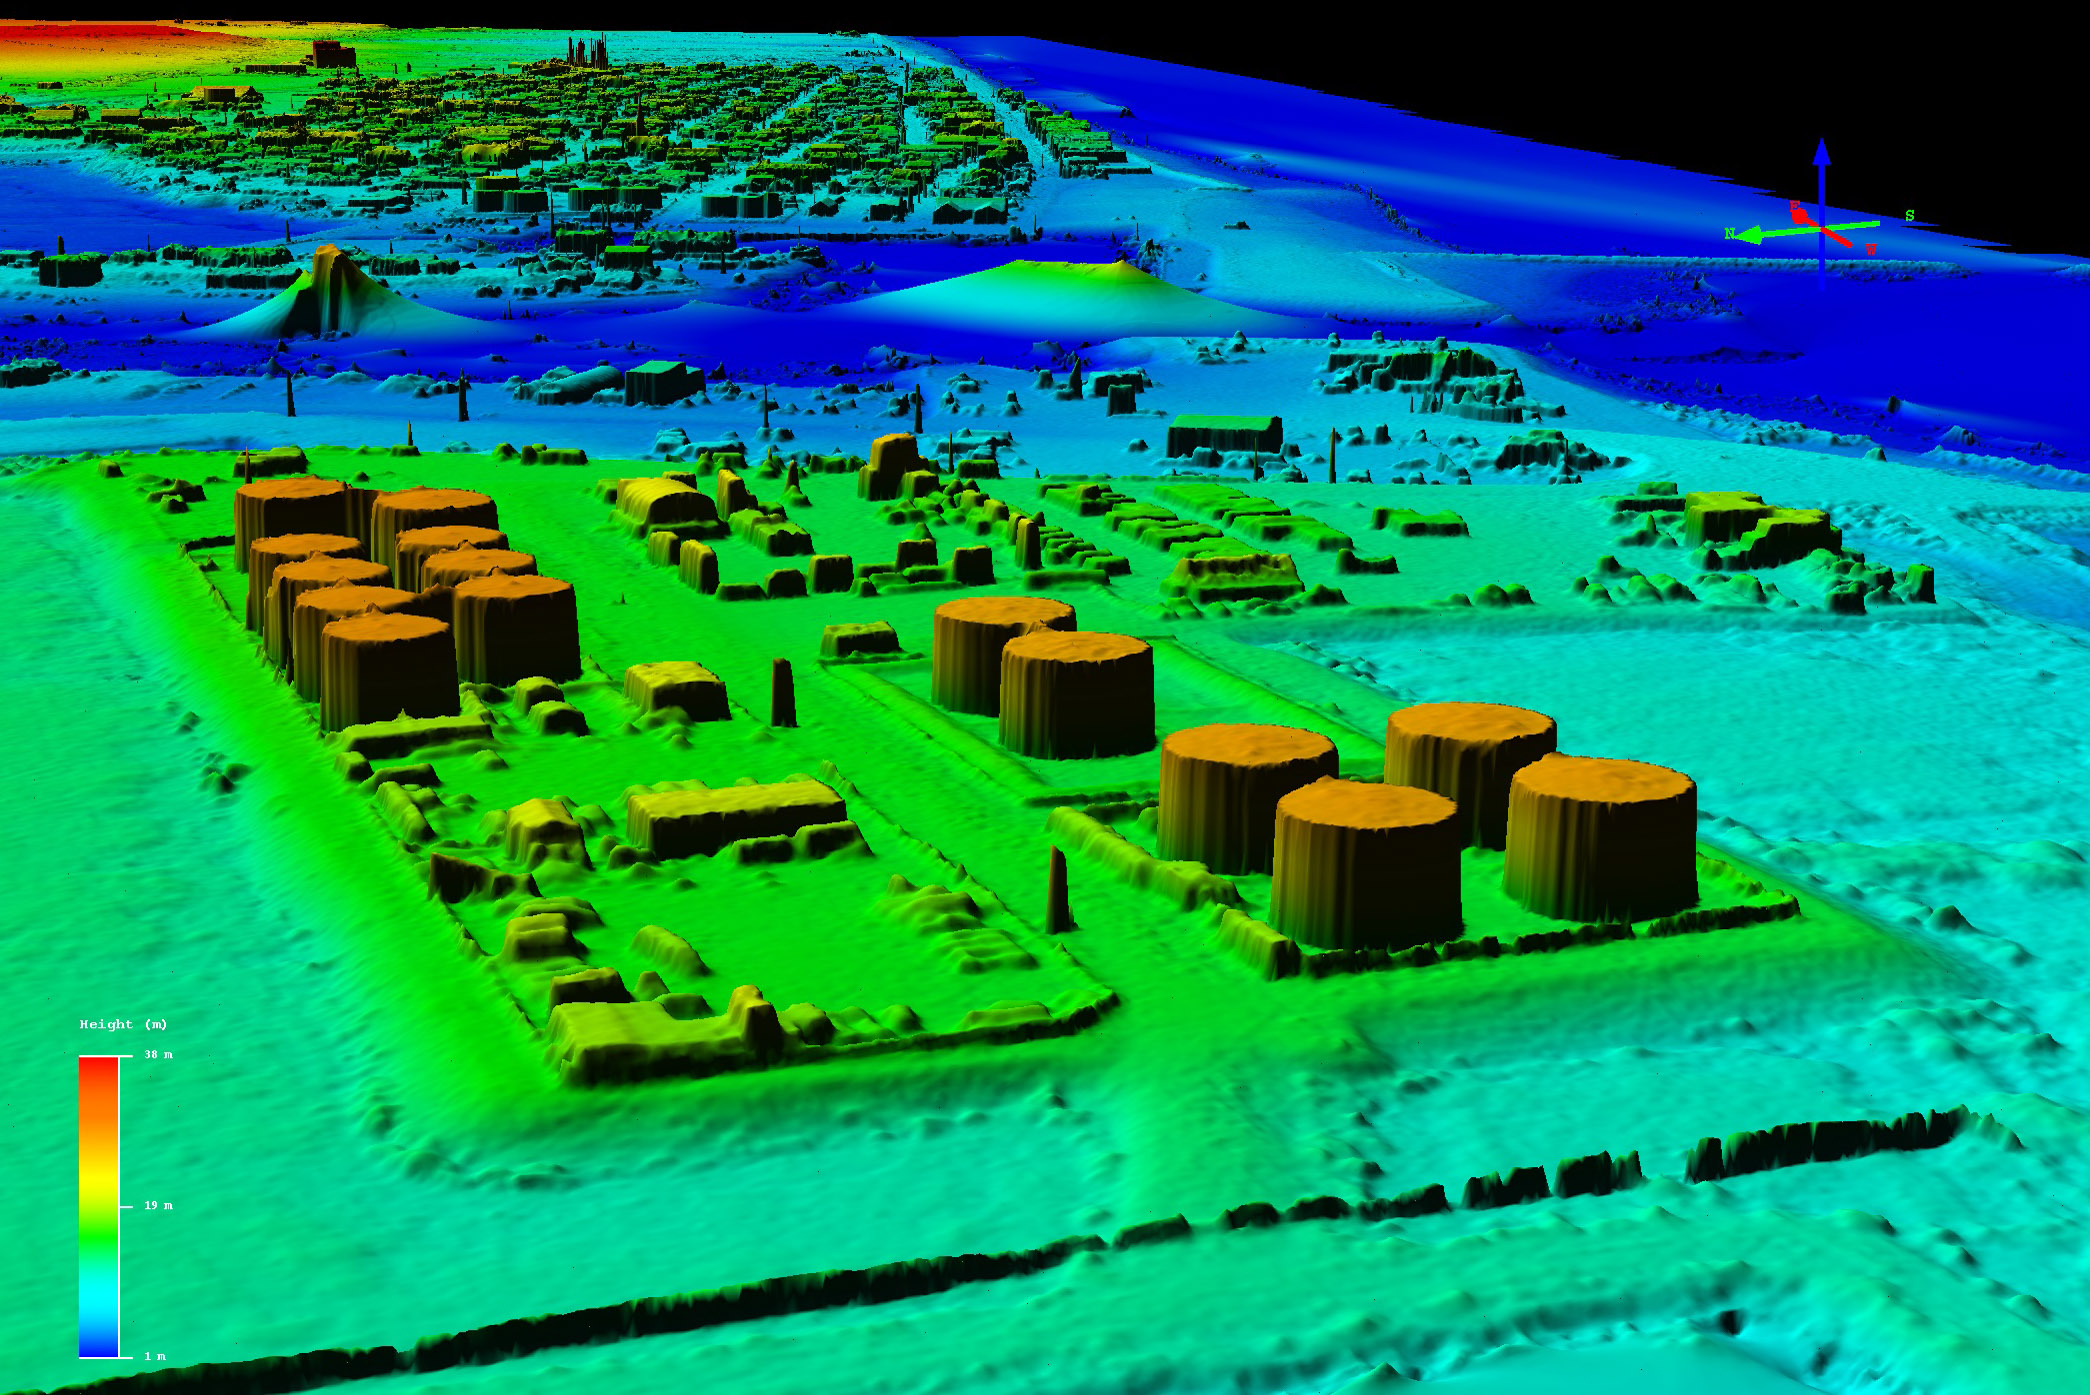
Fortunately most of the town is situated on a bluff several meters above most storm surge levels. Even here you can see tank farms protected by high berms, both to the keep the ocean out and the oil in.
You can learn more about the acquisition of the Cheevak data here.
Chefornak
Chefornak.
Lower tides leave large mud flats, stranding boats. But using the ortho and DEM will make delineating the mean high water pretty straightforward.
Here you can clearly see both the crown of the runway and the bulge near its center. The colormap here is stretched to show only 2 meters of relief, the ticks in the plot are space 20 cm apart. Long term monitoring using data like this will clearly reveal problems like subsidence and permafrost melt before they become major problems.
You can learn more about the acquisition of the Chefornak data here.
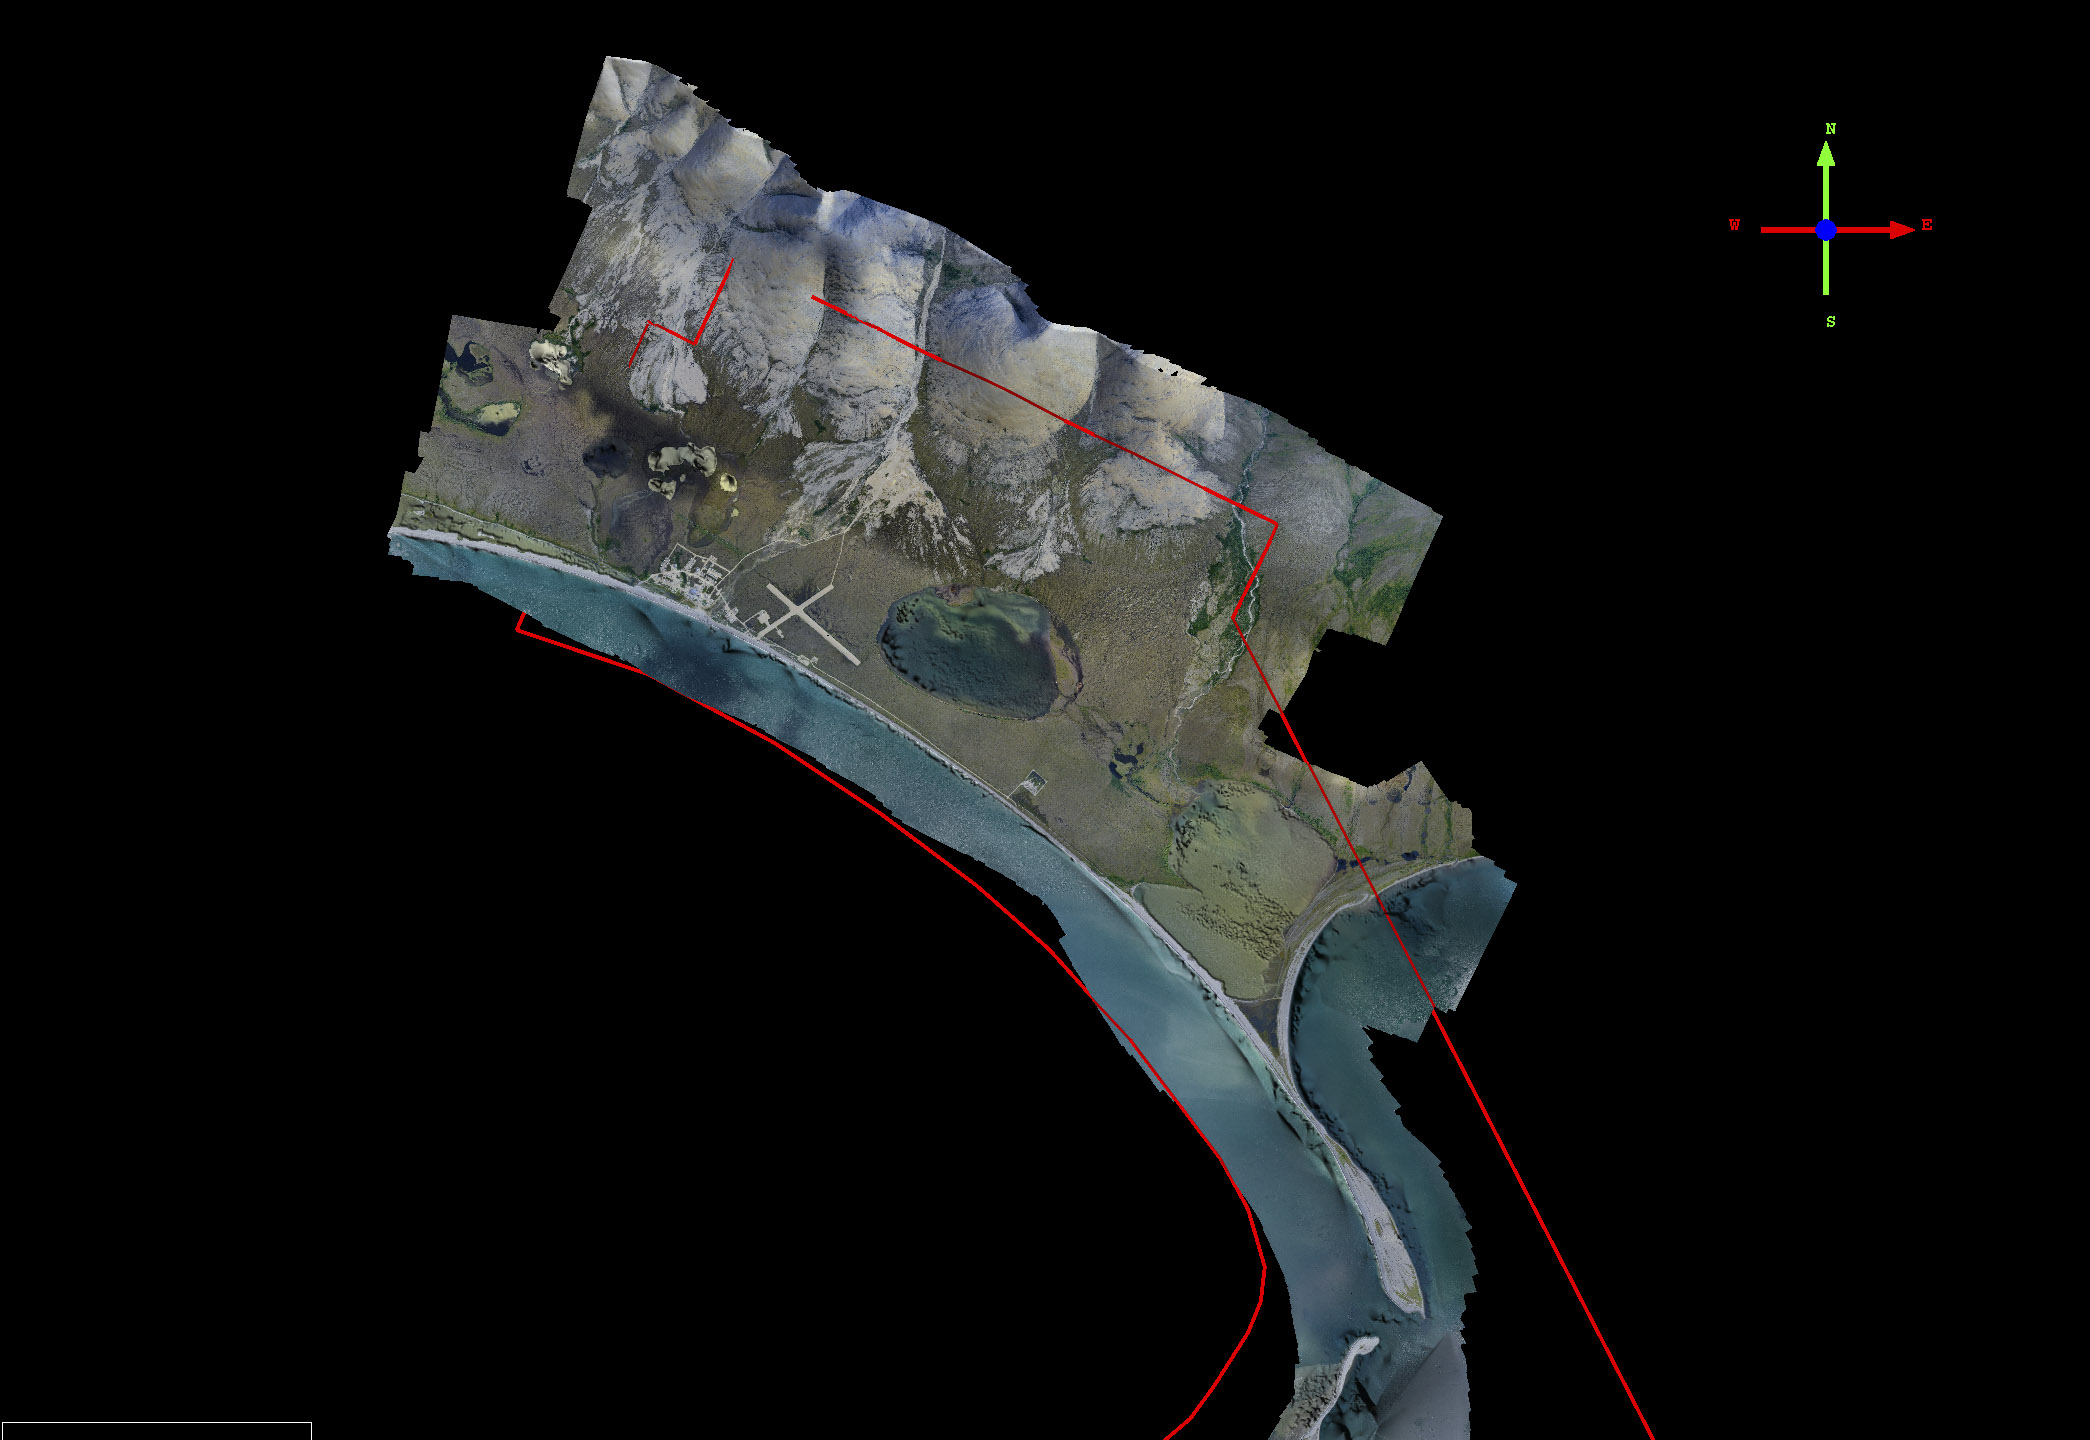
Elim
Elim is situated in a beautiful location that is fortunately well above sea level.
When taking off from Elim, you have the choice of being spit out into the ocean or making a quick turn to avoid this hill. Note that we are measuring individual trees with these data.
 The runway itself is quite nice, and has a great view.
The school is always the biggest and nicest building in town. Here you can see the bluffs that protect the village from the ocean.
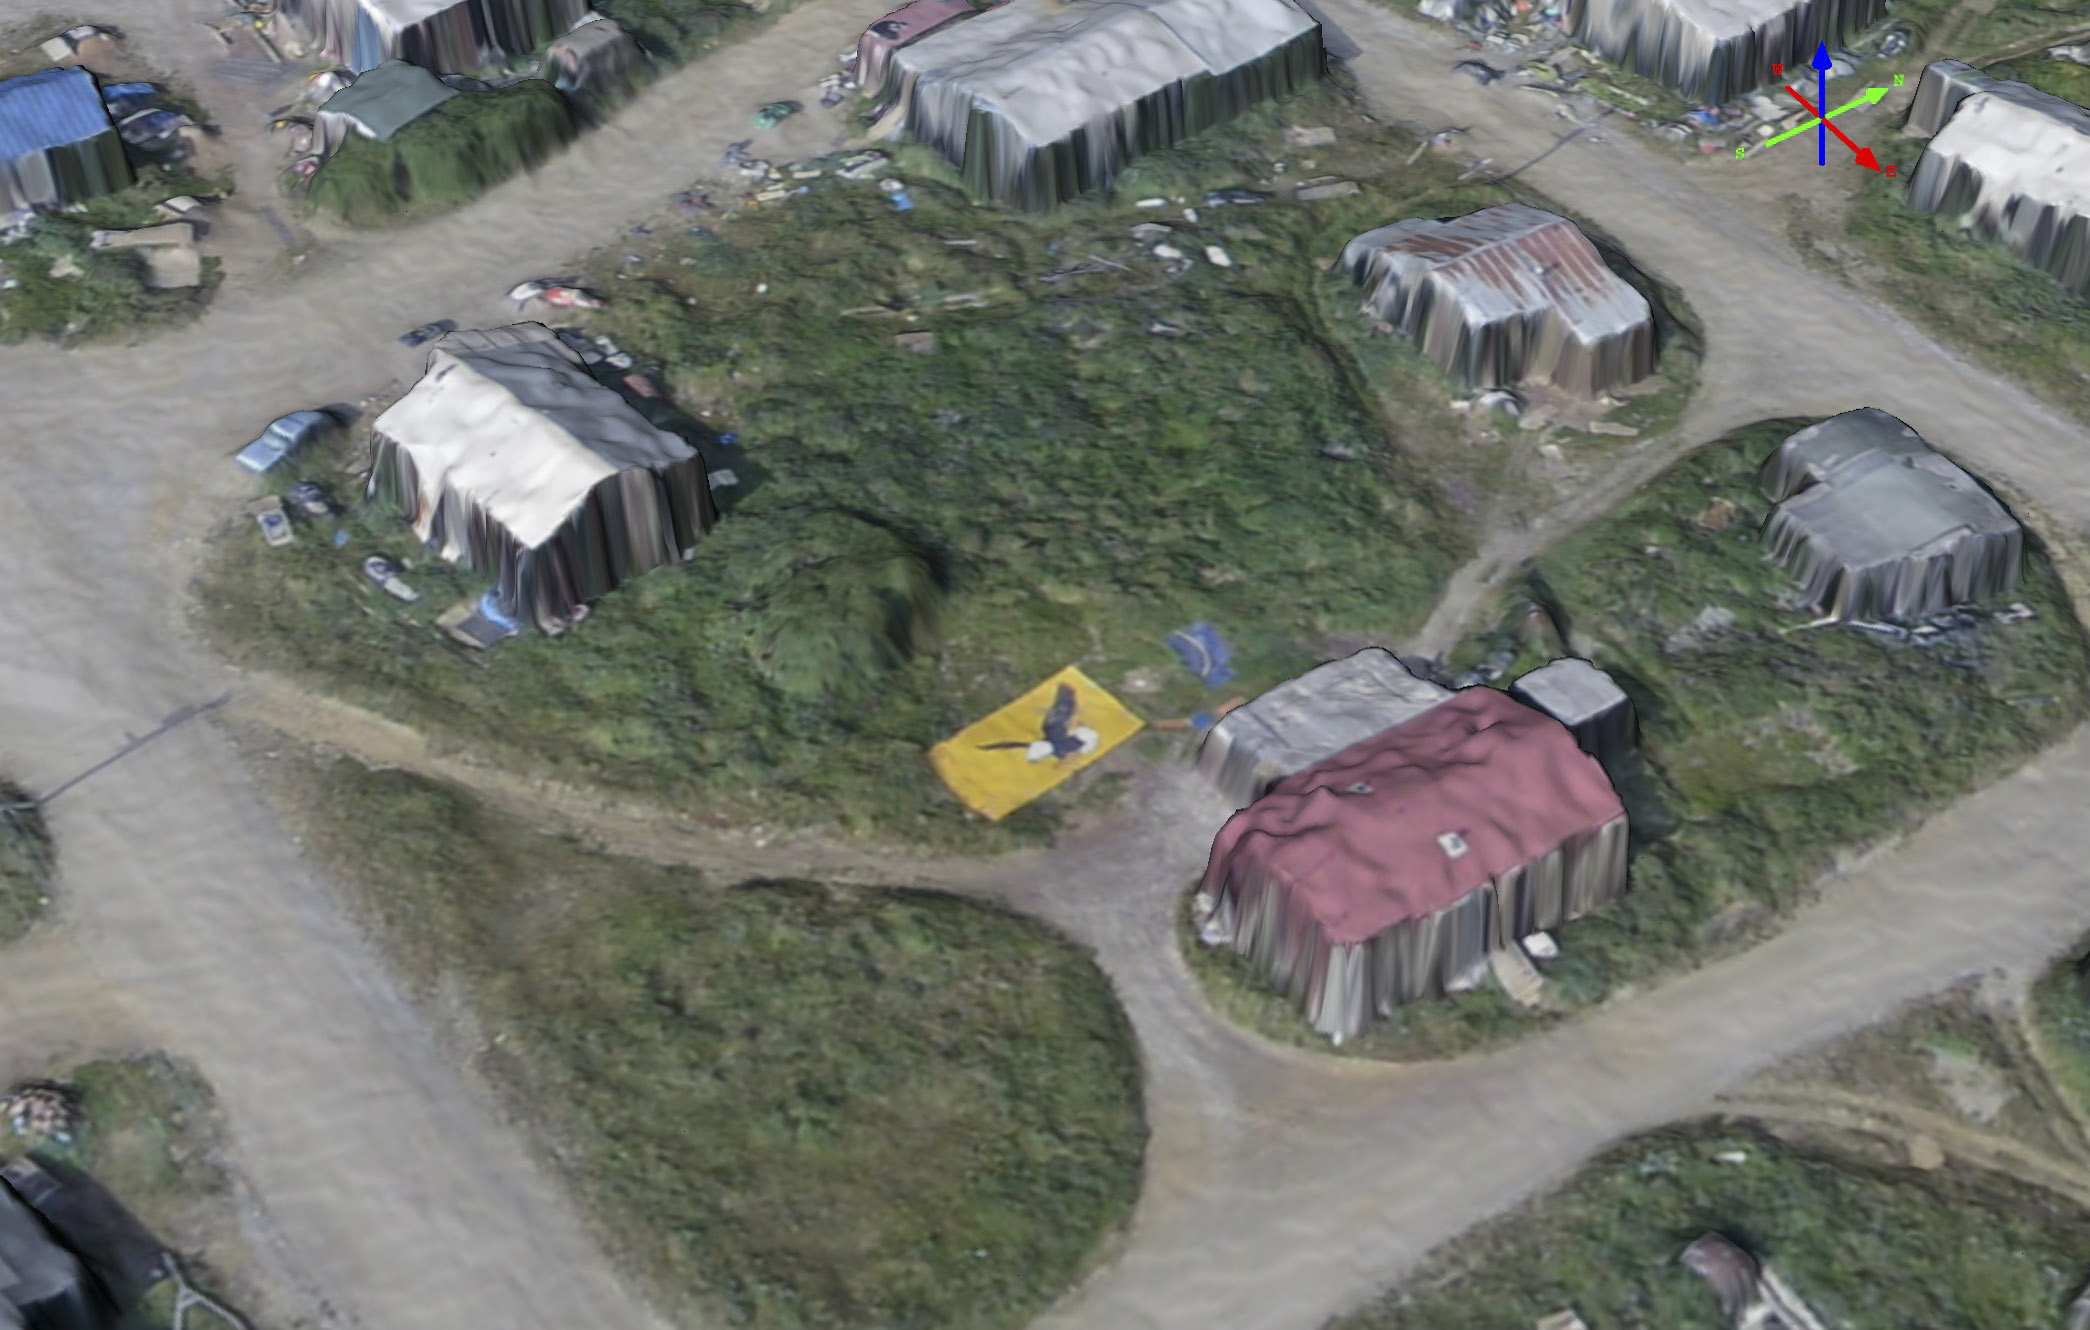
Not sure if this is meant to attract or deter eagles, or neither, but it was neat to see.
You can learn more about the acquisition of the Elim data here.
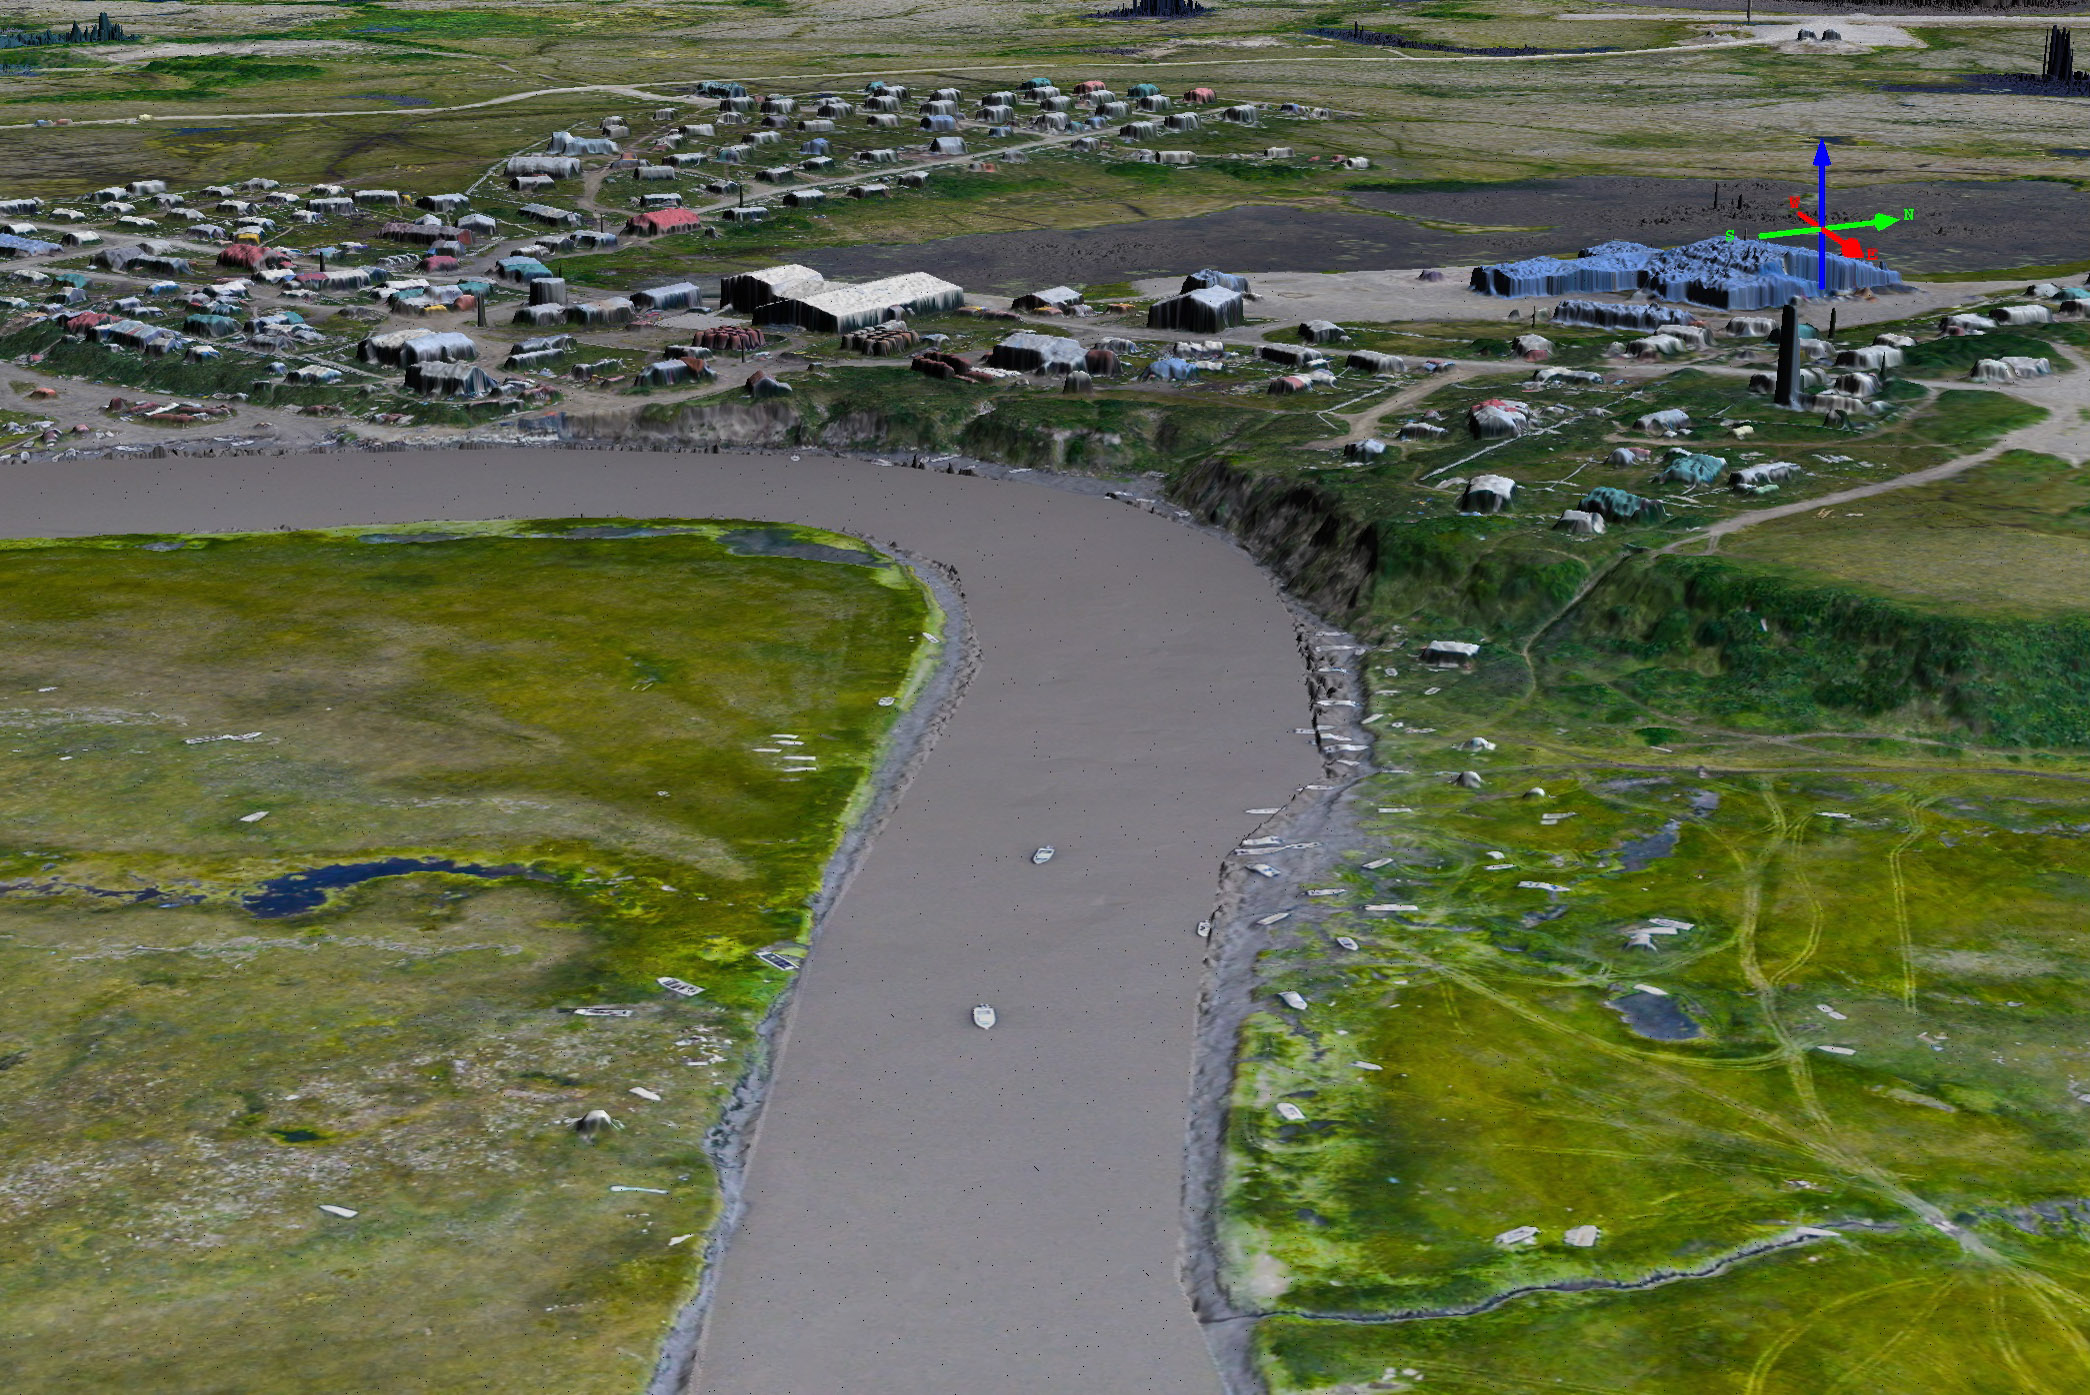
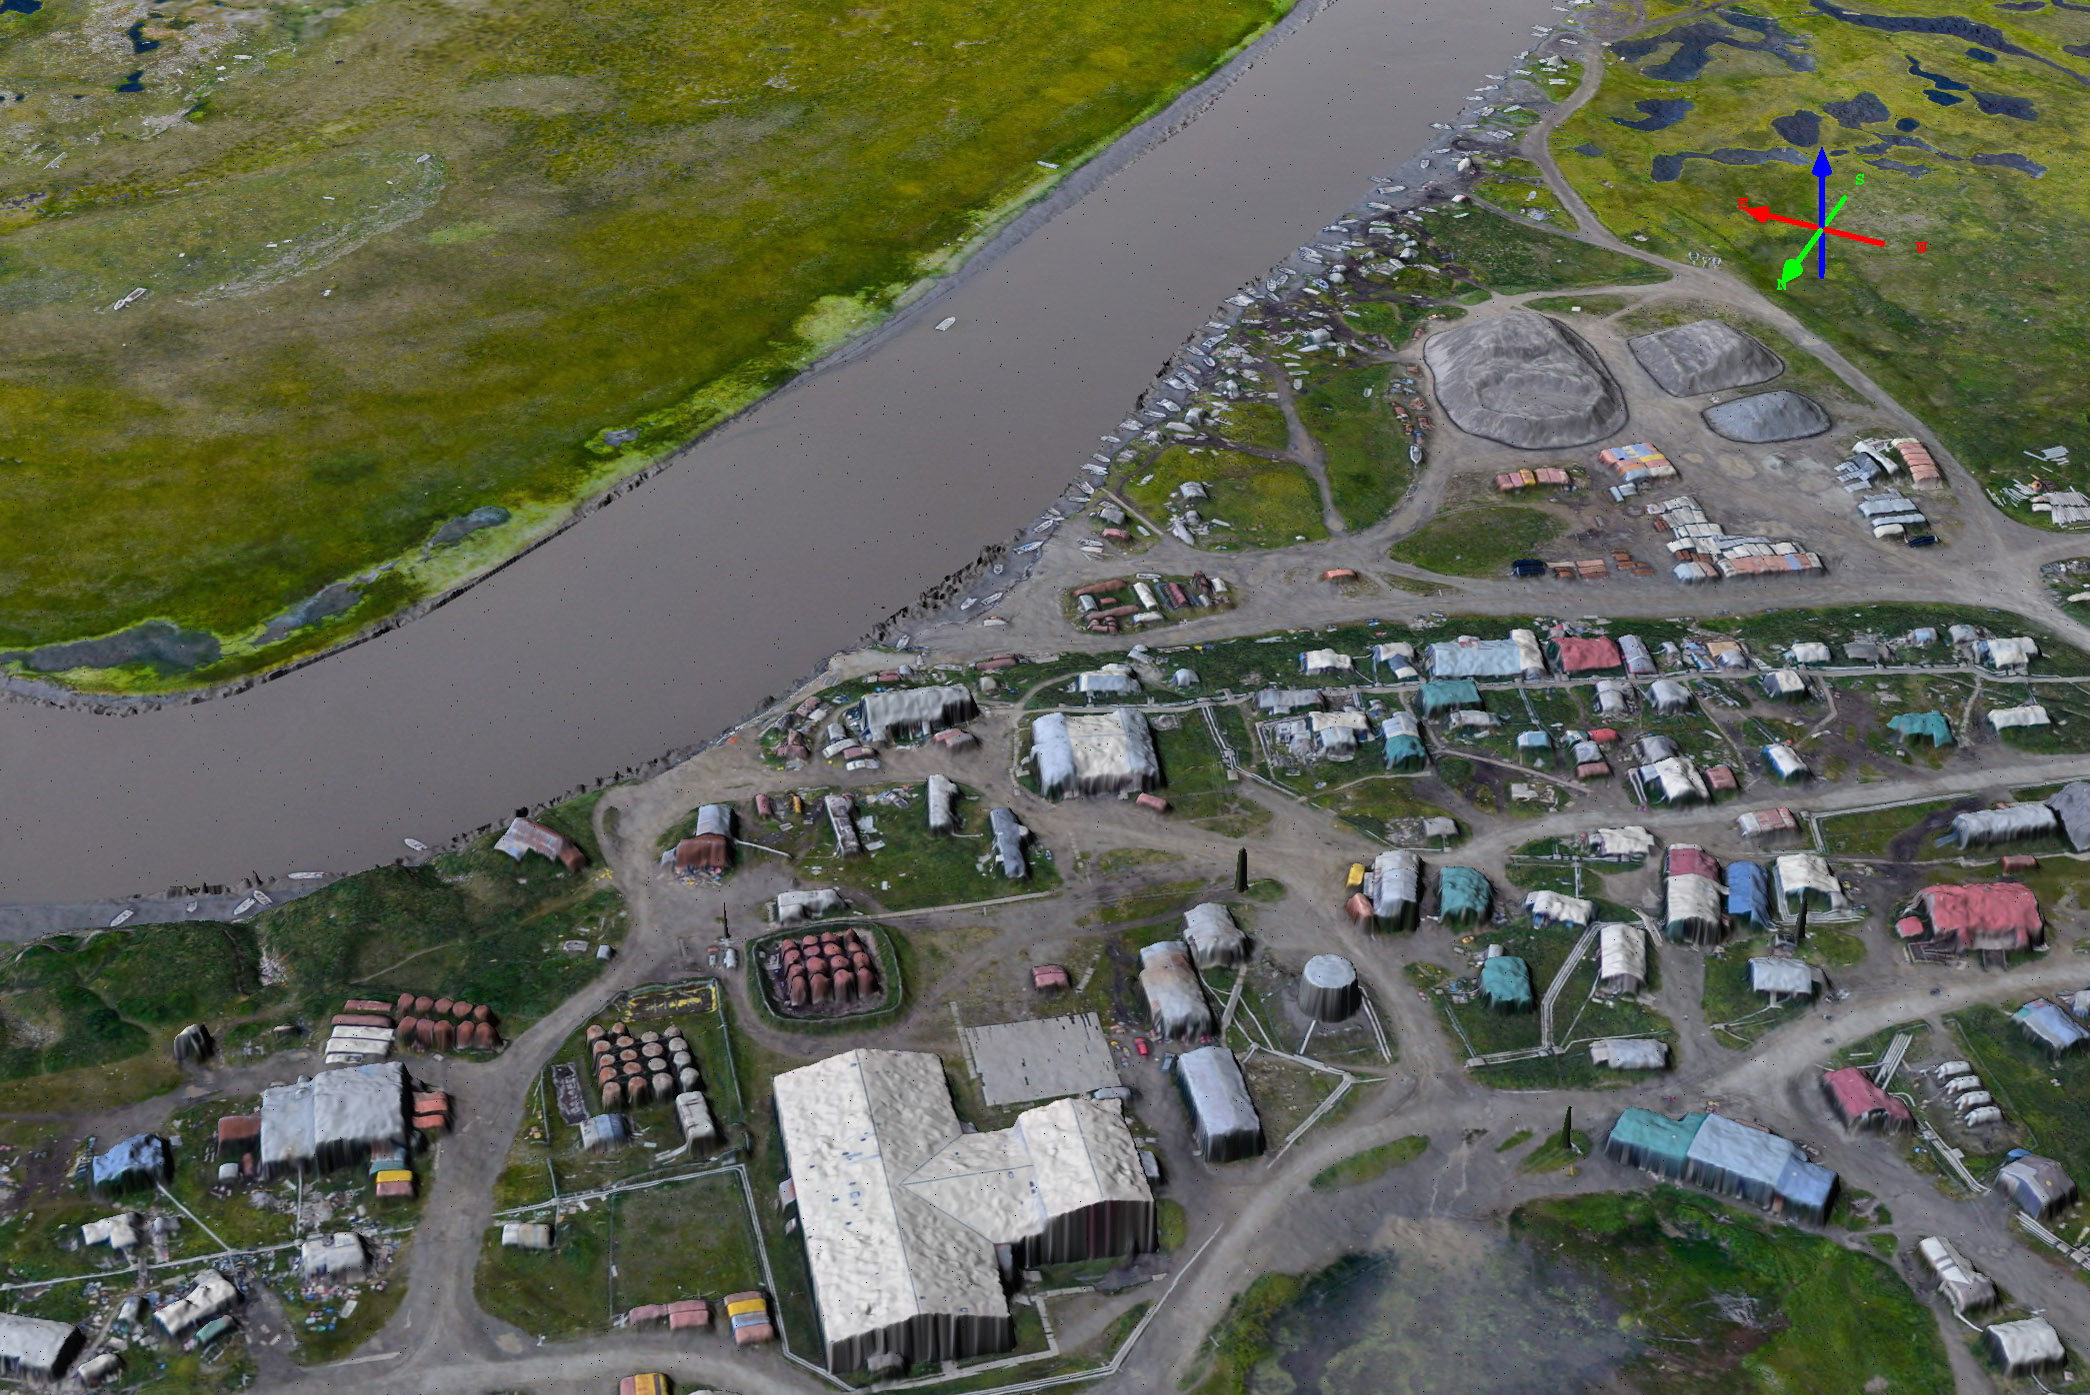
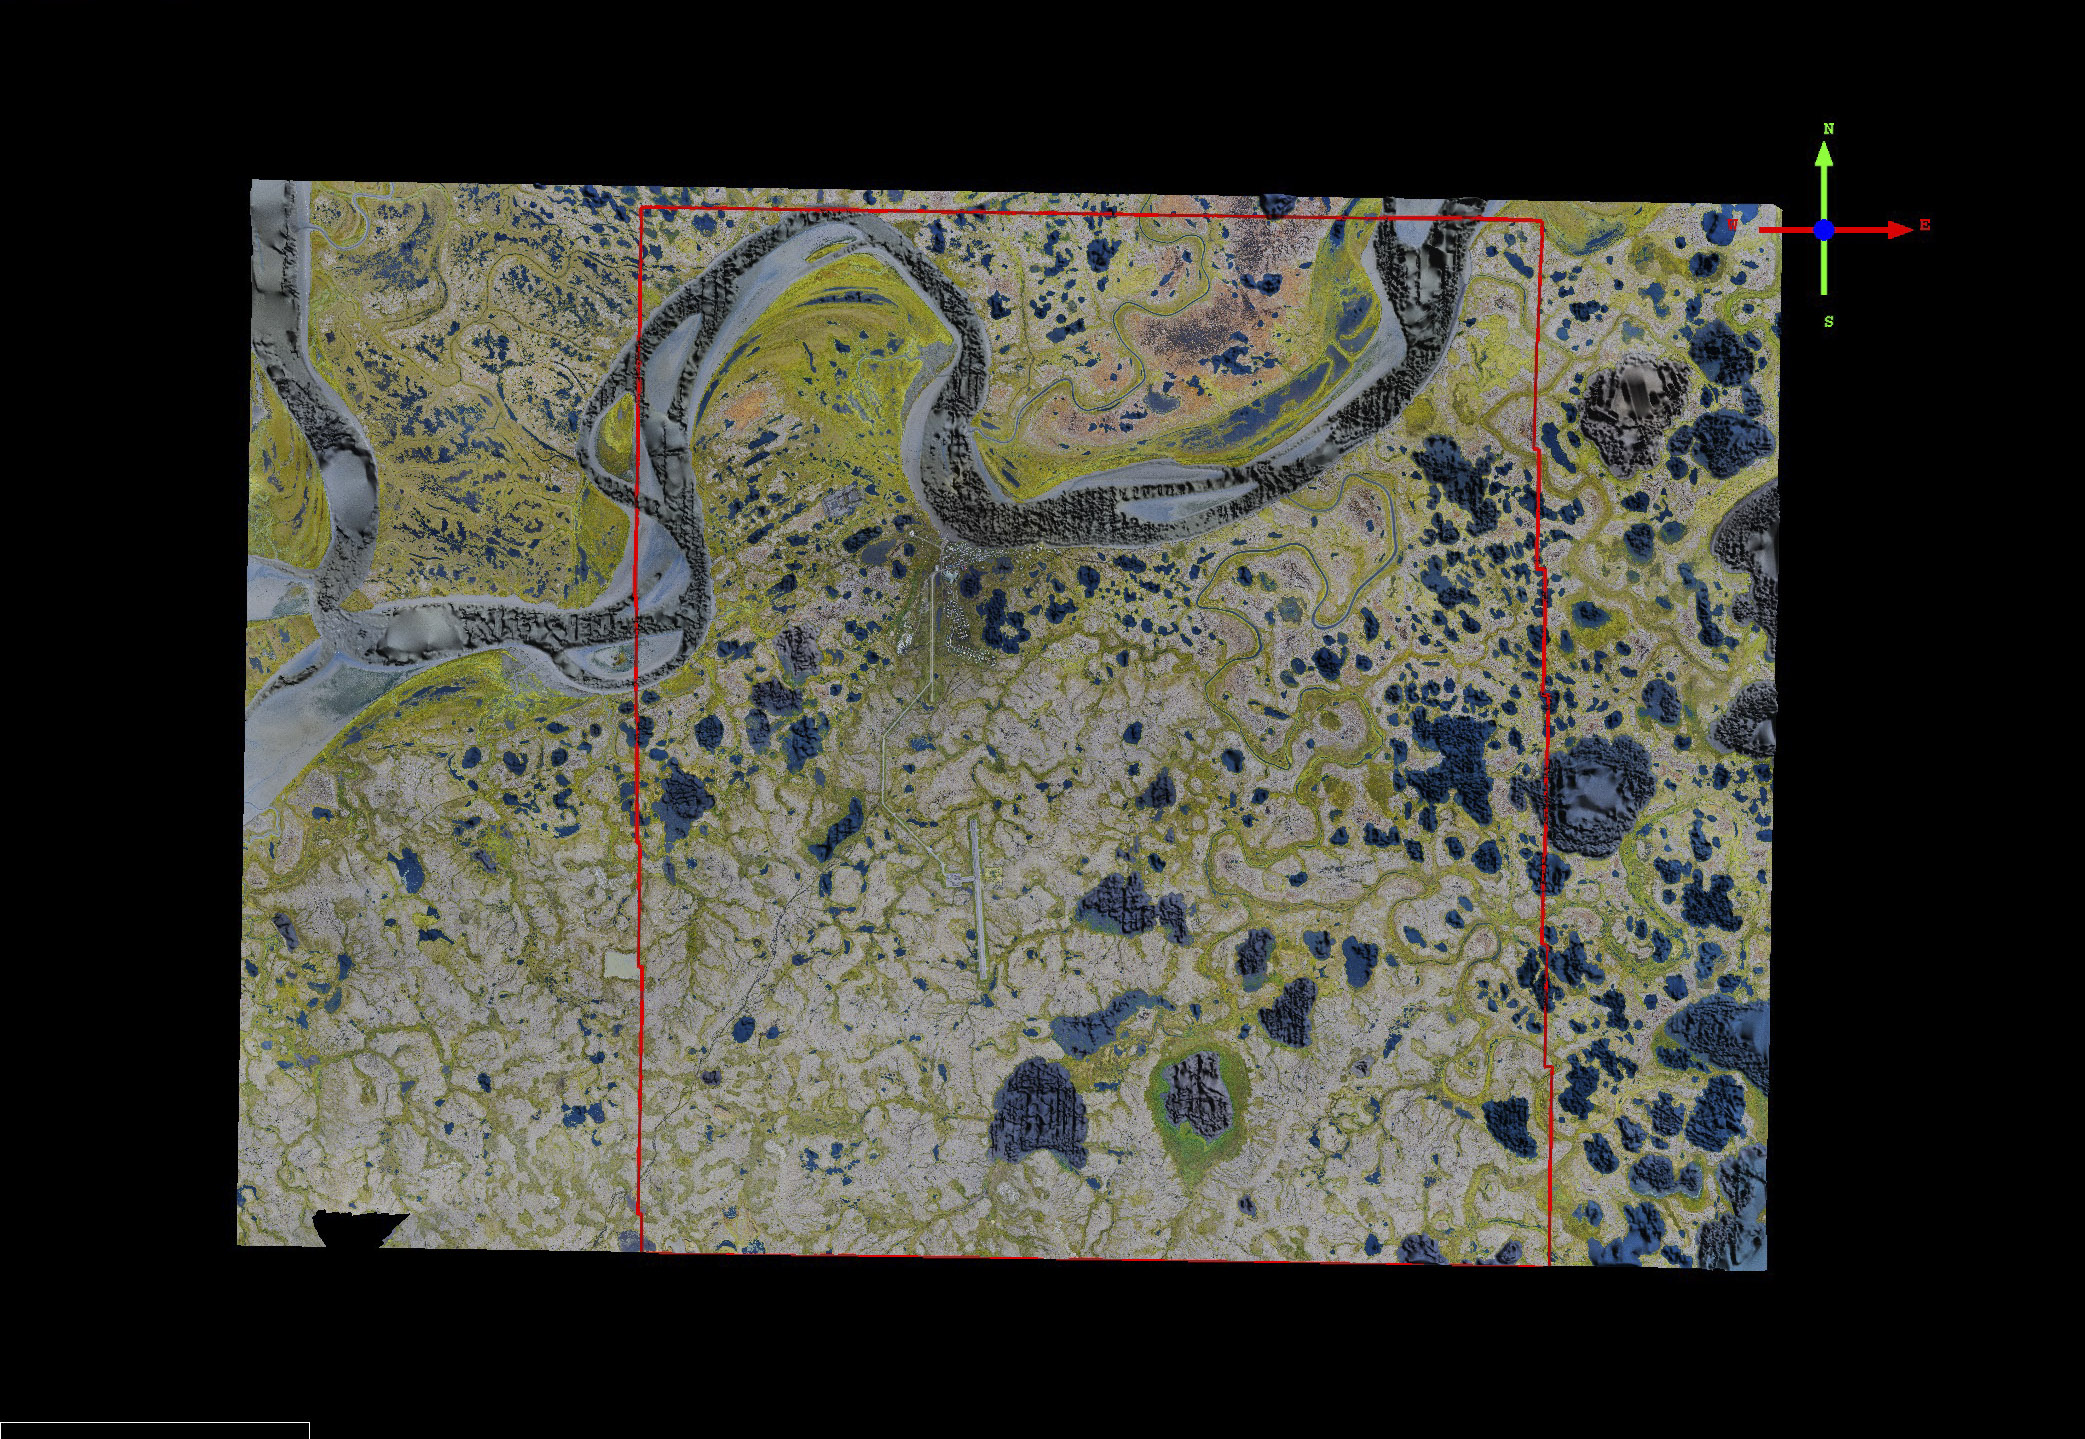
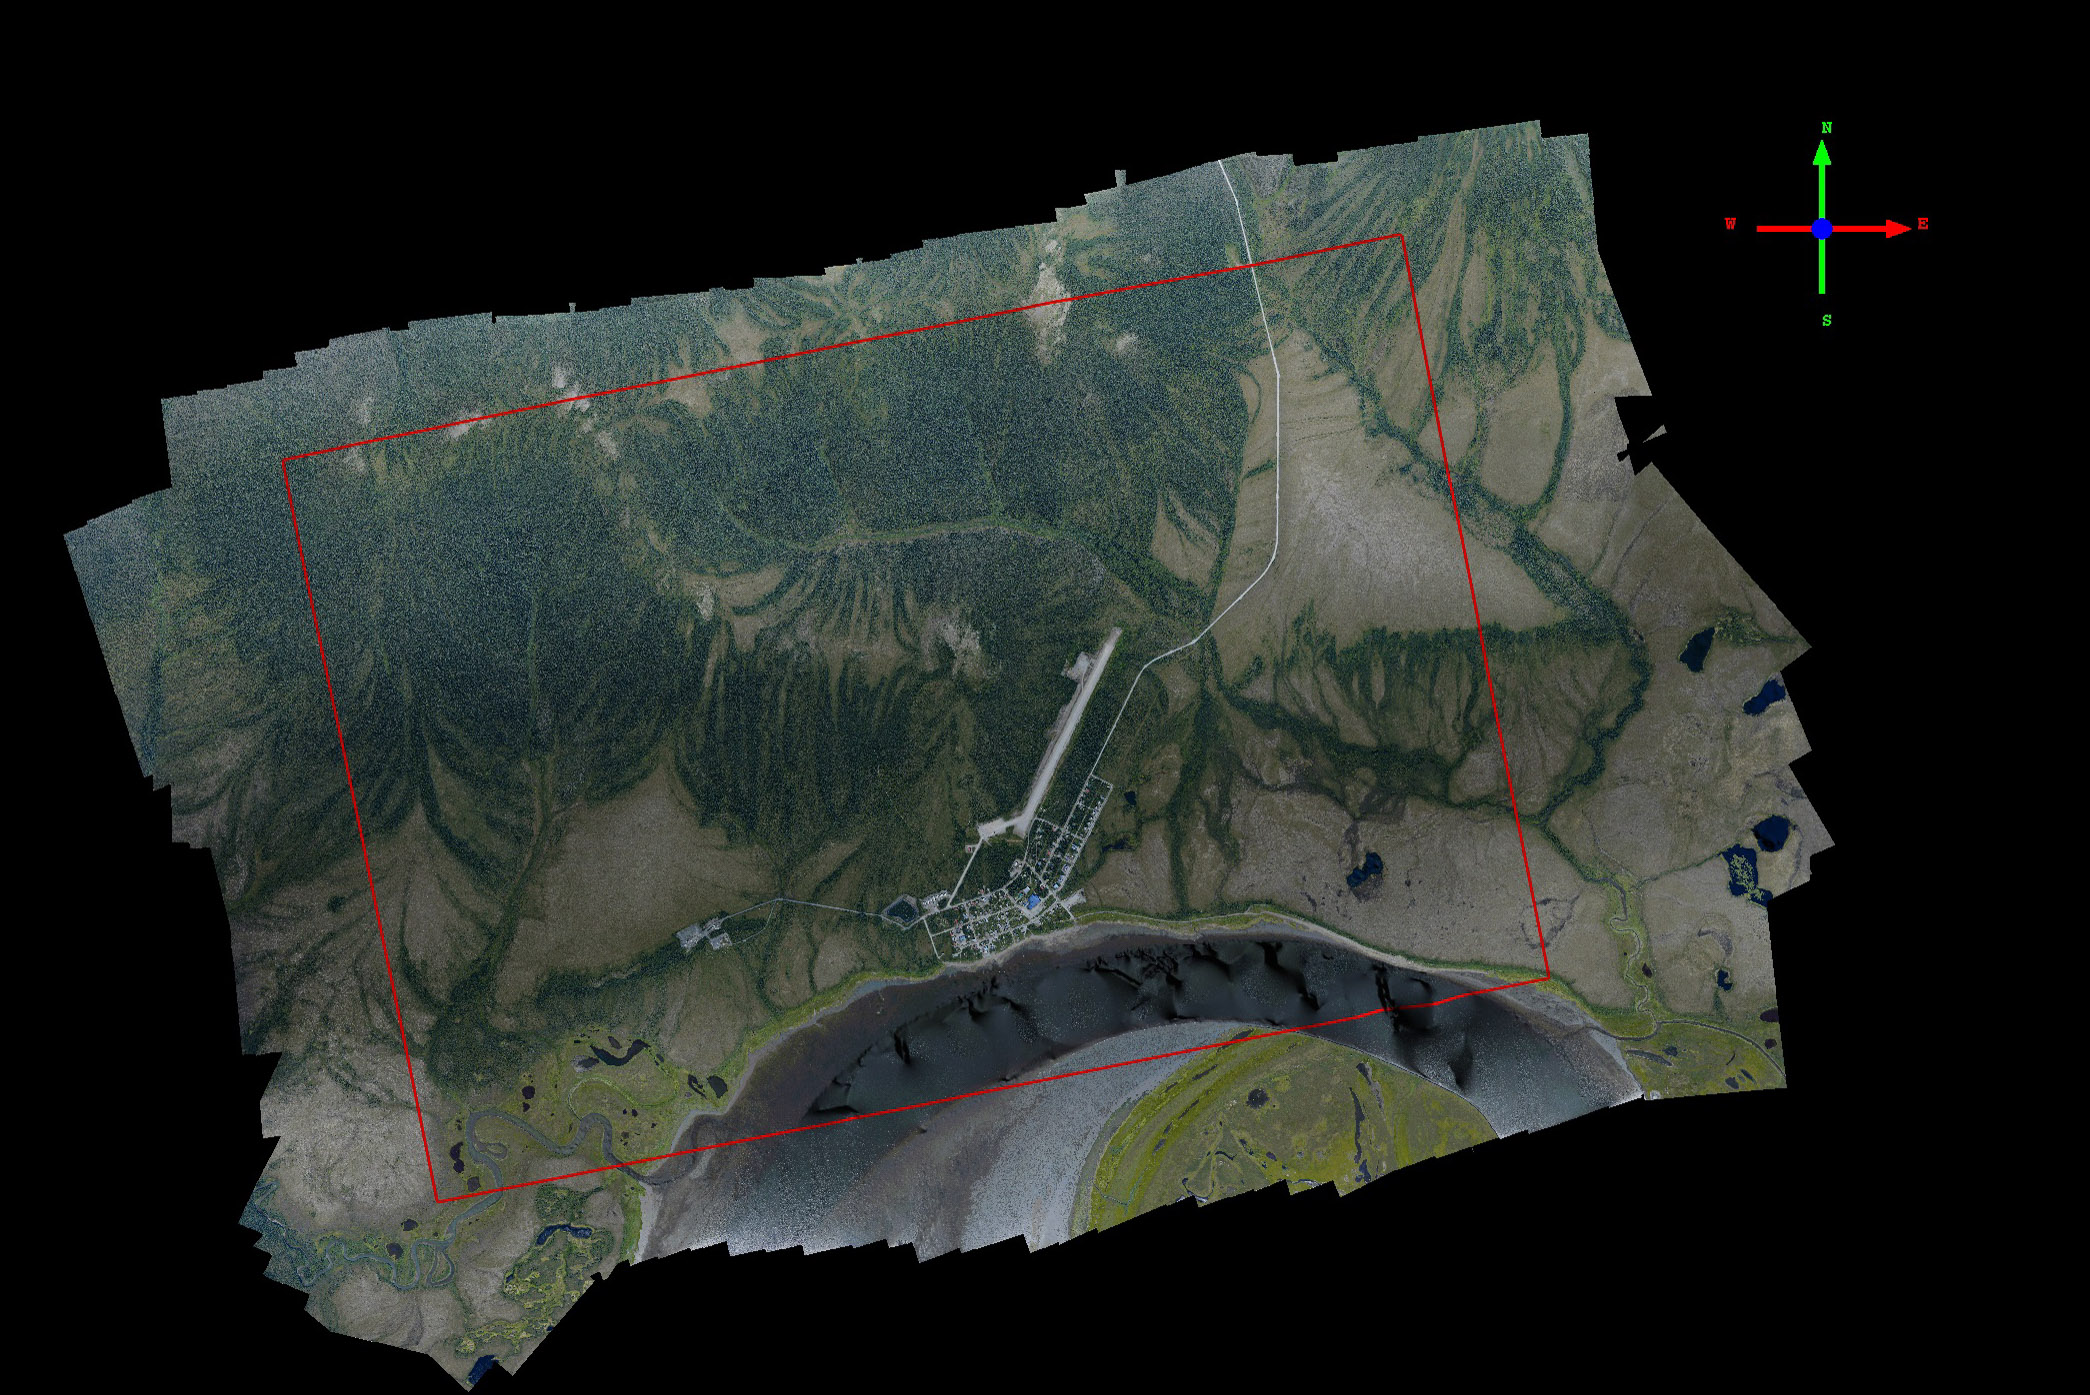
Emmonak
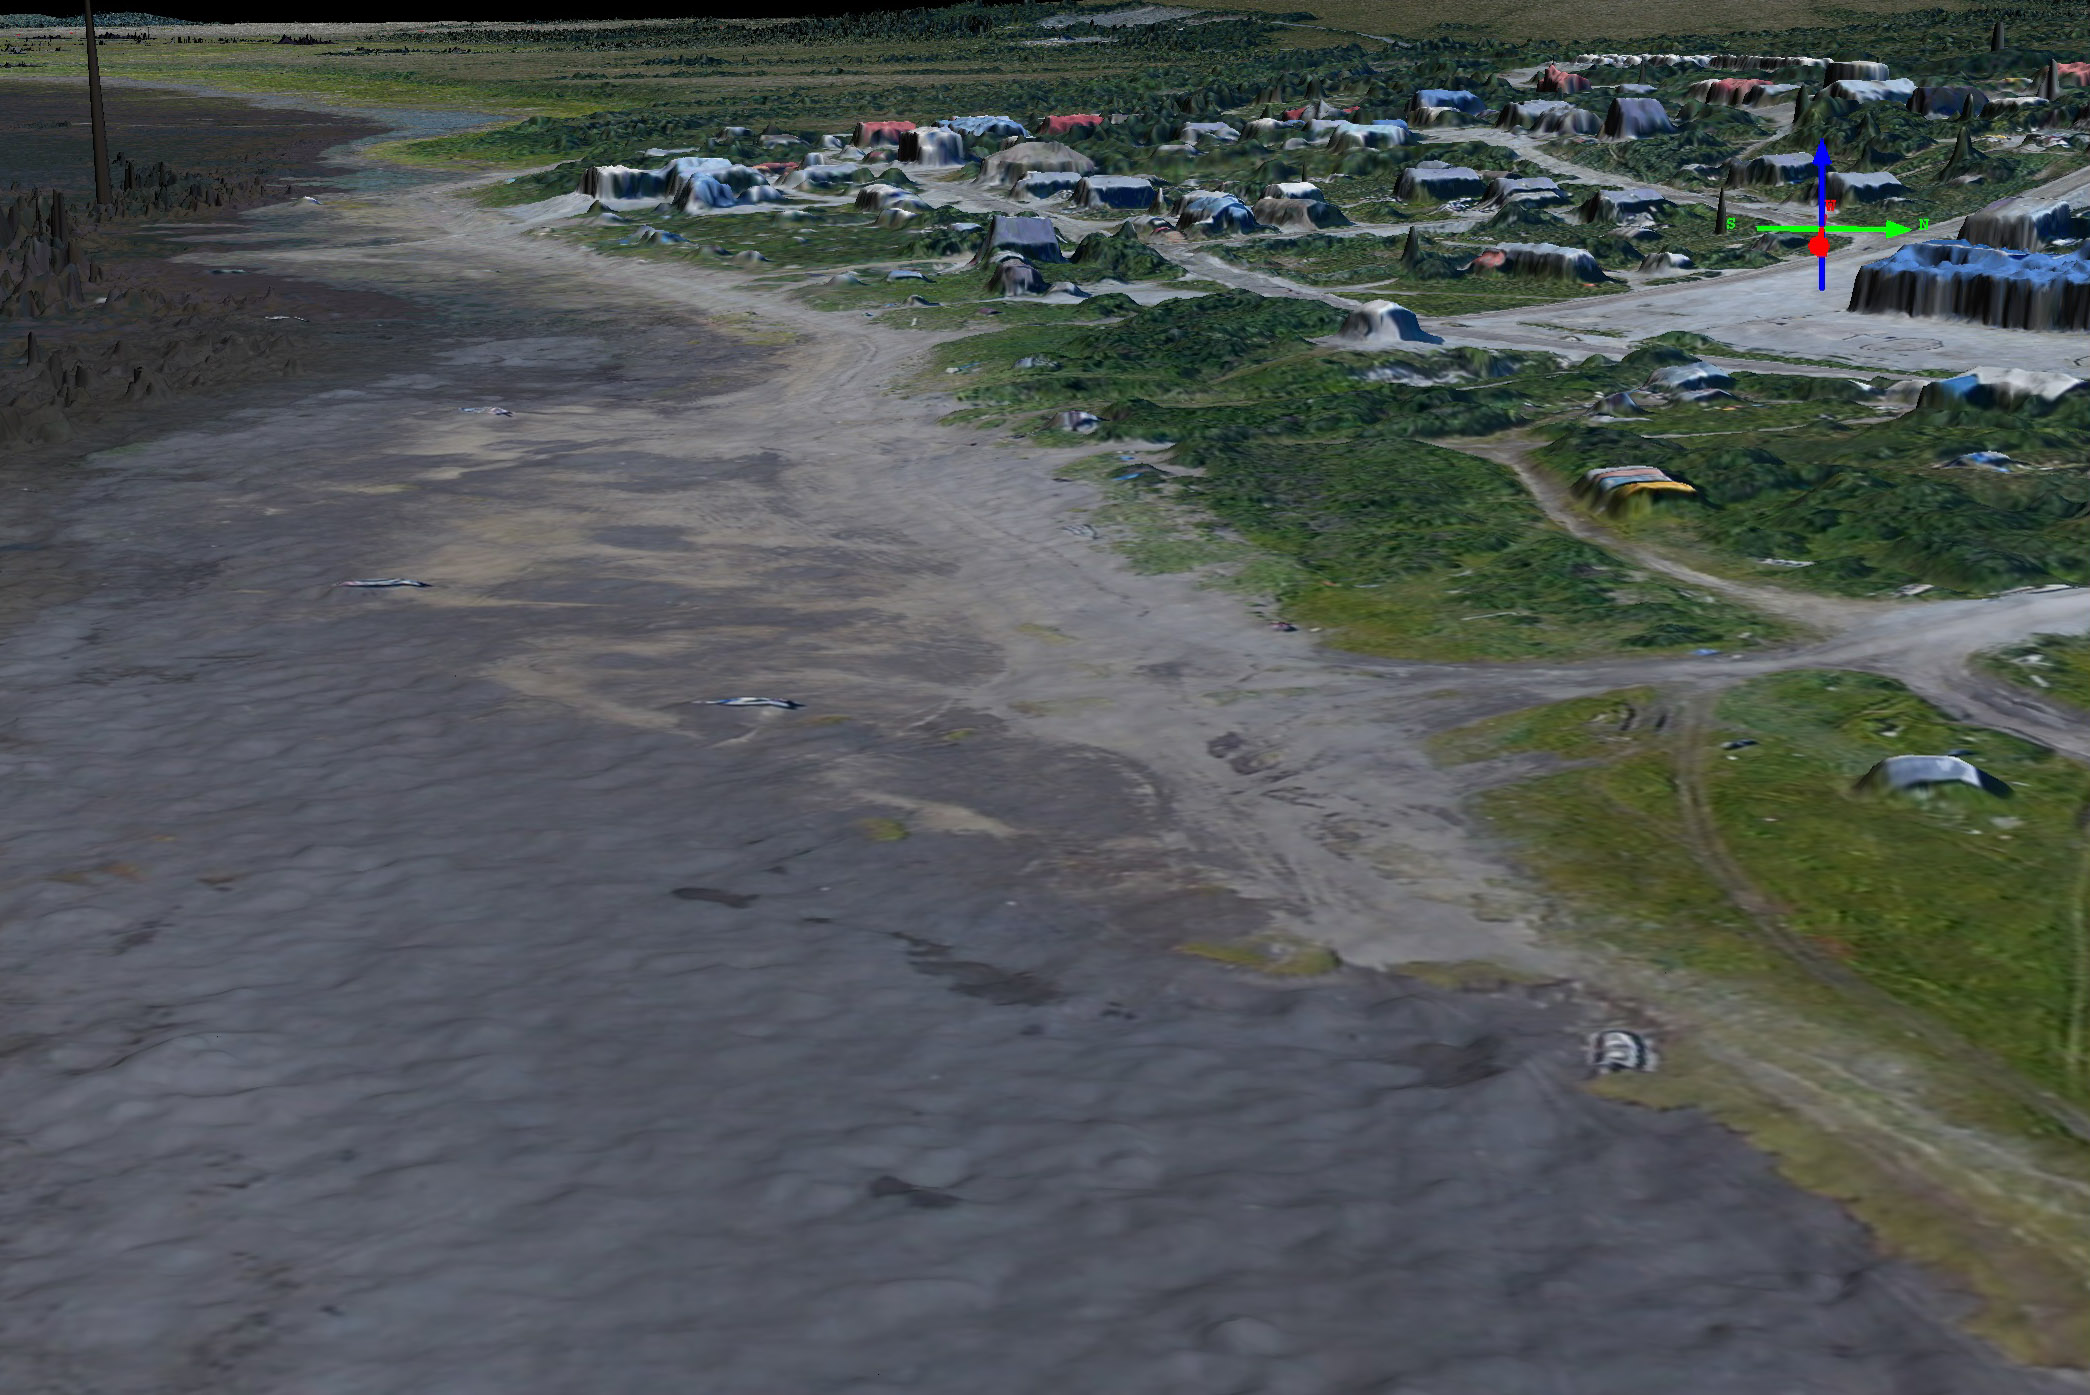
Emmonak is set in a beautiful location near the mouth of the Yukon River. It ranks as one of the tidiest villages I mapped. I stopped here several times to refuel, but unfortunately the town was a little too far away from the runway to walk without losing a lot of daylight.
Here the mudflats are exposed at a low tide. Hopefully the boats are moored well.
The runway at Emmonak. Note the crown in the runway surface and boat and plane topography in the foreground.
You can learn more about the acquisition of the Emmonak data here.
Golovin
Golovin is also located in a beautiful location, though the village is only a few feet above sea level despite the nice hillside directly behind it.
Much of the town of Golovin is only a few feet above sea level, despite the hillside behind it.
You can learn more about the acquisition of the Golovin data here.
Hooper Bay
Hooper Bay is perhaps the most interesting village geomorphologically. To the south you can see a spit in the process of extending itself and creating the bay to the right.
Here are sand dunes forming from wave and storm action just south of the tundra on the peninsula. If trends continue, as these dunes continue to rise they will become colonized by tundra and form new land. The vertical ticks in the plot are 10 cm, and fodar clearly can resolve the shape of these dunes only 10-20 cm high.
Here on the eastern (bay) side of the peninsula, drainage features dewater the landscape and help promote tundra growth on the surface raised just above normal tide levels. The ticks in plot above are 10 cm apart, and the profile clearly shows each drainage stream at 10-50 cm deep.
You can learn more about the acquisition of the Hooper Bay data here.
Kipnuk
Kipnuk has the only weather reporting station for many miles in either direction along the coast, but somehow every time I past there it was inside of sunny hole. Meaning that every time I headed that direction, the weather was good only directly above Kipnuk…
You can learn more about the acquisition of the Kipnuk data here.
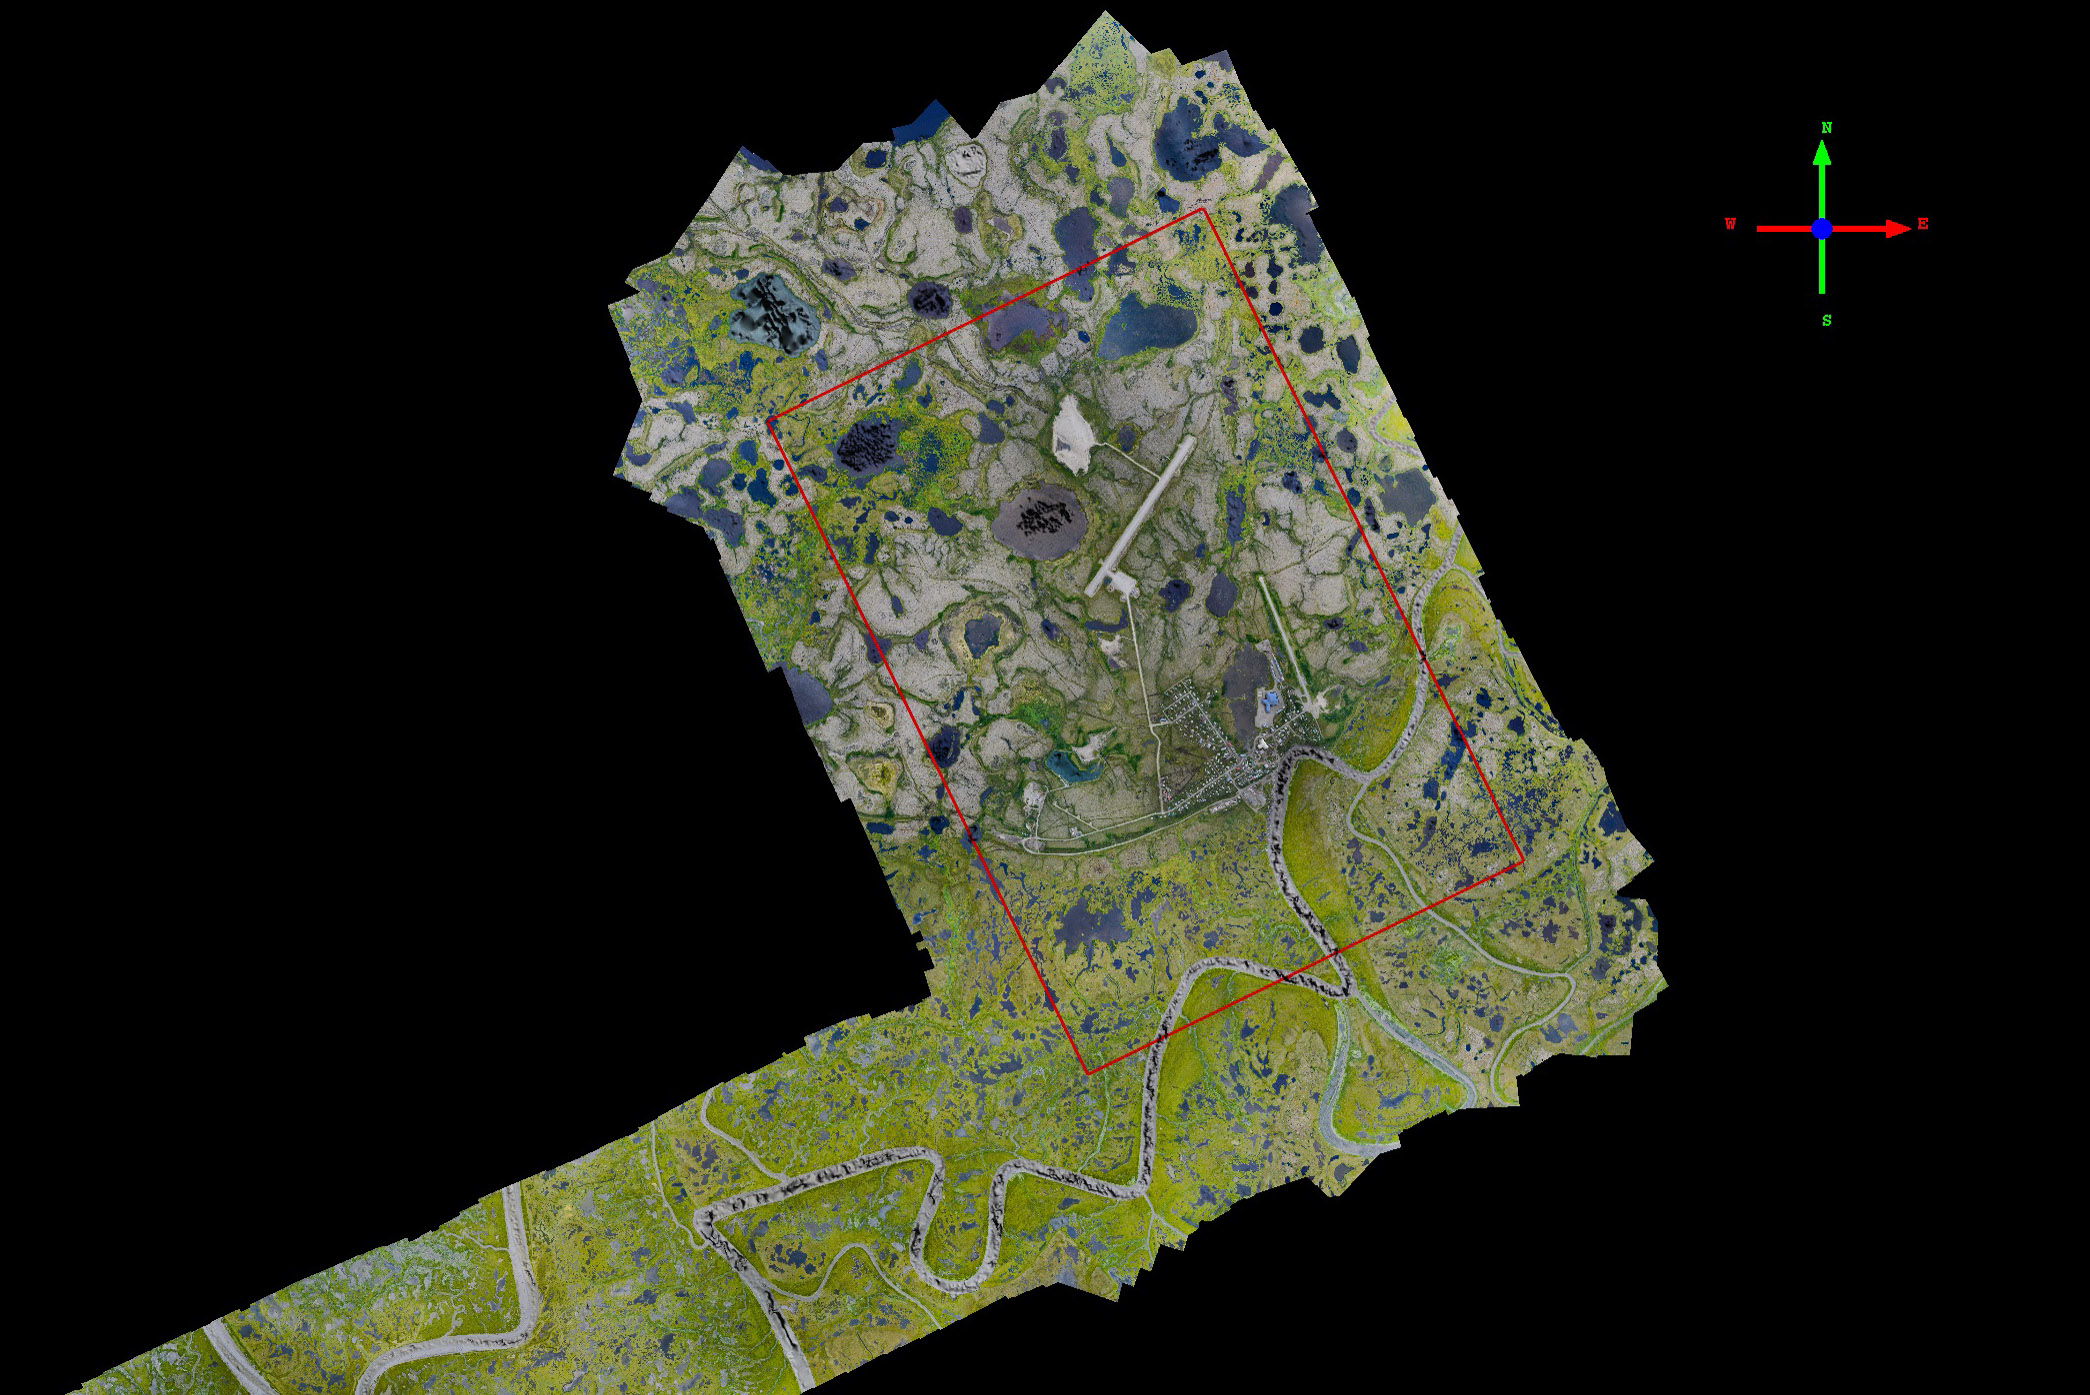
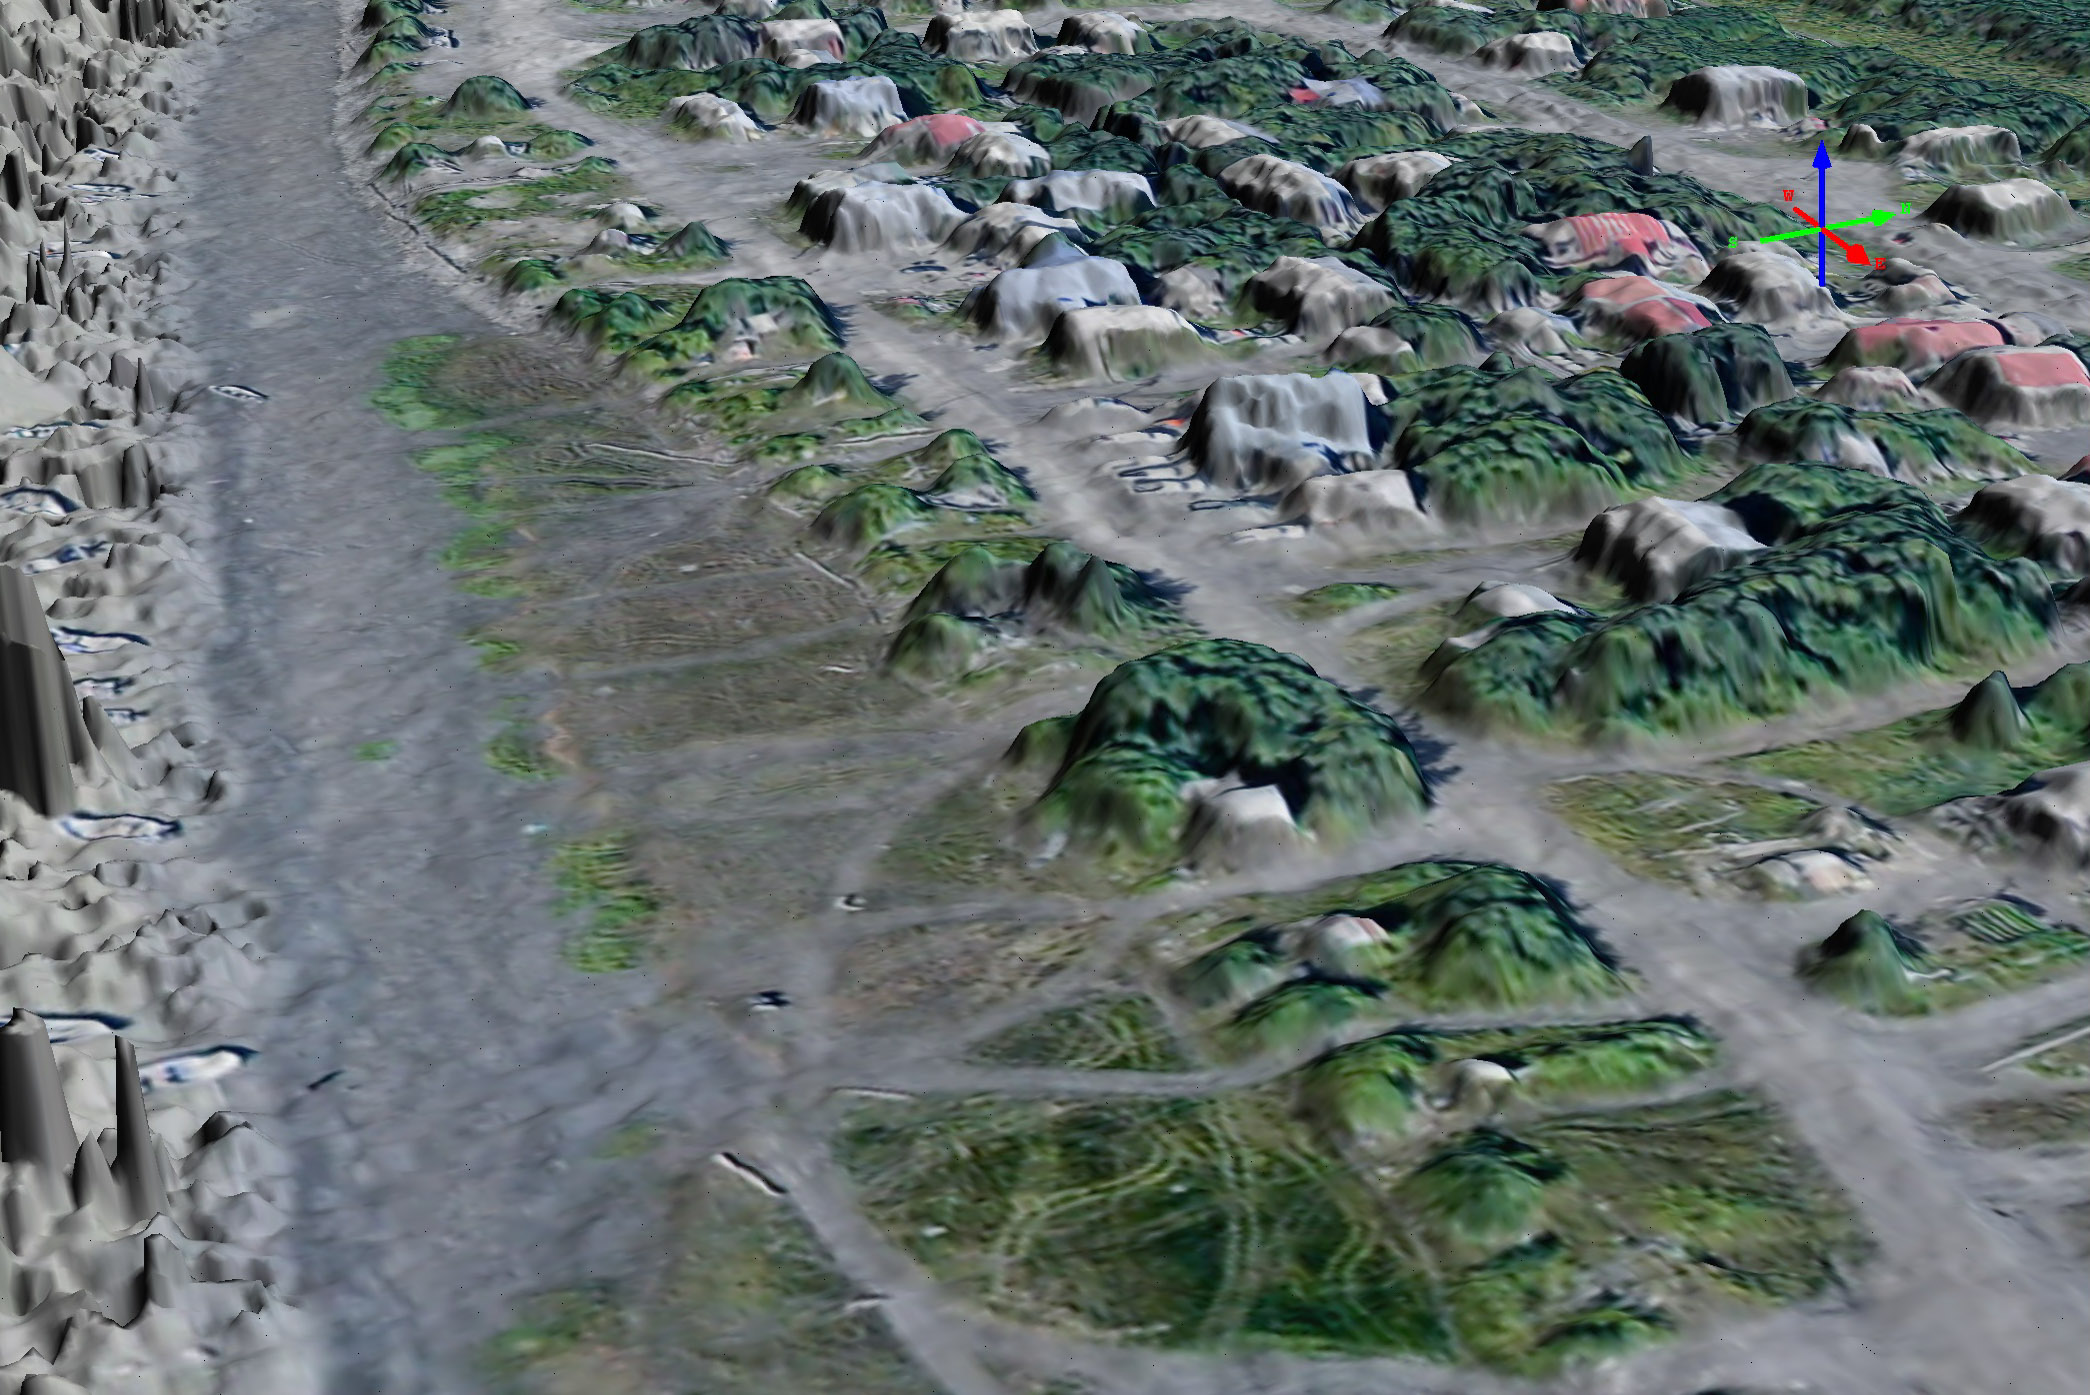
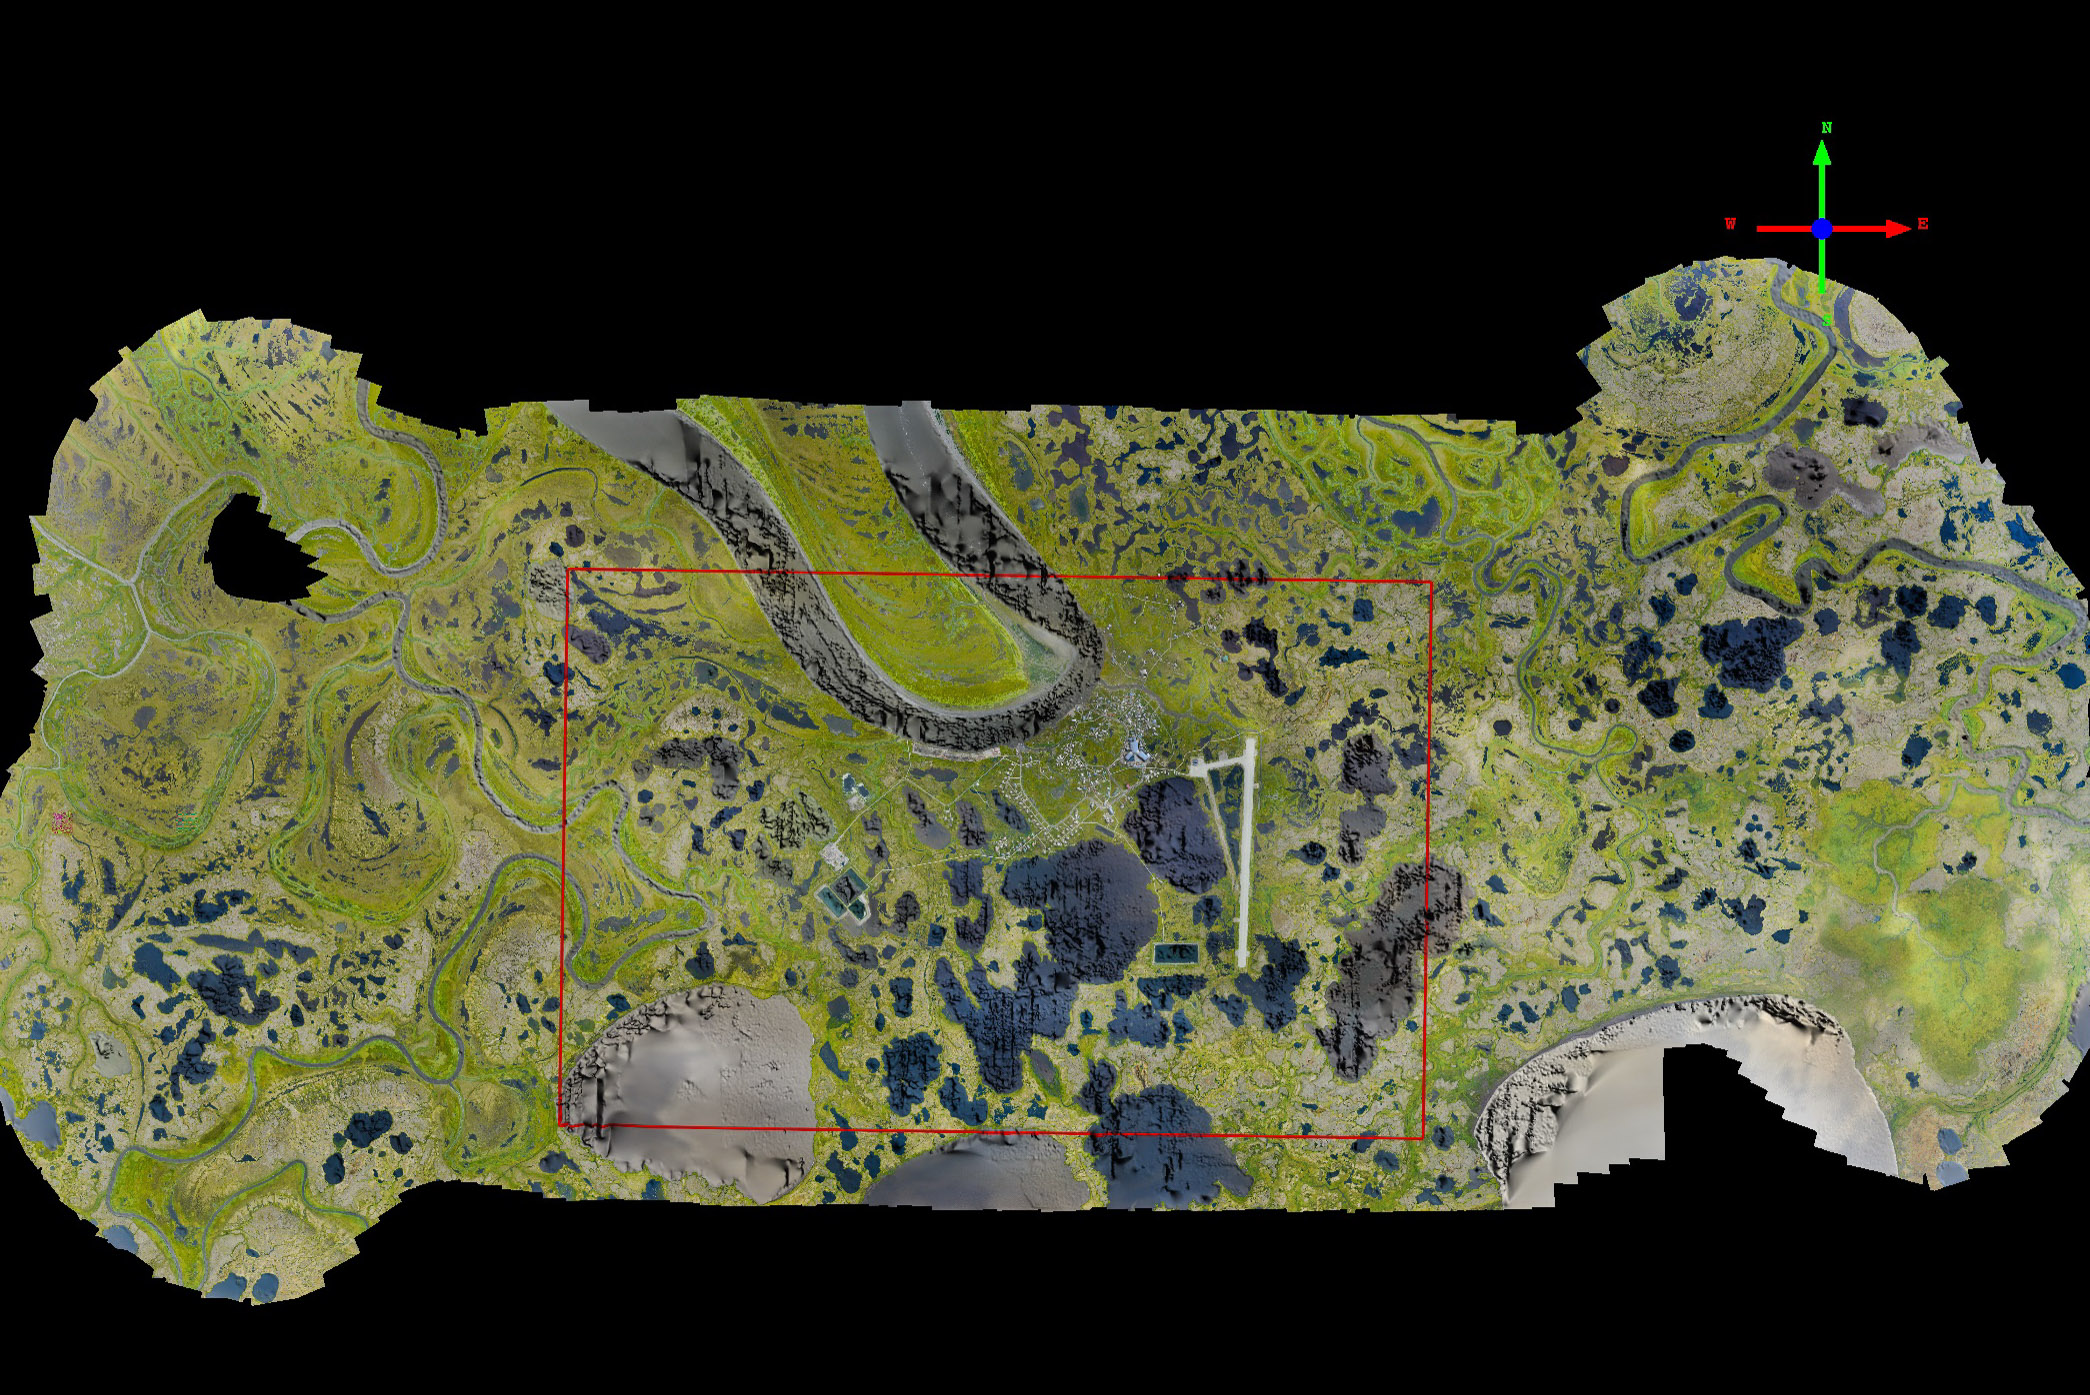
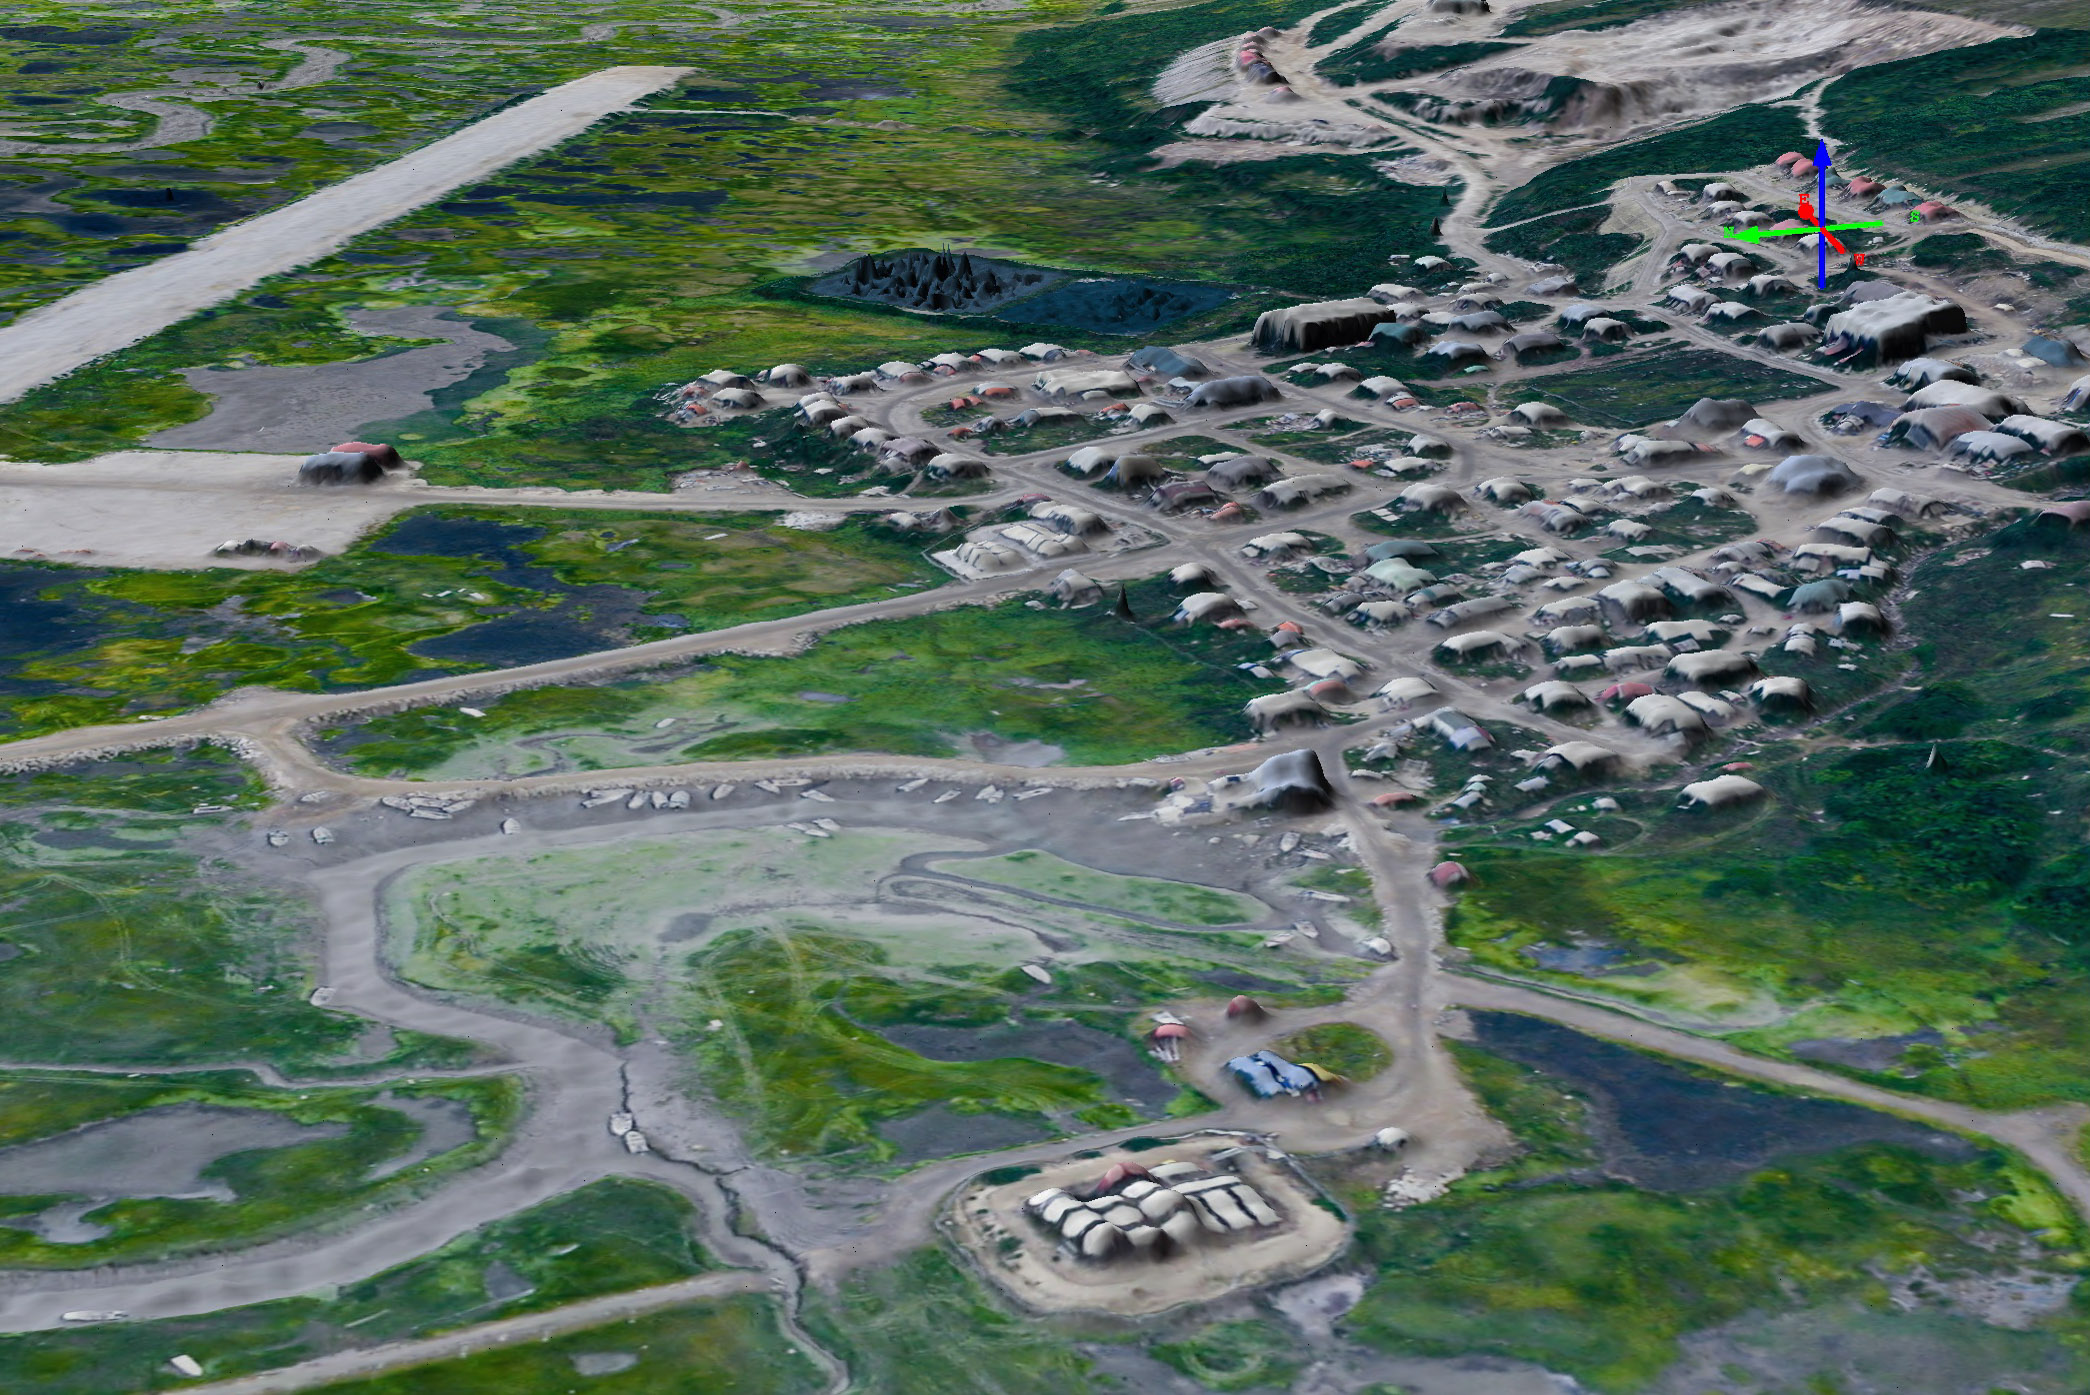
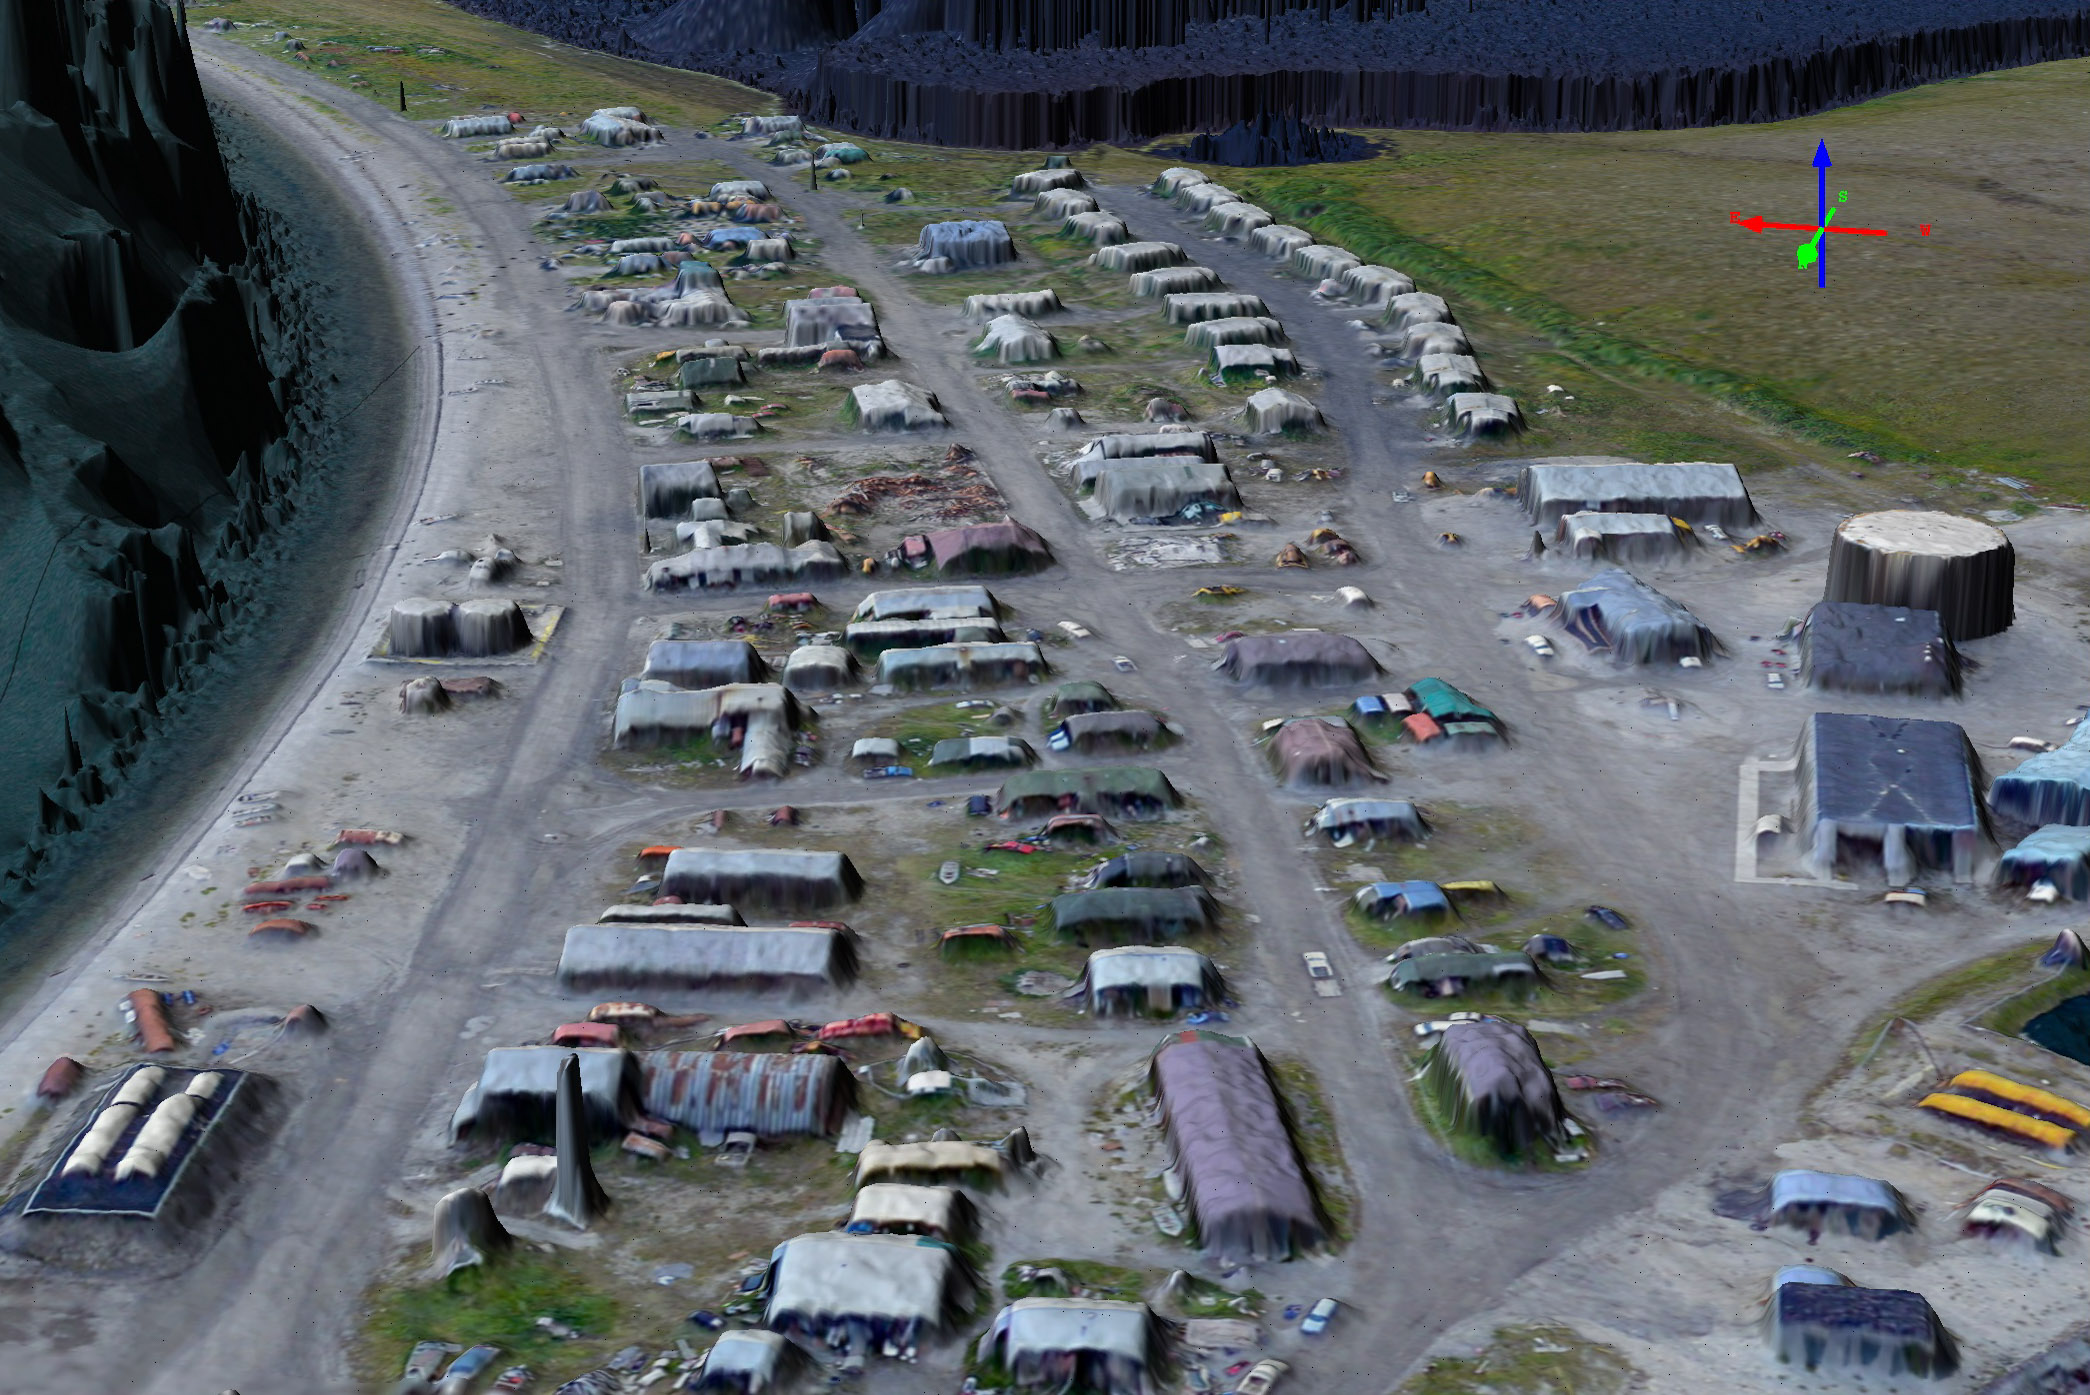
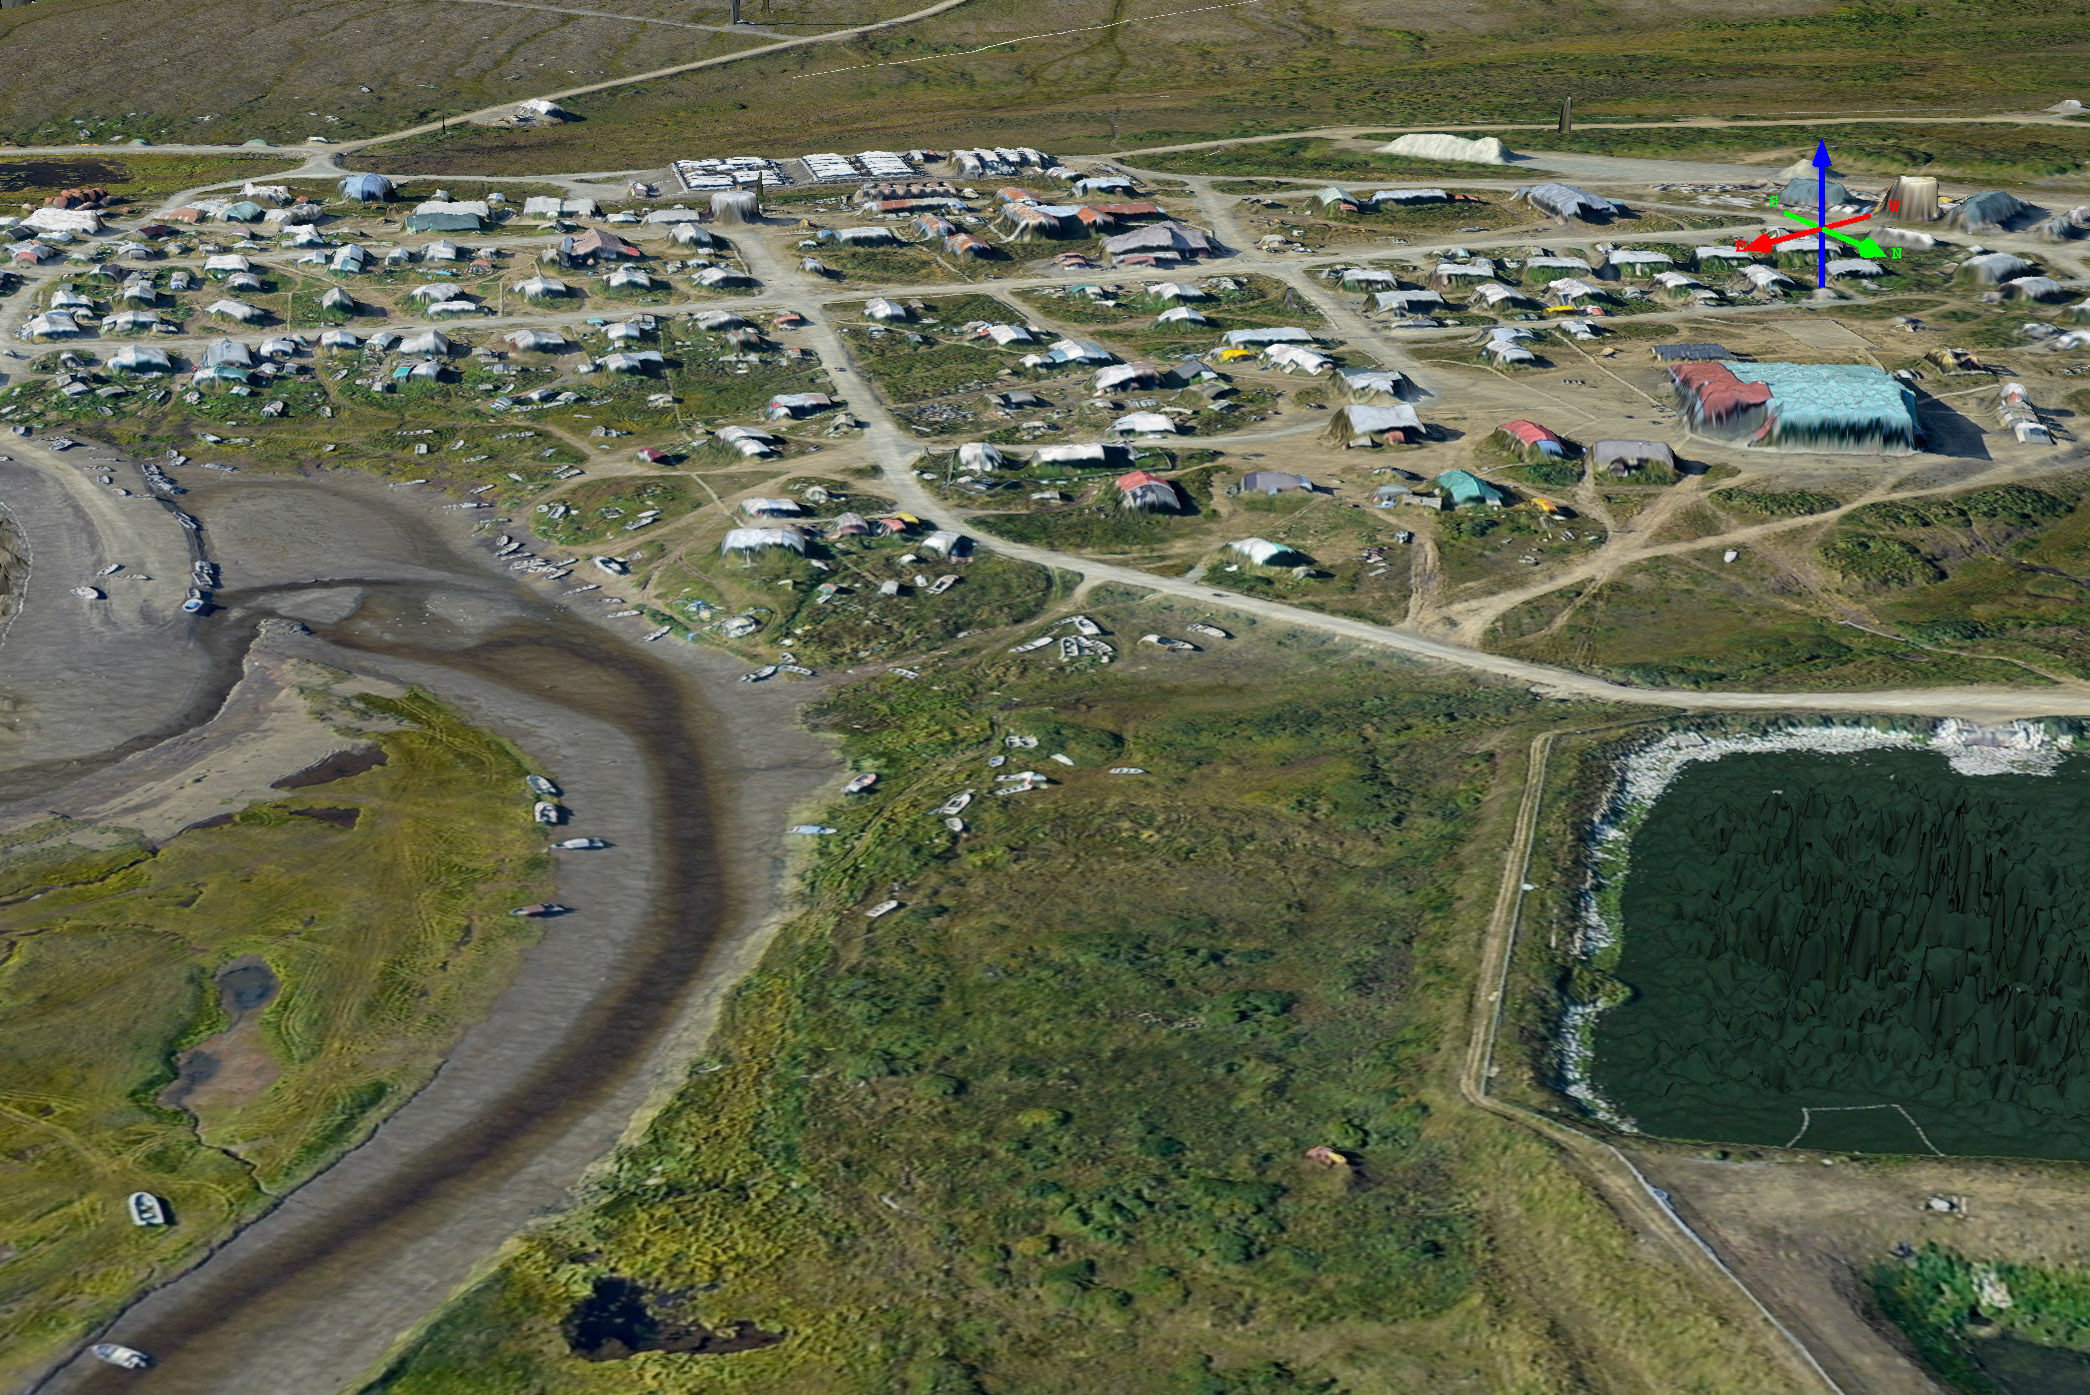
Kongiganak
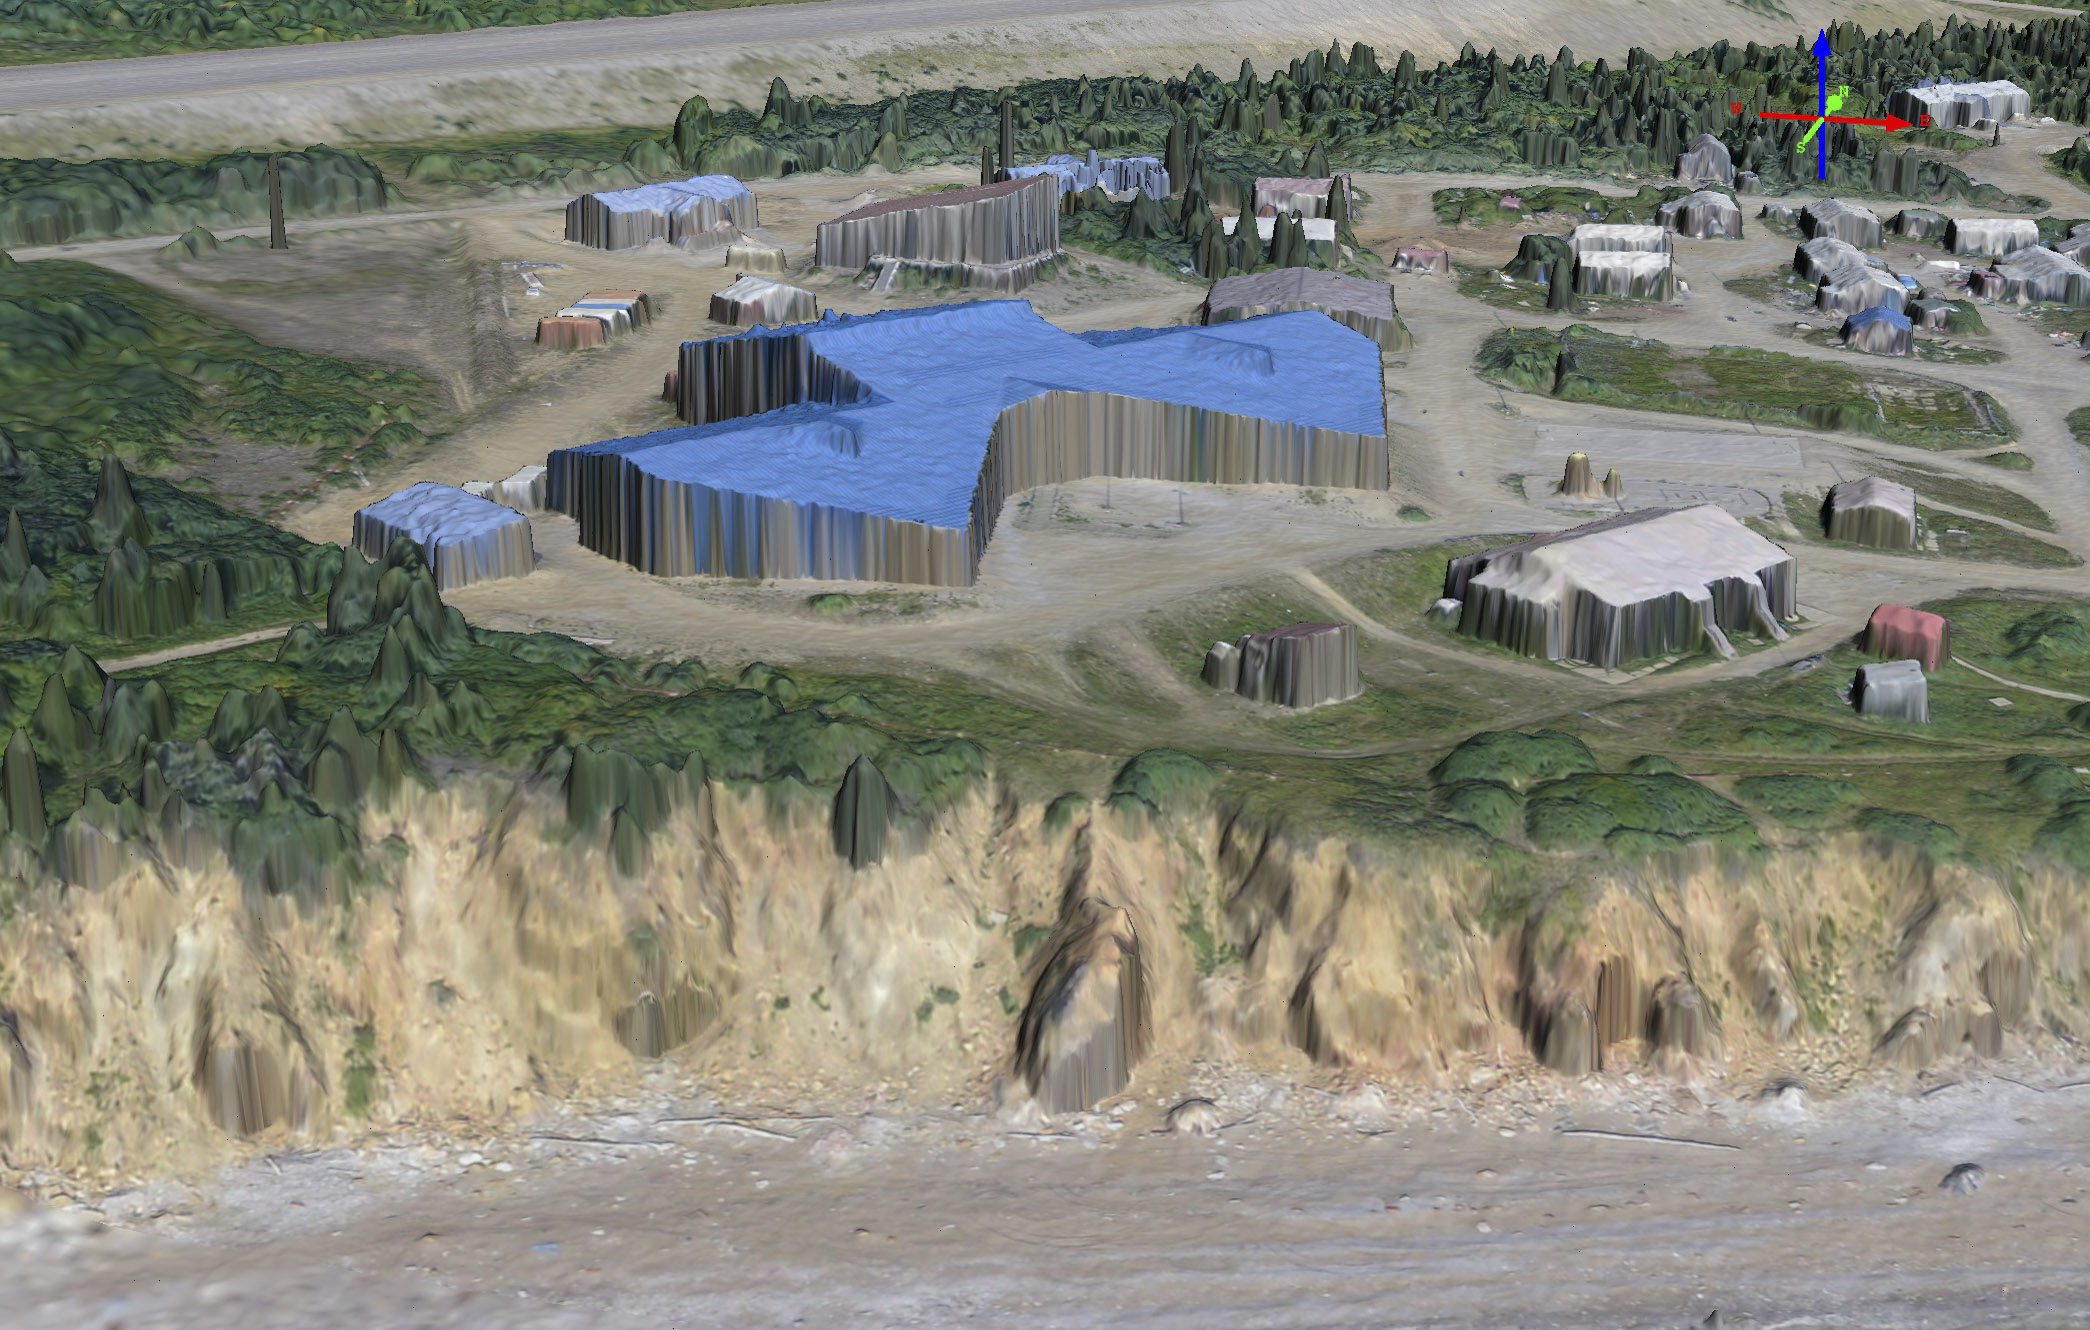
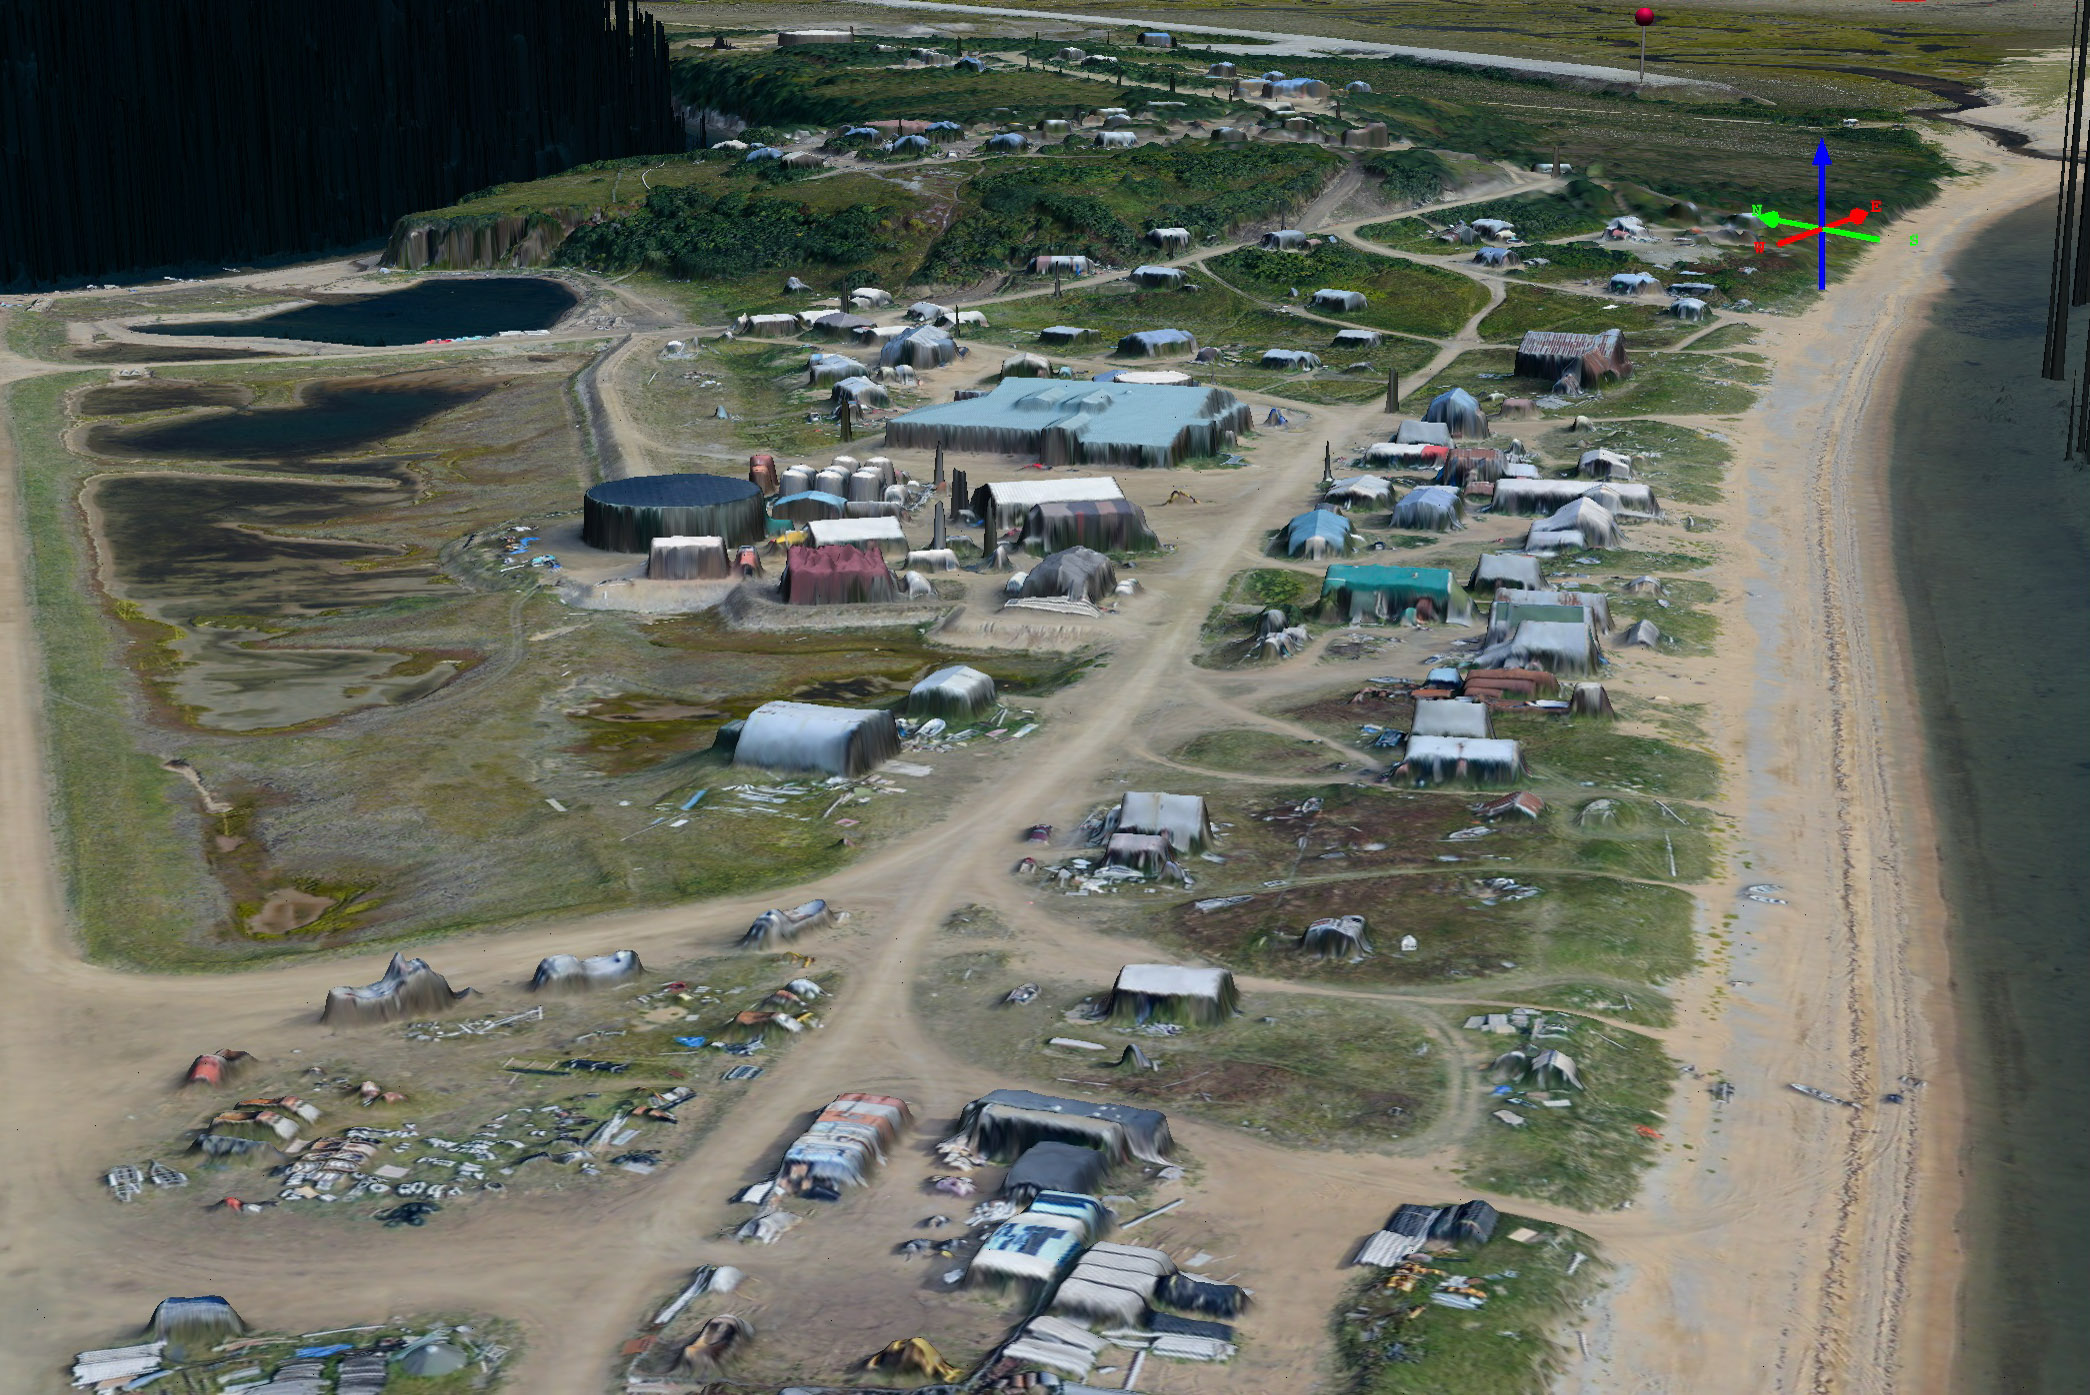
Kong is another ‘island’ village sitting just above sea level. The ground is so mushy that homes are connected by boardwalks rather than the roads.
The topography makes clear why the distribution of village infrastructure forms the patterns that it does.
You can learn more about the acquisition of the Kongilligok data here.
Kotlik
Kotlik lies on the Yukon River delta. I shot this late in the evening under a thick, dark overcast, but it still turned out fine.
Mouse-over to see how clearly the runway’s crown is measured. Providing such drainage is important to maintaining the stability of the runway surface.
Here you can see the power distribution poles running into town. In the image (mouse over) if you look closely you can see the wires in between them, but they are too narrow to resolve topographically.
You can learn more about the acquisition of the Kotlik data here.
Koyuk
Koyuk lies in the north-eastern corner of Norton Sound within tree line.
There are broad mud flats around Koyuk when the tide is out.
You can learn more about the acquisition of the Kotlik data here.
Kwigillingok
Kwig is another village lying just above sea level in a mushy part of the world.
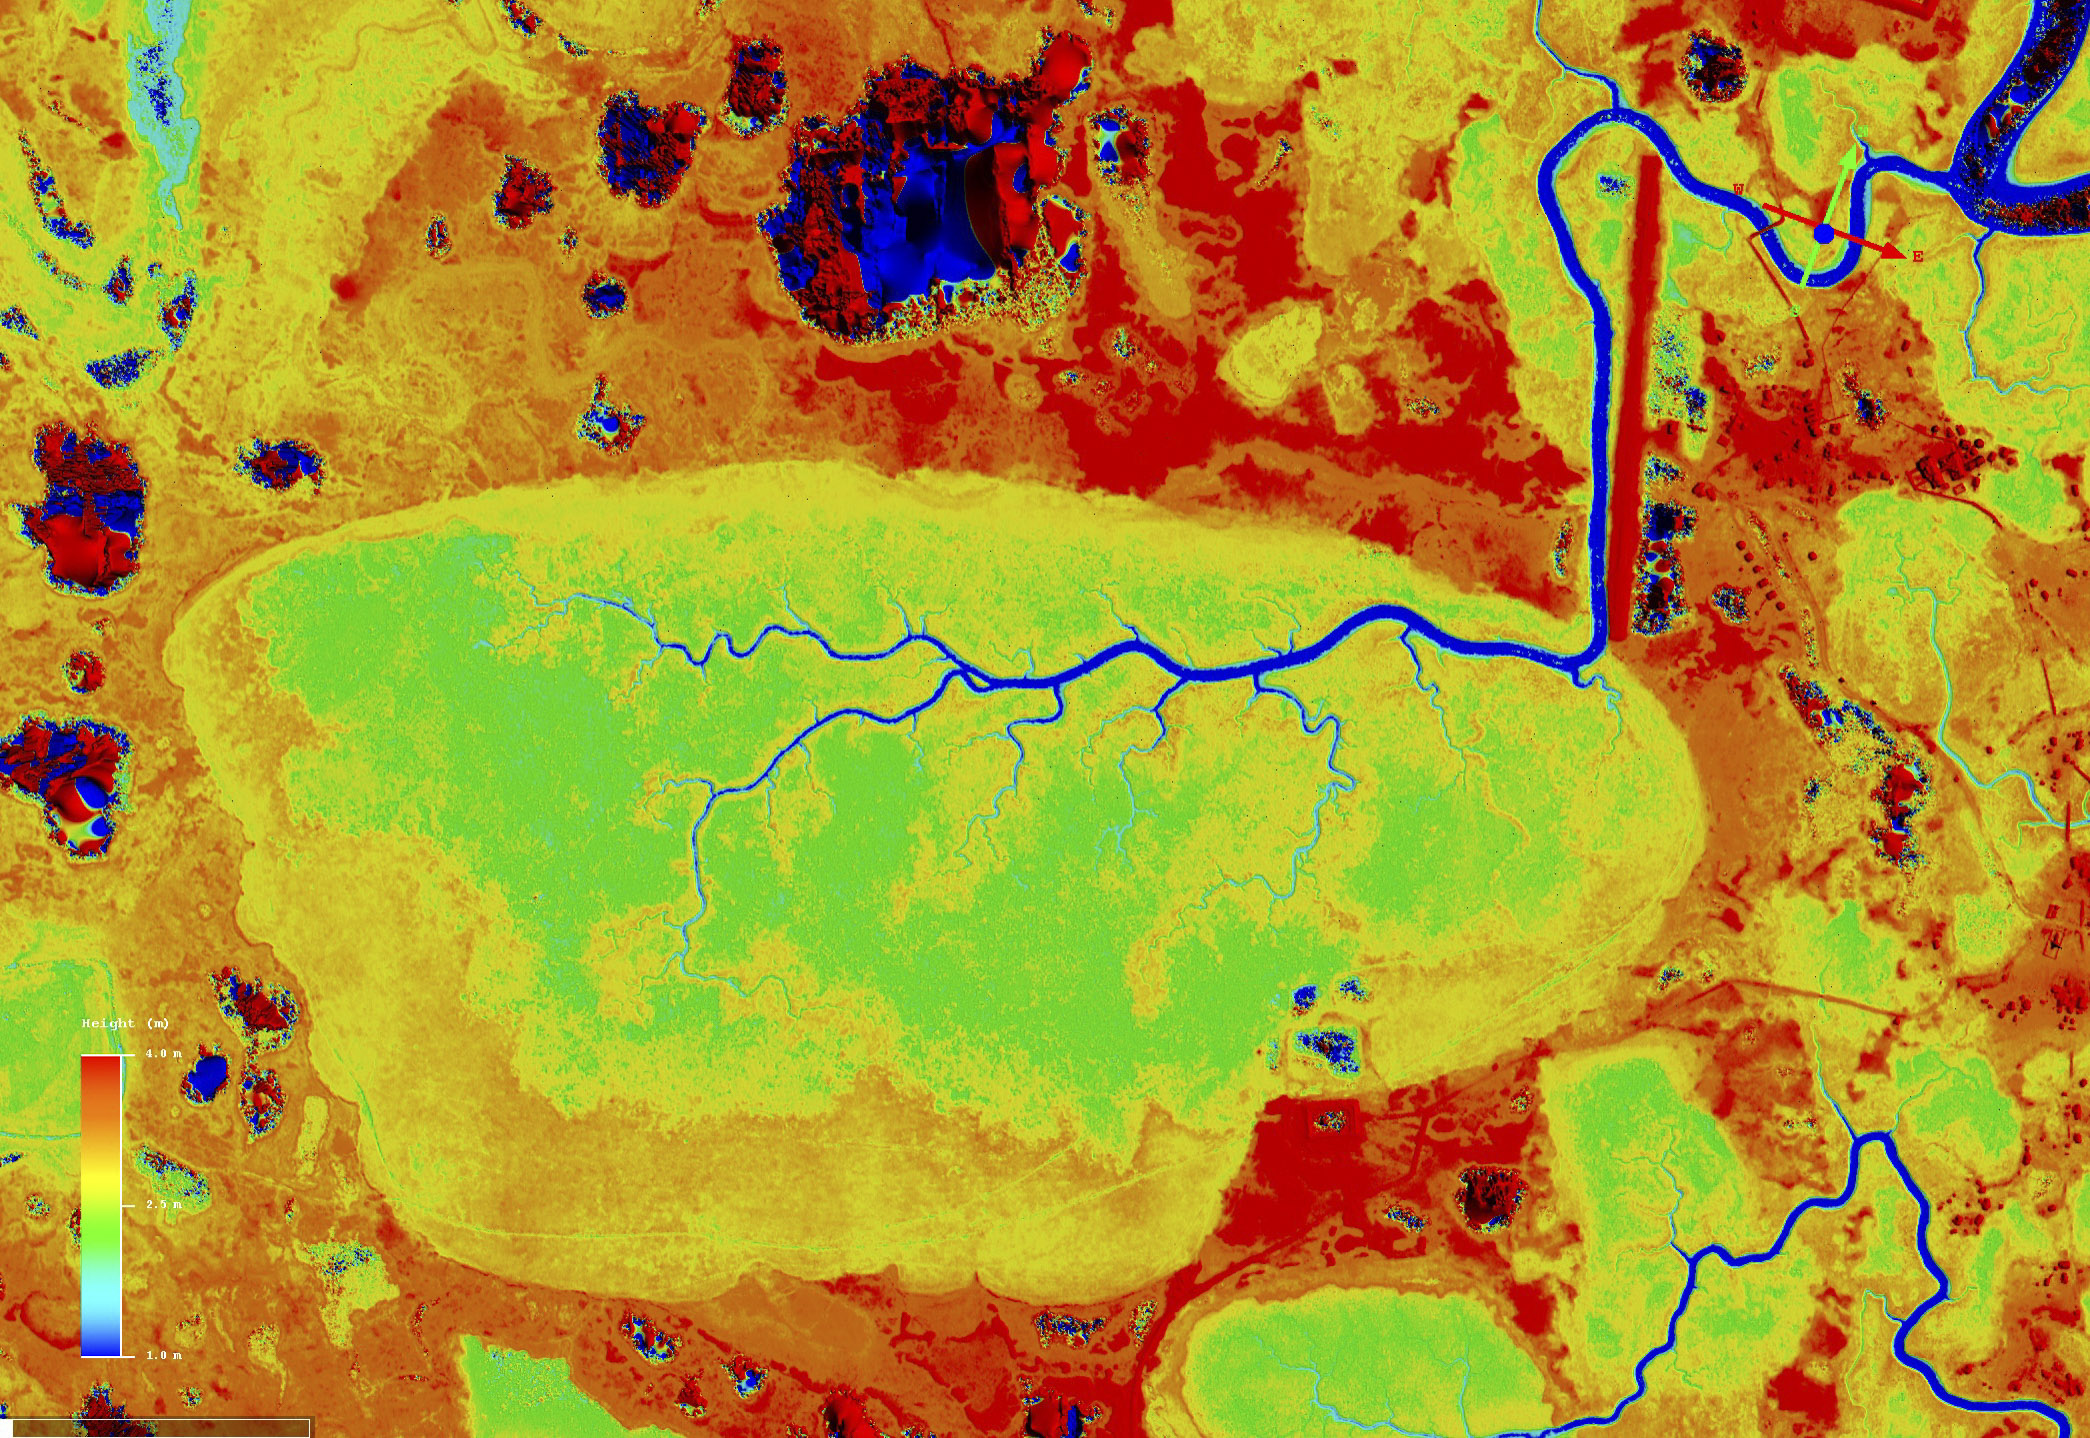
Here is a bit of the coast, showing the intersection of tundra and mud flats. The bright green tundra is that color apparently because it get submerged, being 50 cm lower than the darker green tundra. Figuring out exactly where the Mean High Water line is in areas like this is a major goal for the project. Between the ortho image and topography, there should be enough information to do it from Bethel to Wales.
Kwig also has several neat drainage features nearby. This green area used to be a lake. At some point its shoreline was breached, and it drained towards the coast. That initial drainage stream expanded into the one seen here, with braids continuing to expand like tentacles into every corner of the lake bed. This lake bed is below tide level often. The red profile line seen here was used to create the plot below. As seen visually, the land adjacent to the stream channels is 20 cm higher, due to vegetation growth. As ocean water sloshes back and forth through this network, it seems like some sediments get left behind and will gradually fill this basin.
Here is another drained lake, just west of town. The total relief here is less than 3 meters (blue to red).
Here is a close-up of one of the drainage streams that appears to be building new tundra. The vertical ticks in the plot are 10 cm, and the stream channels are 20-40 cm deep. The bright green tundra is less than a meter higher than the darker green tundra.
You can learn more about the acquisition of the Kwigingillok data here.
Napakiak
Napakiak was one of the biggest acquisition challenges because it was only a few miles south of Bethel and on a very popular route for commercial operators.
You can learn more about the acquisition of the Napakiak data here.
Newtok
Newtok is perhaps the lowest lying village of them all, surrounding mostly by water and swamp at or near sea level.
This was the only village we did not acquire below mean high water, as you can sea water encroaching on the right and left. Mouse over to see boat topography.
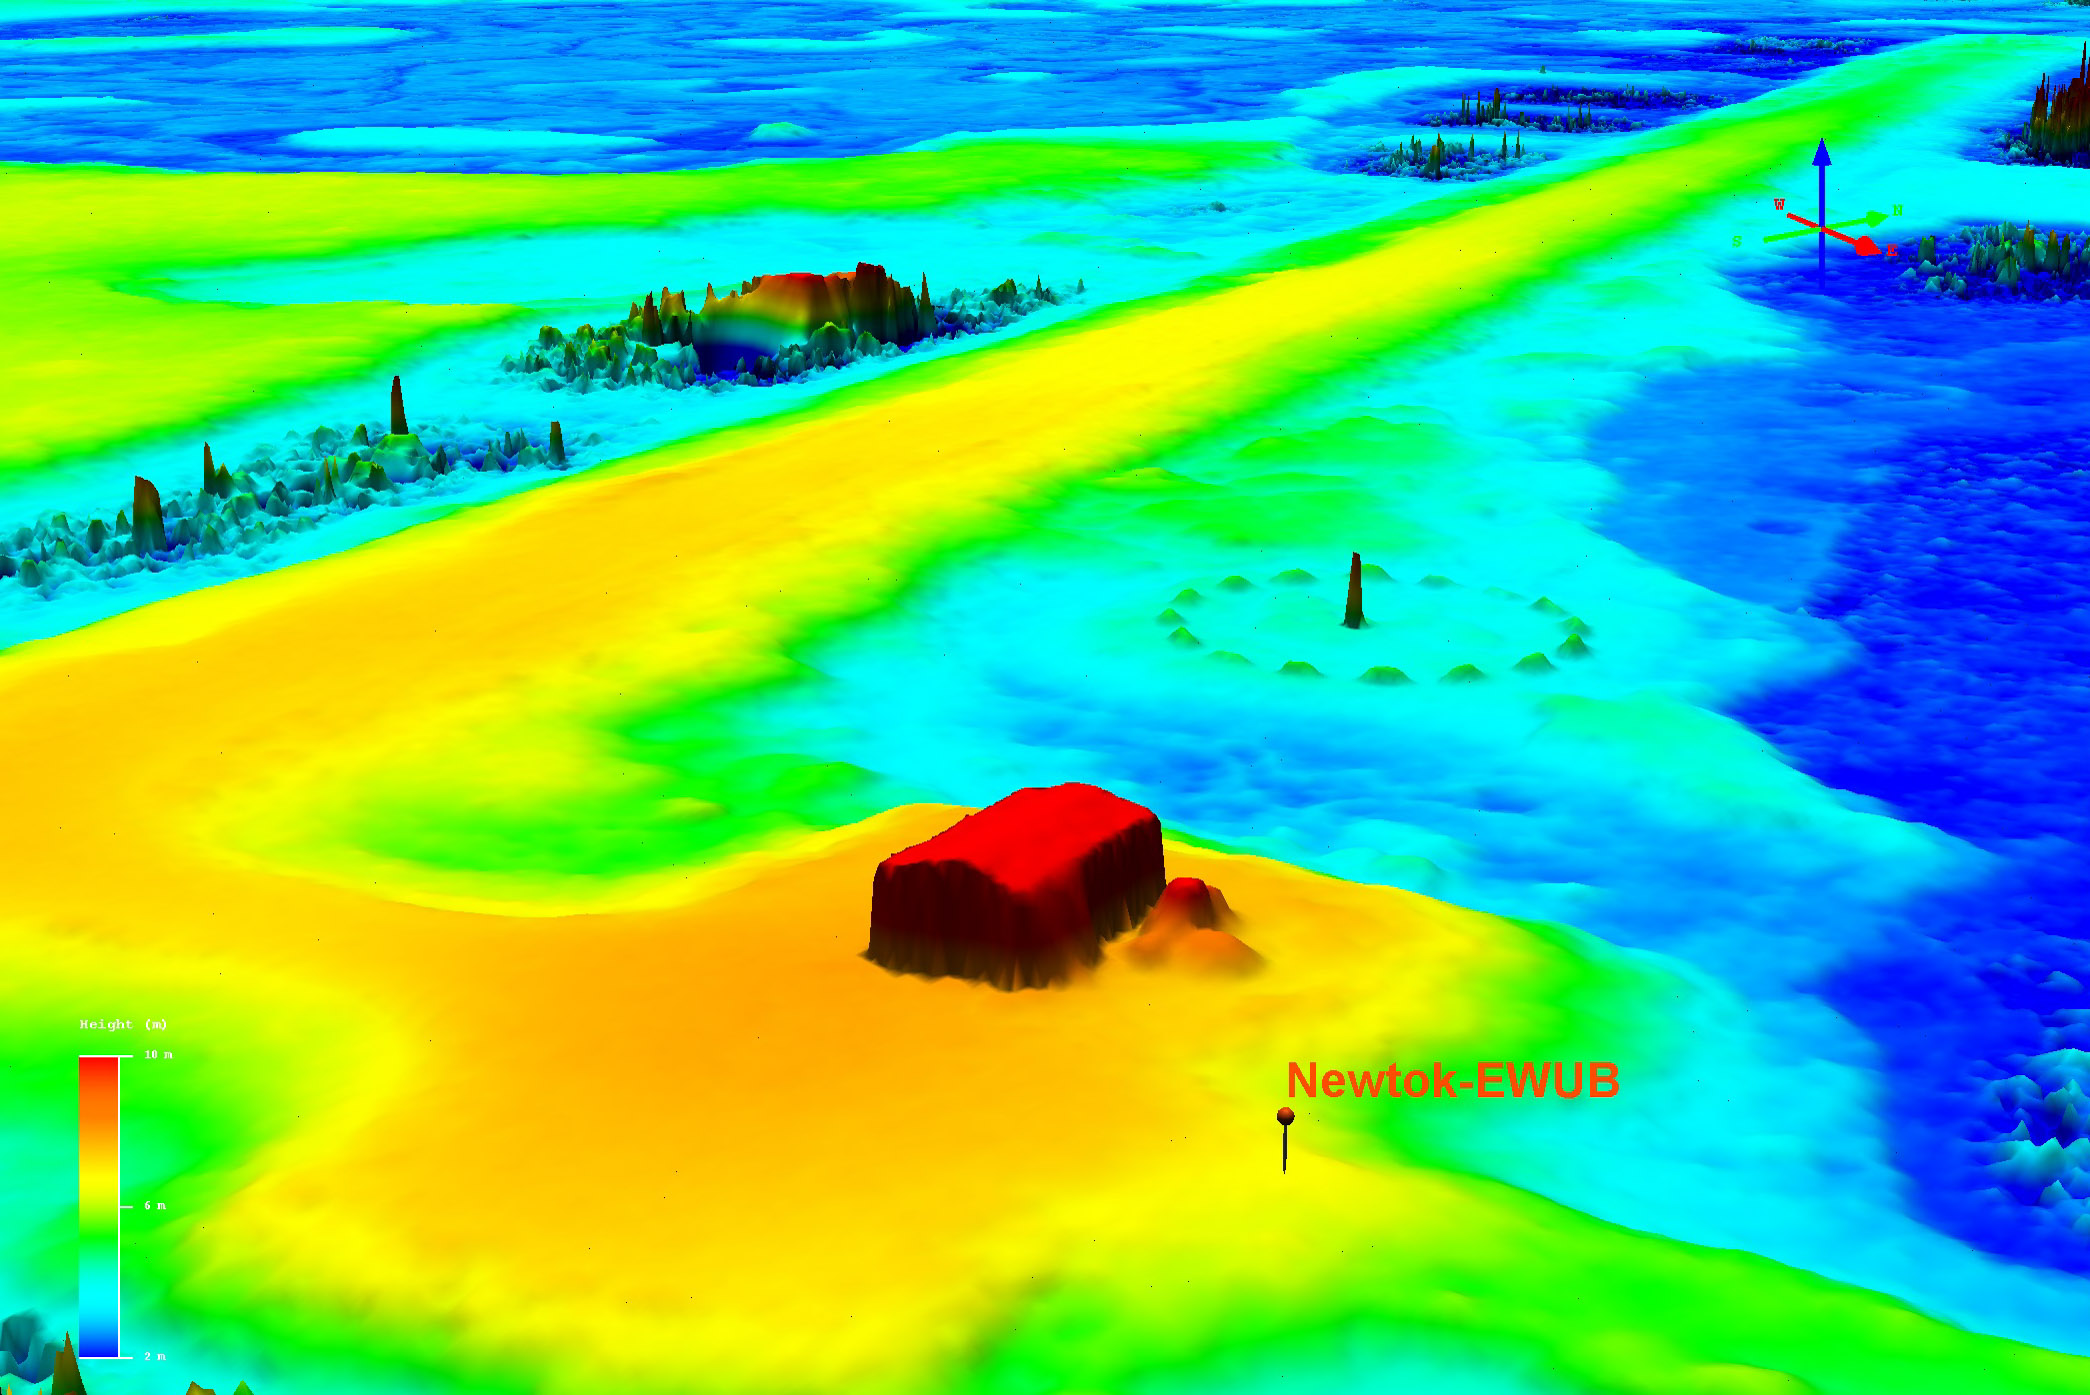
Here the runway has been built up to be mostly above sea level. The marker shows one of our GCPs.
You can learn more about the acquisition of the Newtok data here.
Nightmute
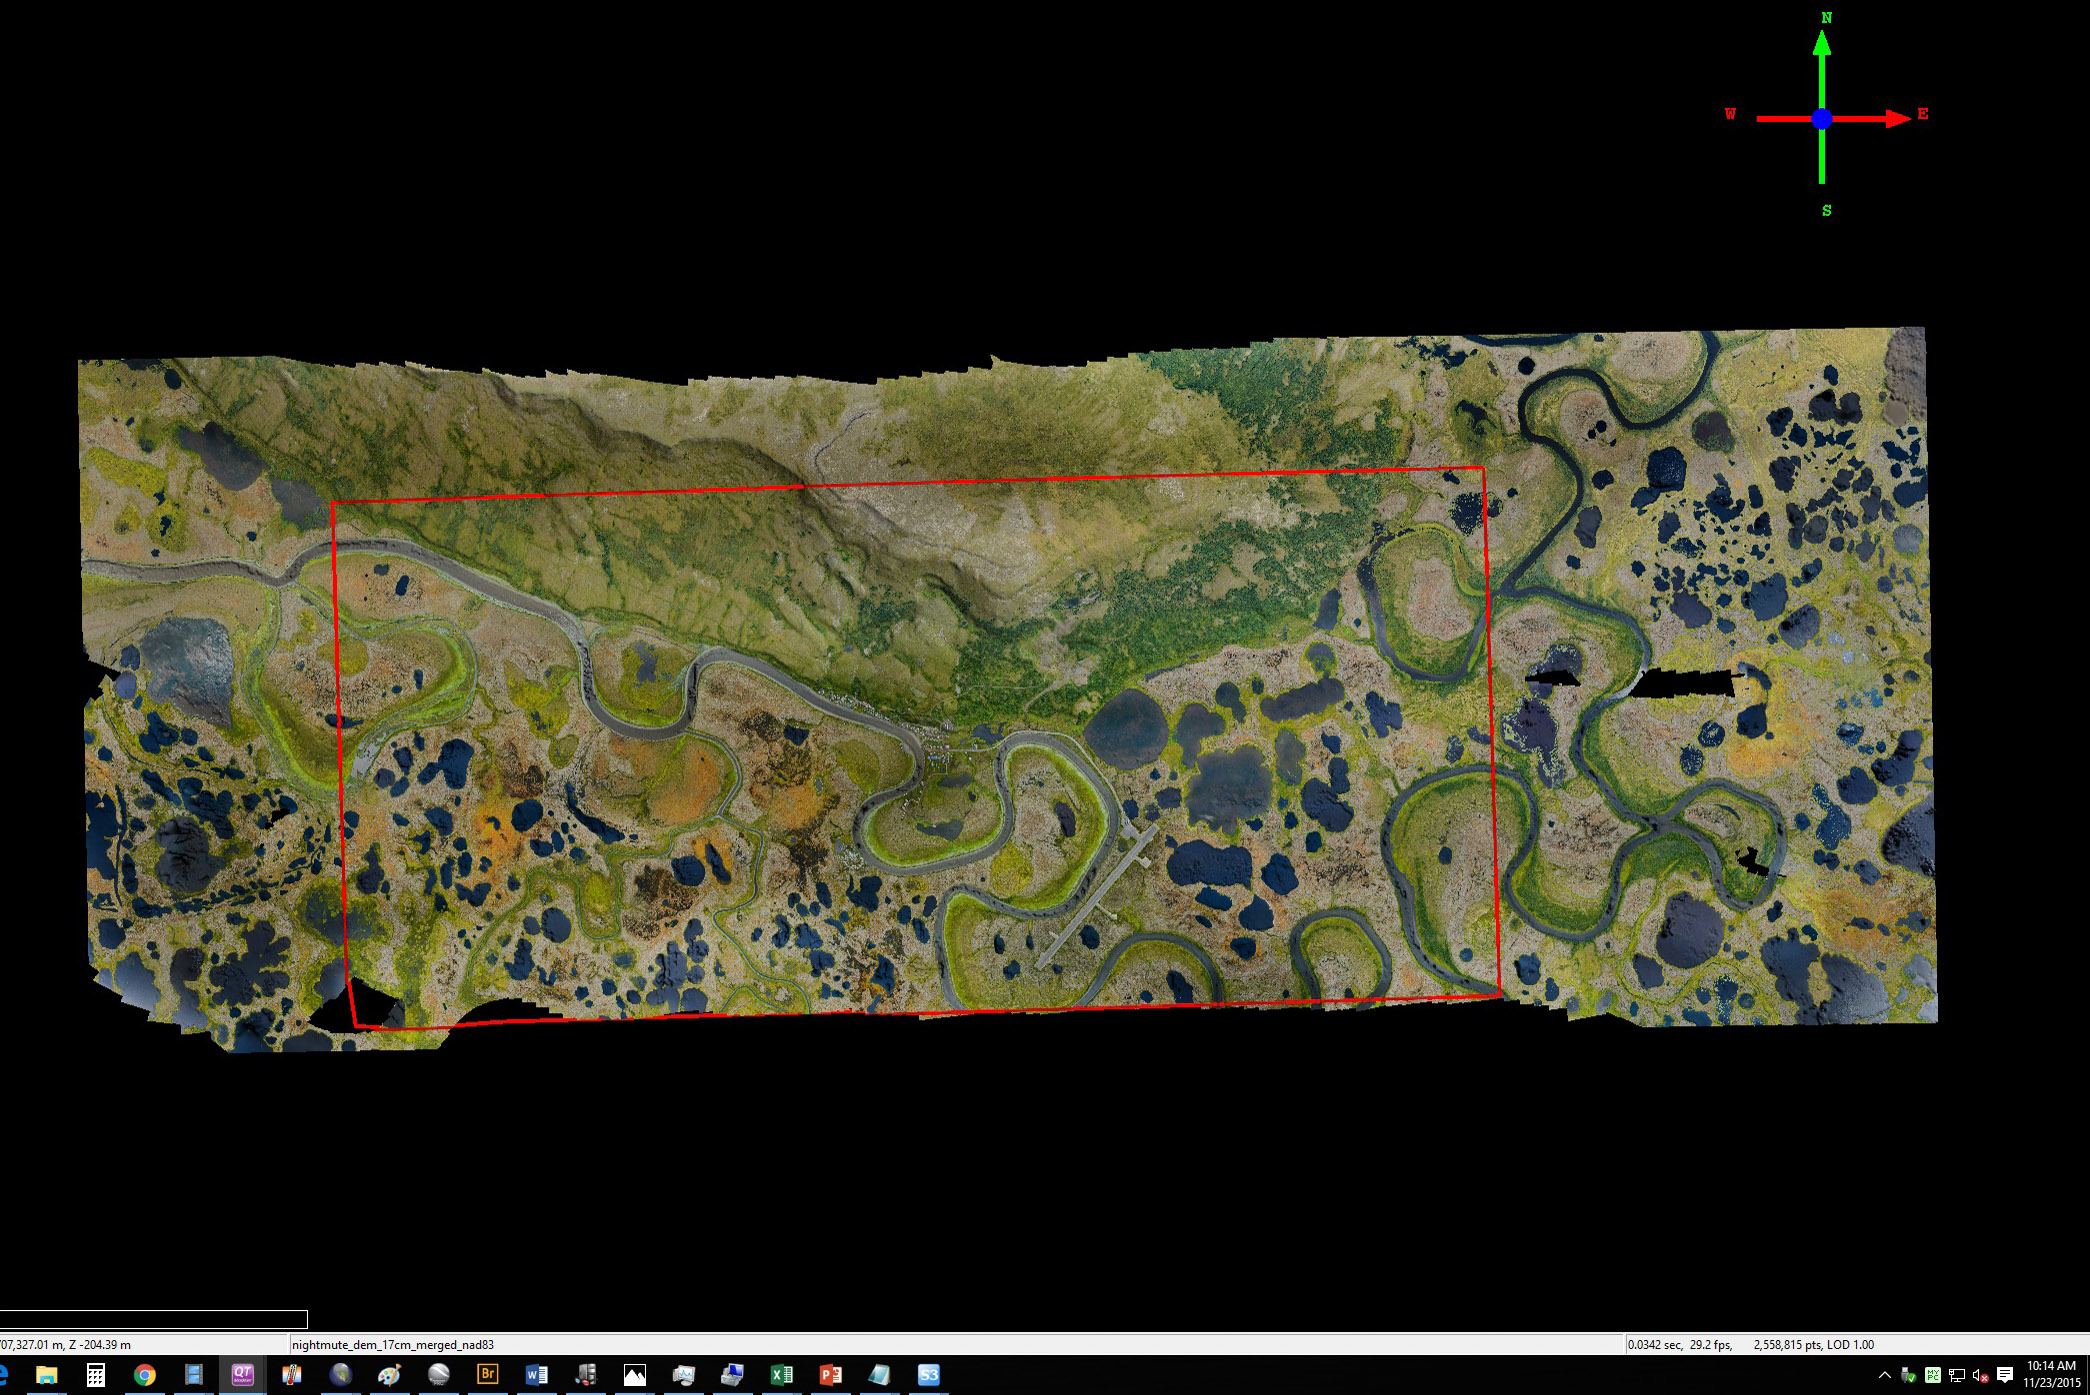 Nightmute was a challenge to map due to weather and had to be acquired in full on two separate days, though you could hardly tell where the break is.
You can learn more about the acquisition of the Nightmute data here.
Nome
 Nome is a small city, and has put a lot of effort into protecting itself. You can learn more about the acquisition and see a short video describing how the data might be used here.
The infrastructure around Nome is well protected against storm surge swells.
Besides being several meters above sea level, the beaches have been armored to protect the buildings on Front Street, which are the most vulnerable to storms.
You can learn more about the Nome acquisition and see a video describing its potential use in flood prediction here.
Nunam Iqua
Nunam Iqua lies along the Yukon River near its mouth and is very low lying. It is situated on a very interesting peninsula geomorphologically.
 The runway at Nunam, note the proximity to sea level and the crown captured by the data.
You can learn more about the acquisition of the Nunam Iqua data here.
Scammon Bay
Scammon Bay was the only site I mapped completely by eye, as I was not planning to map it that day and didnt have the mission plan with me, but the weather beckoned. So the resulting map was a little larger than needed…
The village lies along a hillside, but much of it is at or near sea level.
You can learn more about the acquisition of the Scammon Bay data here.
Shaktoolik
Shaktoolik is a low lying coastal village, hemmed in by the ocean to the west and a river inlet to the east.
Here you can see how close the village is to the ocean (left). A protective barrier has been created, but it does seem like trouble here is never going to be far away. Note the wave-cuts at left in blue.
You can learn more about the acquisition of the Shaktoolik data here.
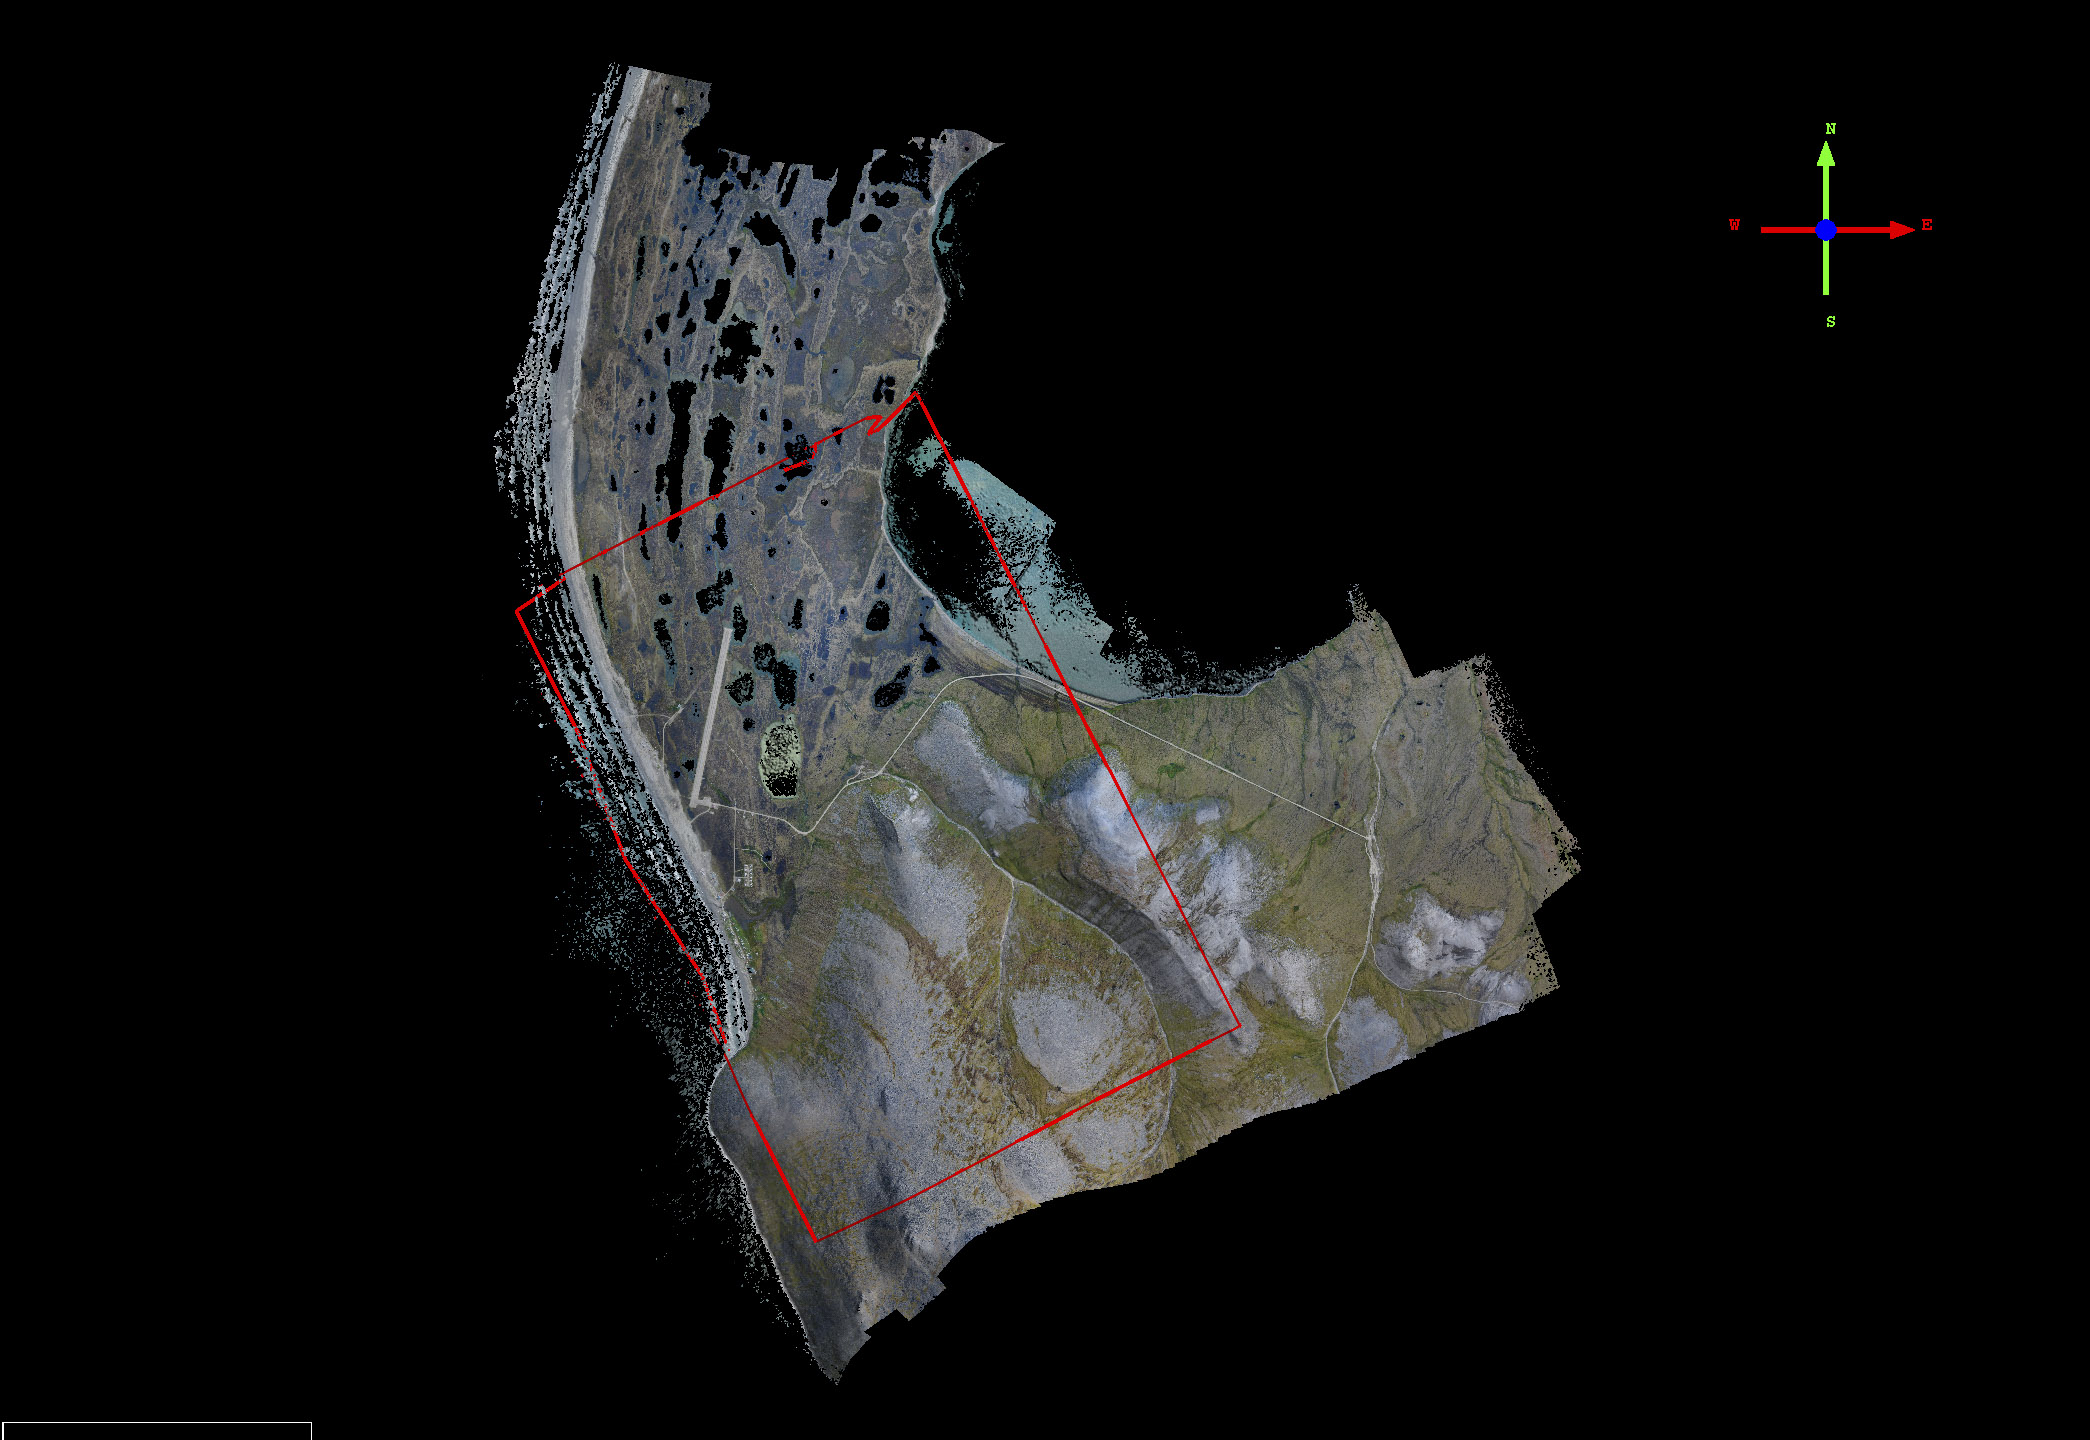
Stebbins and St Michaels
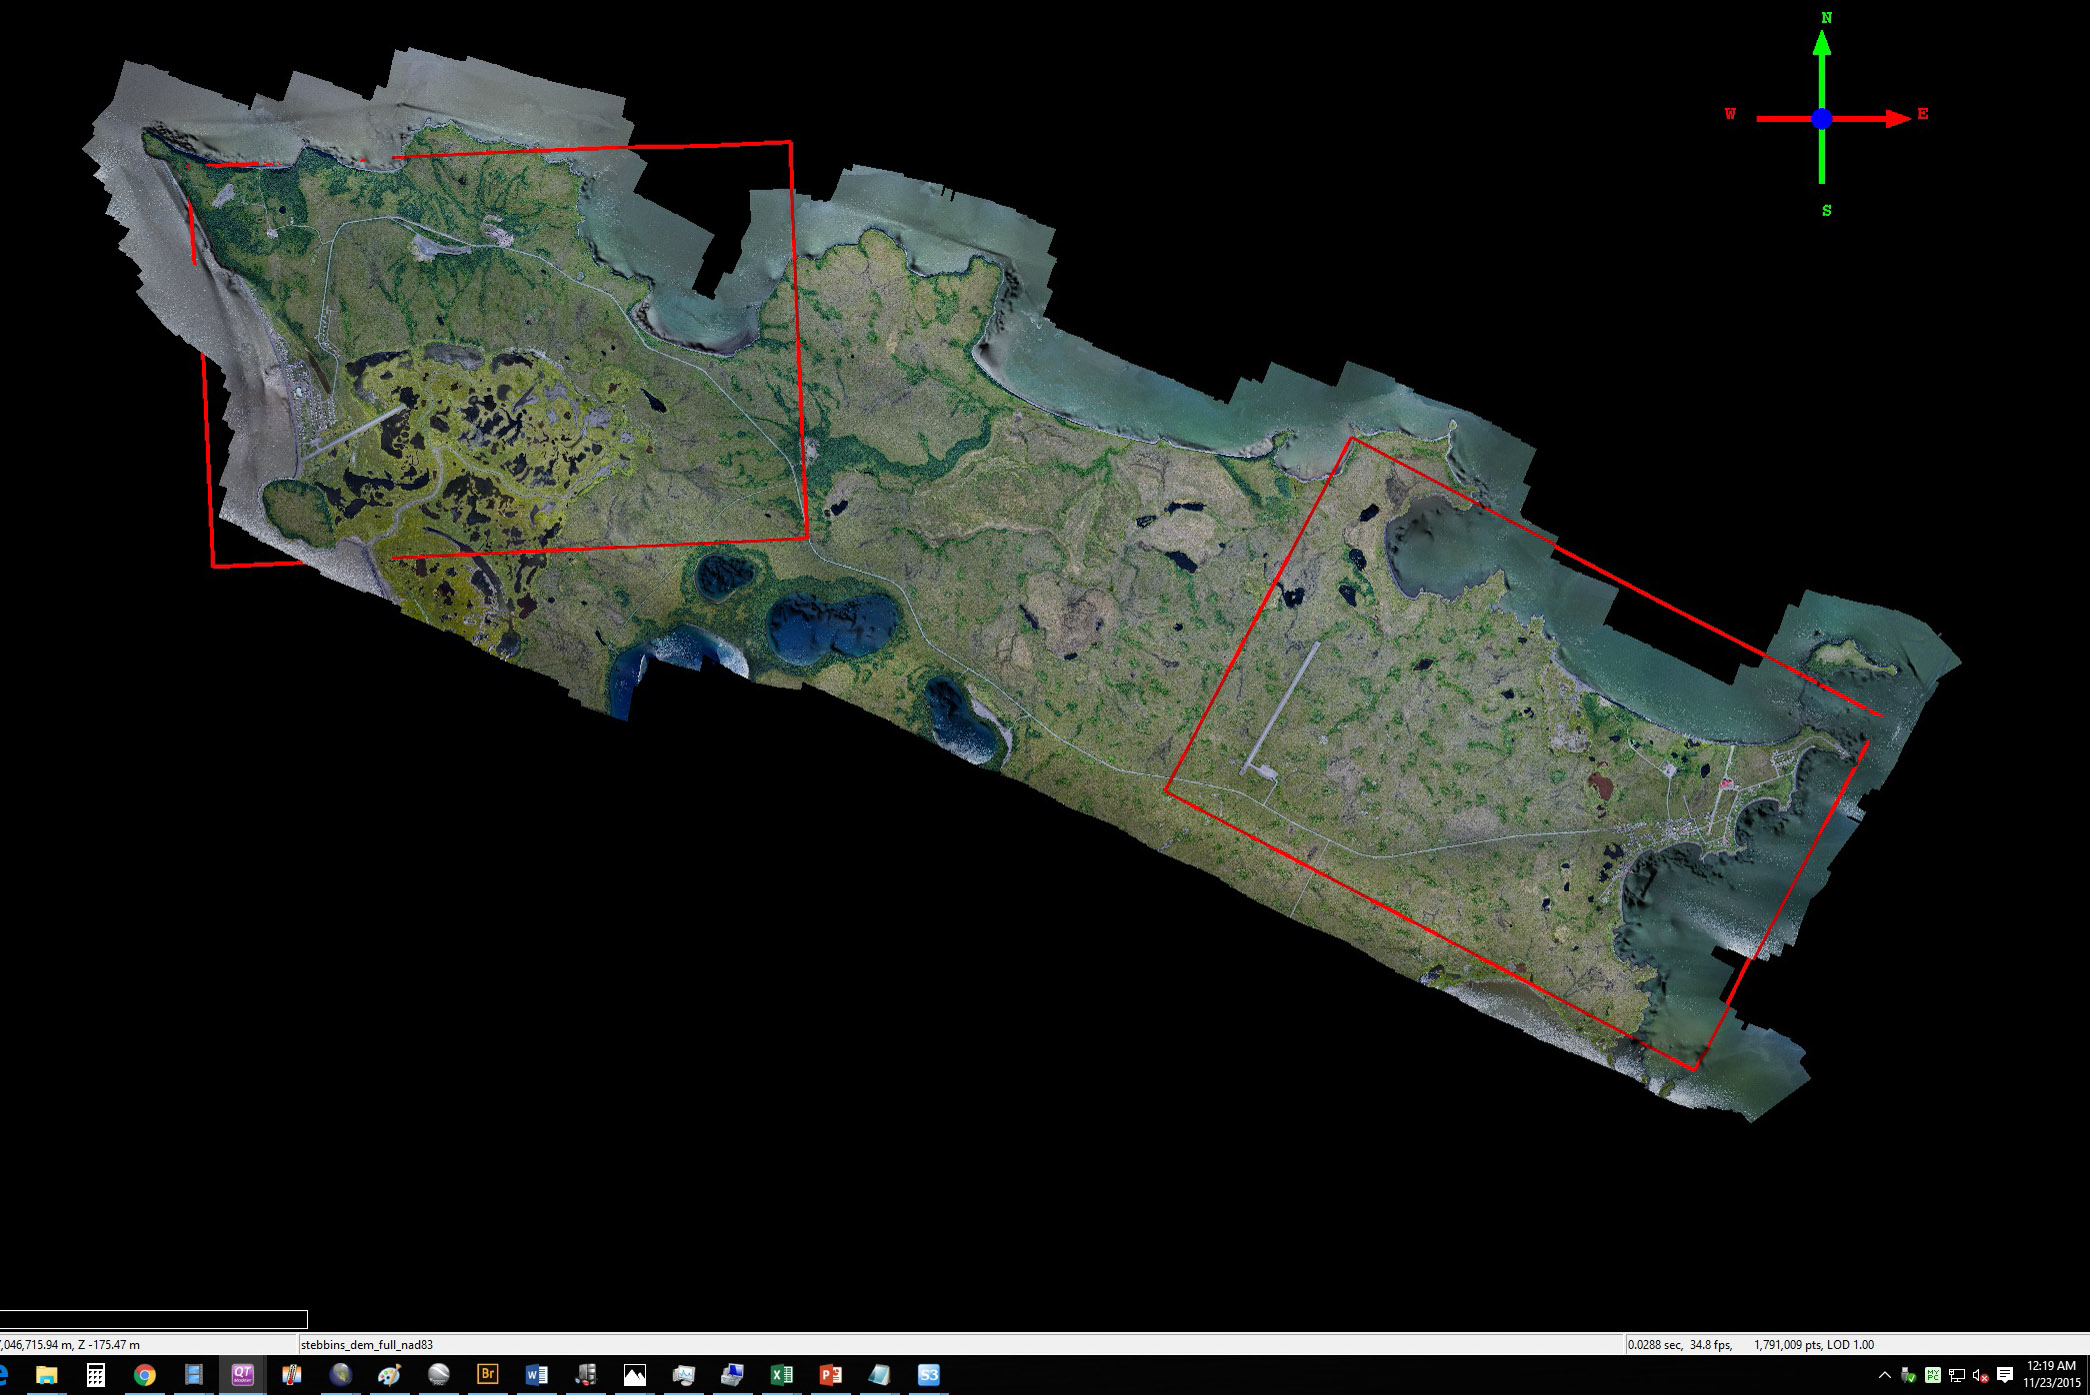
Stebbins and St Michael are located on a beautiful peninsula that appears to be volcanic in origin, based on the number of small craters lying around. Though only a few miles apart with a road between them, both have the own runways. My limited experience there shows that the weather can be beautiful in one village and awful in the other.
You can learn more about the acquisition of the Stebbins and St Michaels data here.
Teller
Teller is located just south of Brevig Mission, separated by a small channel between the two peninsulas seen here.
Most of the town is low lying, despite the hillside behind it, with a road that goes all the way to Nome.
You can learn more about the acquisition of the Teller data here and here.
Toksook Bay
Toksook Bay is located on a beautiful rocky peninsula, shared with the village of Tununak.
Toksook Bay is a boating community. Note boat topography.
You can learn more about the acquisition of the Toksook Bay data here.
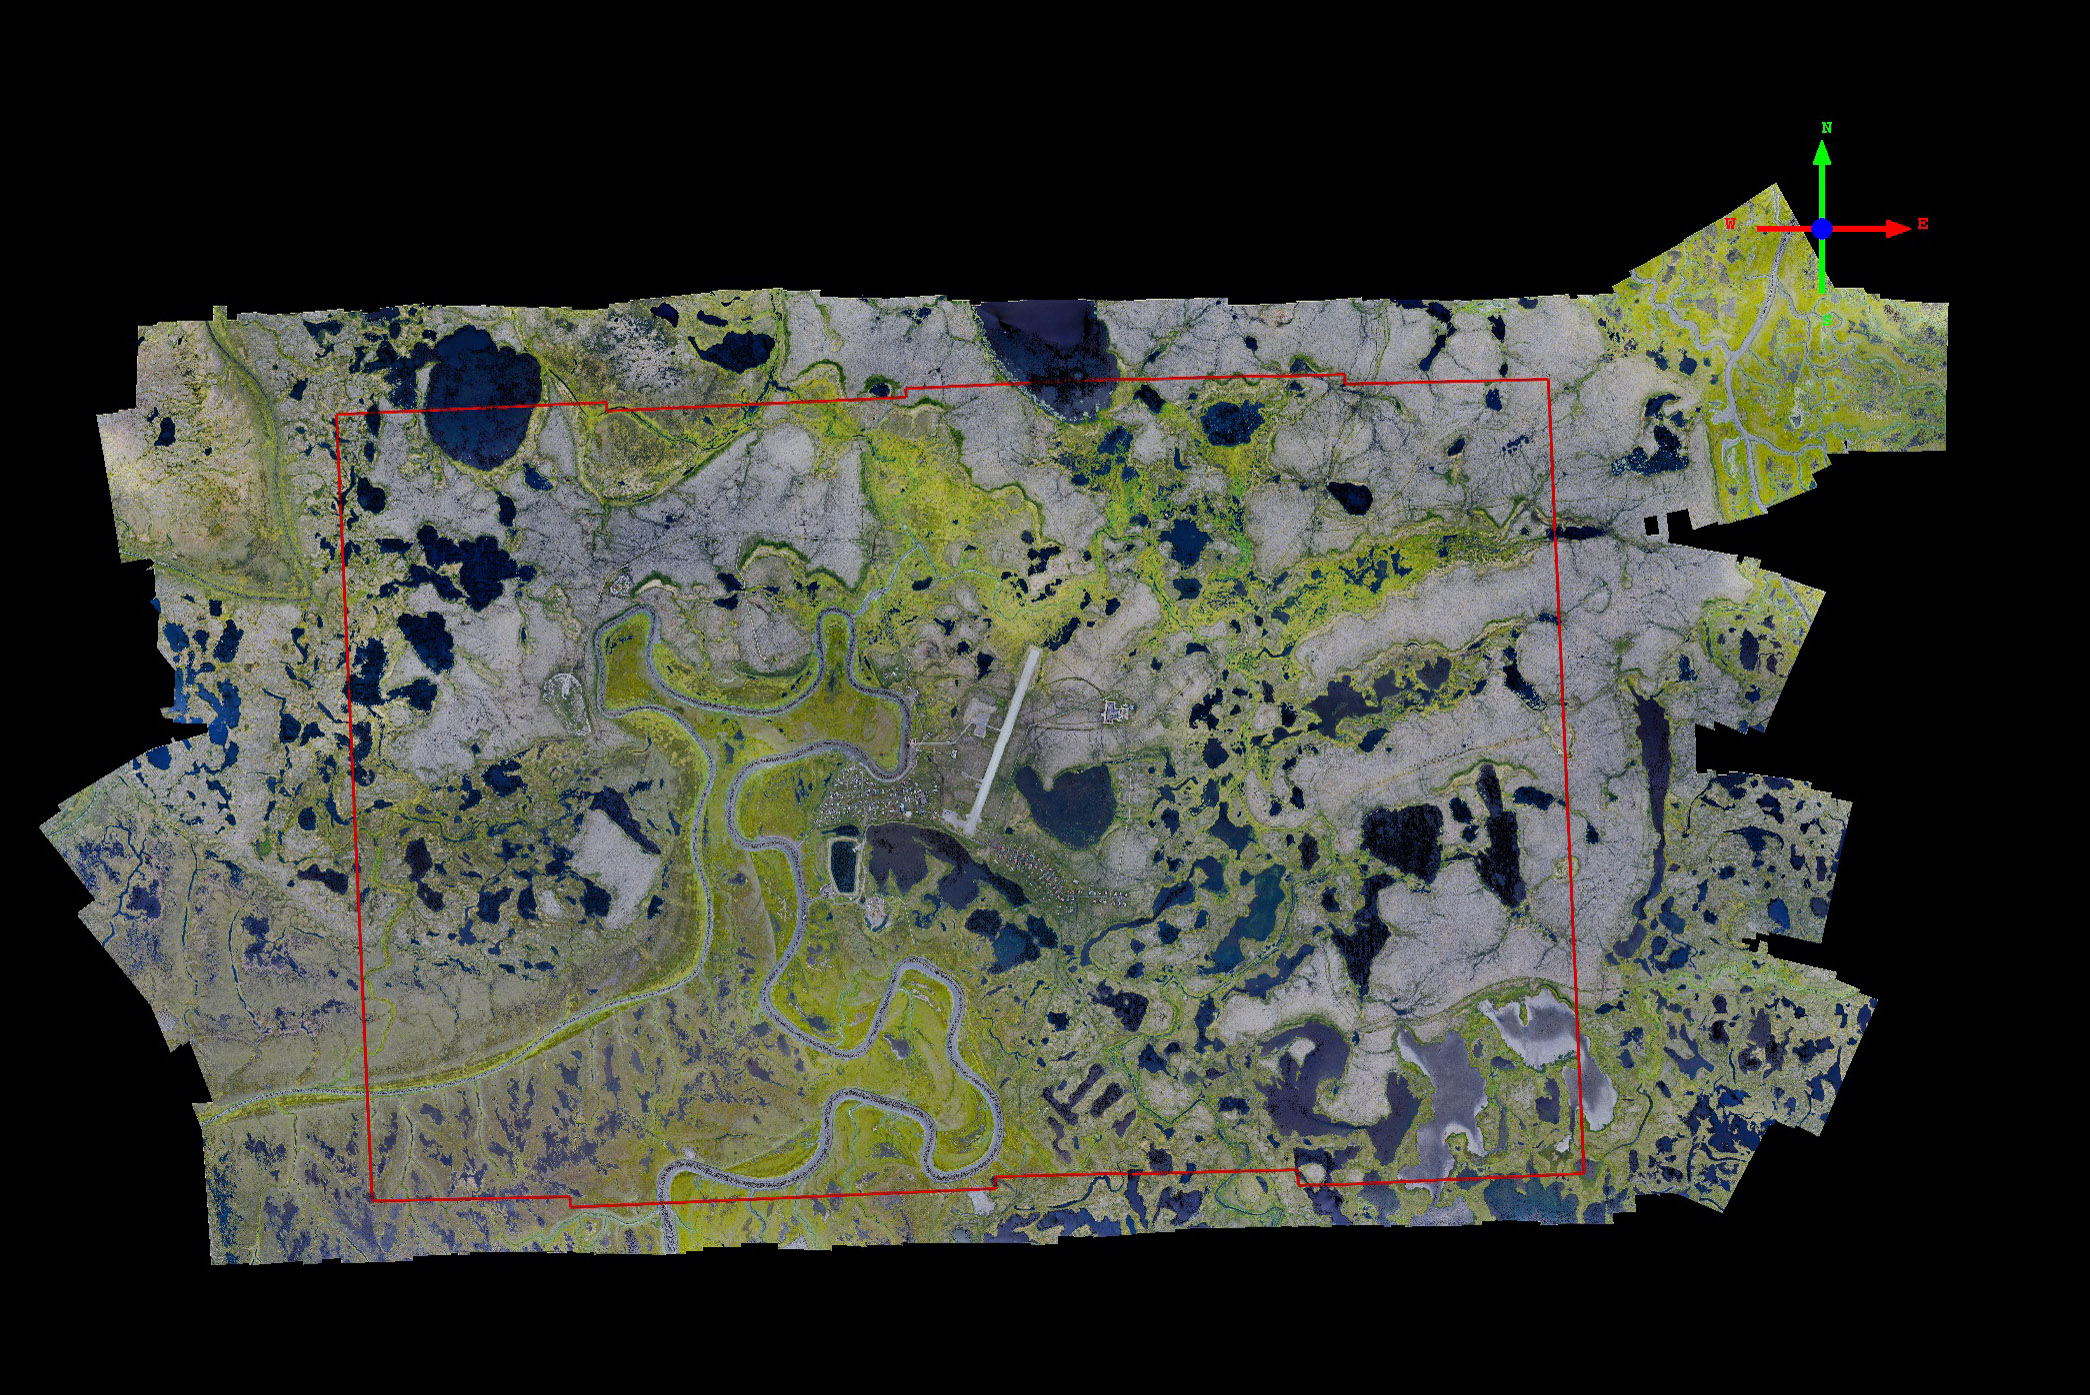
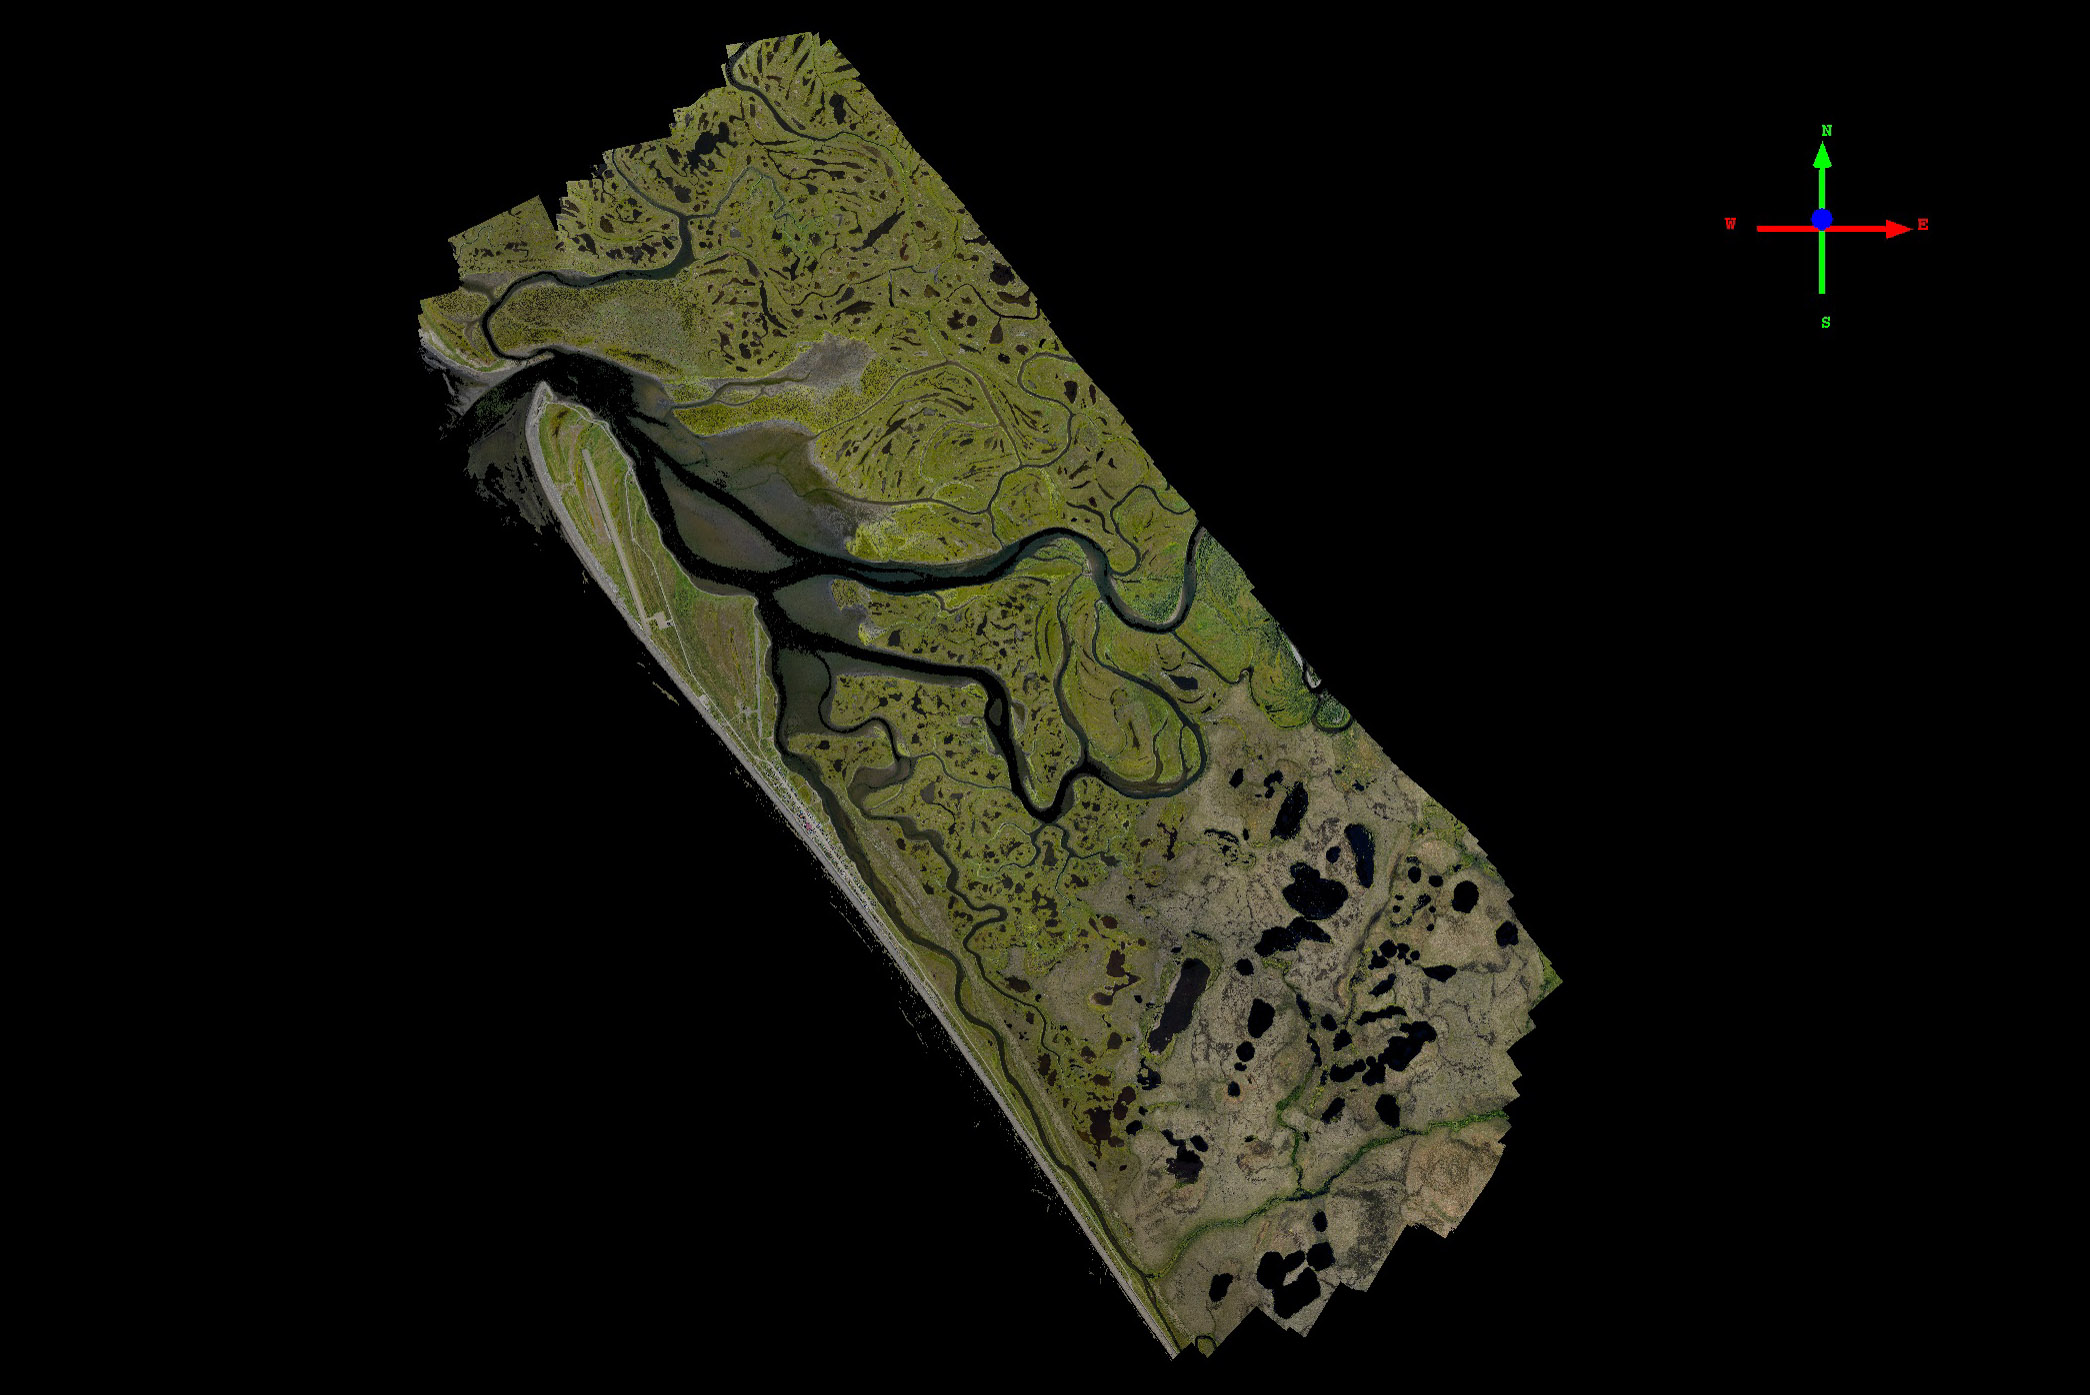
Tuntutuliak
Tunt is located along the Kuskokwim river south of Bethel. Though its several miles inland, it is quite low lying, with village infrastructure essentially located on islands within the tundra swamps.
Here you can see that all of the homes and town infrastructure are located on rises only 1-2 m above the surrounding tundra ponds.
The homes are connected by an extensive boardwalk system, wide enough to drive four wheelers and small vehicles on.
Here again is an example of one of the prime uses of these data — determining the location of the mean high water line. The steepest drop off is at the edge of the mud flats, at 30-40 cm.
You can learn more about the acquisition of the Tuntutuliak data here and here.
Tununak
Tununak lies just across the peninsula from Toksook Bay (outline at lower right).
You can learn more about the acquisition of the Tunanak data here.
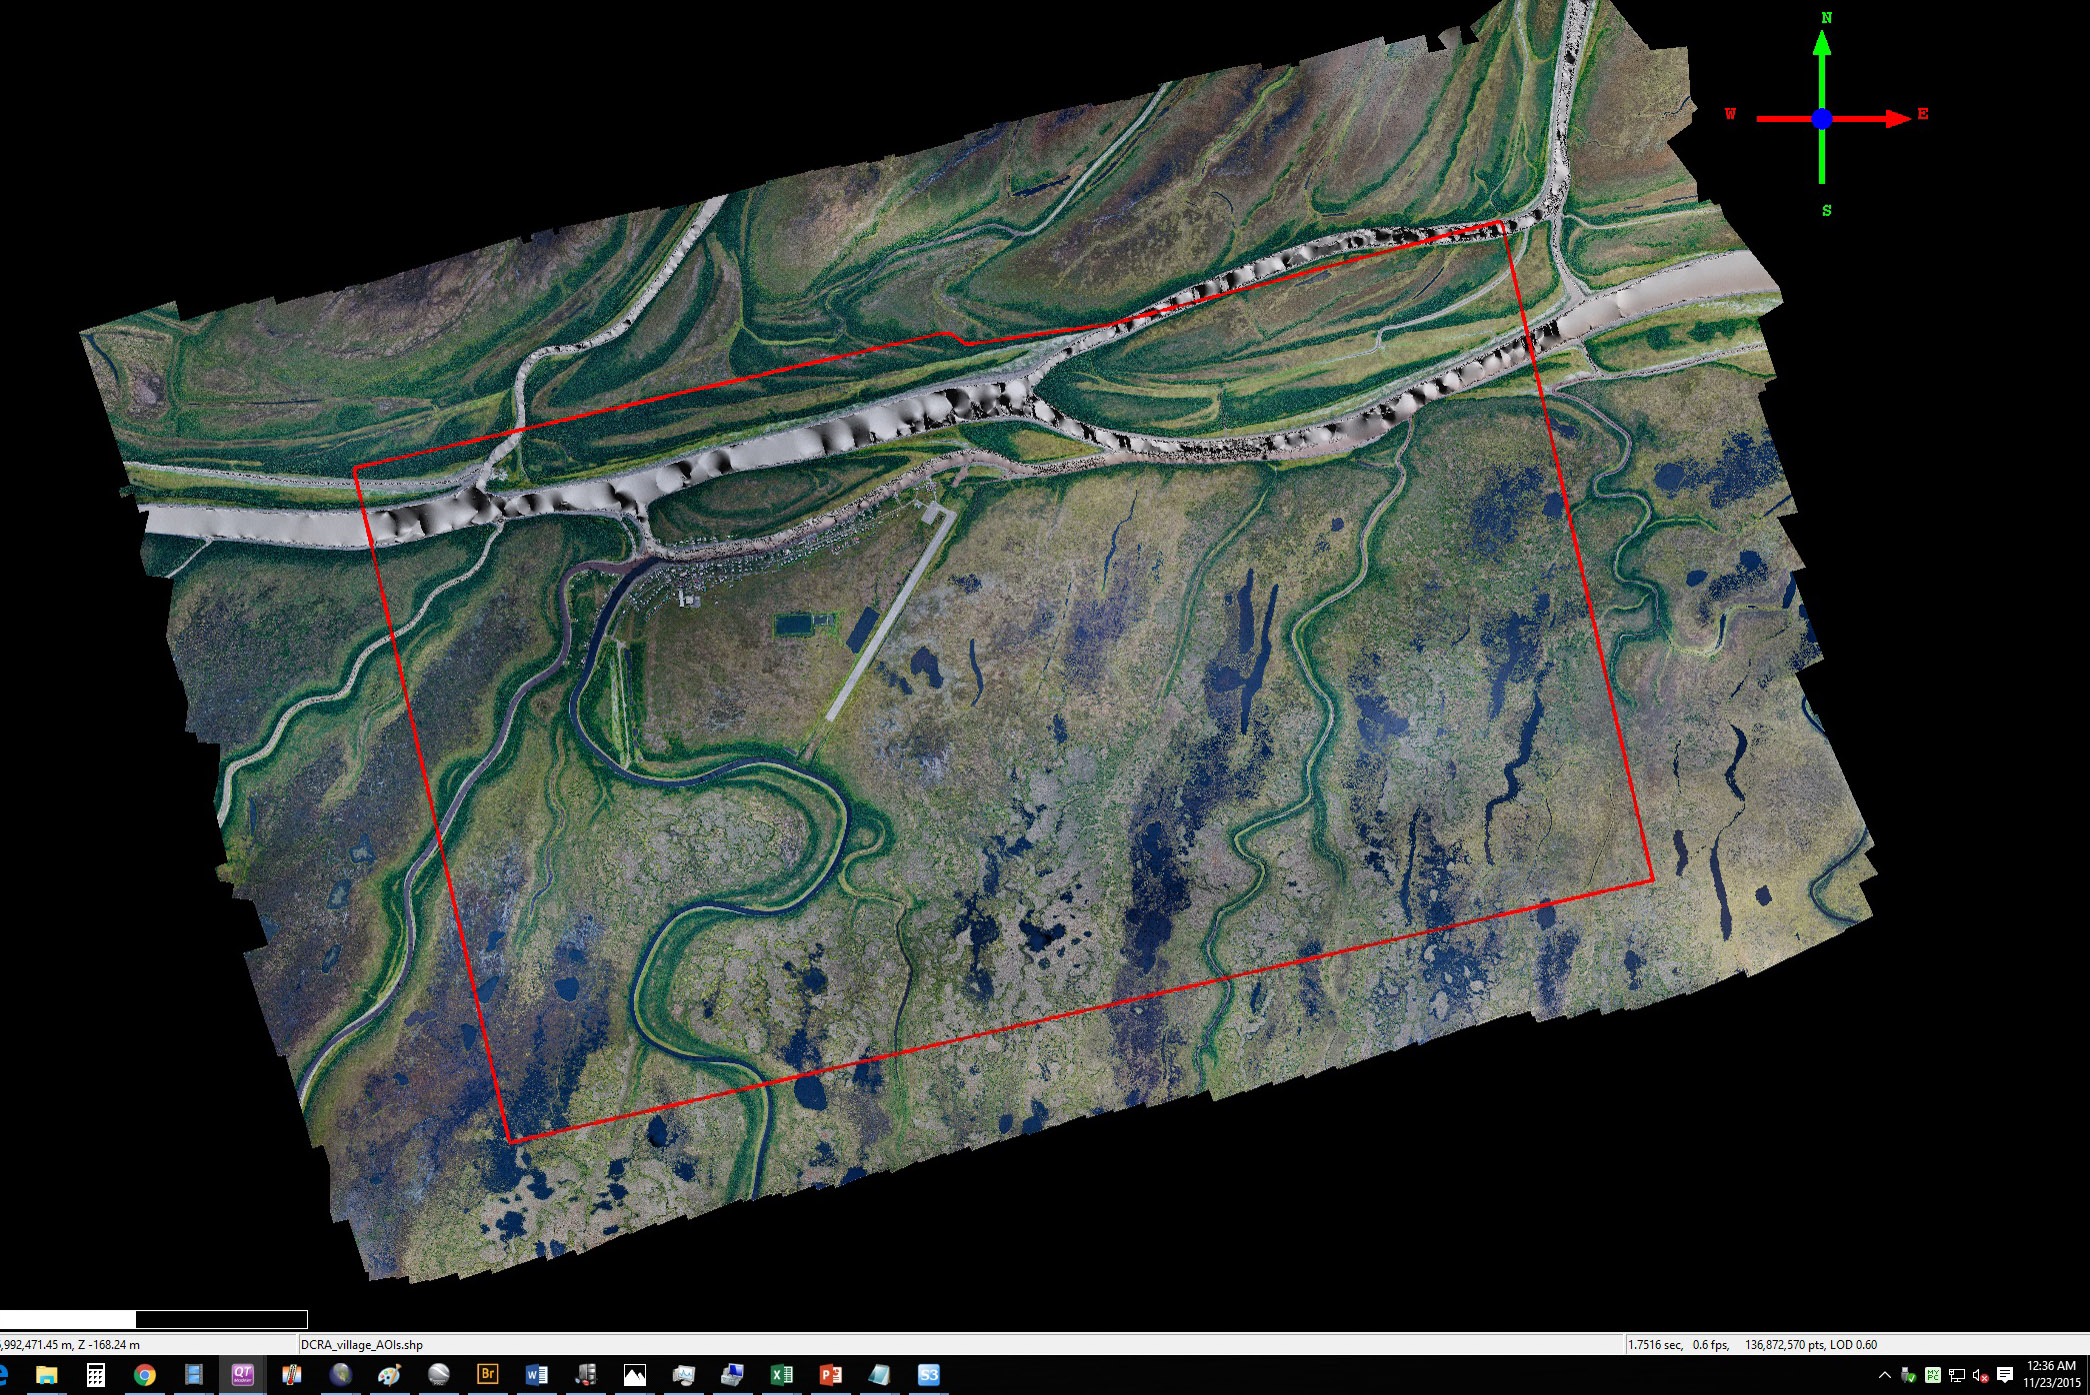
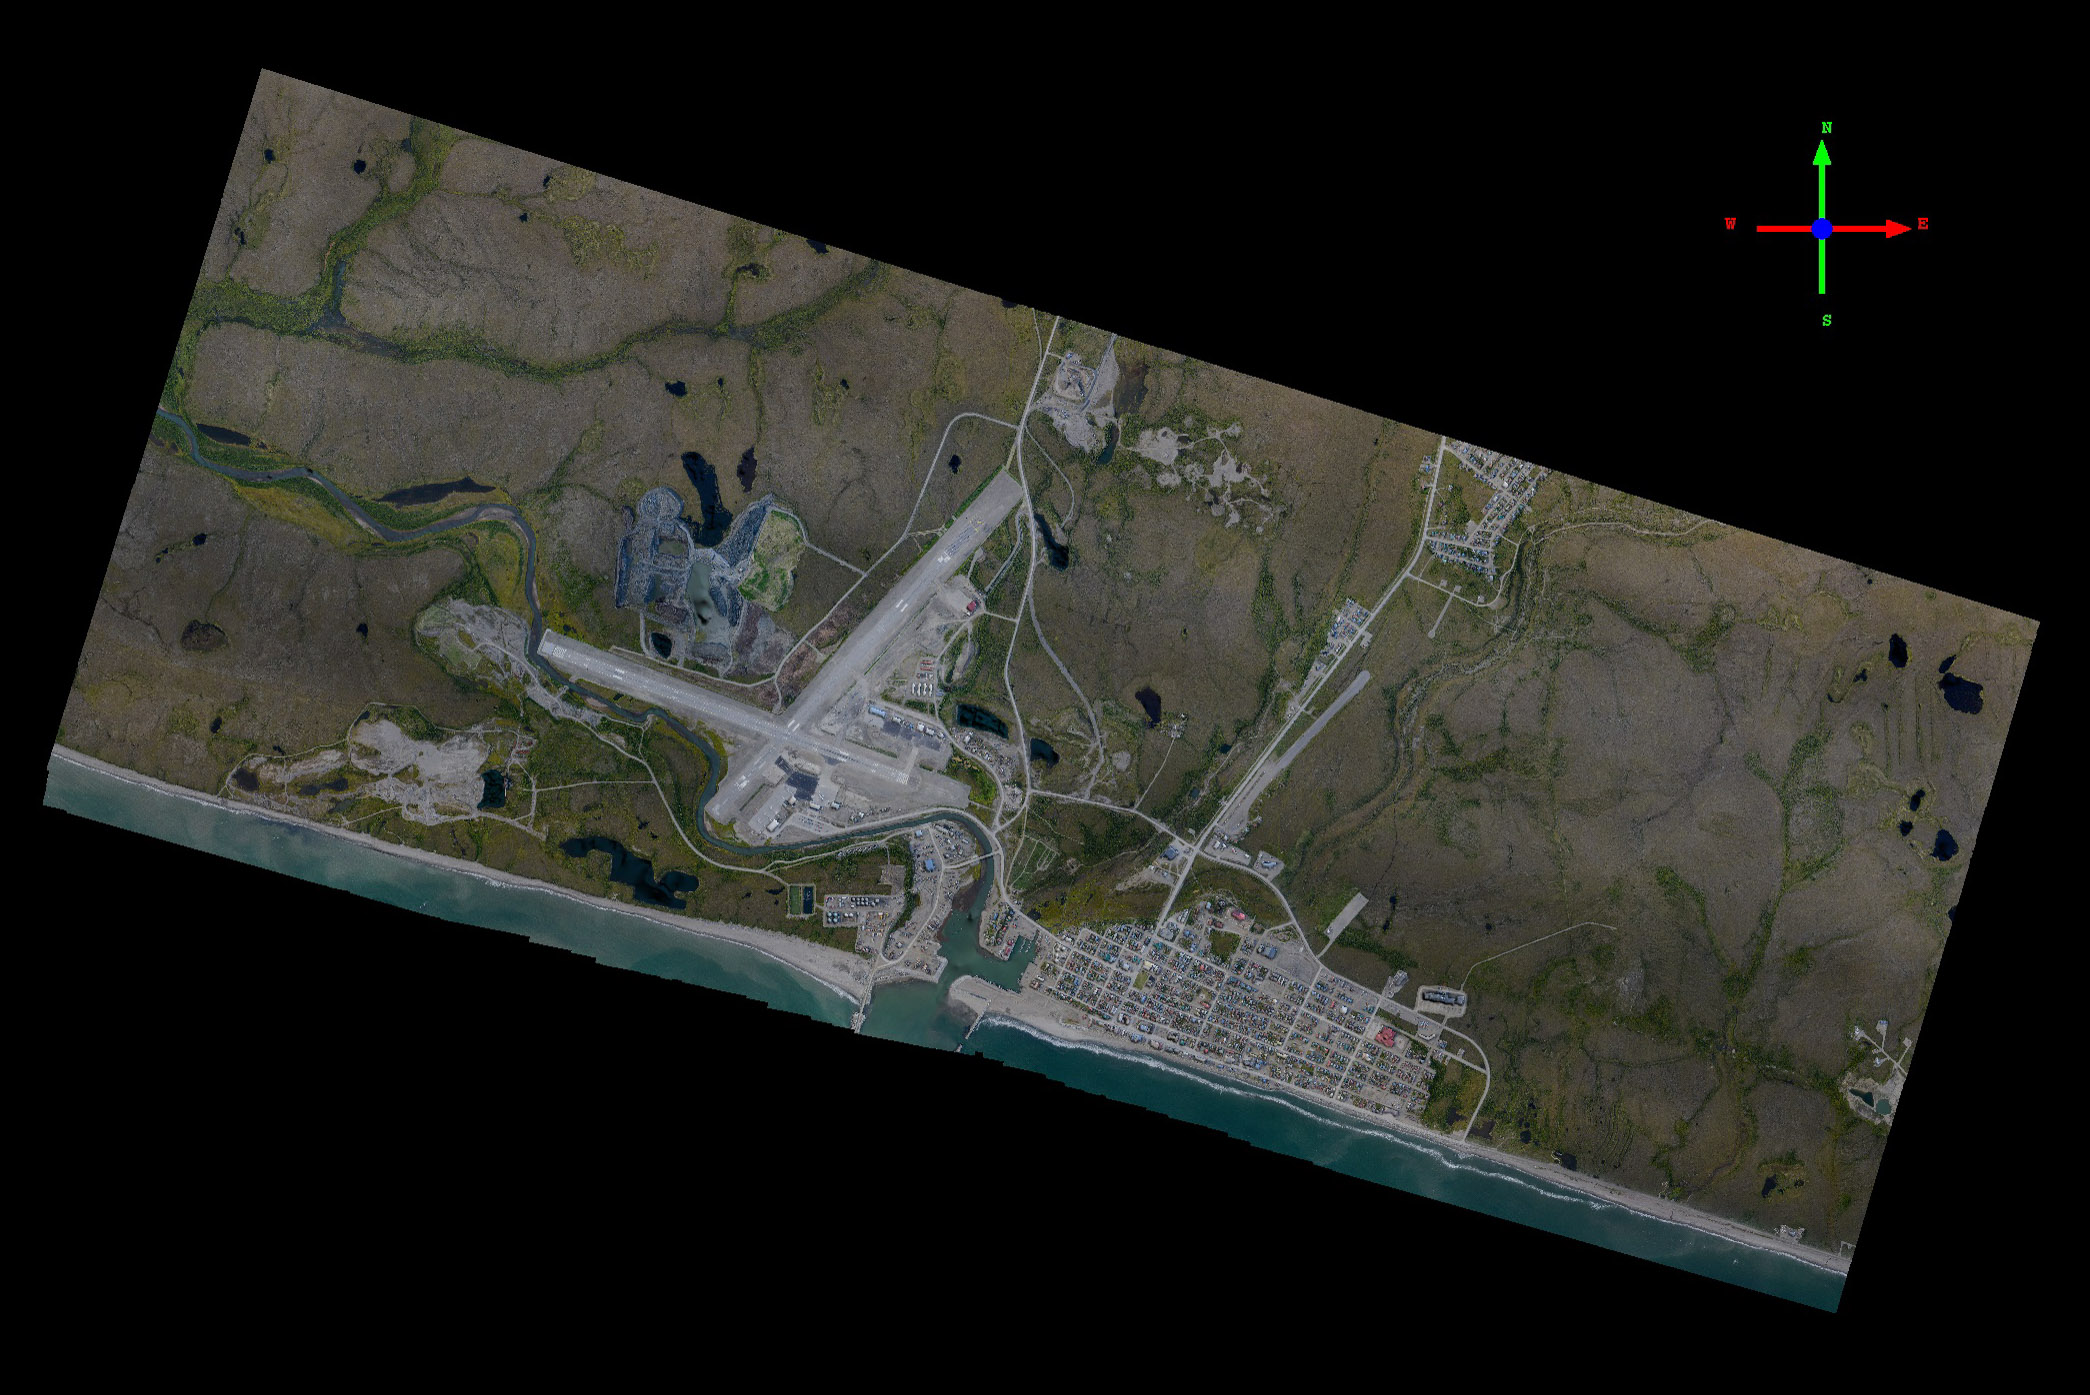
Unalakleet
Unalakleet is a large village that has taken a lot of care to protect itself from storm swells. You can see a video that describes some of the potential uses of these data for safety planning here.
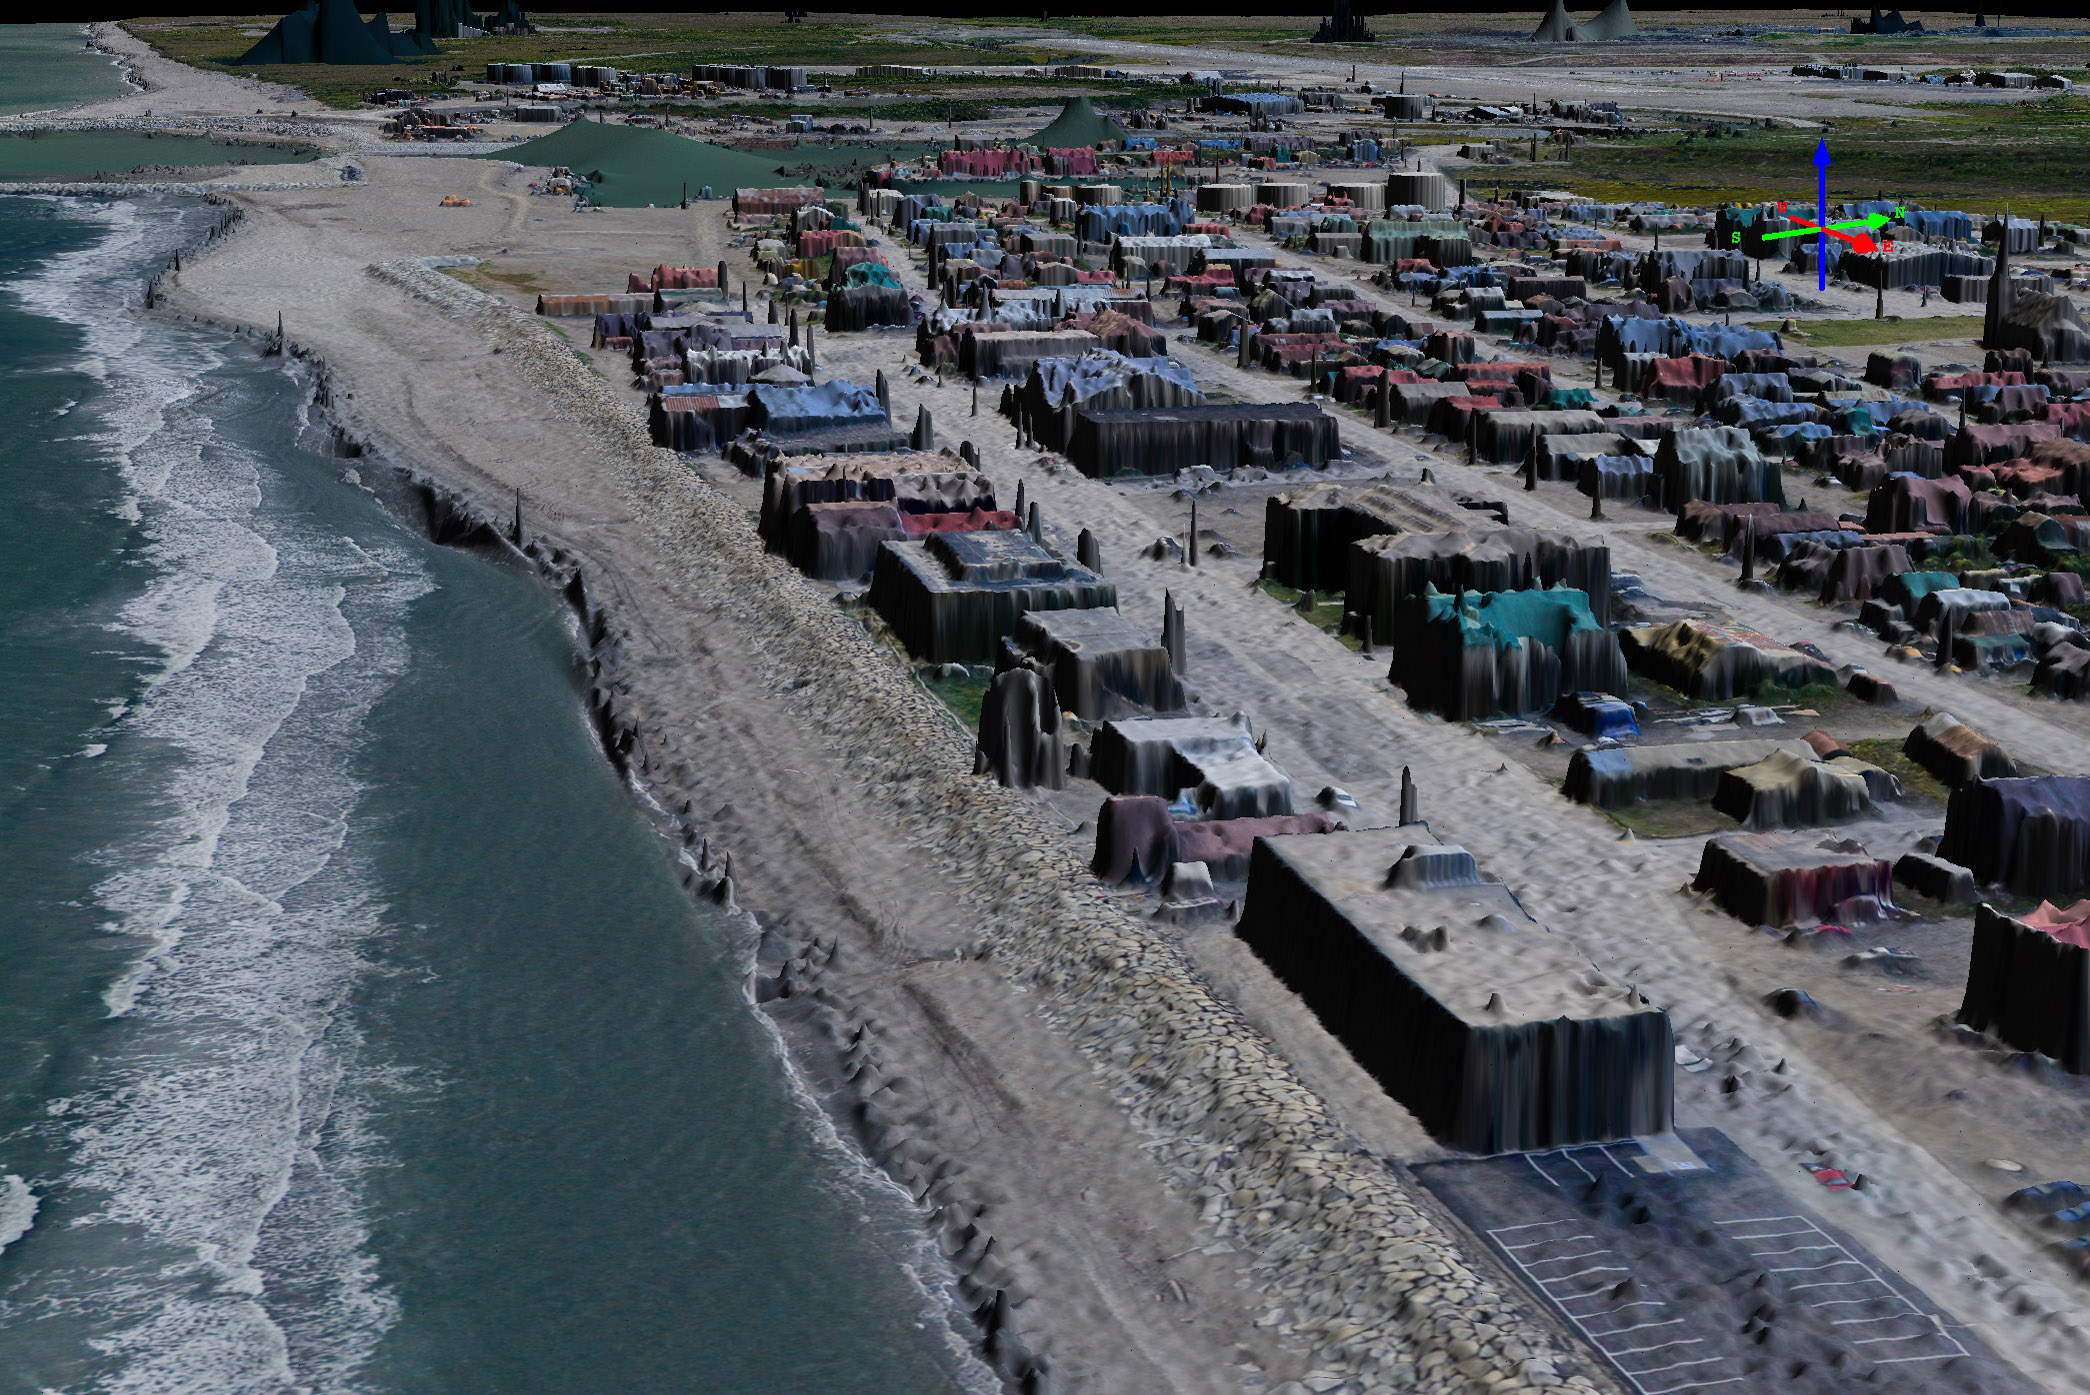
Here is the main part of the village. Note the protective armored walls between the beach and the first row of houses.
Here is a comparison of our 2014 and 2015 data at Unalakleet, as shown by the red and green lines in the plot. The close correspondence here is seen throughout the data set. The divergence between the two lines at right is caused by a parked car that was not there in 2014.
Using these data, we can detect and study both small and large changes.
You can learn more about the acquisition of the Unalakleet data here and see some potential uses for it here.
Wales
Wales is located on a remote peninsula that juts out into the Bering Sea; you literally can see Russia from here.
The infrastructure is pretty low lying here.
You can learn more about the acquisition of the Wales data here and here.
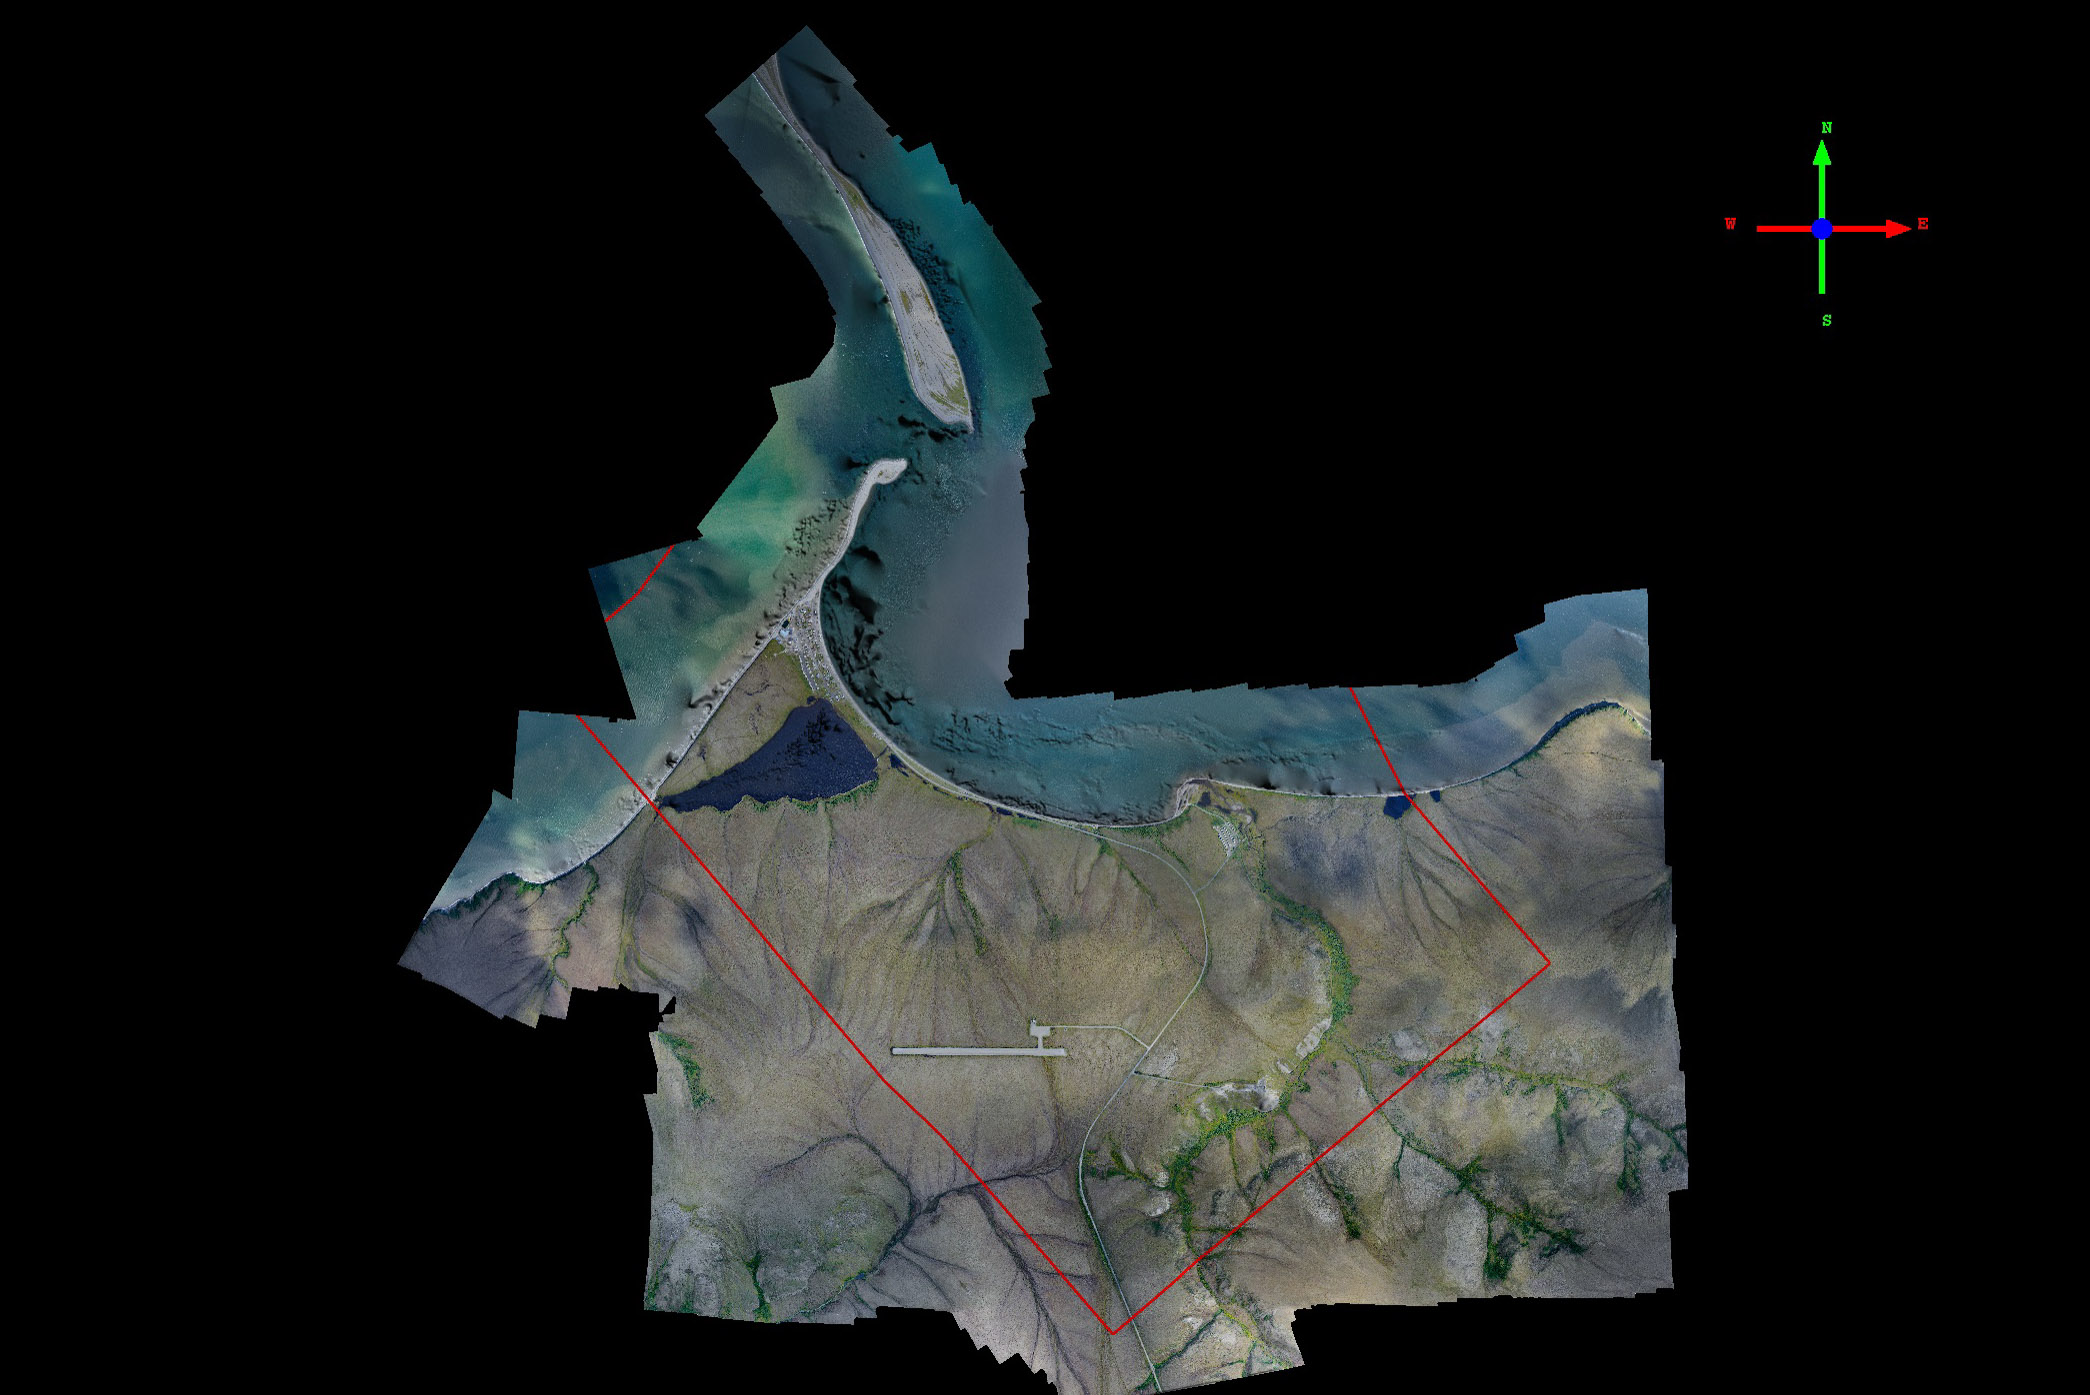
White Mountain
White Mountain is a small village located just north of Golovin Bay and largely sits along a hillside, enjoying a great view of the bay.
You can learn more about the acquisition of the White Mountain data here.
As mentioned previously, this is just phase one of this project. The next phase is to deliver a mile-wide swath of coastline from Wales to Bethel, where all of these villages are located. So stay tuned for updates!
And feel free to contact us with questions about these data (see contact info at bottom of page) or Jacquelyn Overbeck, head of the State’s Coastal Hazards Program at 907 451 5050, about the overall project.