Snow Thickness
Seasonal snow is the largest topographic change on our planet, yet until now our ability to measure it has remained elusive. Snow plays a major role in water resources, ecology, and global weather. Fodar can measure snow packs as thin as 10 cm over terrain of any roughness or smoothness. The method is to make a map during snow-free conditions and then subtract this from one made during snow-covered conditions.
You can read a peer-reviewed paper here that describes our methods and shows that they yield as good of a result as probing on the ground does, but at a fraction of the cost and over entire watersheds. Our most recent work shows that we can also measure snow depths as accurately in steep mountain terrain.
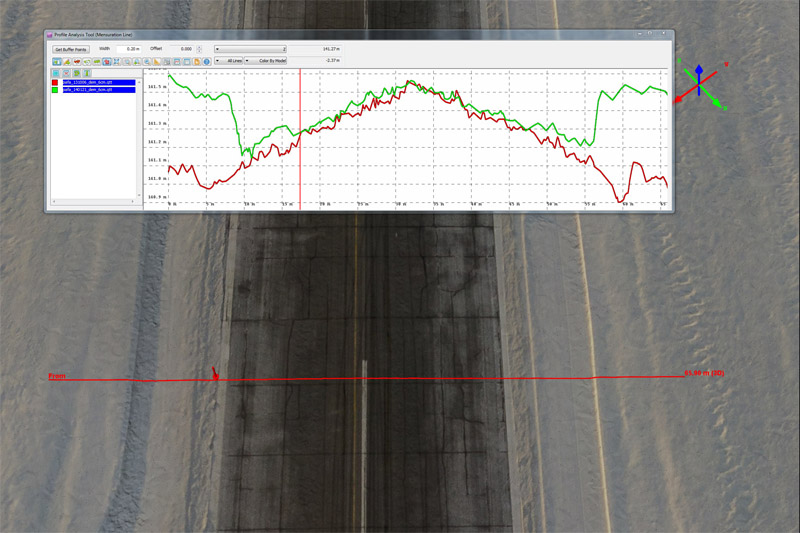
Here is a section of airport runway. The inset plot shows a transect going across and shows elevations from summer (red) and winter (green) maps. Mouse-over to see the summer image. The vertical ticks are 10 cm, showing that on the plowed tarmac, correspondence between maps was within a few centimeters, easily resolving the 40 cm snow berms. Now imagine a Fodar™ map like this of the entire airport, or city, or watershed.
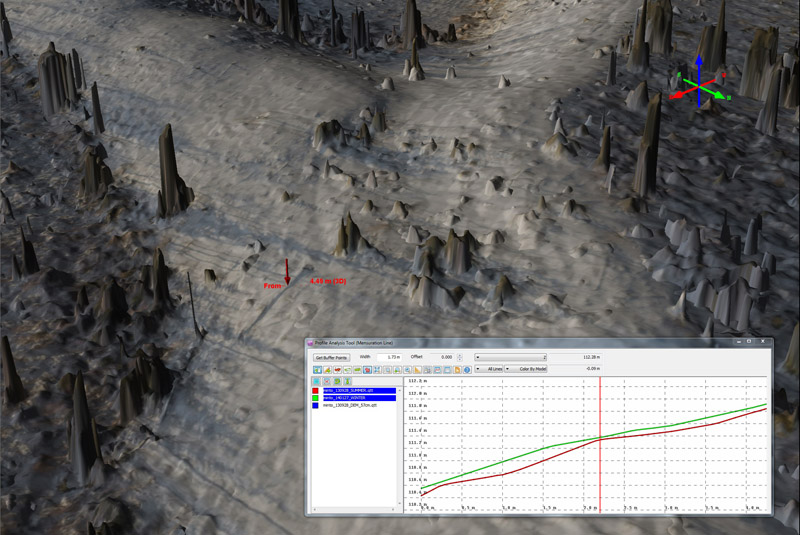
Here is a forested area with standing and dead trees. Mouse-over to see the same area in summer. The plot shows a transect that runs over a dead tree, with summer in red, winter in green, and vertical ticks at 20 cm. About 5 cm of snow overlays the tree, who’s shadow can be seen in the winter image and emphasizes the awesome repeatibility of Fodar maps.
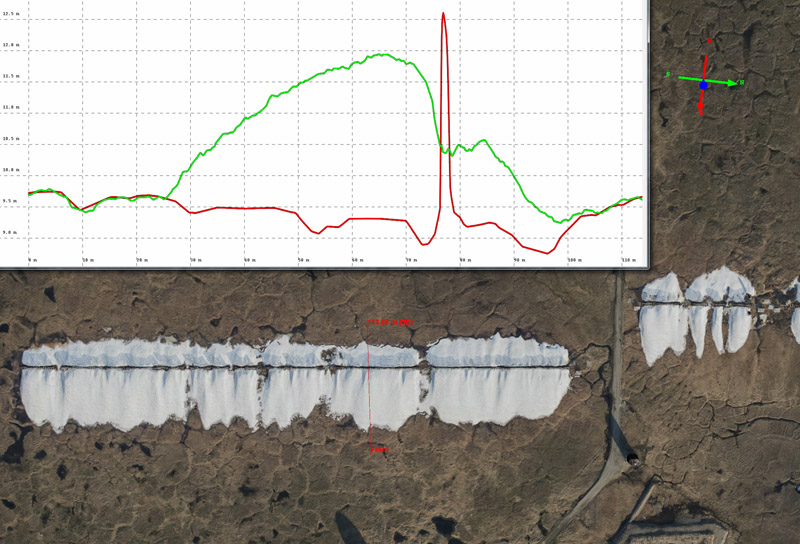
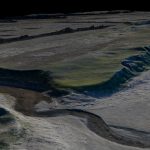
Here are snow drifts formed by a snow fence on Barter Island in winter, in early July before the drifts fully melted. Mouse-over to see it completely snow free in early September. In the inset, the green line is winter, the red line is summer, vertical ticks are 1 meter, and horizontal ticks are 10 m. Note how the snow free ground matches within +/5 cm and that you can see a smooth ramp of snow at the centimeter level. The fence doesnt show up in the winter image as it was acquired at a gsd too large to resolve it. Note thermal subsidence of the ground in the snow-free image, caused by the snow drifts.
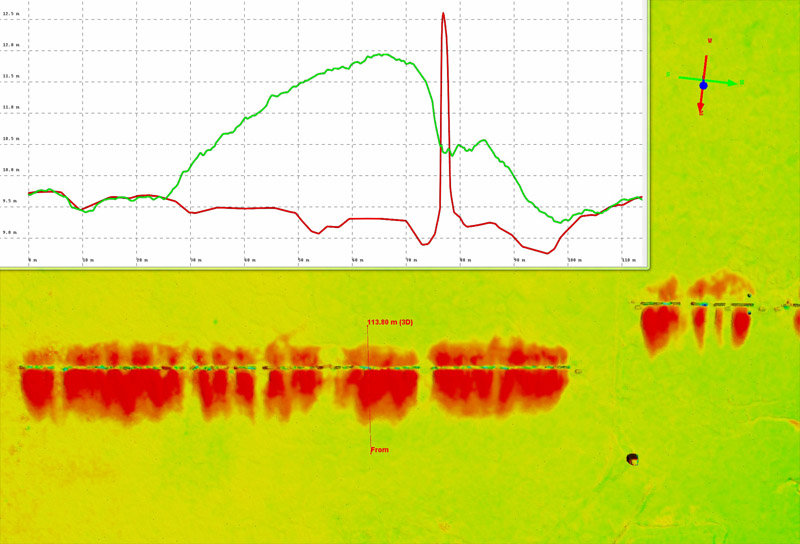
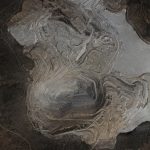
Here is the same area as above, but this time as a difference image between July and September. The yellow-green color means no change, and red is up to 2.5 meters of change. Mouse-over to see the July image. Snow of essentially any thickness can be using fodar, whether its in the Arctic or in the Sierras.