
New Arctic data online
Last week I flew two long days and acquired a lot of data. I’ve since processed and delivered all of it. You can visit Fodar Earth to view the data in the 3D, but here are a few screenshots highlighting it along with some other data products.
First is a small project near Deadhorse for UAF and State DOT. Here they are beginning to extract gravel from the Sag River for use along the haul road. Seen in these screenshots are the beginnings of the gravel extraction site and the material staging site.
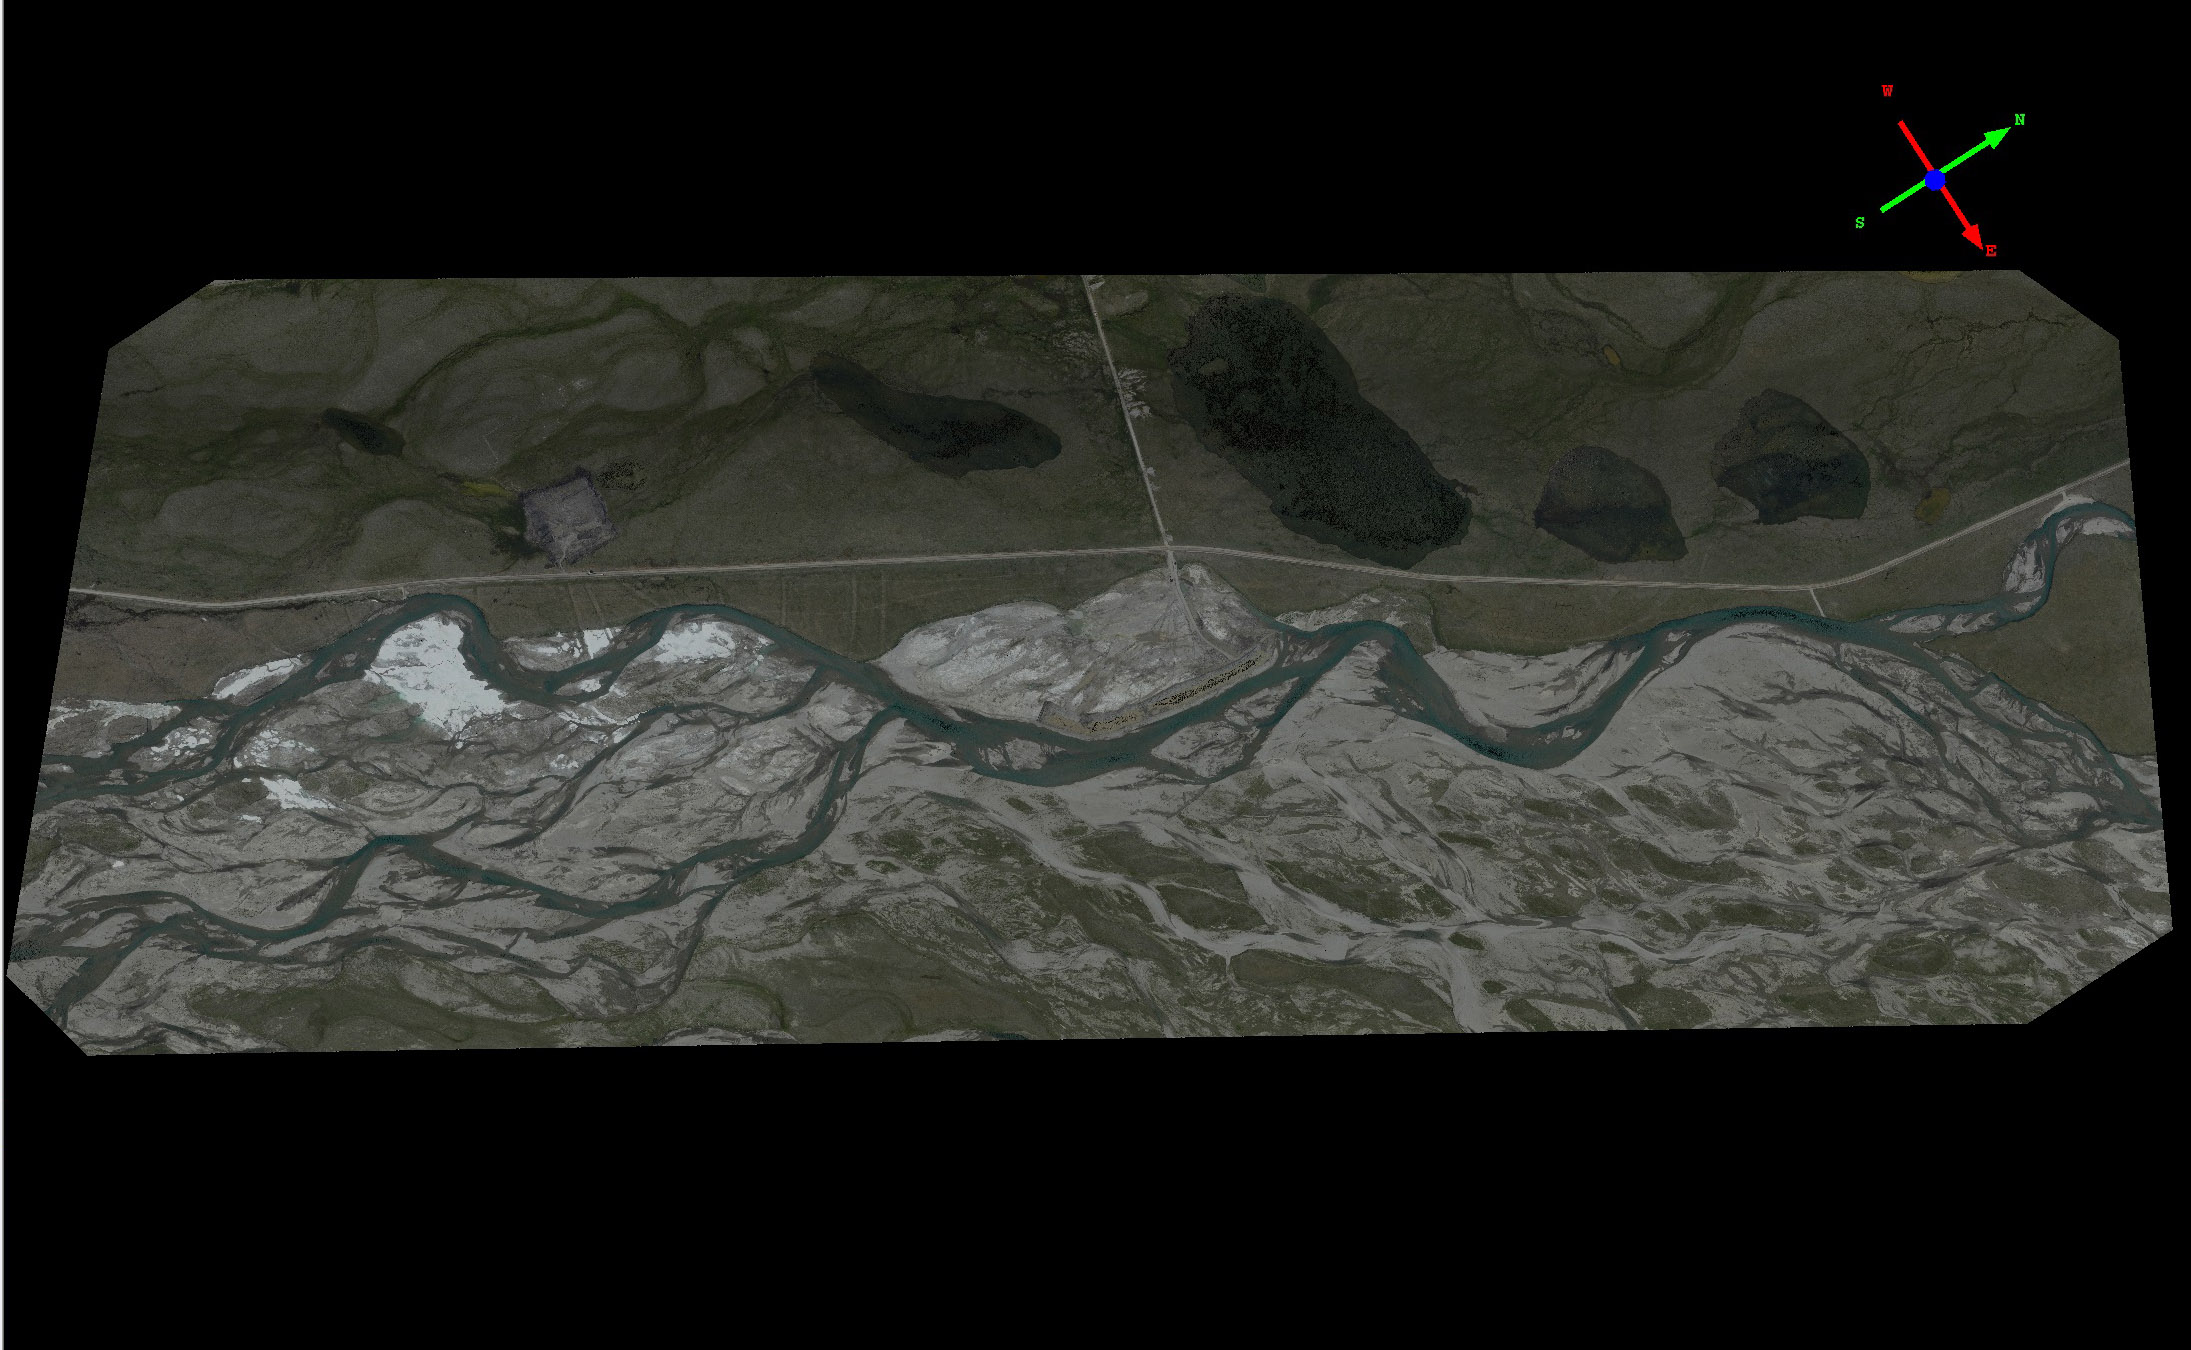
Here is the full acquistion. Mouseover to see the topography colored by elevation (the full elevation range here is 10 m). Notice the small lagoon created near the center of the image, this is where the gravel will be extracted. It will be stockpiled to the upper left, above the road.
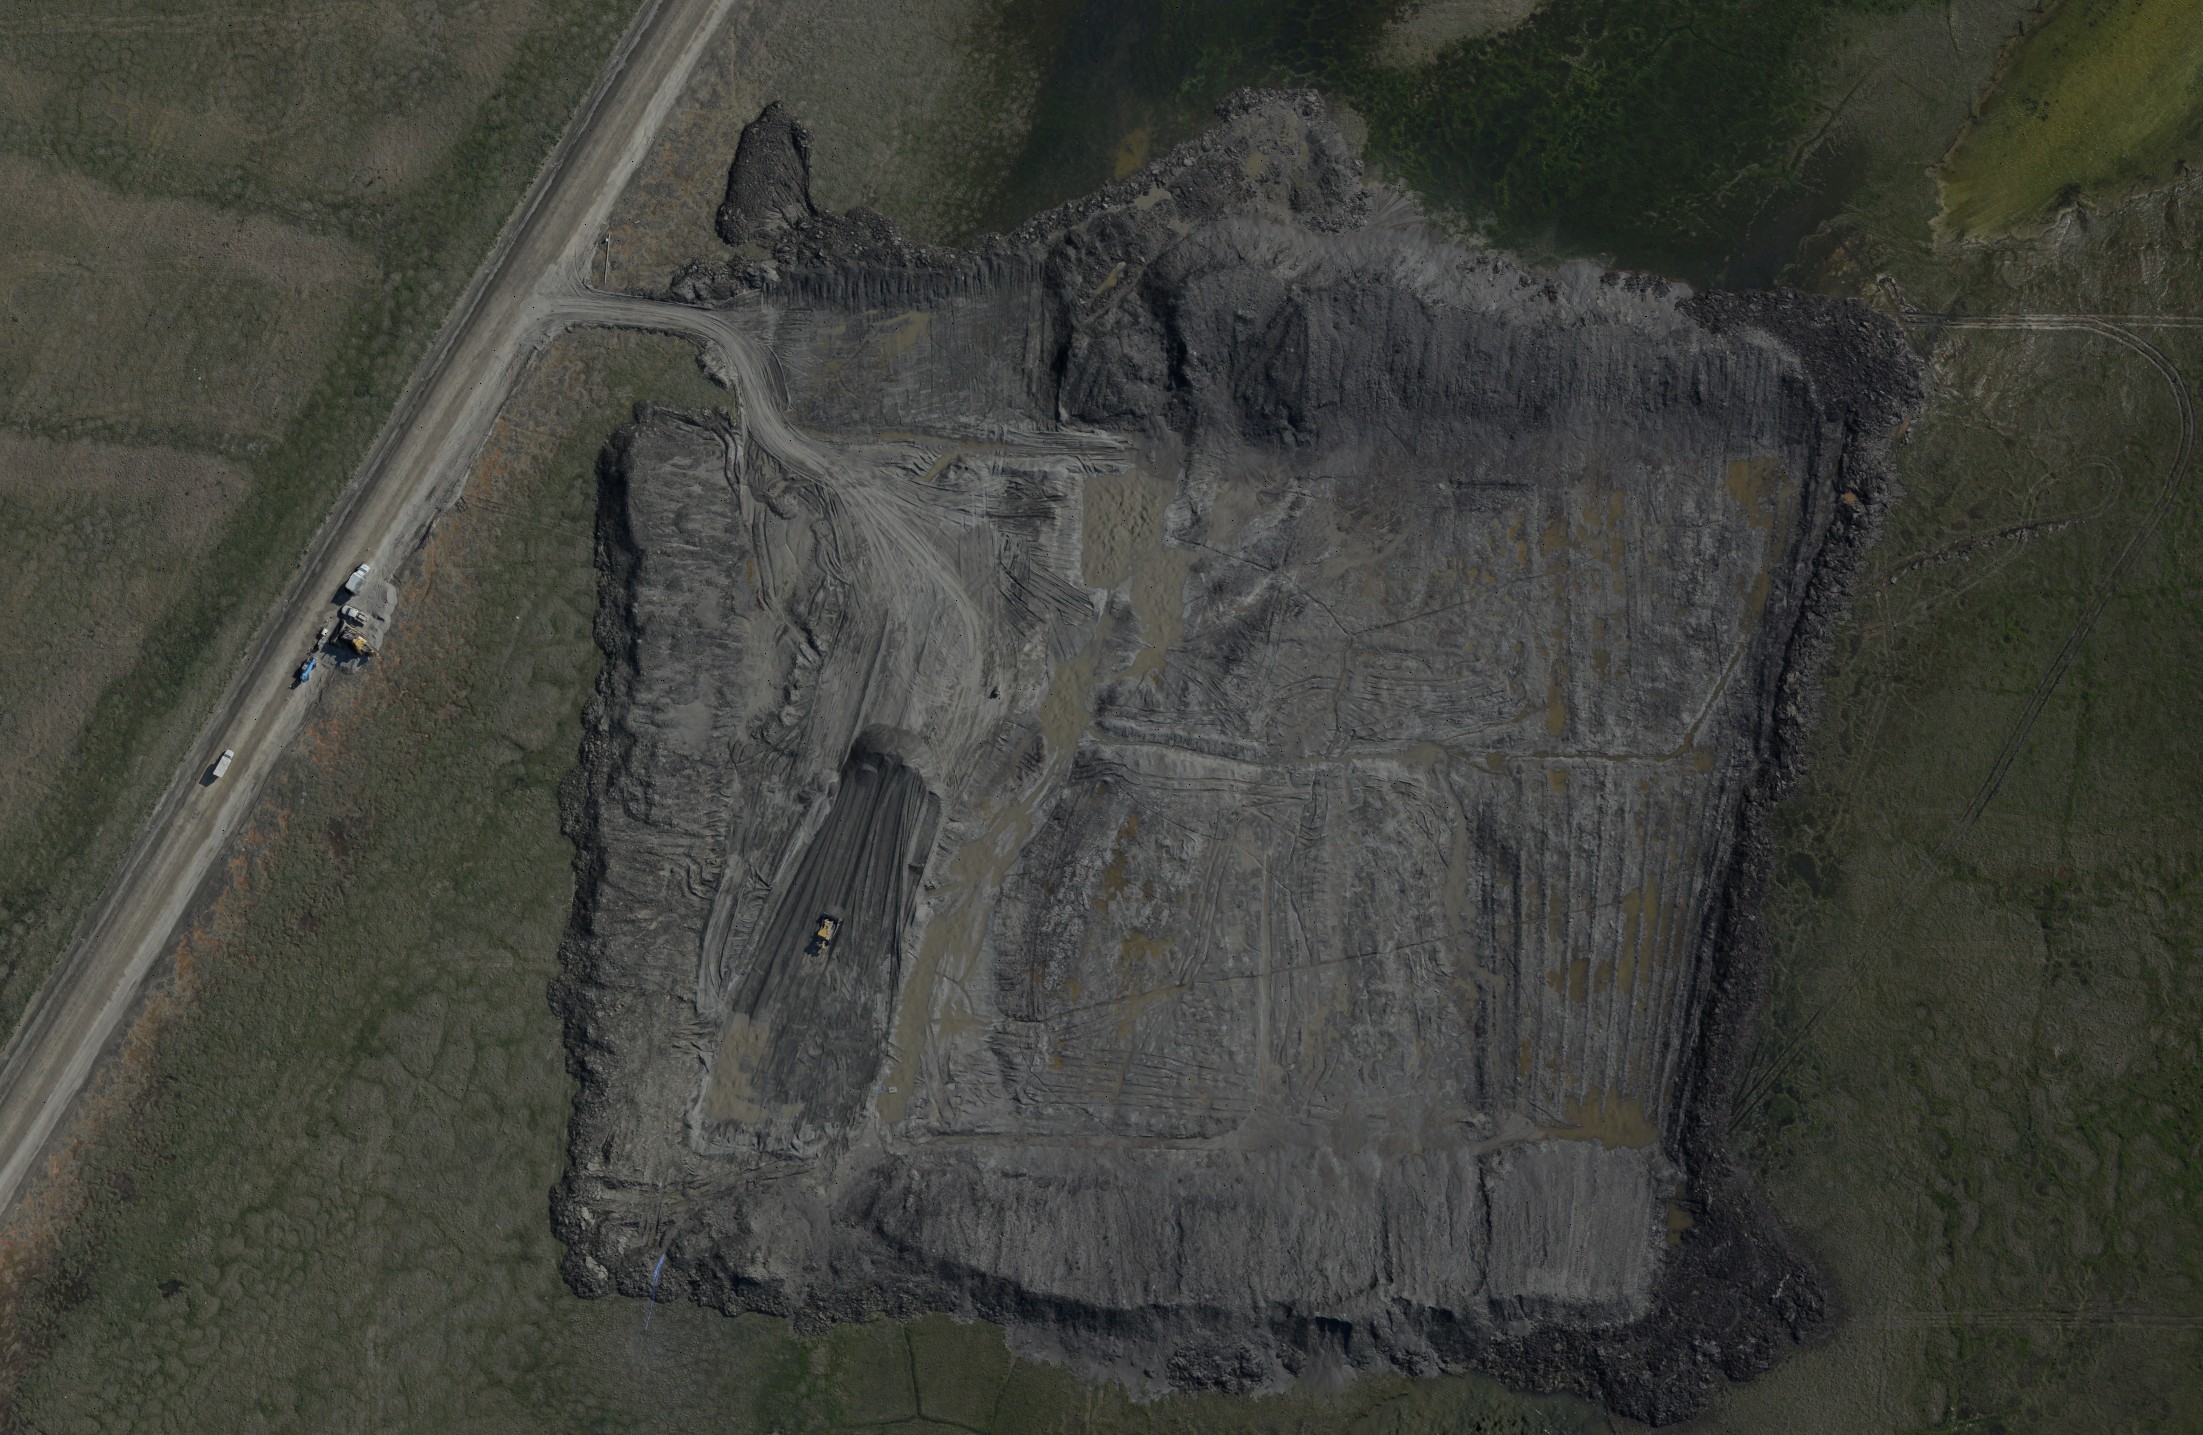
Here is where the gravel will be stockpiled. You can see a bulldozer clearing the tundra away to expose the frozen mineral soils below, upon which a layer of gravel will be placed so trucks dont get stuck in the mud as it thaws. If you mouseover and look close, you can see that fodar reveals the topography of the individual bulldozer swaths.
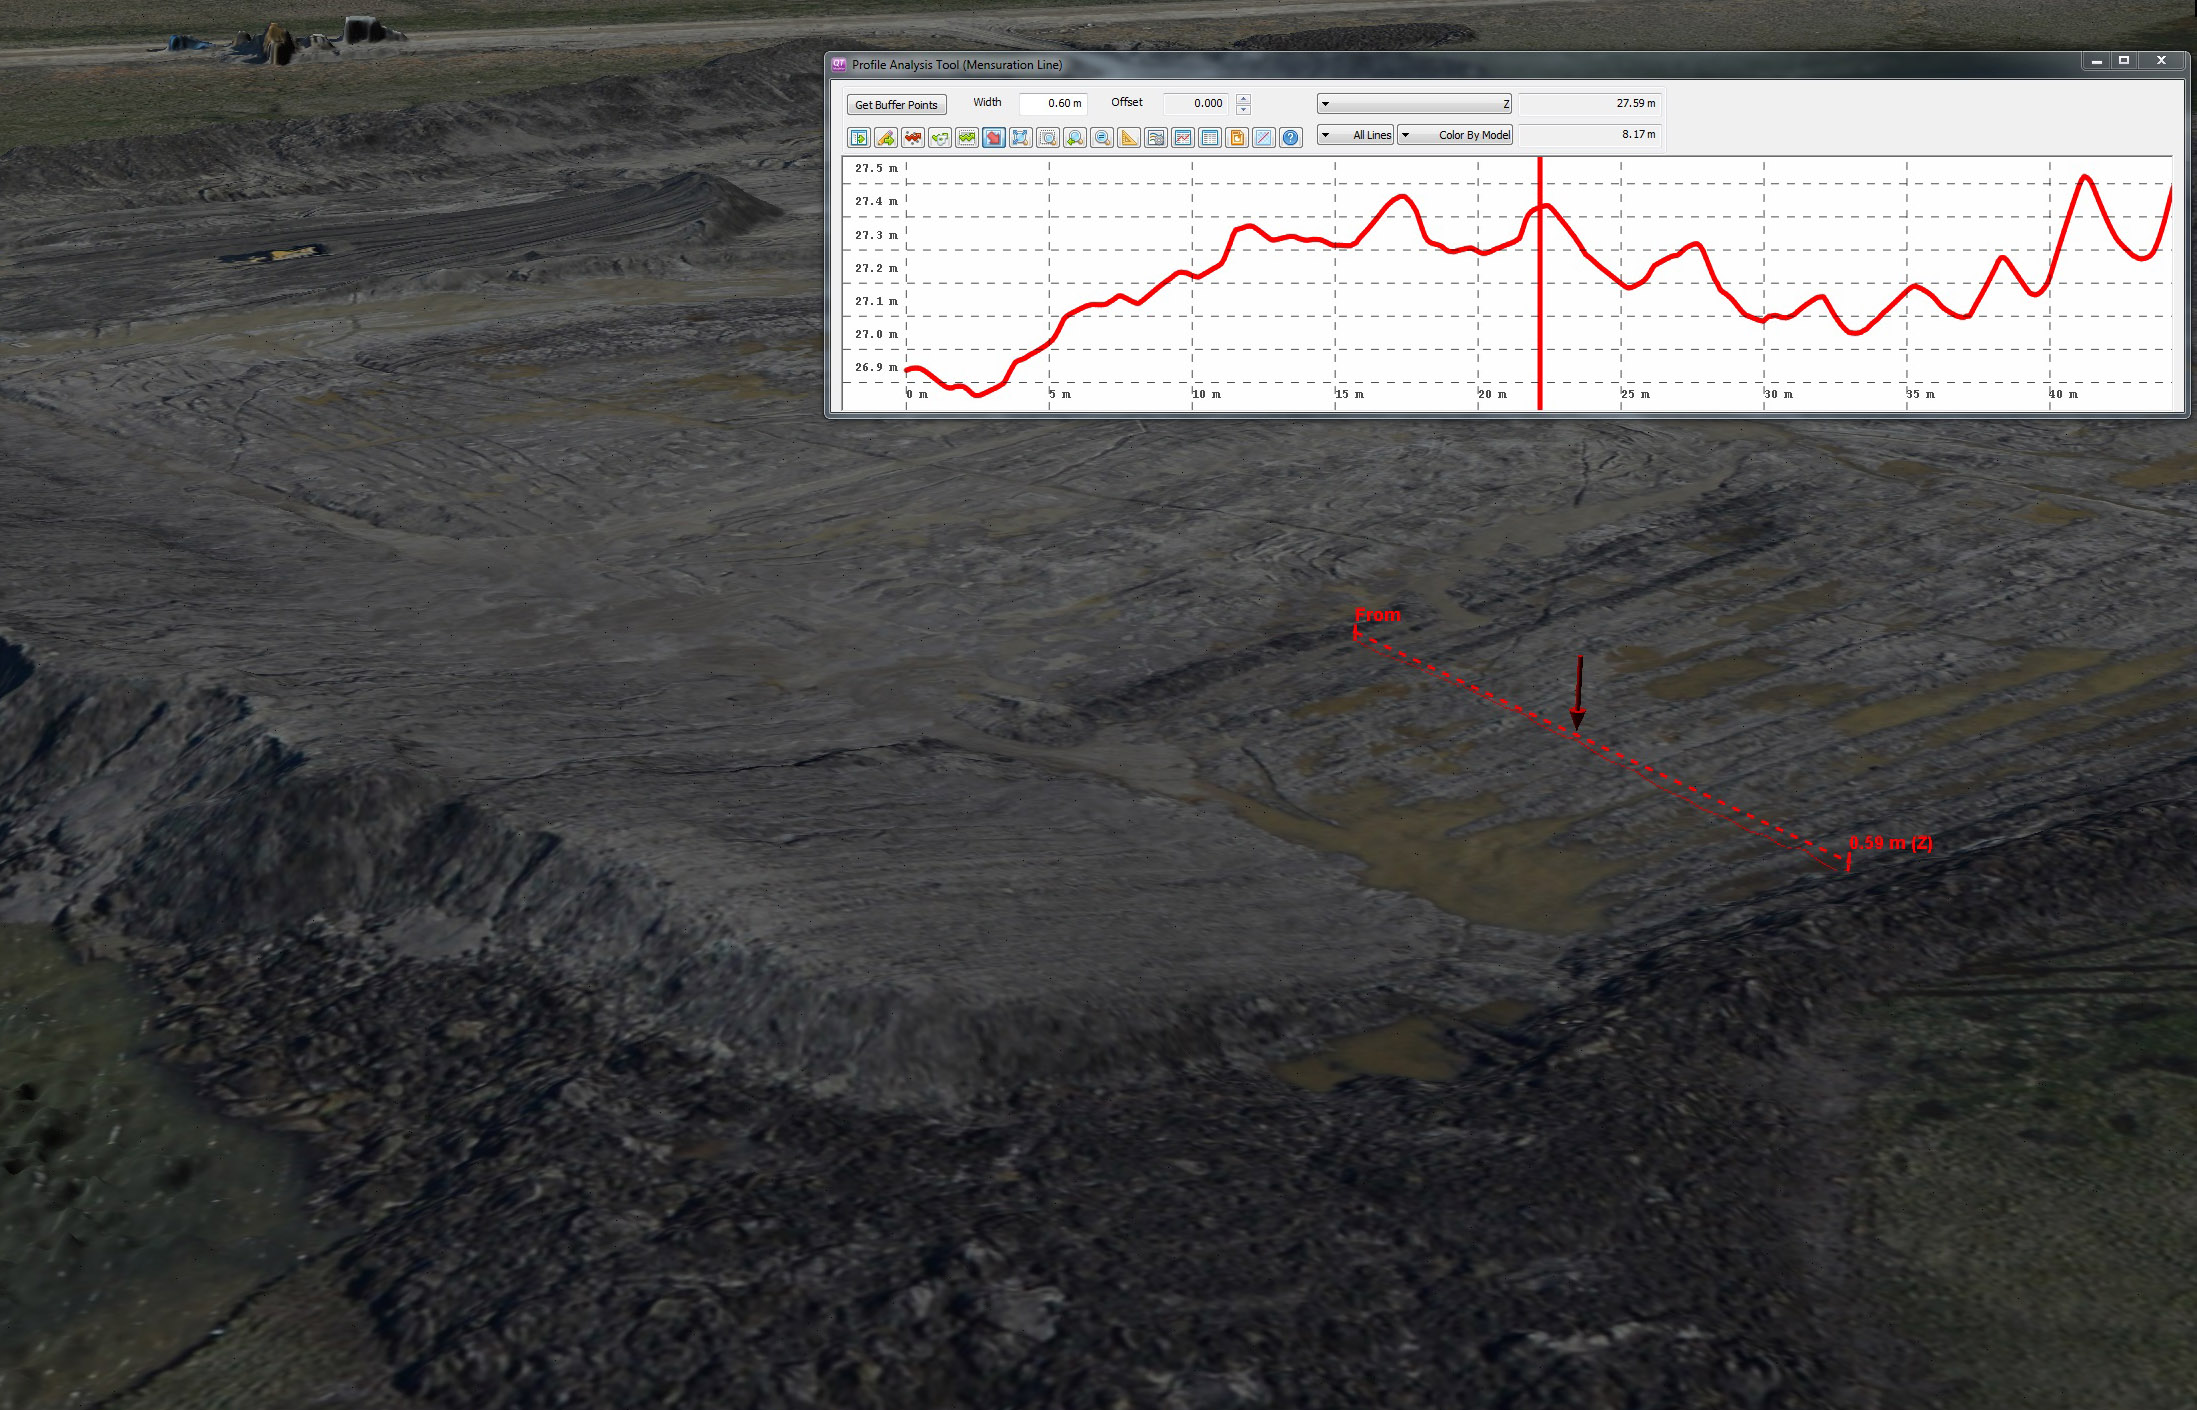
Here is a close up of some bulldozer marks. Mouseover to see the topography. These furrows are only only ten centimeters deep, yet are clearly revealed by fodar.
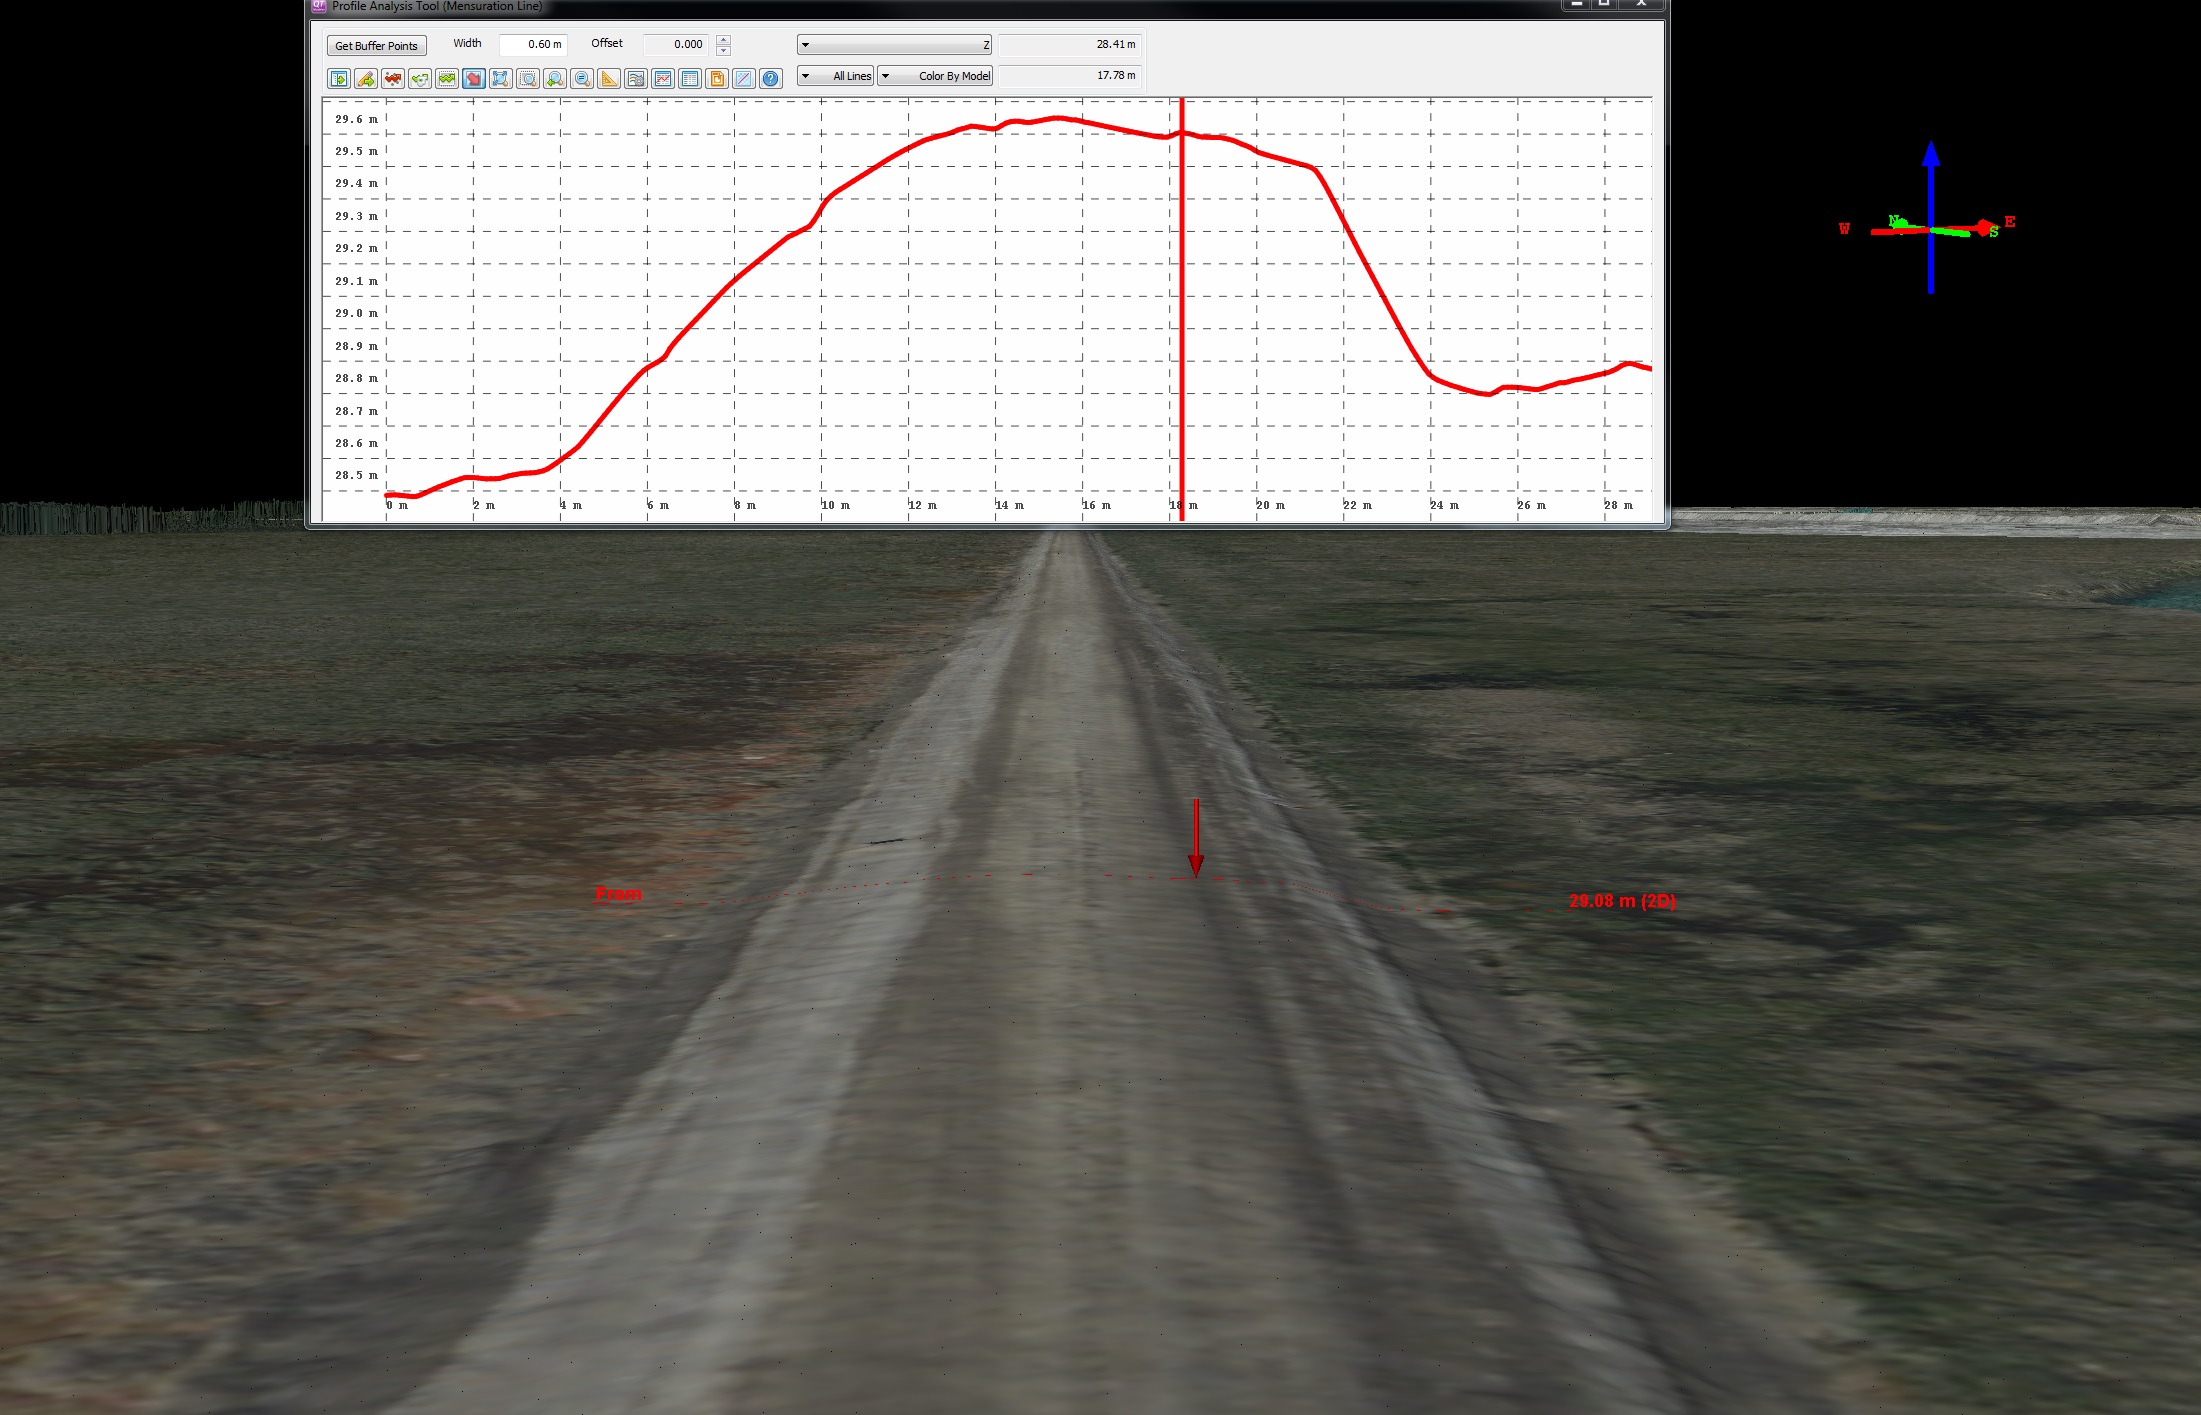
Here is a closeup of the road, revealing its crown for drainage. Those ticks are only 10 cm. The red line shows a small dip in the road created while it was graded and is only a few centimeters deep.
Second are some coastal regions near Barter Island for coastal erosion and bird habitat studies for USGS and USFWS. Here we’re mapping individual driftwood logs for bird habitats and individual clods of tundra falling off the bluffs.
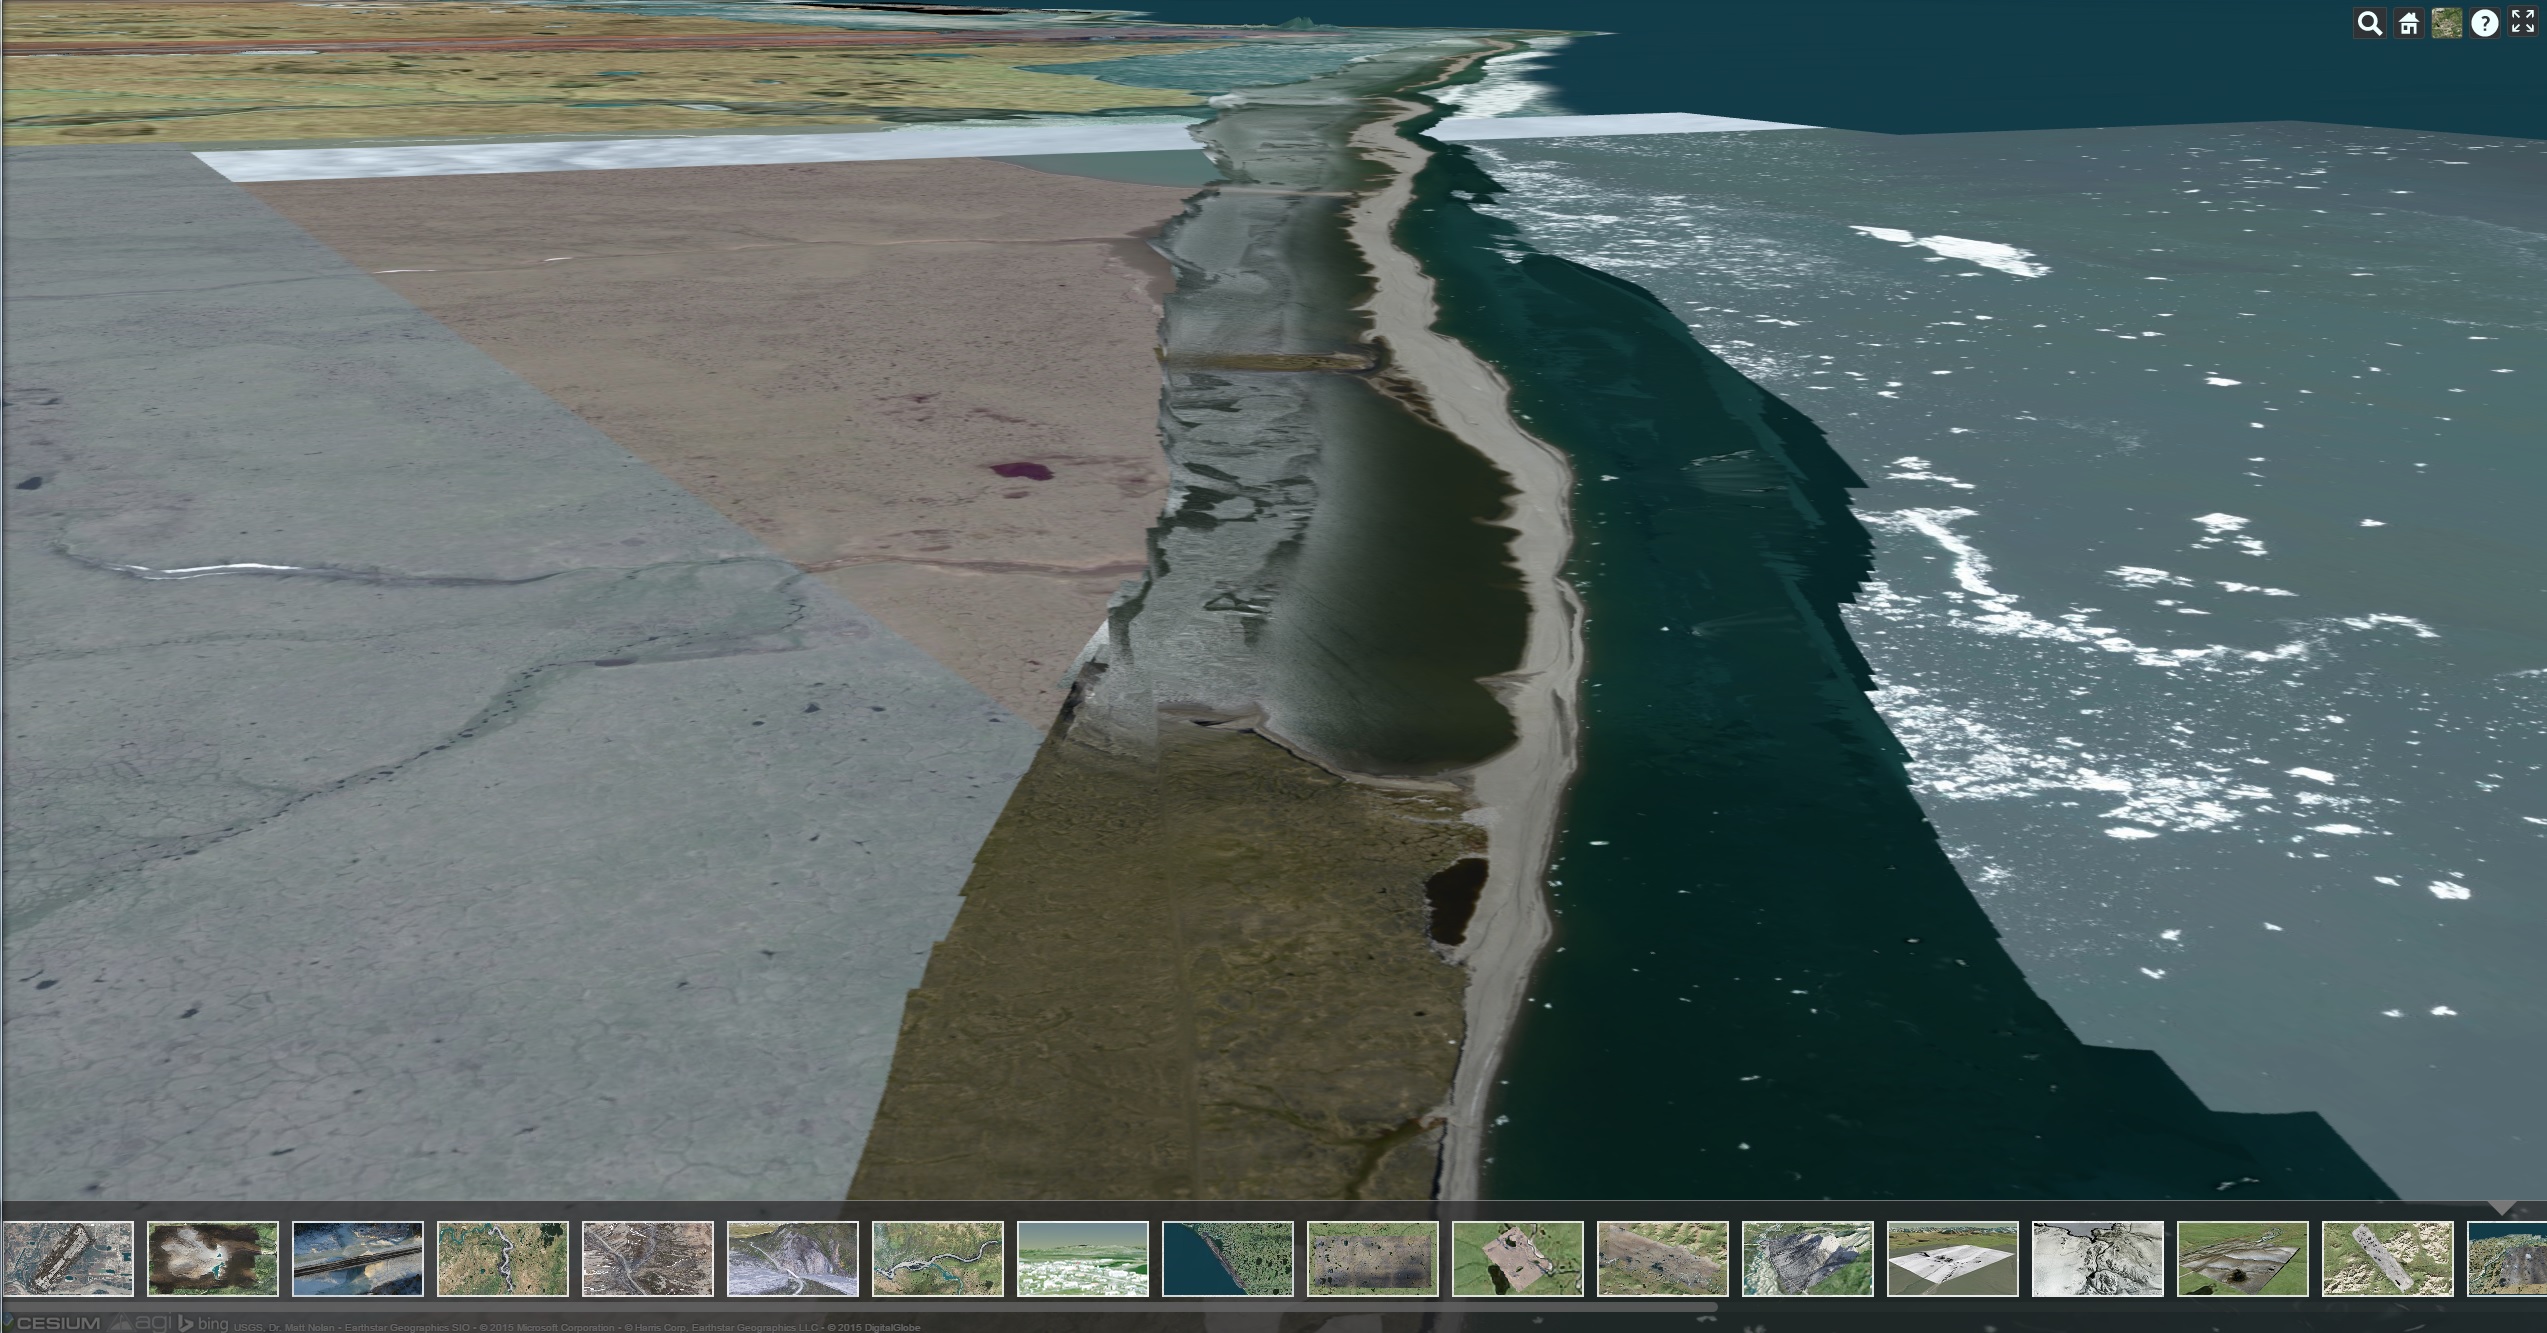
The study area here was about 30 miles long and 100 feet wide.
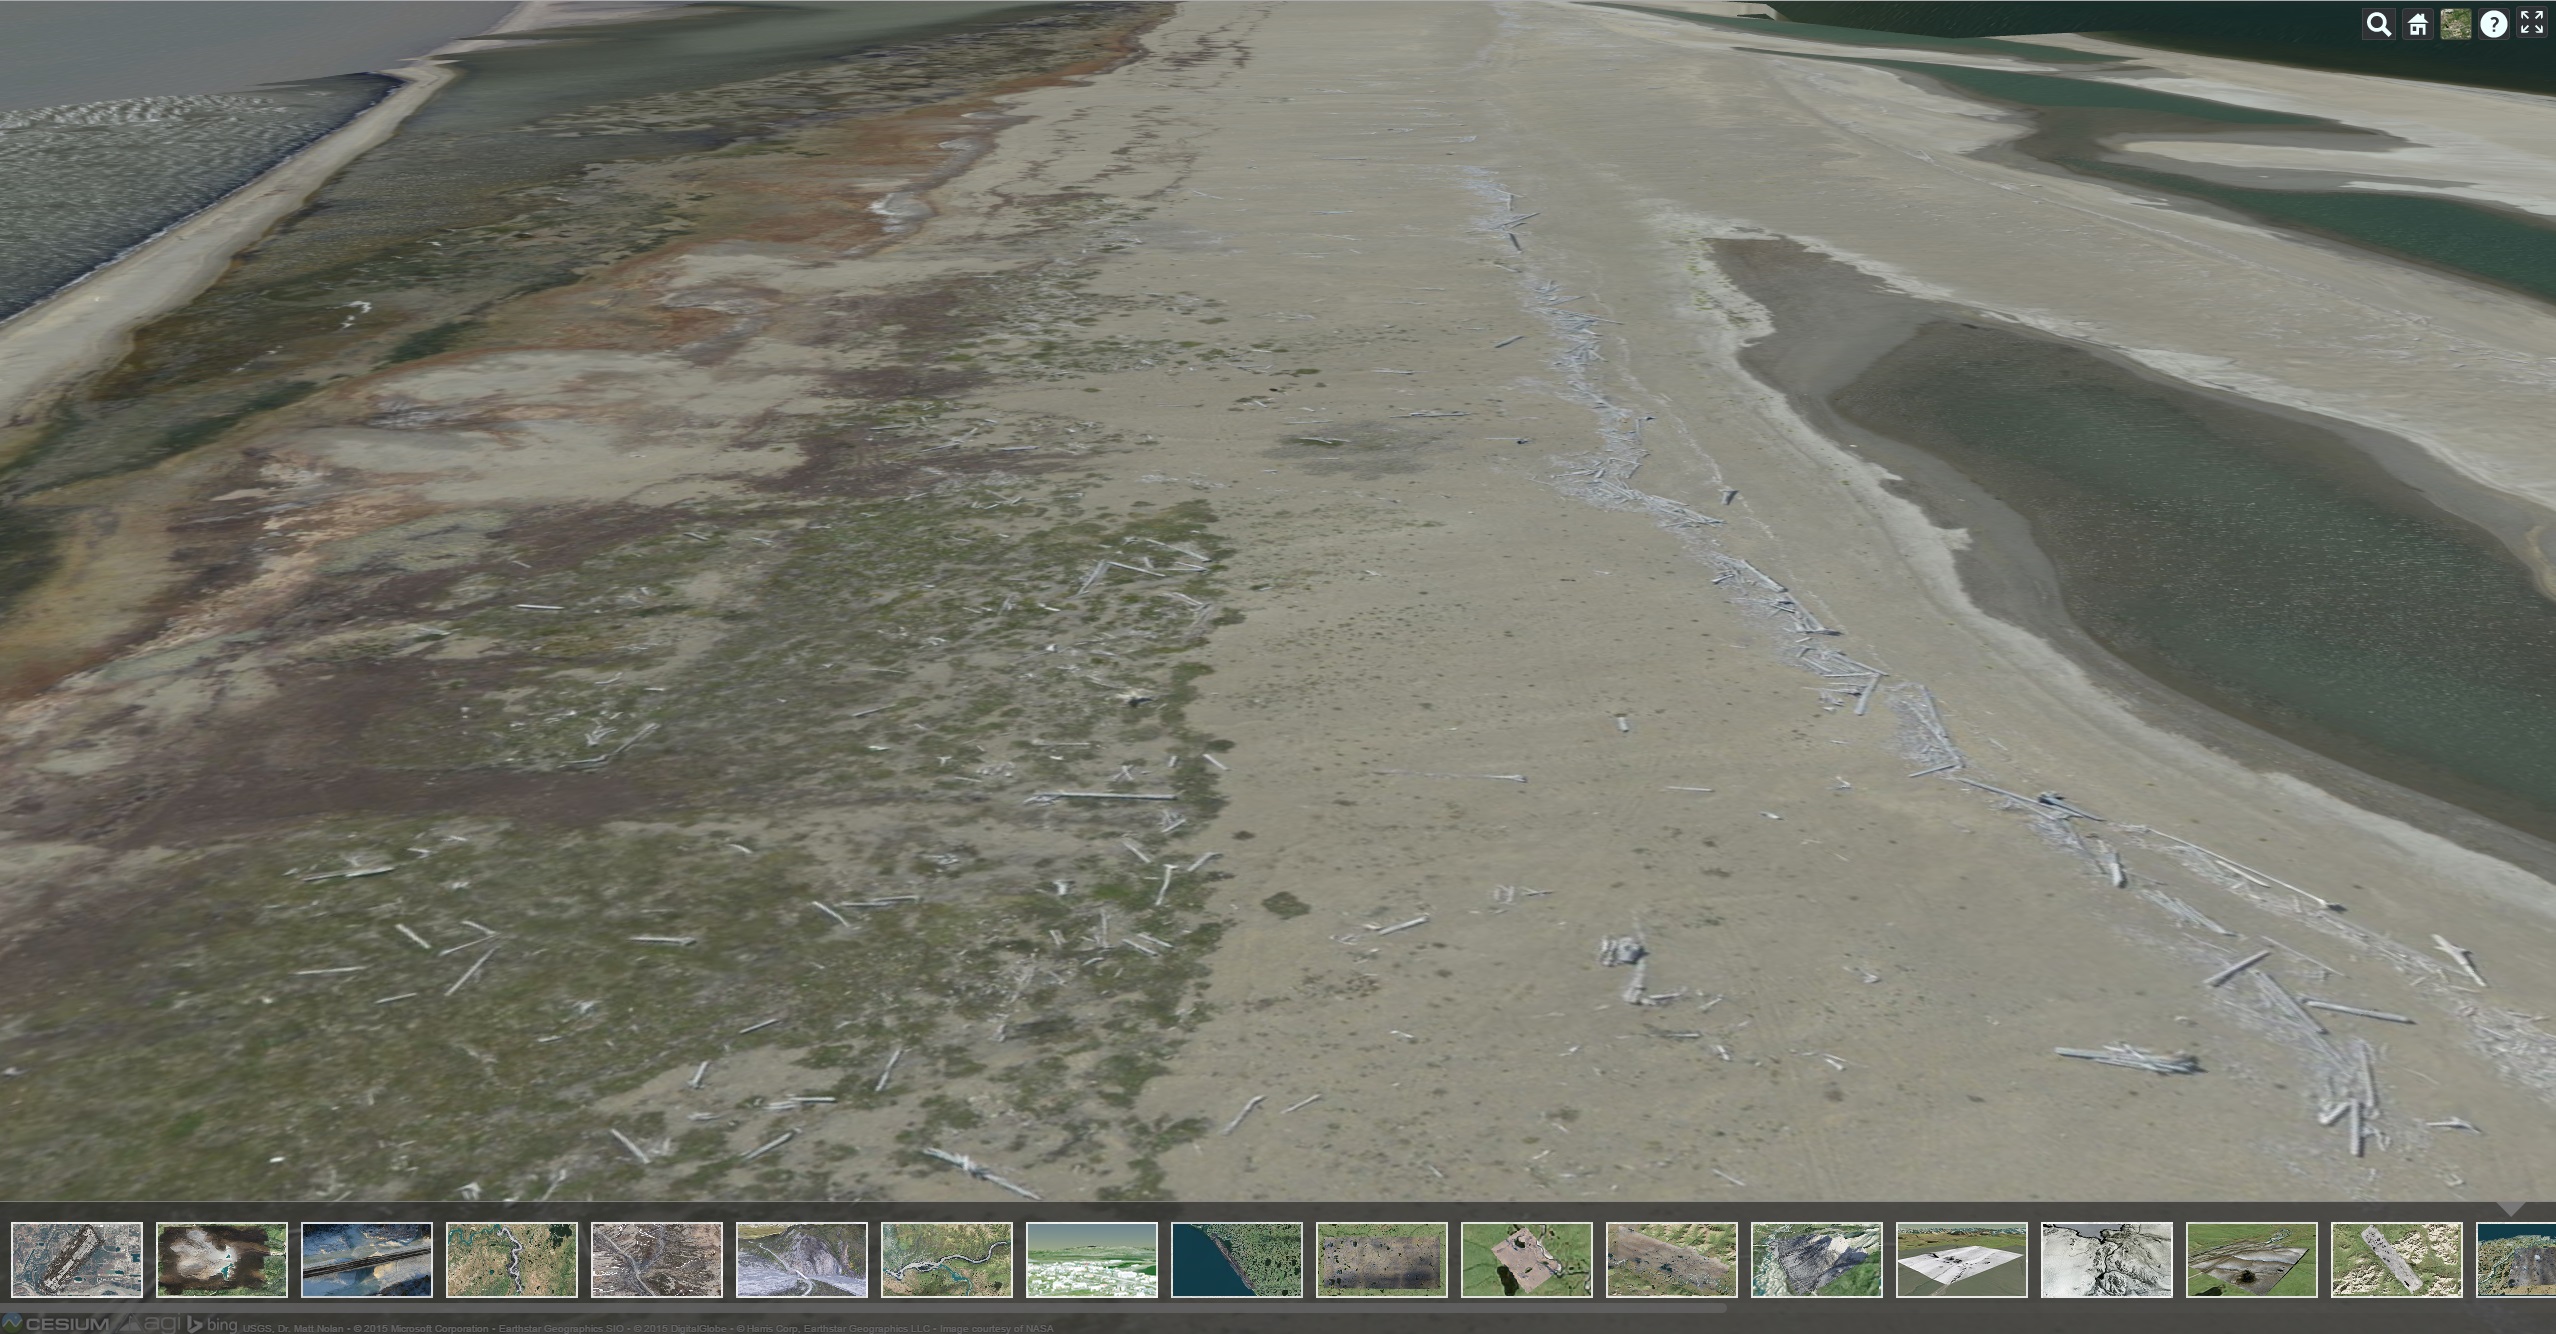
There’s lots of stuff on the beach when you have the chance to look close.
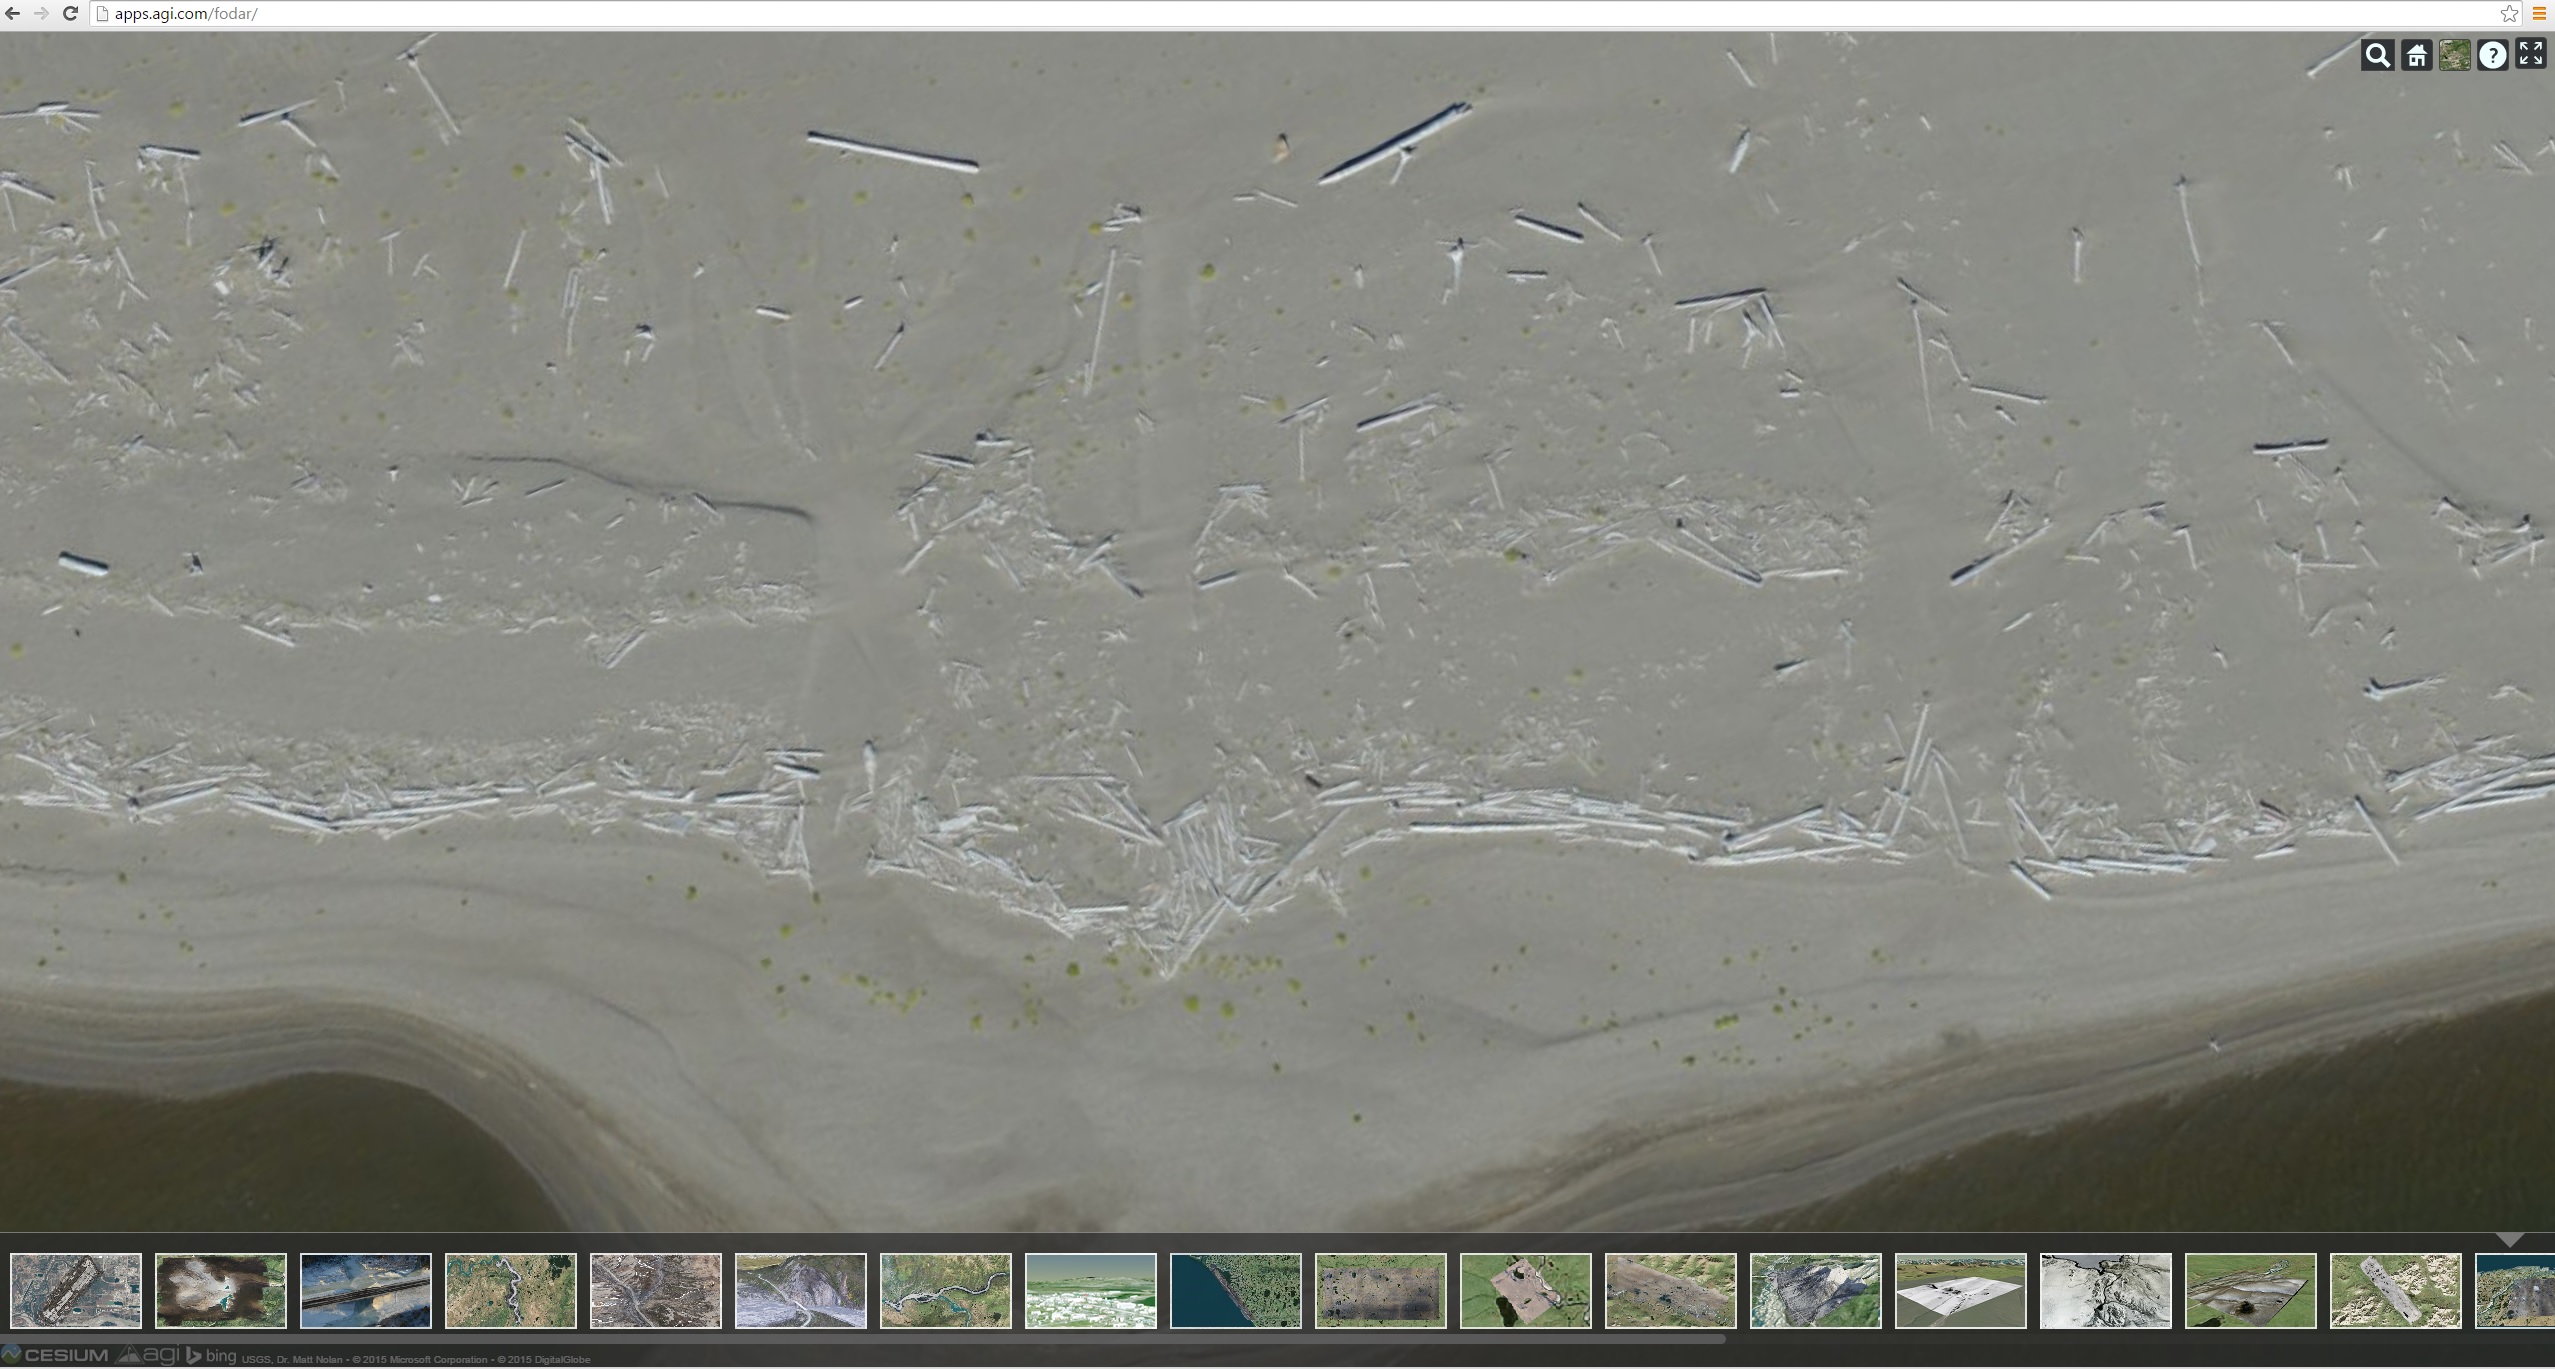
Apparently ducks like to make nests in those logs.
Finally is a large block of glaciers surrounding Peters Lake in the northeastern Brooks Range for Northern Arizona University and the National Science Foundation. This map is the second that I’ve made here this year, with one more to go, measuring snow and ice change over time within the entire watershed. You can learn more about the project here http://www.facebook.com/LakePetersProject
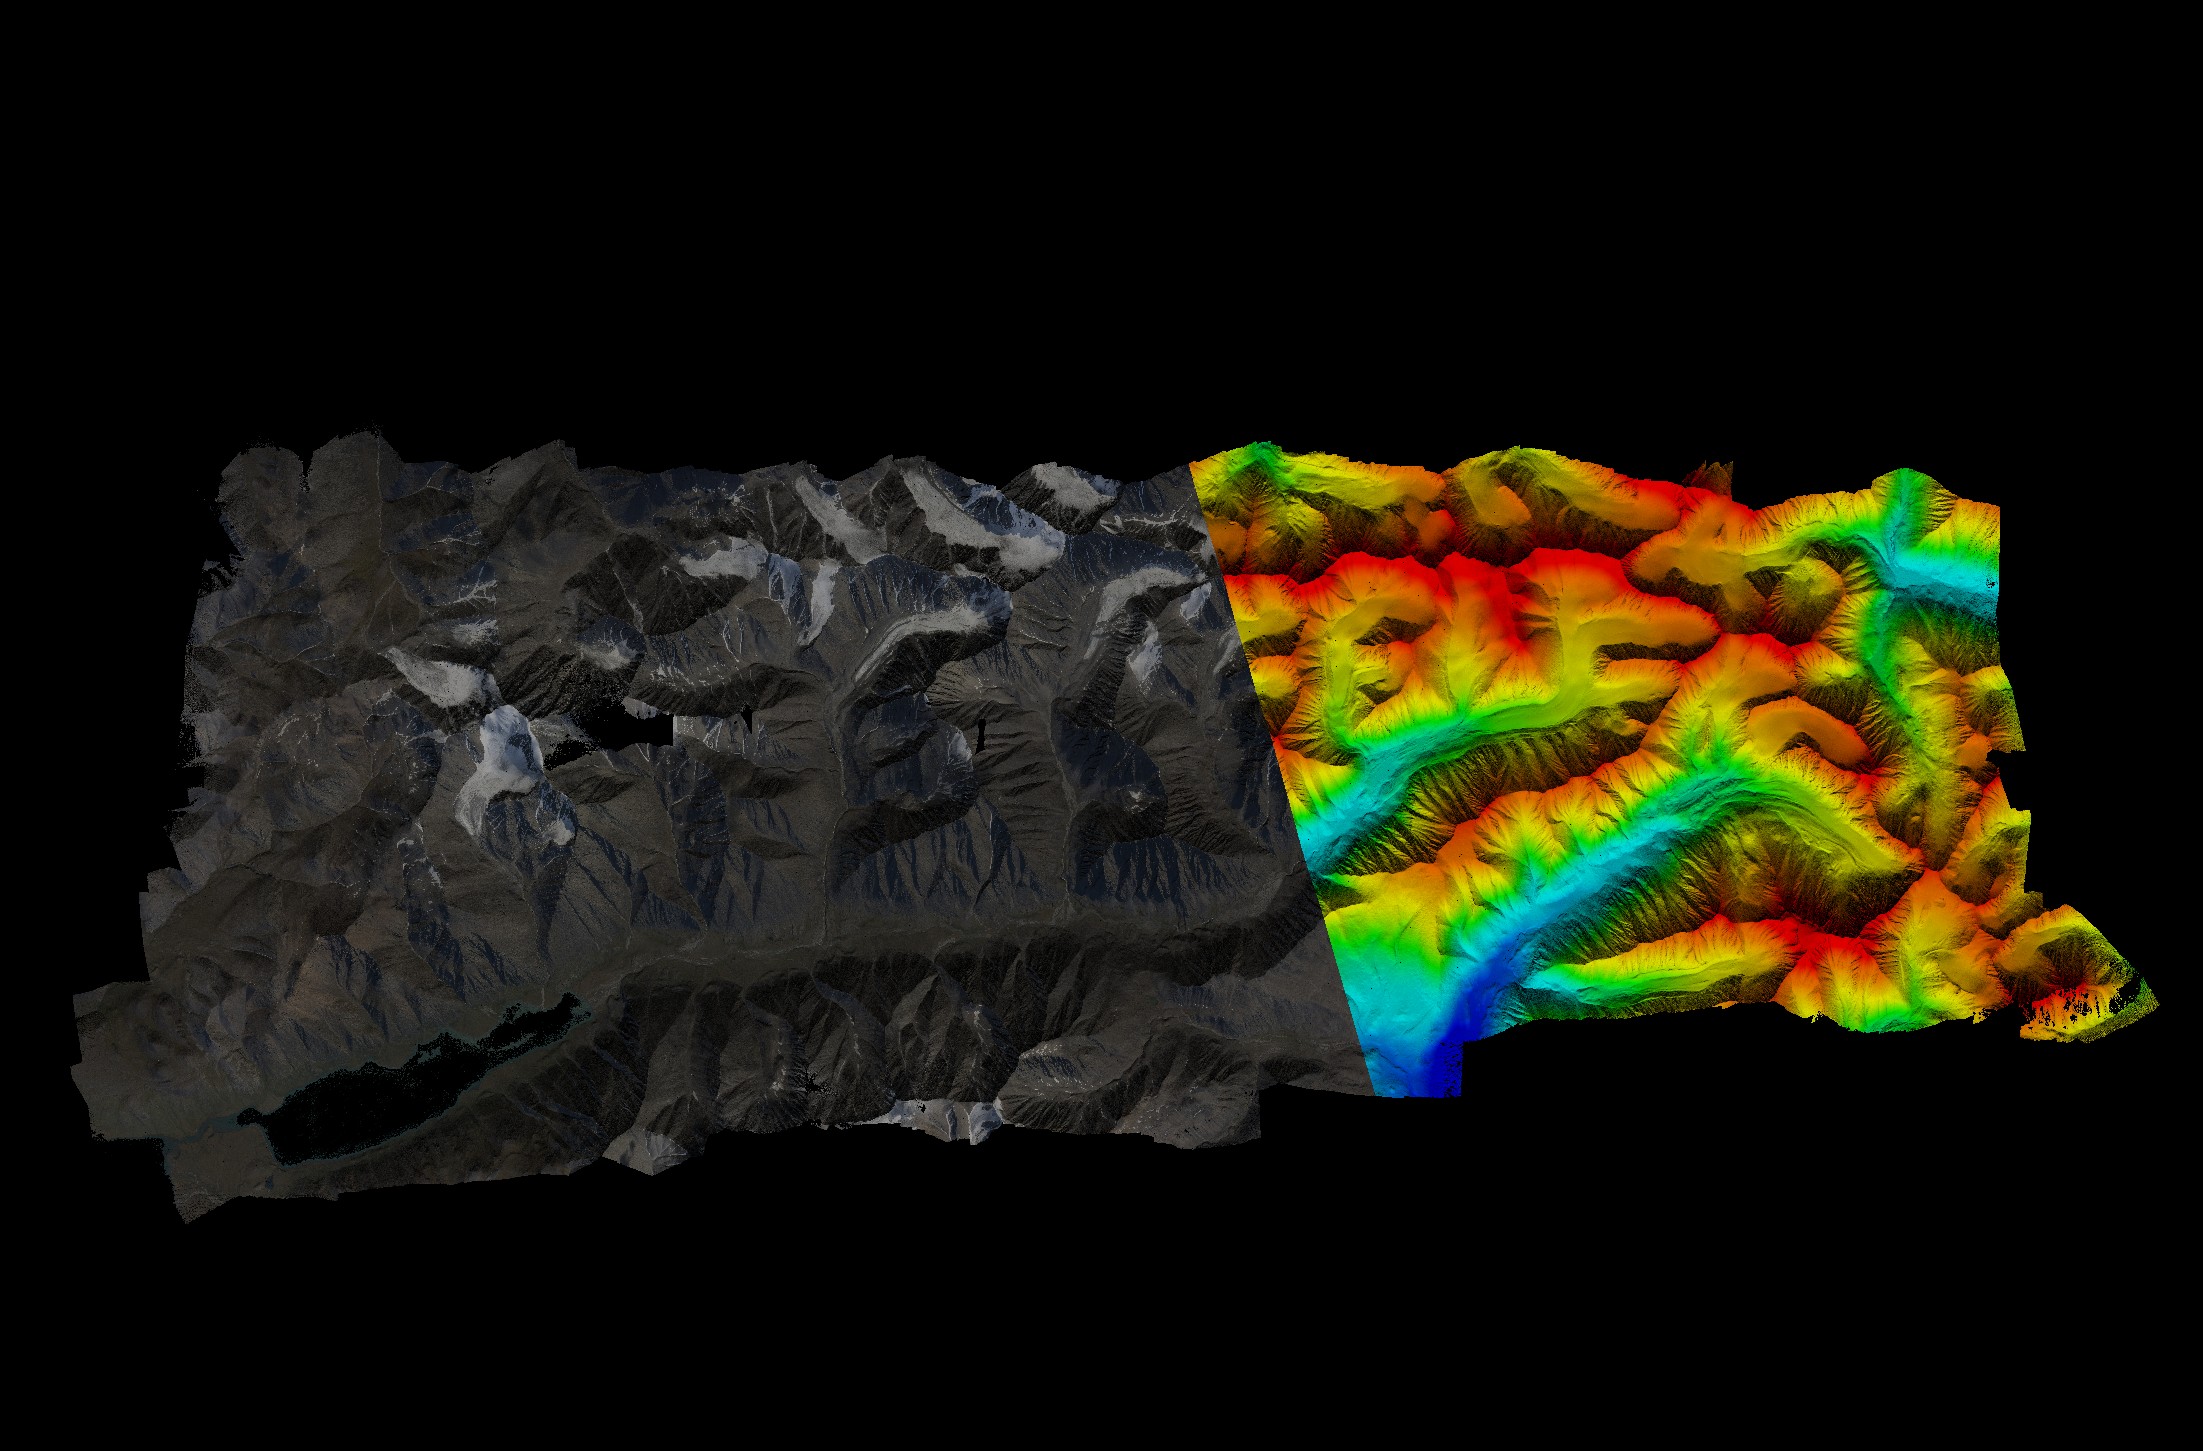
Here is the Lake Peters study area, shown with half the area draped by the orthoimage and the other half as colorized topography. Mouse-over to see a difference image created by subtracting the April map from the July map. Here colors range from +0.5m to – 3.5m. Most of the area is orange/red (no change) but snow and glacier melt show change up to several meters (green and blue).
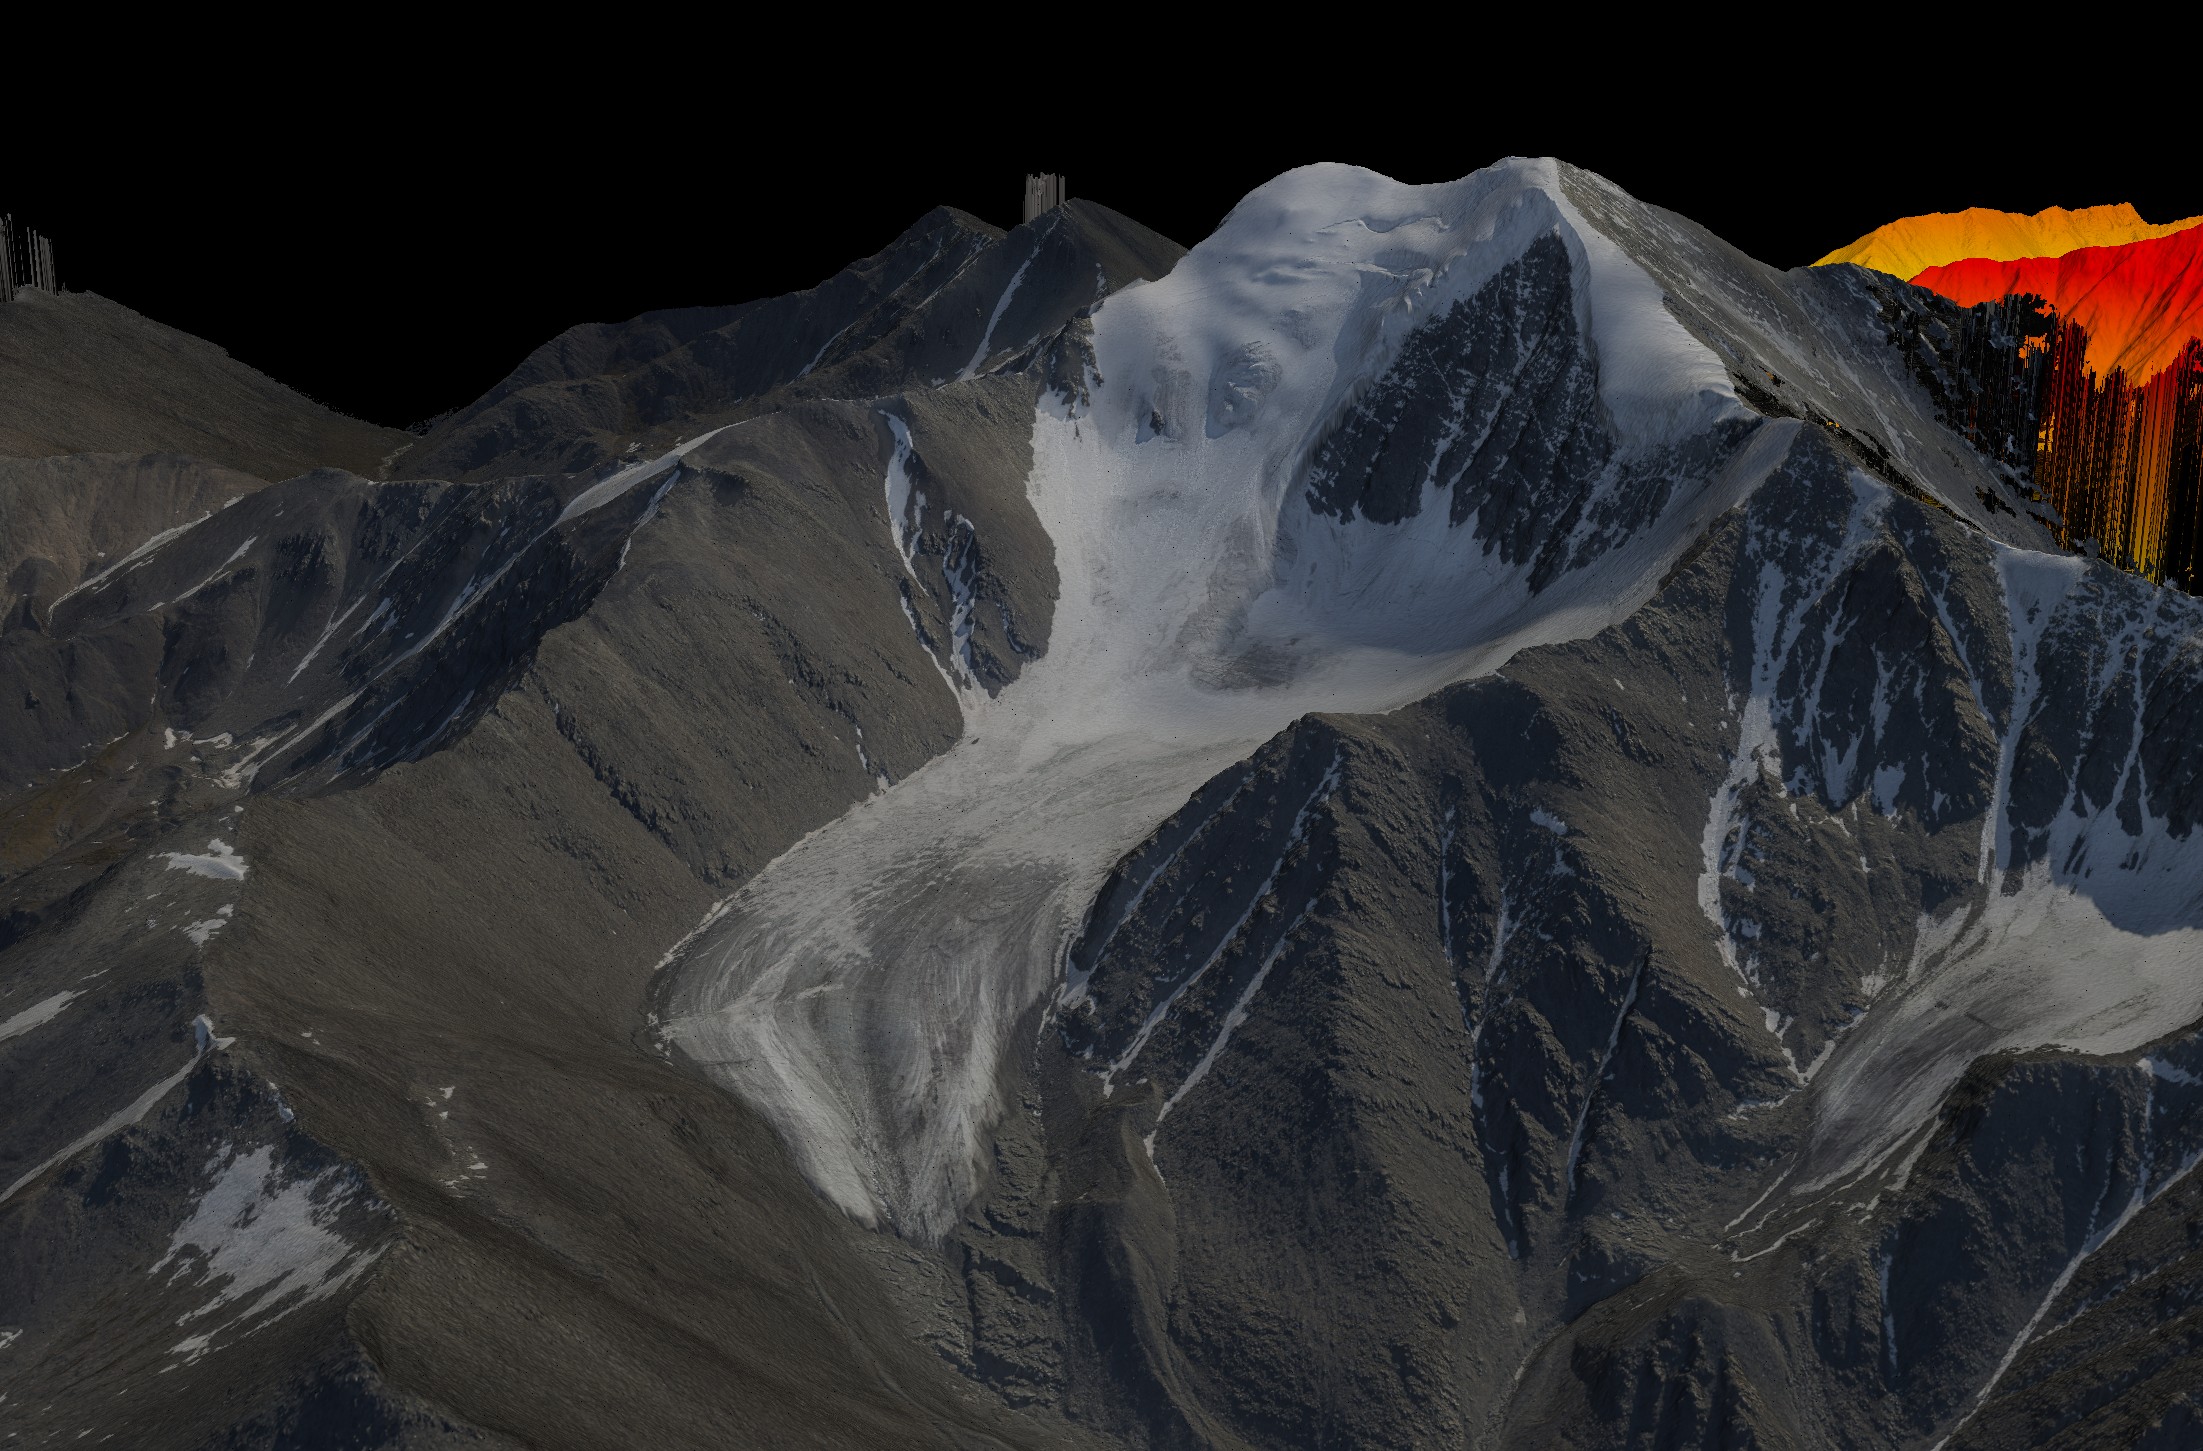
Here is Mt Chamberlin in July, with the fodar orthoimage draped over the fodar DEM. Mouse-over to see the change that occurred between April and July. The biggest changes (blue) were due to snow melt in hollows where thick snow accumulated over winter.