Mining
Mining operations actively change the shape of the earth on a regular basis. Fodar maps can measure cut and fill volumes, form base maps for planning, document reclamation, detect uncontrolled mass movements before they occur, monitor dam integrity, track assets, and any other use where the shape of the land (or anything on it) is a variable.
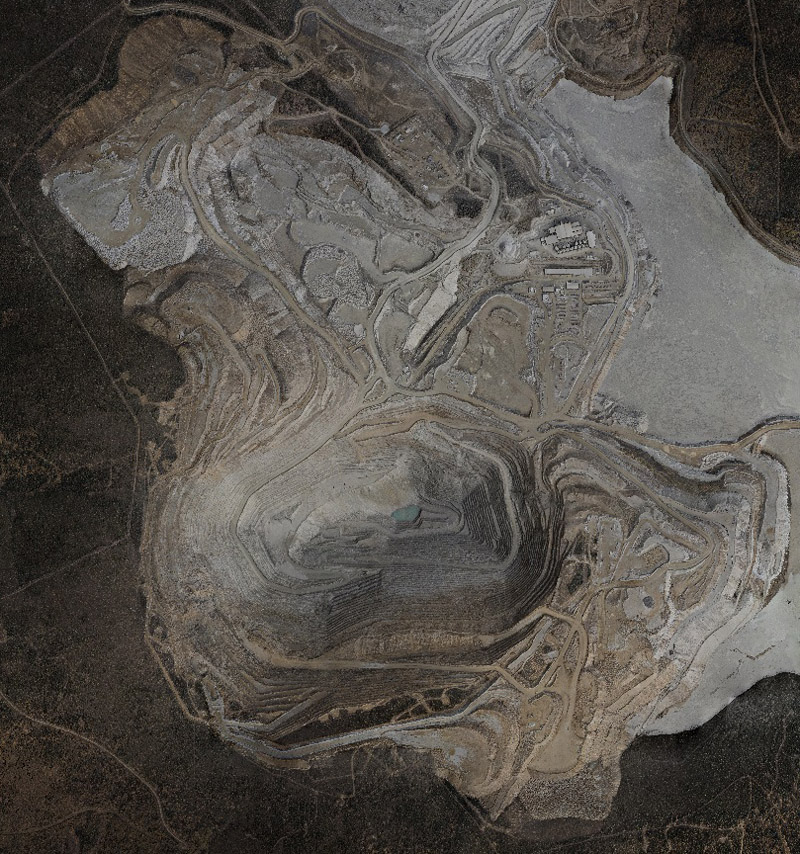
We can easily detect where all mining activity has occurred in the past week using the difference image. Mouse-over this top view — red means the surface increased in elevation, blue means it decreased, and green means no change. Imagine making a map like this once a week, or even once a day.
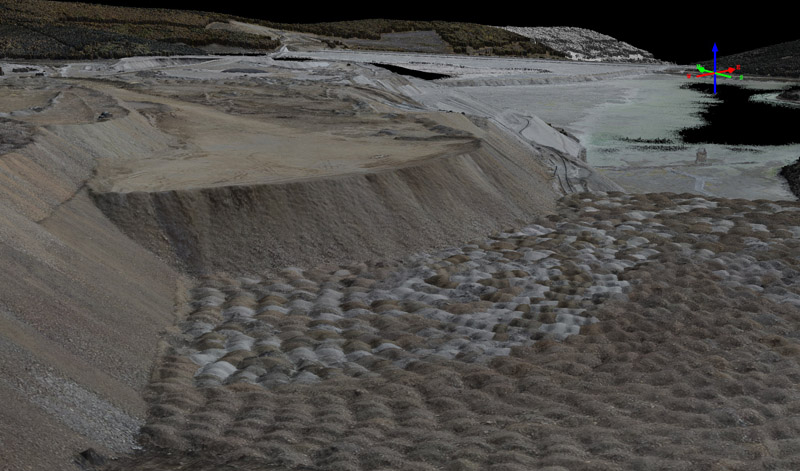
Mouse-over this image to see the tailings pile grow over a week. Those are individual dump loads in the foreground. This pile is in the lower-right of the previous image showing the top view of the mine site, and appearing as a bright red horseshoe.
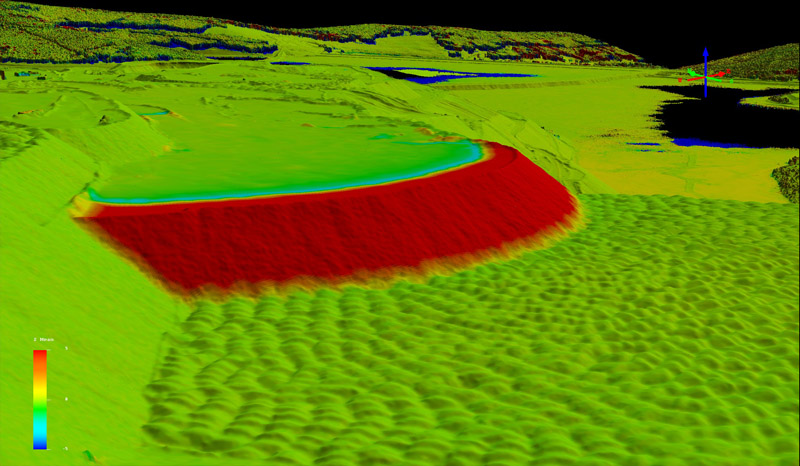
Here is that same tailing pile, shown as a difference image over one week. All of the red tailings here were added during this week; everything in green is unchanged. Mouse-over to see the orthoimage.
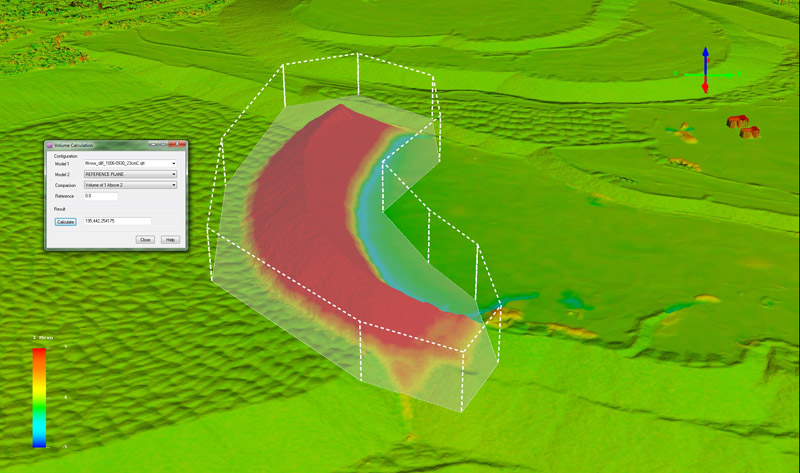
We can easily measure the volume of these tailings, simply by outlining it and pressing a single button. Note the trucks in the upper right are imaged topographically — they are red because they were not parked there the week before. Imagine measure cut and fill volume weekly or daily with the accuracy of fodar.
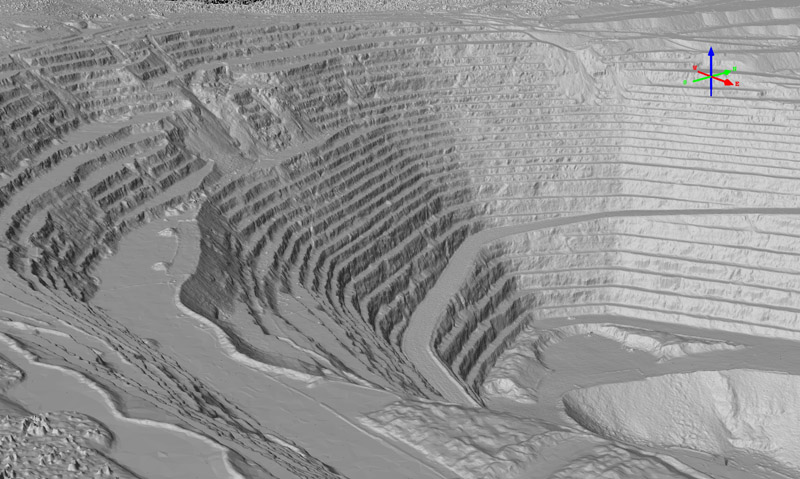
Here an uncontrolled mass movement occurred. You can see the fault trace to the left of center of the image. Mouse-over to see the aftermath of the fault release. You can also see the results of a blast field at left and the results of excavations in the bottom of the pit. Note how the remainder of the pit walls appear stationary — the lack of motion when flickering between the two images is a sign of the awesome repeatability of fodar. Exact volumes of detached material and necessary clean-up can be measured on the same day as the detachment occurred using fodar.
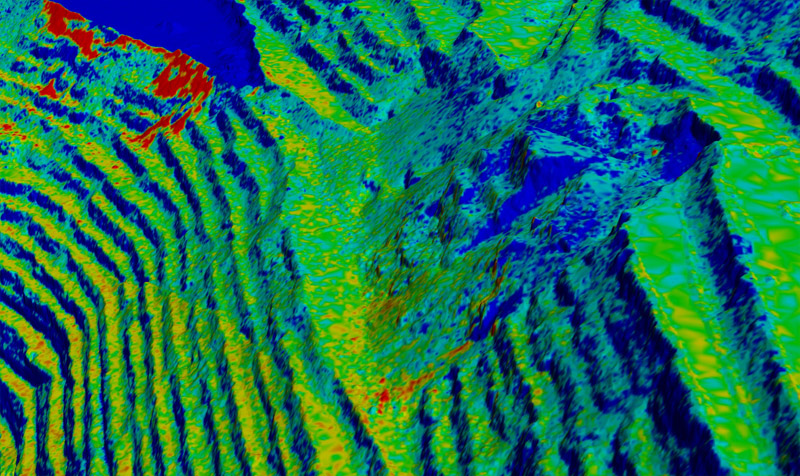
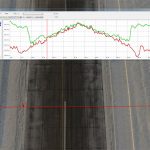
Fodar can be used to detect fault releases before they occur. Here is a difference image made from DEMs a week apart. You can see subtle motion on the order of centimeters below the fault trace at lower left. Mouse-over to see a difference image after that fault failed.