
Mapping Peters Lake Watershed
Our 2016 summer field season started off yesterday with a long day trip to map ice and snow in the watershed of Lake Peters in eastern Brooks Range. The project is led by Dr Darrell Kaufman of Northern Arizona University, supported by funding from the National Science Foundation. One of the main goals of the project is to understand the hydrological cycle at Peters Lake in support of development of a lake sedimentation model to understand paleoclimate signals derived from lake sediment cores. Darrell and I collaborated several years ago on taking a short core from Peters Lake on a fishing trip and found that there was indeed potential for a paleoclimate signal here, primarily understanding cycles of glaciation and deglaciation. Sediments are delivered to the lake primarily from stream runoff, so understanding how water gets into these streams and how much comes from glaciers, snow, rain or springs is important, as each has potential to not only deliver different types of sediements but different volumes of them depending on the percentage of glaciated terrain, among many other things. So a field program was established there, building on similar research that began at this lake in 1957 by John Hobbie, to try to understand the partitioning of runoff entering the lake. This is where Fairbanks Fodar comes in.
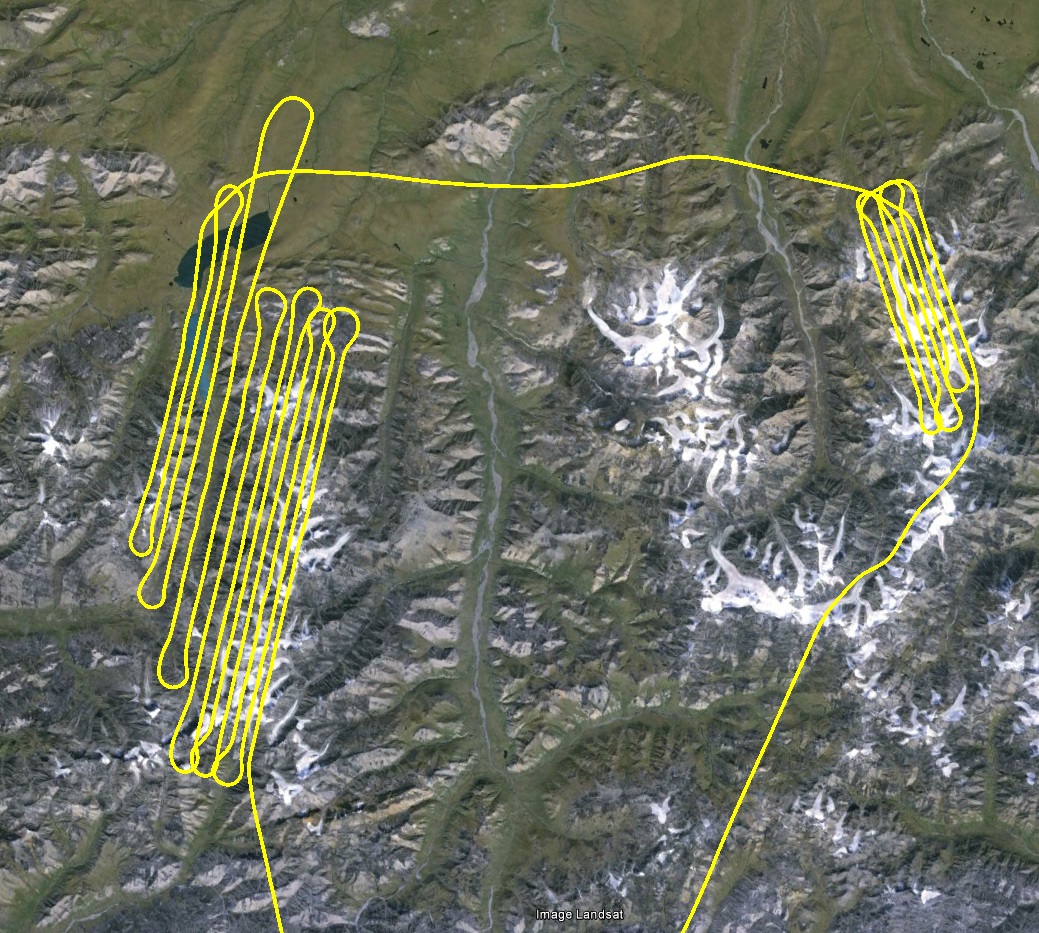
We have a contract to map the 15 glaciers here 3 times per year, at end of winter, mid-summer, and end of summer, to complement the mass balance work the field team is doing at one of them, Chamberlin Glacier. By mapping with this frequency, we hope to directly measure the volume of water that runs into the lake from glaciers here. This volume can then be tied to both measurements sediment loads from Chamberlin Glacier, but also to historic or modeled glacier volumes and climate-driven melt for the lake sediment model. I do not believe that any valley glaciers in North America (maybe anywhere), other than perhaps McCall Glacier 20 miles to the east, has a density of volume change measurements like this, but the future of glaciology is heading in this direction.
This is our second year for this contract out of three, and in all acquisition thus far we have covered more area than required. Specifically, the glaciers are only located on the east side of the valley, but we are capturing the entire watershed so that we can also directly measure snow thickness. I believe this may be the first time this has ever been done, and certainly in Arctic Alaska. Even the dense stake networks of the much smaller watersheds along the haul road only capture a few percent of those watersheds directly — here we are directly measuring about 60 square miles of snow depth, such that no extrapolation from point measurements is required. I used some of the data acquired here last year in our paper determining the highest peak in the Brooks Range, which you can find here: https://fairbanksfodar.com/fodar-updates-usgs-maps and see especially the visualizations of Mt Chamberlin, which is in this study area. So it is an exciting project in many ways.
The flight yesterday was under beautiful conditions. The field team was already on the ground and was able to relay local weather, which corresponded with what limited weather information exists for this area online. The nearest weather stations are at Arctic Village (100 miles to the south, on the other side of the mountains) and Barter Island (60 miles to the north, on the coast) and the weather at these stations has little to do with the north side of the Brooks Range. Satellite information gives a sense, but only just that. I only make it in to the site about 1 in 3 times due to weather, but yesterday the weather held and the acquired data all looks good.
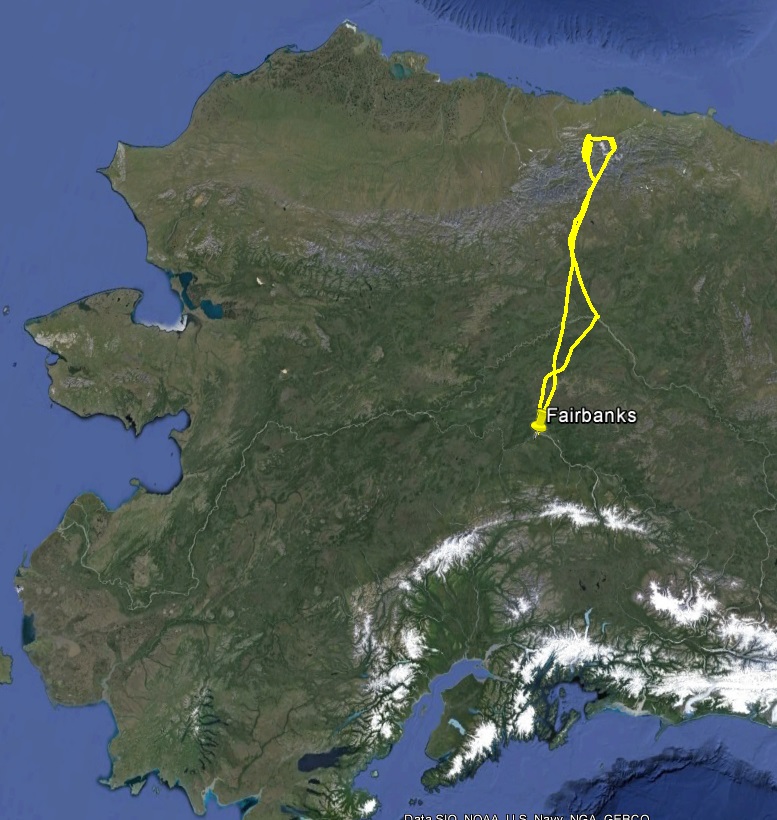
Alaska is a big state, and these glaciers are a long way away. To put the scale in perspective, this is like launching from New York City to map something in Ohio or North Carolina, but crossing the Rockies to do it, passing overhead of maybe a thousand people the entire way.
Peters and Shrader Lakes are on the left, McCall Glacier on the right.
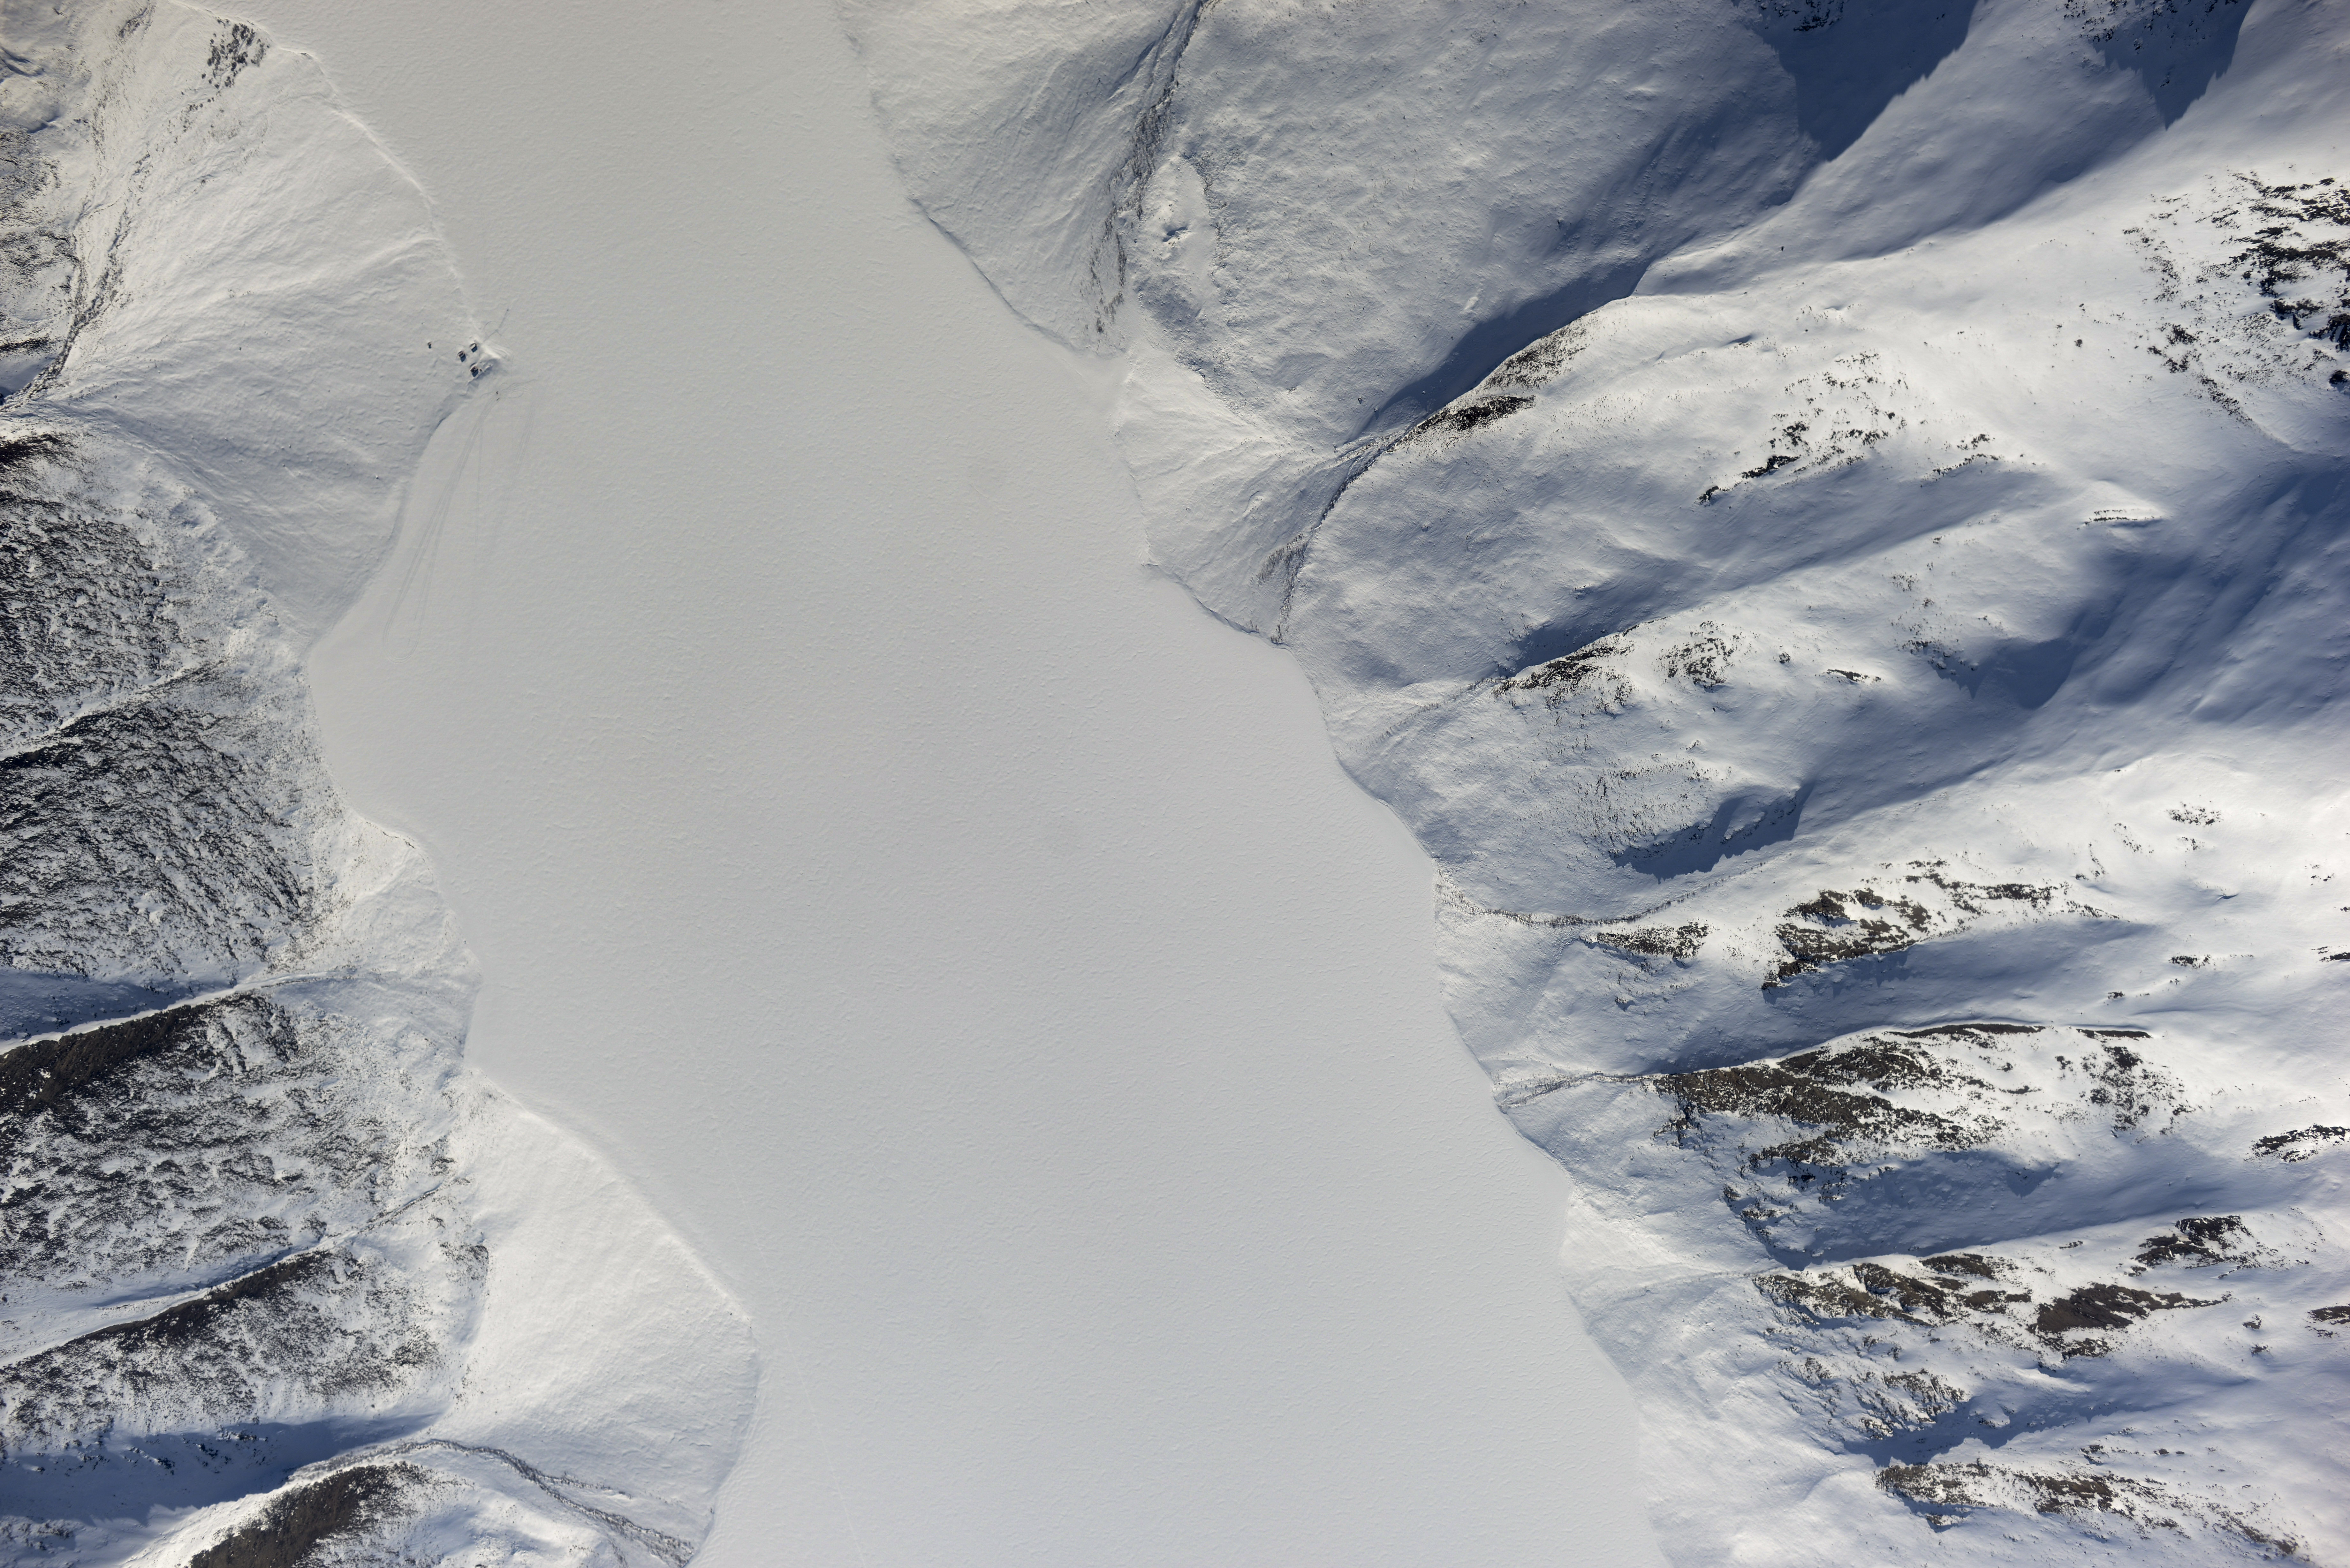
The field team’s camp is at the edge of the lake on a delta. You can see Coyote Air’s ski tracks just below, and the team’s tracks radiating out from camp. All of the snow seen here melts in summer, and with maps based on these images we will have a pretty good idea how much that is. If you download and zoom in, you can even see sastrugi on the lake from 11,000′ up.
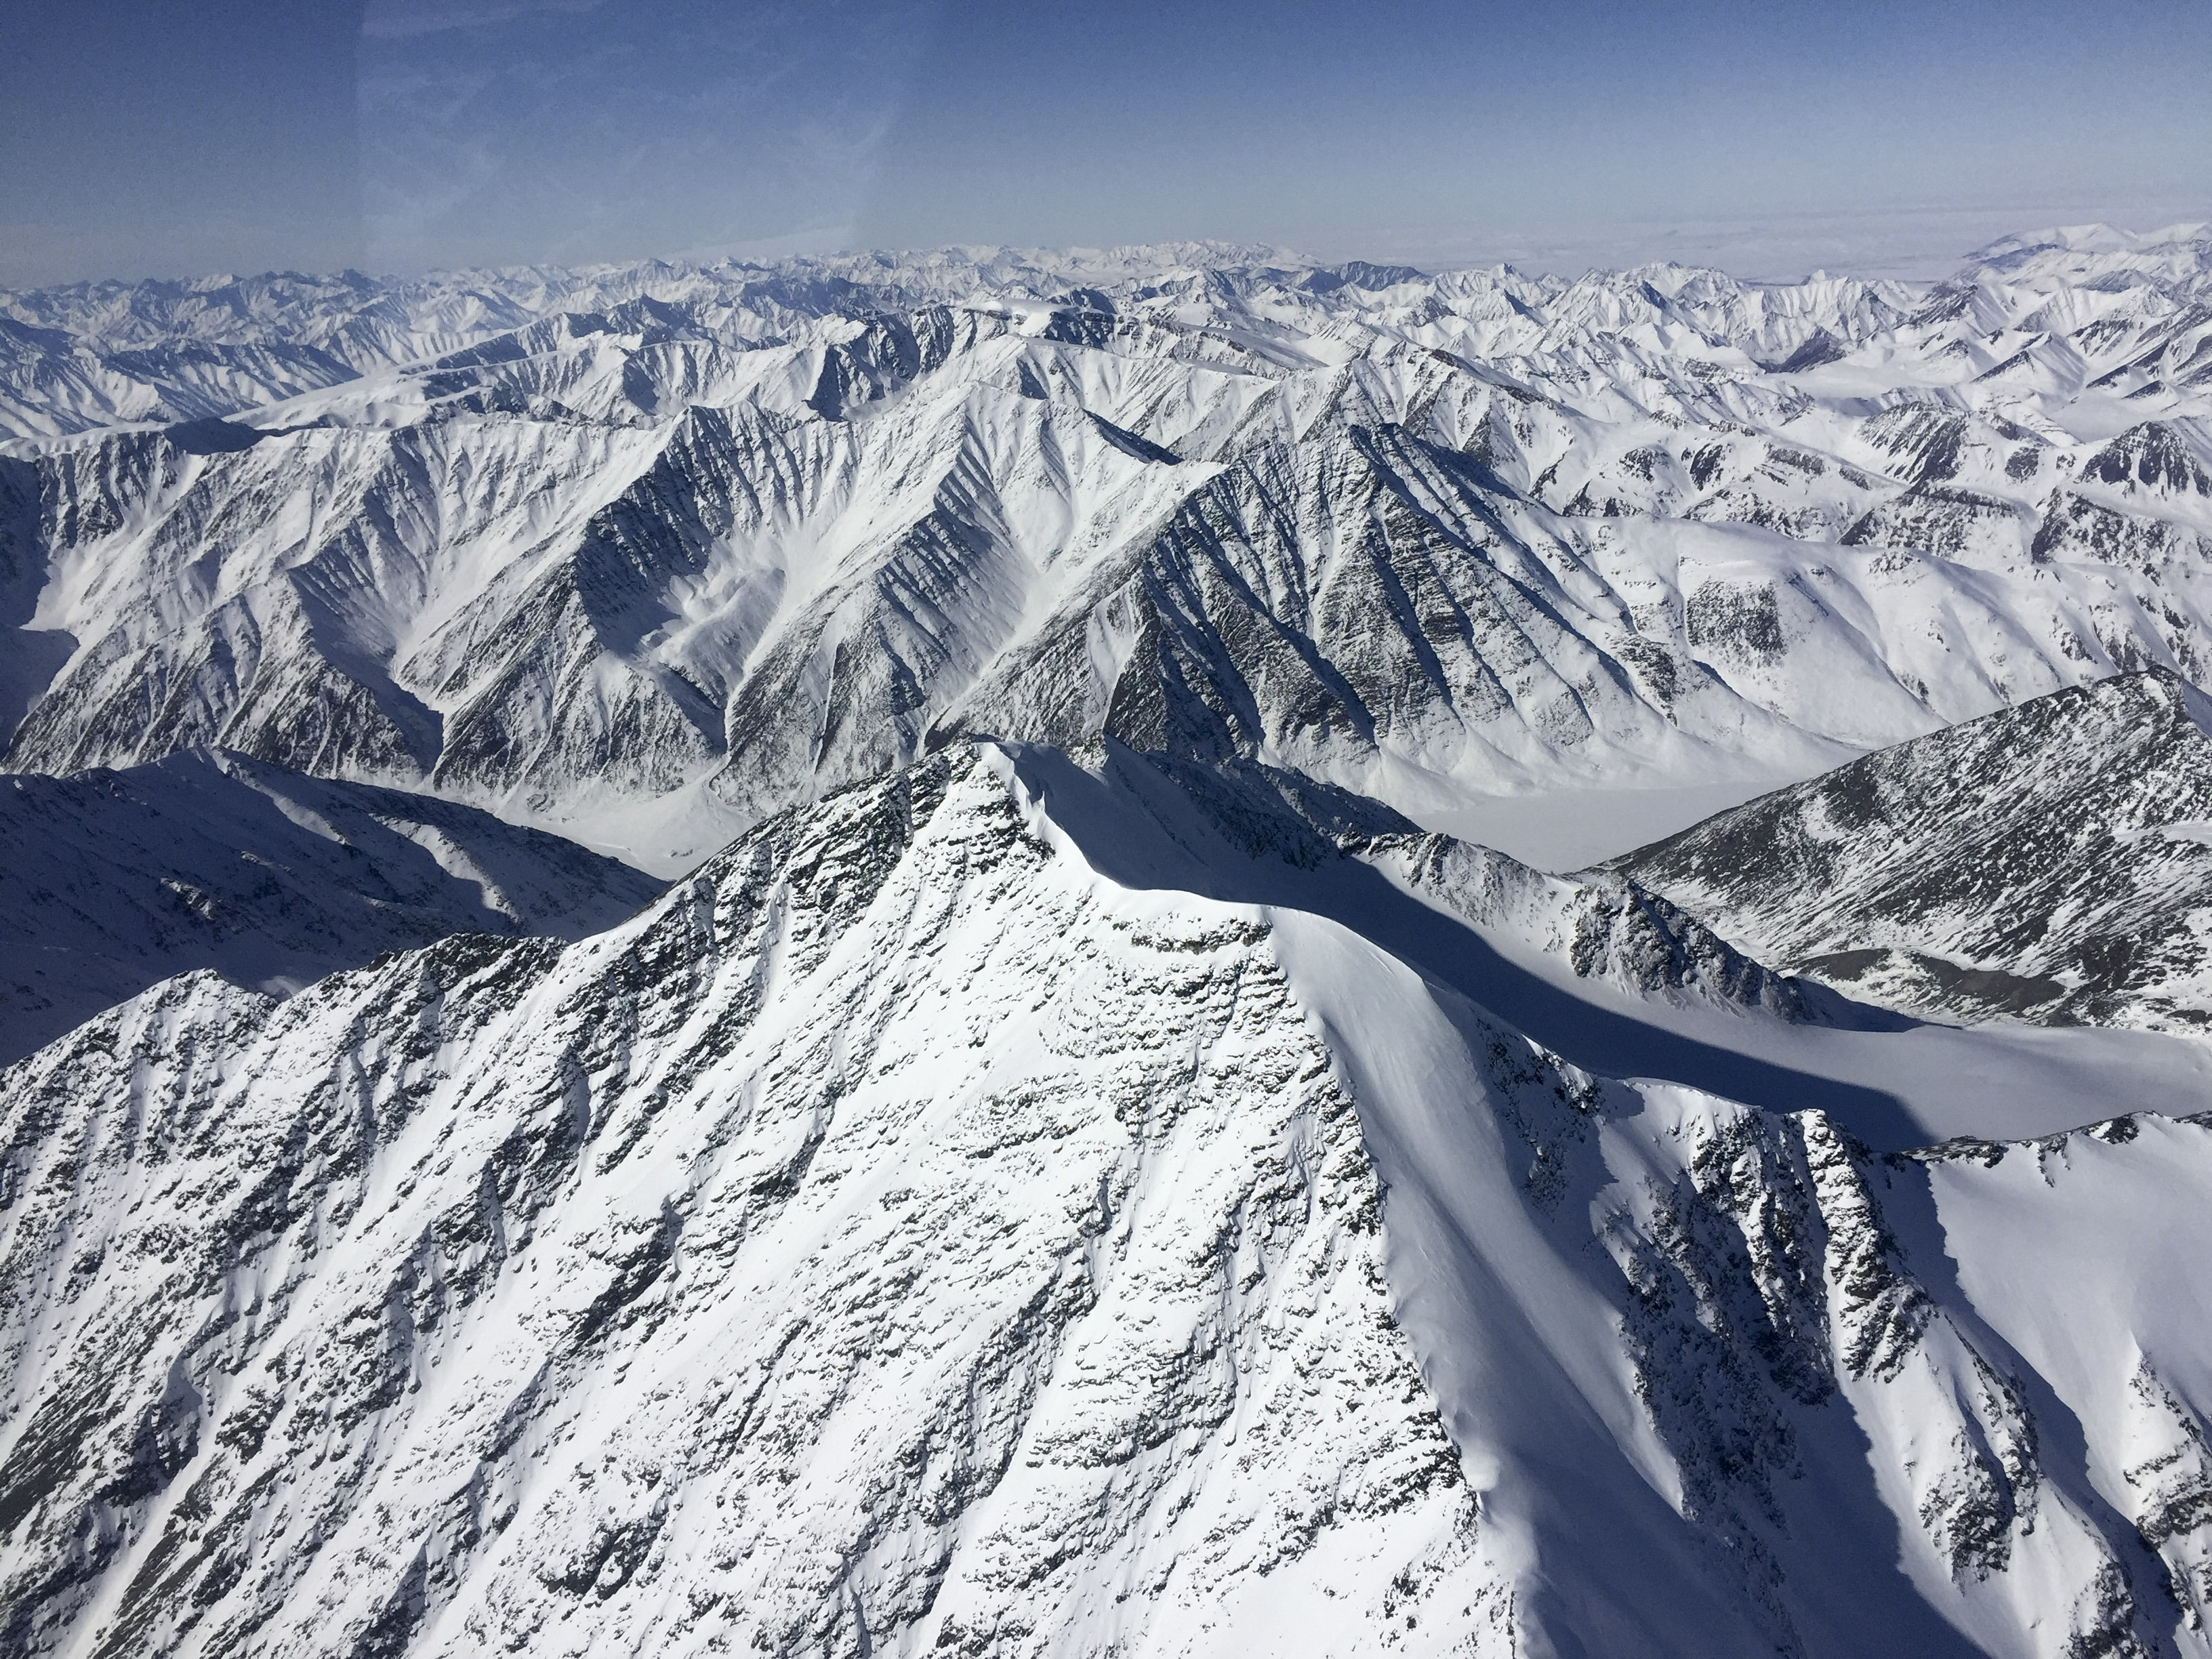 Mt Chamberlin, with the lake in the background. It is essentially impossible to measure snow thickness on mountains this steep any other way but with fodar.
Mt Chamberlin, as imaged last summer. The glaciers flowing down from it are some of the ones we are studying in this project. This visualization was created as part of a project to map the five tallest peaks in the US Arctic to determine which is the tallest, and you can find many more such visualizations here.
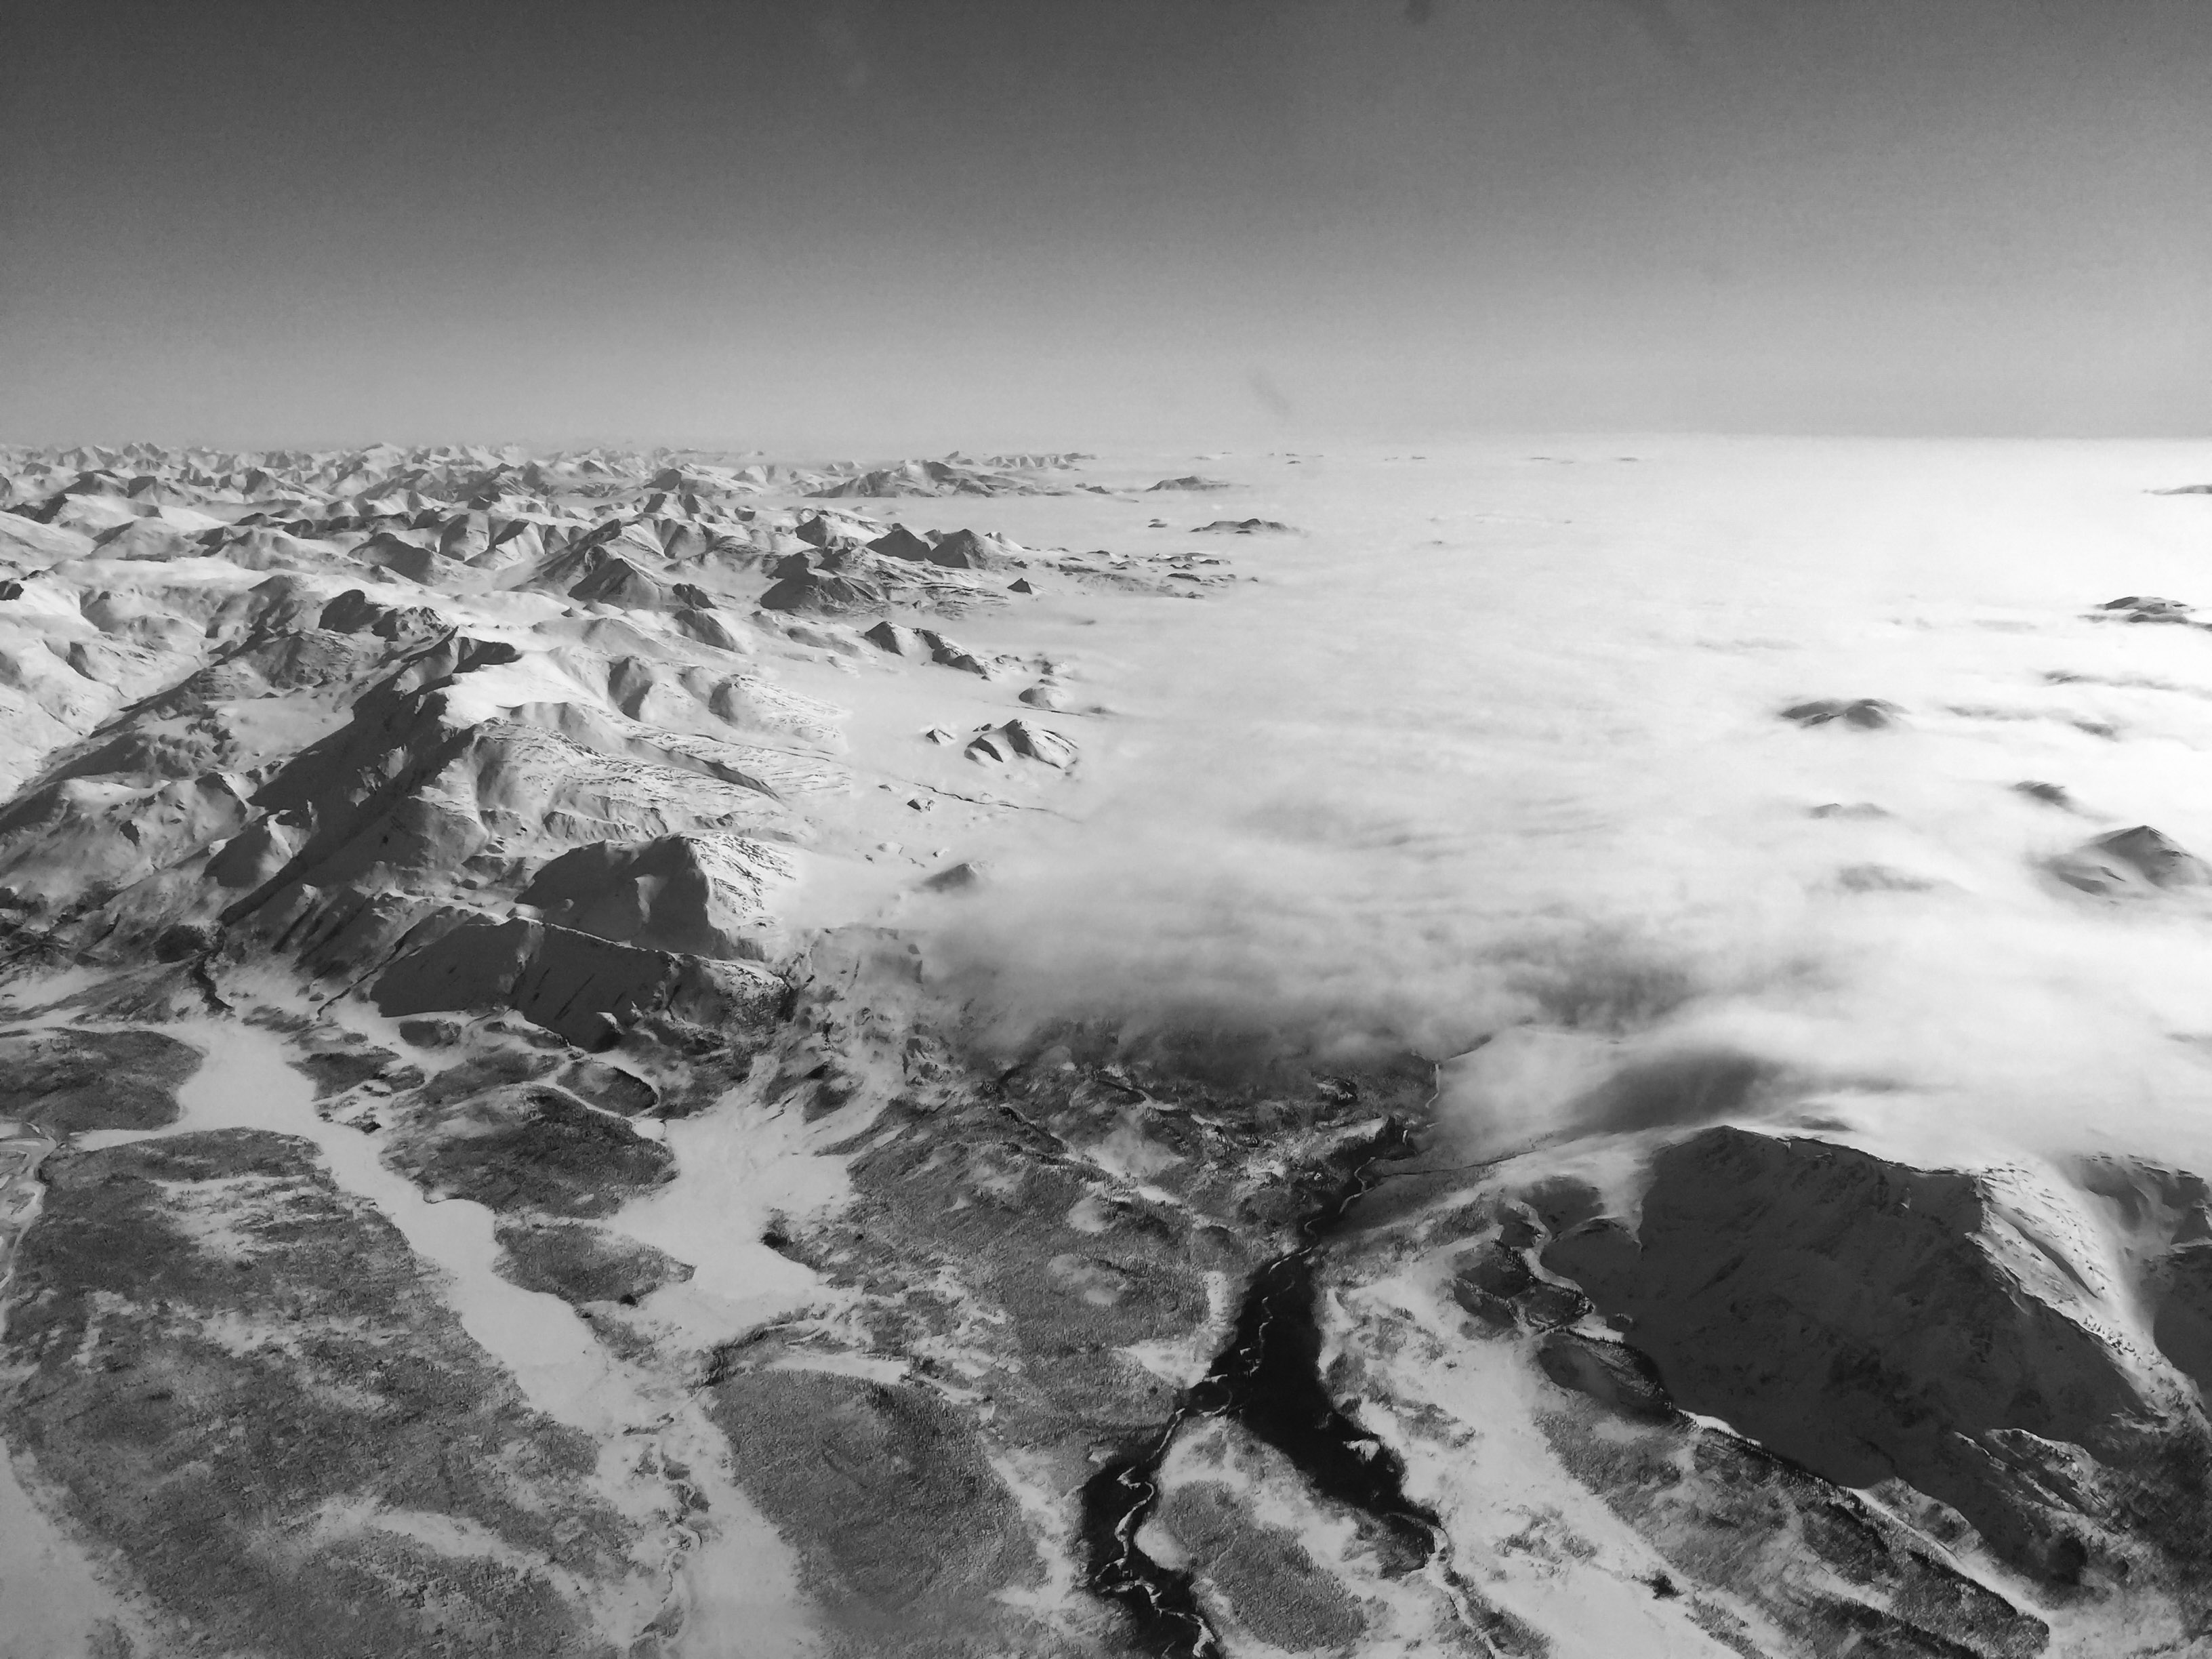
A low scattered layer formed on the south side near Arctic Village. Fortunately I didnt have to fly over it. Not bad for an iPhone through plexiglas.
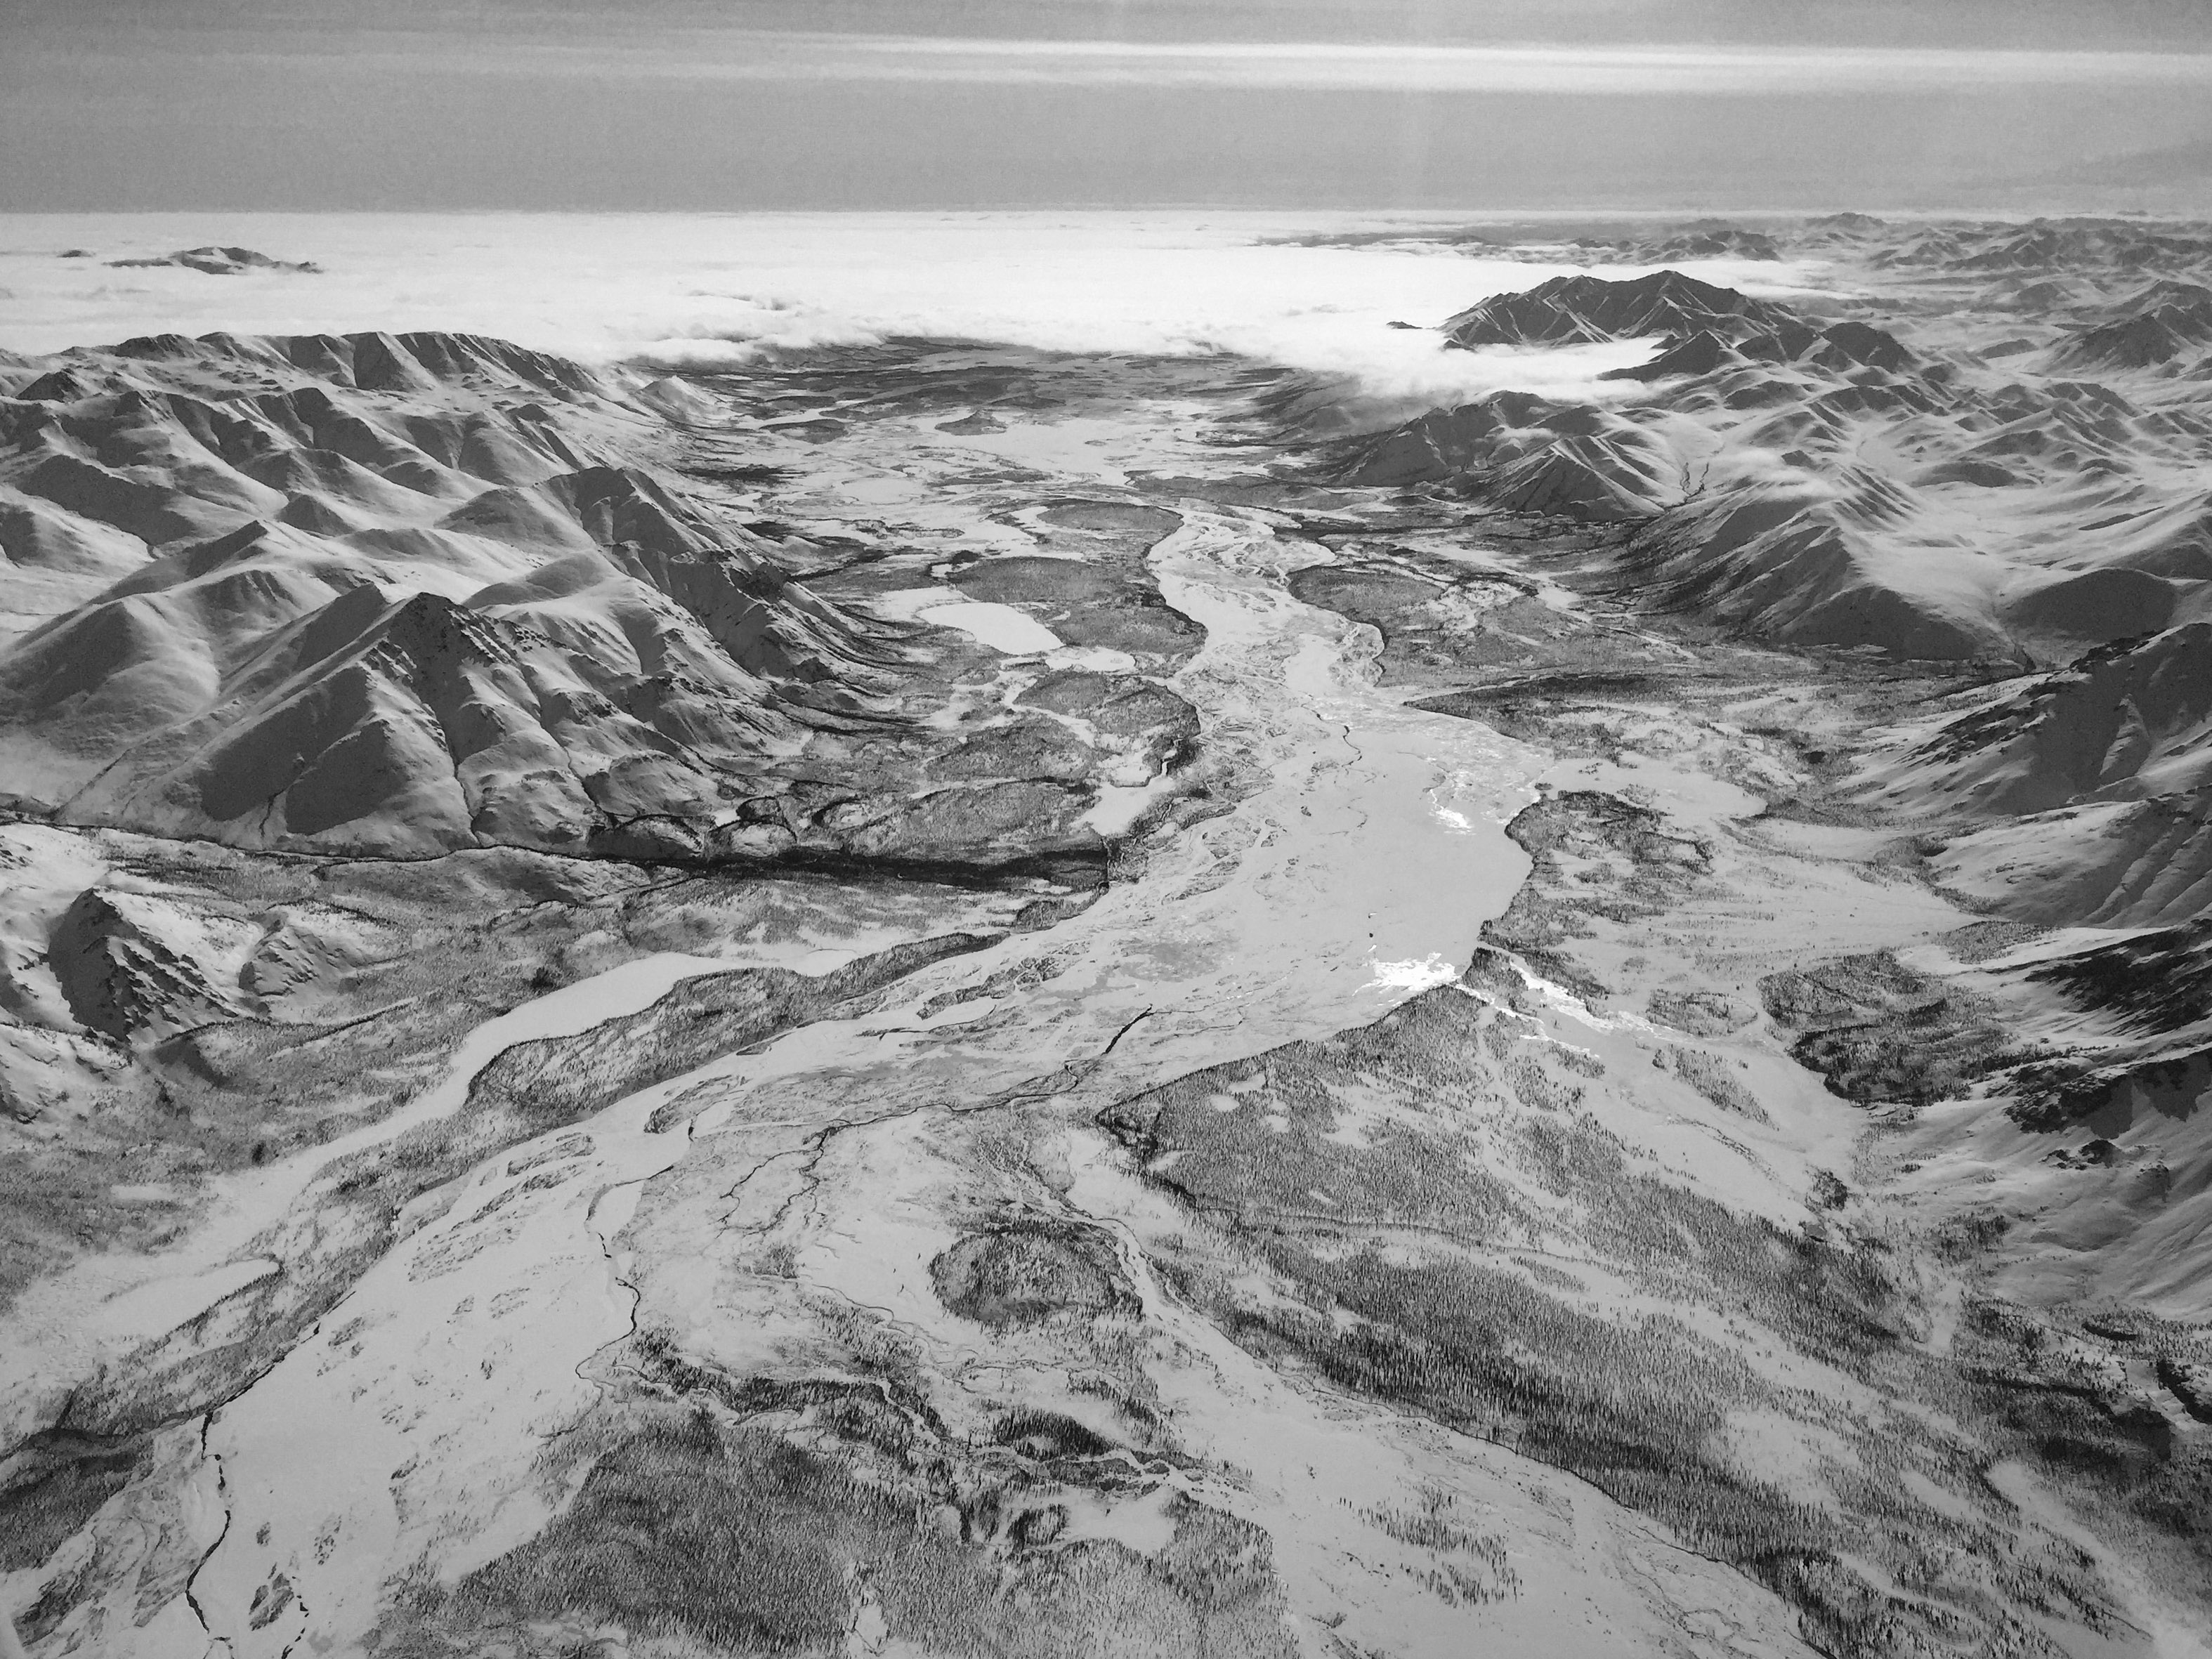 Heading home.
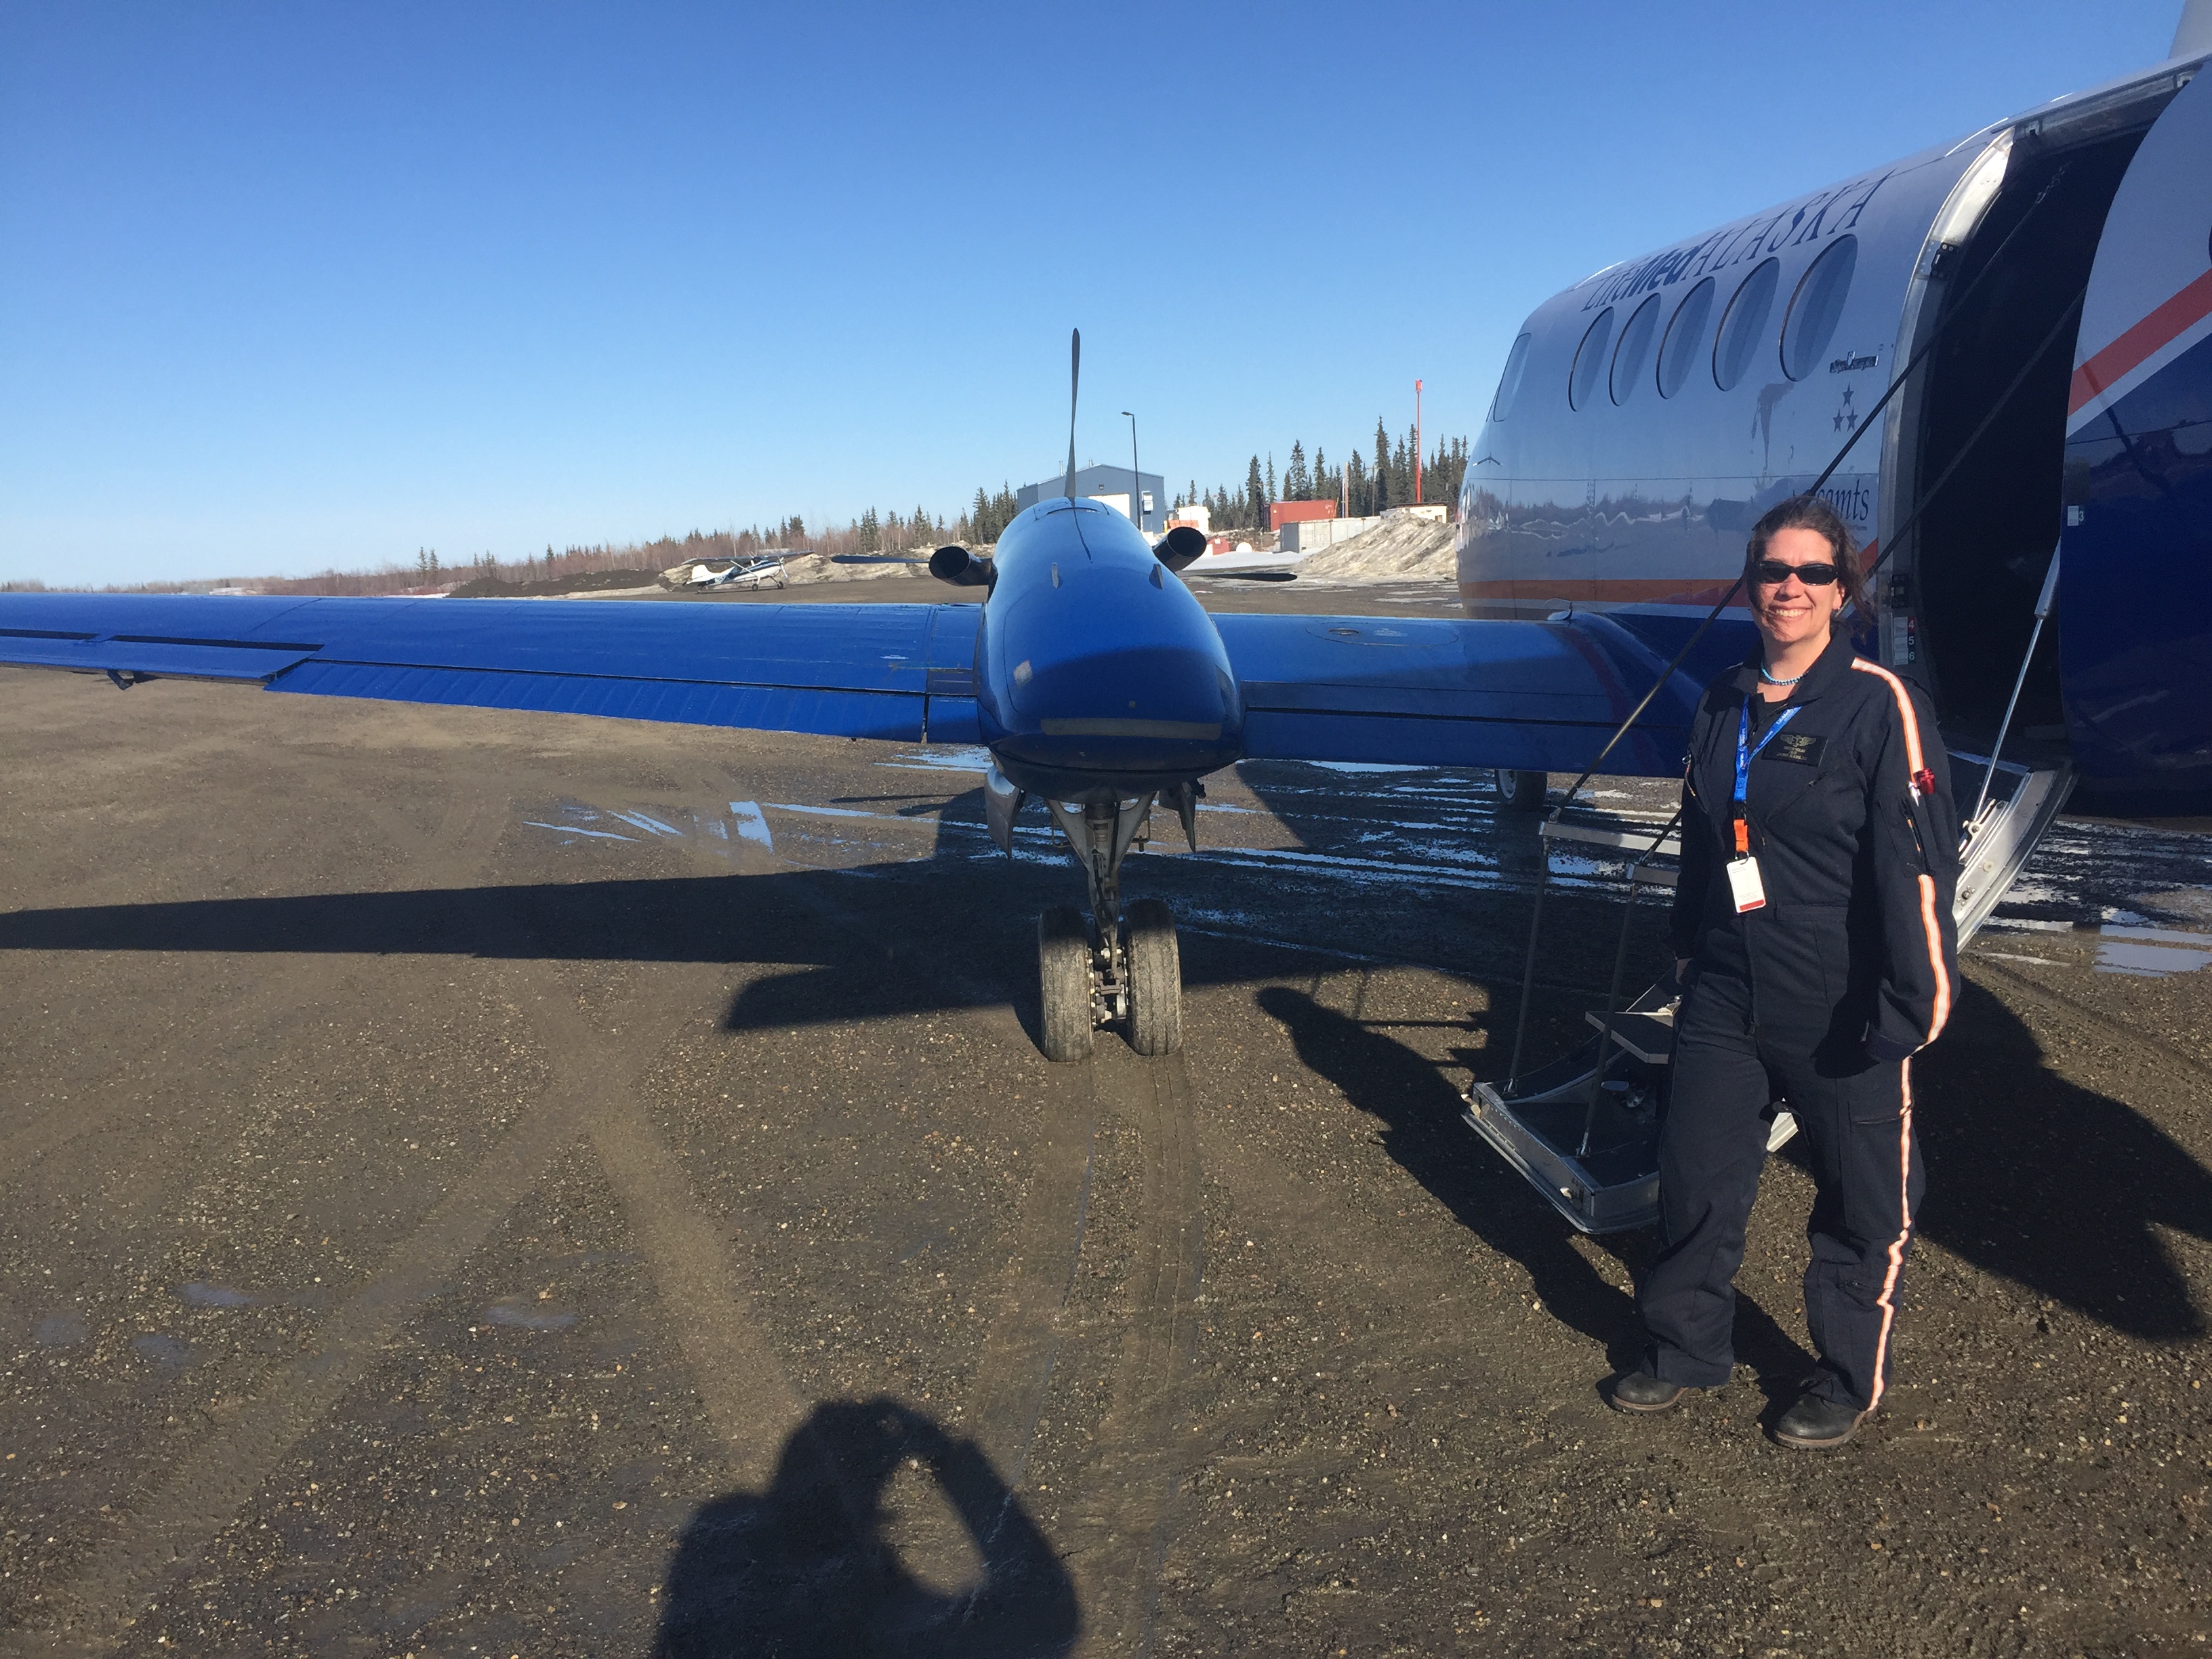 When splashing in some gas in Ft Yukon on the way home, I bumped into Kristin Nolan flying a medivac flight to Anchorage. Big State, Small World.