Coastal Erosion
Coastal erosion rates are changing due to global climate change, but exactly how remains to be measured. Fodar can measure not only the aftermath of storms, but the aftermath of yesterday’s high tide. It can accurately map beach and inland topography for storm-surge and tsunami modeling, and the erosion and debris in the topography and orthoimage can be used to determine the high tide limits.
You can learn more about our scientific research on coastal erosion here.
We also spent much of summer 2015 acquiring over 3000 square kilometers of coastal data in western Alaska. You can read about the acquisitions by reading news from August 2015 and our first delivery of data here.
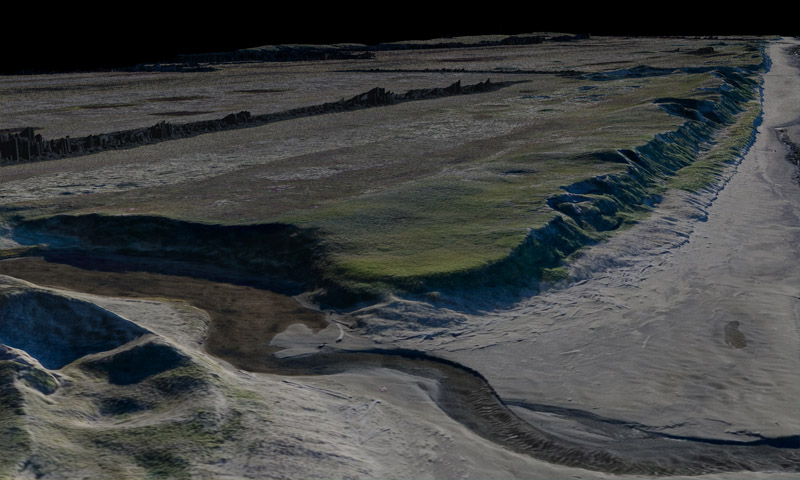
Here is the coastline of Cape Espenburg. The ice rich ground thaws in summer and slumps onto the beach. Mouse over to see colorized topography, which clearly shows how the tide is eroding the material slumping onto the beach, defined by the transition from green to blue. Note how this color transition stays constant all the way into the distance, as it should because it defines a constant sea-level height. This is massive ground control confirm the precision of Fodar.
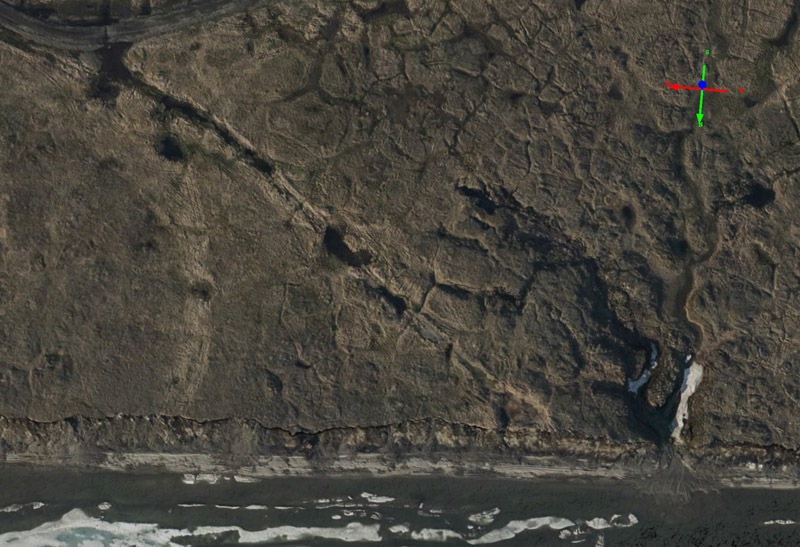
Here is the coastline of Barter Island in July. Mouse over to see it in September. Note the erosion of the bluffs at bottom. Also, you can see a road wash-out repaired with a culvert at upper left. The apparent misalignment between images is caused by the difference in shadow direction; put your finger on a feature and flicker to verify.
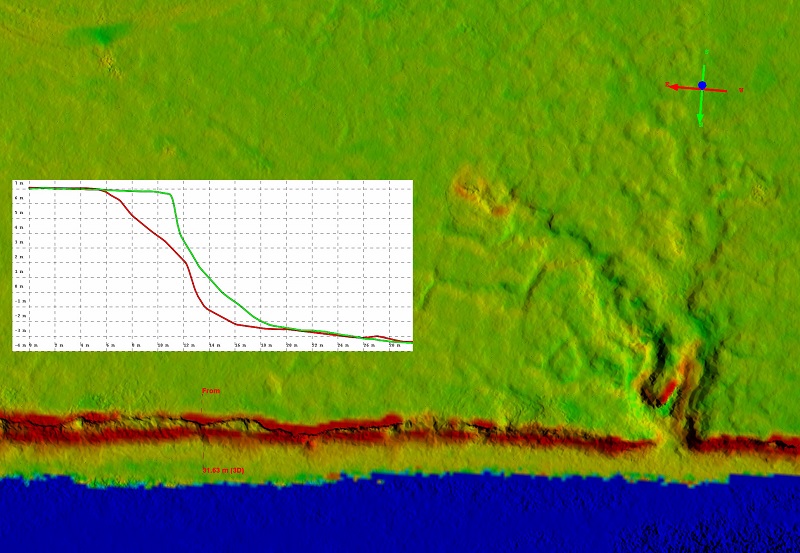
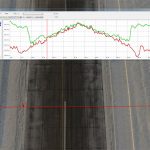
Here is the same area as above but as a difference image. The yellow-green color means no change, red is up to 2.5 meters of elevation loss. Mouse-over to see the July image. The bright red areas along the coast are where the bluffs fell into the ocean. The inset shows a transect of elevations from the bluff to the water, where green is September topography, red is July topography, vertical ticks are 1 meter and horizontal ticks are 2 meters. Note the bluff-surface and beach match to within +/- 5 cm. The headwalls are steeper in July because they are frozen, once they start to melt they slump off, and the toe is washed away by waves. Note also the roadwork in upper left and the thermal erosion of the gully at right.
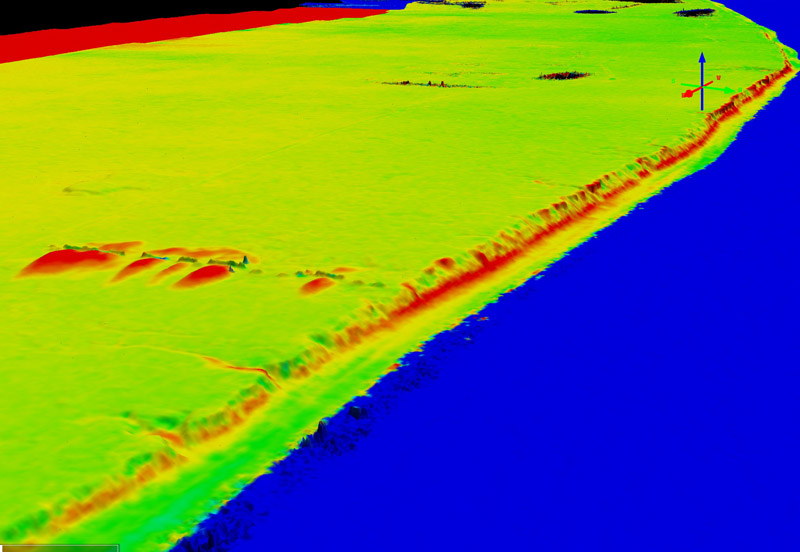
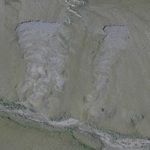
Here is another view of the coastline as a difference image. The main point here is that the tundra surface and surf line show no change — no ramps or warps existed in either of the Fodar™ DEMs used to make this difference image. Mouse-over to see the July image. Whether coastal erosion or erosion by some other process, Fodar can detect change at the centimeter level as often as the situation requires.